
Abstract
The mechanisms by which cigarette smoke condensate (CSC) disrupts F-actin and decreases cell motility in human bronchial (BEAS-2B) cells were assessed. The hypothesis that CSC activated focal adhesion kinase (FAK), mitogen-activated protein kinases (MAPKs), and paxillin in BEAS-2B cells was tested. When BEAS-2B cells were treated with 20 to 100 μg/mL CSC for 1 hour, FAK increased. The CSC caused F-actin disruption, while FAK inhibition alone caused actin aggregates to collapse to the cell periphery, but FAK inhibition combined with CSC caused actin aggregates to distribute throughout the cells. The CSC treatment of BEAS-2B cells showed a dose-dependent increase in the activation of the MAPKs, c-Jun, JNK, ERK, p38, and heat shock protein 27 (Hsp27) and paxillin. Focal adhesion kinase phosphorylation inhibition combined with CSC treatment increased p38 and ERK at 1 hour and 24 hours along with decreased cell number and motility compared with CSC treatment alone. CSC exerts changes in BEAS-2B cells by altering morphology and activating MAPK pathways.
Introduction
Cigarette smoke condensate (CSC) alters normal cellular structure, thereby altering cell function through alterations in cell signaling pathways. 1 F-actin is a key cytoskeletal component that functions as a cellular sensor with reorganization and alterations in actin dynamics being a well-known consequence of signaling. 2 Cigarette smoke exposure of BEAS-2B human lung epithelial cells caused actin filaments to collapse into punctate actin spots sometimes located in the perinuclear area concurrent with increased cell attachment and decreased cell migration. 1 Tyrosine phosphorylation of the focal adhesion protein focal adhesion kinase (FAK) regulates actin polymerization and thereby cell function. FAK is a focal adhesion component involved in disease that is also a target of various toxins. 3 FAK is increased in multiple cancers including lung, breast, colon, prostate, and ovarian. 4 Tyrosine phosphorylation of FAK occurs in response to integrin clustering, 5 during focal adhesion formation and cell spreading. FAK is involved in multiple cellular functions including cell proliferation, adhesion, spreading, survival, motility, and invasion. 6 FAK phosphorylation can lead to the stimulation of cell-signaling cascade that ultimately activates the Ras/mitogen-activated protein kinase (MAPK)/ERK pathway. FAK activates ERK in pancreatic cancer cells. 7 The FAK also phosphorylates another focal adhesion protein paxillin. 8 Paxillin is implicated in non–small-cell lung cancer, metastatic prostate, and renal cancer. 9 ,10 Inhibition of FAK autophosphorylation by a small molecule inhibitor increased pancreatic cancer cell detachment and inhibited cell adhesion in a dose-dependent manner. Moreover, FAK inhibition caused human pancreatic tumor regression in vivo. 11
FAK often activates the MAPKs, such as ERK, p38, and JNK, where ERK, p38, and JNK are implicated in various disease processes. Stress stimuli activate p38 and JNK, while ERK helps regulate cell proliferation, differentiation, and survival, and inappropriate activation of ERK is a common occurrence in human cancers. Heat shock protein 27 (Hsp27) is activated by stresses such as toxicants and oxidative stress. Hsp27 is phosphorylated by p38 and inhibits actin polymerization and alters focal adhesions through FAK-dependent pathways. 12 Activation of JNK is primarily by cytokines and exposure to environmental stress. 13 Cigarette smoke can also decrease JNK protein in vivo. 14 CSC activated ERK1/2 in bronchial epithelial cells. 15 Sidestream cigarette smoke stimulated p38 phosphorylation concurrent with endothelial barrier integrity along with inducing endothelial cell permeability. 16 In rats, cigarette smoke activation of ERK1/2, p38, and JNK is associated with increases in norepinephrine and in left ventricle remodeling. 17
This study evaluated the effects of CSC on FAK, MAPKs, and paxillin. The hypothesis that CSC activates MAPKs and alters FAK protein activation was tested. Additionally, MAPKs and focal adhesion proteins were evaluated when FAK was inhibited and also when FAK was inhibited combined with cigarette smoke treatment. Similarly, the effects of treating with a toxin CSC alone or with simultaneously blocking FAK, a protein involved in disease and toxicity was evaluated.
Materials and Methods
Cells and Experimental Procedures
The immortalized human bronchial epithelial cell line BEAS-2B was obtained from ATCC (Manassas, Virginia) and cultured in BEGM media supplemented with BEGM SingleQuots (Lonza, Walkersville, Maryland). Cells used in experiments were between passages 39 and 55.
All high content screening (HCS) assays in the present study were done at least in triplicate independently. The Cellomics HCS kit assays utilized 4 to 8 wells of cells per treatment group. Graphs represent the mean and standard deviation of these replicate wells.
Smoke Sample Preparation
Kentucky reference 2R4F cigarettes were smoked on an RM/CS (Borgwaldt Technik GmbH, Hamburg, Germany), 20-port rotary smoker under ISO smoking conditions (2 seconds draw, 1 minute puff interval, and a 35-mL puff volume). Briefly, smoke was drawn through a Cambridge filter pad. The Cambridge pad was extracted with dimethylsulfoxide (DMSO; Sigma, St Louis, Missouri) to give a final total particulate matter concentration of 40 mg/mL (w/v) of CSC. Aliquots of extracted condensate were stored frozen at −70°C until use.
Treatment With CSC and F-Actin Staining
BEAS-2B cells were plated onto Biocoat collagen I coated 96-well plates (Becton Dickinson, Bedford, Massachusetts) at 3000 cells per well and allowed to attach for 24 to 48 hours. Cells were left untreated (media controls) or treated with 20, 50, or 100 µg/mL CSC dissolved in 0.5% DMSO and diluted in the culture medium or treated with 0.5% DMSO in culture medium (vehicle controls) for 1 hour at 37°C. Some cells received either FAK inhibitor (1,2,4,5-benzenetetraamine, 4HCl, NSC 667249) alone (EMD, Calbiochem, Gibbstown, New Jersey) at 10 μmol/L or at a final concentration of 10 μmol/L FAK inhibitor in combination with 0.5% DMSO or CSC diluted in 0.5% DMSO. Following the treatment, cells were stained using reagents and protocols from a Cellomics Cytoskeletal Rearrangement HCS Reagent Kit (Thermo Fisher Scientific, Rockford, Illinois) in which cells are stained with a Dylight 554 nm conjugated phalloidin combined with 4′-6-diamidino-2-phenylindole (DAPI) and a whole cell stain after formaldehyde fixation, permeabilization, and blocking steps. Cells were observed and analyzed using a high-content analysis system (Cellomics Arrayscan VTI, Thermo Fisher Scientific, Pittsburgh, Pennsylvania), whereby cells are automatically imaged and analyzed using quantitative fluorescence microscopy. This instrument automatically focuses, exposes, and acquires images using bandpass emission filter and matched excitation filters selected for the fluorochromes used for each specific stain. For F-actin analysis, images were collected in 3 channels with the appropriate filter selected for the analysis of each fluorochrome. Channel 1 was used for the whole cell stain employing fluorescein isothiocyanate label, channel 2 for nuclear labeling (DAPI stain), and channel 3 using tetramethylrhodamine isothiocyanate for F-actin labeling. Channel 2 was used to establish the plane of focus for the cells, channel 1 was used to determine the edge of the cells, while channel 3 was used to identify actin filaments.
Staining of FAK and Paxillin
BEAS-2B cells were treated as described above, and after staining, using the Cytoskeletal Rearrangement Kit described above and 2 rinses with Dulbecco phosphate-buffered saline (DPBS; Thermo Fisher Scientific), the cells were stained for either tyrosine-phosphorylated FAK or phosphorylated paxillin as described below. Cells were incubated at room temperature with an anti-FAK Y397 monoclonal IgG antibody (Millipore, Billerica, Massachusetts) at 1:45 dilution or anti-phospho-paxillin polyclonal antibody Y118 (Invitrogen, Carlsbad, California) at 1:1000 dilution for 1 hour in blocking solution of 0.5% bovine serum albumin and 0.5% nonfat dried milk. Following brief rinses with DPBS, cells were stained for 1 hour at room temperature with a 1:300 dilution of goat anti-mouse IgG or goat anti-rabbit Dylight 649-conjugated secondary antibody (Thermo Fisher Scientific). Following 3 rinses with DPBS, cells were left in DPBS and observed and analyzed with a Cellomics Arrayscan VTI and Morphology Explorer Bioapplication using a 20× objective. For this analysis, channels 1 to 3 were as described above for F-actin but either phosphorylated FAK or phosphorylated paxillin was added as channel 4. Ultimately, this analysis reports the average intensity of fluorescently labeled “spots” of phosphorylated FAK or phosphorylated paxillin within the cells, which is then averaged over all the analyzed cells in the well. A sufficient number of fields were imaged and analyzed to collect data from at least 400 cells per well and the mean and standard deviation among the replicate wells were calculated.
ERK, p38, JNK, c-Jun, Hsp27, pHsp27, and Caspase 3
BEAS-2B cells were plated at 10 000 cells per well onto Biocoat collagen I coated 96-well plates and allowed to attach for 24 to 48 hours and treated as described above for F-actin staining for 1 hour or 24 hours. Cells were stained using Cellomics Reagent Hit Kits for pJun, pJNK, pERK, phospho-p38 (T180/Y182), pHsp27, Hsp27, and caspase 3 (Thermo Fisher Pierce) and observed and analyzed using a Cellomics Arrayscan VTI automated fluorescence microscope. Nuclear size and cell number was reported in channel 1 as an analyzed Hoechst stain. Channel 2 analyzed the labeled protein and used the Nuclear Translocation BioApplication for pJun, pJNK, ERK, or p38, while the Molecular Translocation BioApplication was used for the analysis of channel 2 for Hsp27, pHsp27, and caspase 3.
Western Blots of Phosphorylated Paxillin and FAK
BEAS-2B cells were treated as described above for F-actin staining except that they were grown in collagen I coated T-75 flasks (Becton Dickinson). Cells were treated with 0.5% DMSO in culture medium (vehicle controls) for 1 hour at 37°C or with CSC doses prior to harvesting for protein lysates. Immunoblotting was performed using 20 µg of detergent-solubilized lysate proteins. The Kinetworks analysis involved resolution of proteins by sodium dodecyl sulfate–polyacrylamide gel electrophoresis and subsequent immunoblotting overnight at 4°C with 2 primary phospho-site-specific antibodies. Phosphorylated paxillin 1 (Y118) was obtained from Invitrogen and phosphorylated FAK (Y397) was obtained from Upstate Biotechnology Inc (Waltham, Massachusetts). Membranes were later rinsed with TBST buffer and then incubated with the relevant horseradish peroxidase-conjugated secondary antibody for 30 minutes at room temperature. The immunoblots were developed with enhanced chemiluminescence (ECL) Plus reagent (Amersham, Arlington Heights, Illinois), and the signals were captured by a Fluor-S MAX MultiImager and quantified as counts per minute (CPM) using Quantity One software (Bio-Rad, Hercules, California).
Cell Spreading and Cell Motility
Cell spreading analysis was performed using a Cellomics Cell Spreading HCS Reagent Kit (Thermo Fisher Scientific). BEAS-2B cells were plated at 6000 cells per well onto collagen coated 96-well plates (Becton Dickinson) allowed to attach for 2 hours and immediately treated for 3 hours with CSC as described above for F-actin evaluation then formaldehyde fixed, permeabilized, and stained with rhodamine-phalloidin and Hoechst dye. Analysis with the Cellomics Cell Spreading Bioapplication reported the mean cell colony nuclear area difference, which represents the cytoplasmic to nuclear area normalized per number of nuclei. For cell motility evaluation, 500 BEAS-2B cells per well were plated onto collagen coated 96-well plates prepared with a layer of blue fluorescent microspheres, using reagents and protocols from the Cellomics Cell Motility HCS Reagent Kit (Thermo Fisher Scientific). The assay is based on the visualization of trails made by live cells plated on a lawn of microscopic fluorescent beads. Cells were allowed to attach for 4 hours, then treated as described above for F-actin evaluation except that the treatment was for 18 hours. Following formaldehyde fixation, cells were permeabilized and stained with rhodamine-phalloidin. Analysis was performed with a Cellomics Arrayscan VTI using the Cell Motility BioApplication (Thermo Fisher Scientific) and a 5× objective with 50 objects minimum per well collected. In the cell motility assay, the size of the tracks generated by migrating cells was measured.
Statistical Analysis
Data were analyzed using Microsoft Excel software. Differences between the samples were tested using a 2-sided Student t test. P < .05 was considered statistically significant. Data are reported as mean values and standard deviation.
Results
Cigarette Smoke Condensate Activates FAK and Paxillin
Peripheral staining of tyrosine-phosphorylated (Y397) FAK increased with 20 and 50 μg/mL CSC treatment at 1 hour (Figure 1B and C) compared with DMSO (vehicle) control cells (Figure 1A) but decreased at 100 μg/mL CSC (Figure 1D), while FAK localized more extensively inside the cytoplasm and in the long filopodia. The obvious peripheral FAK staining in lamellipodia in vehicle control cells (Figure 1A) was more apparent and abundant with more abundant lamellipodia at the 20 and 50 μg/mL CSC dose (Figure 1B and C). Similarly, CSC treatment significantly increased tyrosine-phosphorylated (Y397) FAK at 20, 40, and 50 μg/mL CSC versus DMSO control when quantitated using Cellomics HCS (*P < .05; Figure 1E). Quantitation of Western blot (Figure 1F) also showed that tyrosine-phosphorylated (Y397) FAK increased at 20 and 40 μg/mL CSC versus DMSO control (Figure 1G). Phospho-paxillin (Y118) staining is localized to the cell periphery in DMSO (vehicle) control BEAS-2B cells (Figure 2A), while peripheral punctate staining becomes more apparent in cells treated with 20 and 40 μg/mL CSC (Figure 2B and C). Treatment with 100 μg/mL CSC causes phospho-paxillin to relocalize to the cytoplasm with some remaining peripheral staining (Figure 2D). Quantitation using Cellomics HCS showed that CSC treatment significantly increased paxillin phosphorylation at 50 and 100 μg/mL CSC versus DMSO control (*P < .05; Figure 2E). Western blot analysis showed that the CSC treatment increased paxillin phosphorylation at 20, 40, and 100 μg/mL CSC versus DMSO controls and FAK inhibition combined with 20 and 40 μg/mL CSC increased paxillin phosphorylation versus FAK inhibition with DMSO alone while 100 μg/mL CSC plus FAK inhibitor caused a decrease in paxillin phosphorylation (Figure 2F and G).
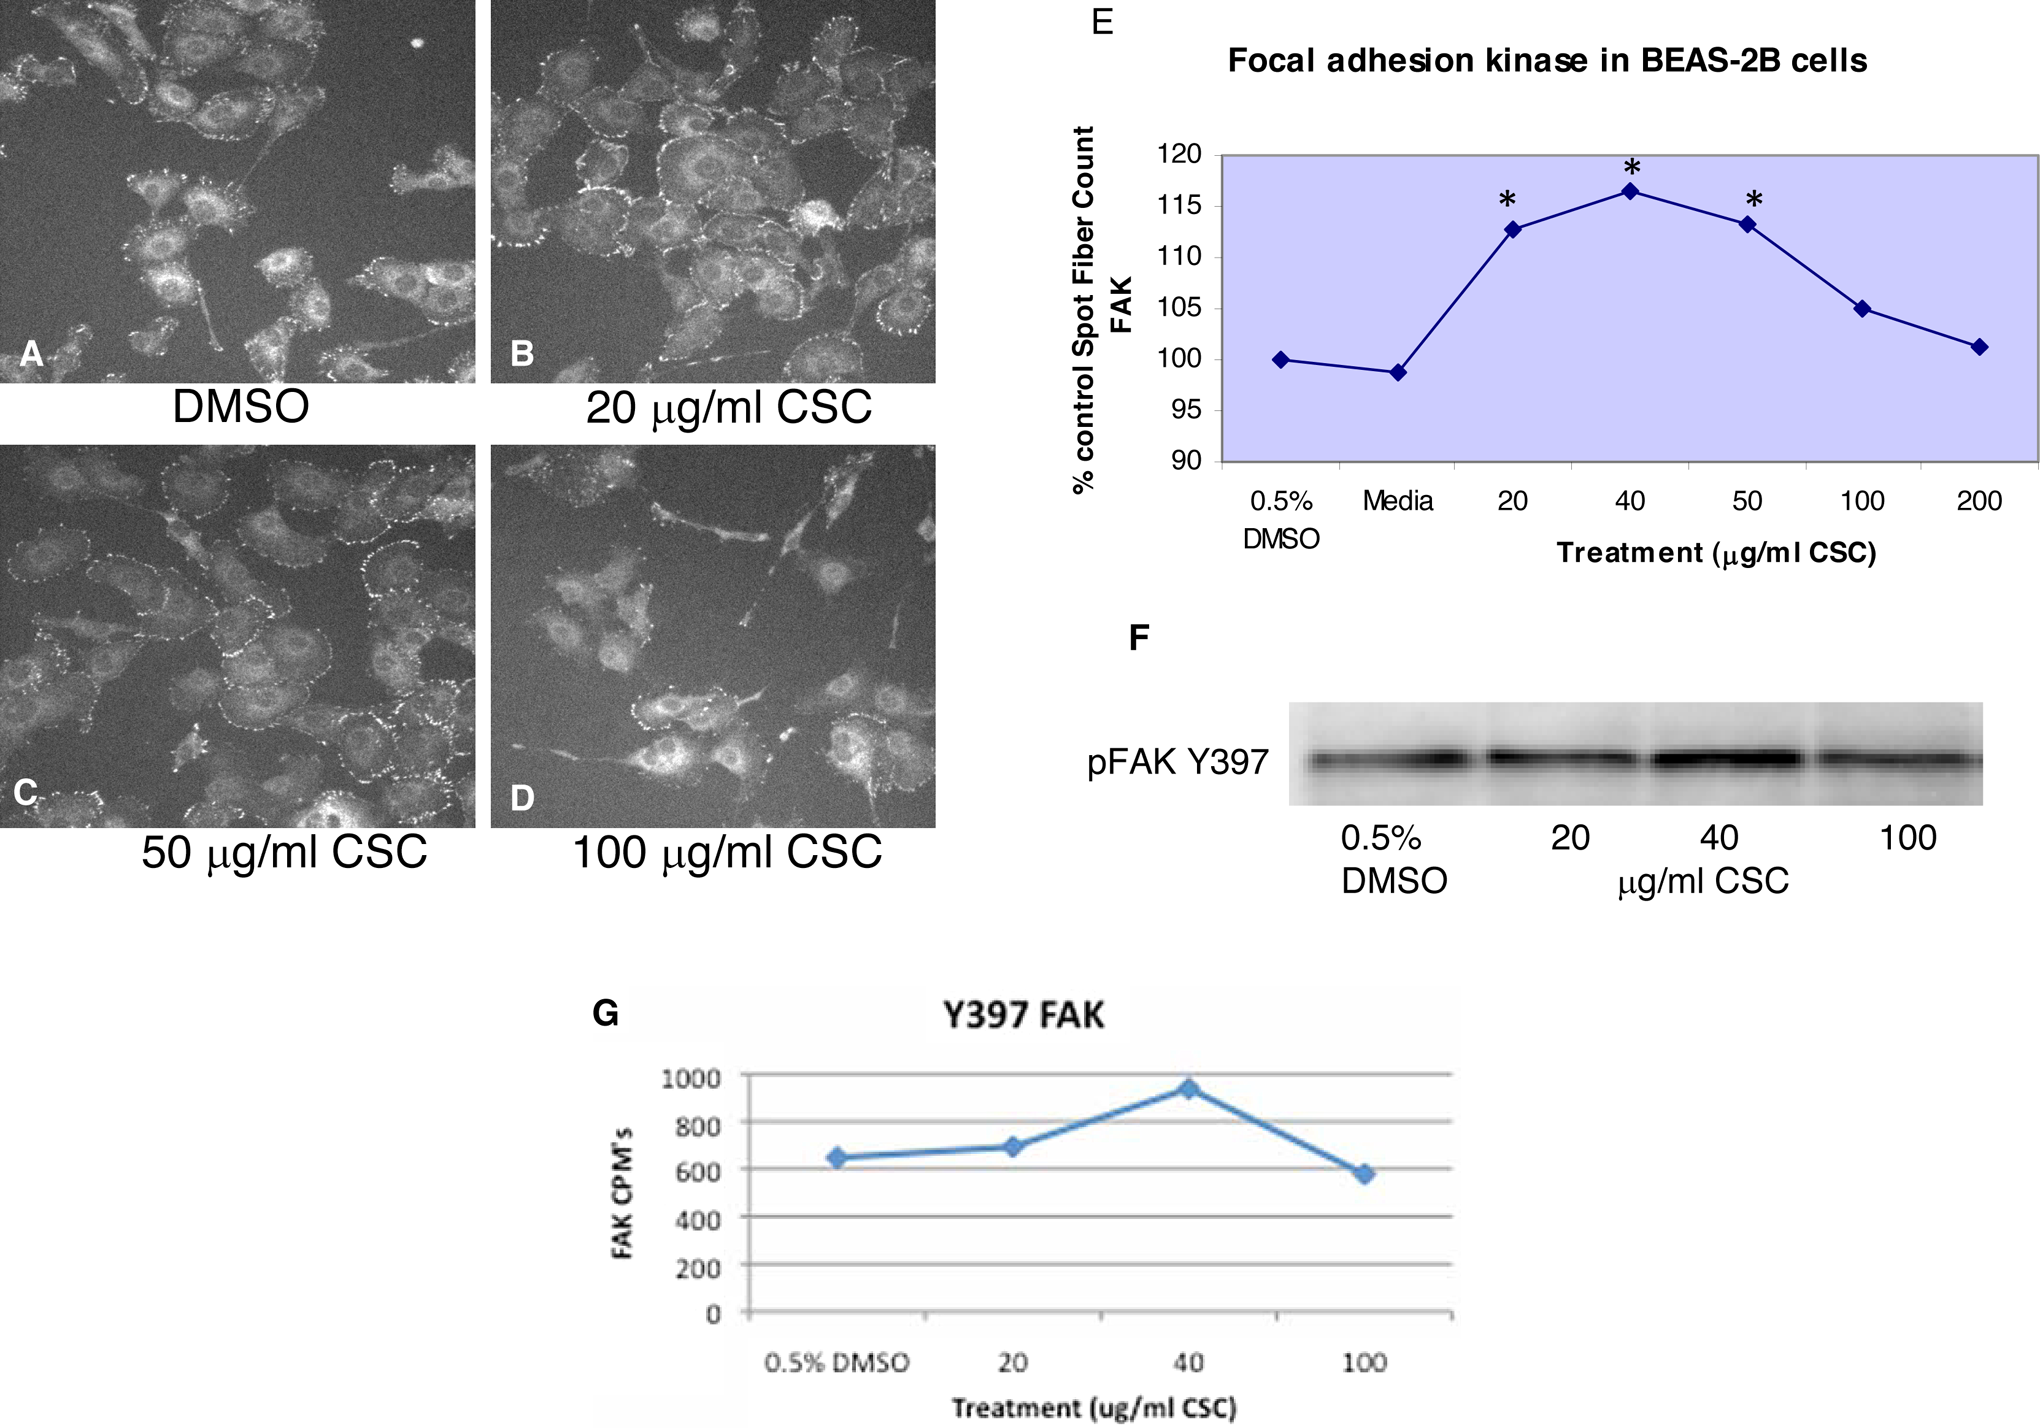
Peripheral staining of tyrosine-phosphorylated FAK increases with 20 and 50 μg/mL CSC treatment (B, C) compared with the medium control cells (A) but decreases at 100 μg/mL CSC (D). E, Similarly, CSC treatment significantly increases tyrosine-phosphorylated (Y397) FAK staining at 20, 40, and 50 μg/mL CSC versus DMSO control, when quantitated using Cellomics high content screening (*P < .05). F, G, Further evaluation by Western blot again showed that CSC treatment increases tyrosine-phosphorylated (Y397) FAK at 20 and 40 μg/mL CSC versus DMSO control, while FAK phosphorylation (as CPM) decreased at 100 μg/mL CSC. Data are shown as percent control. FAK indicates focal adhesion kinase; CSC, cigarette smoke condensate; DMSO, dimethylsulfoxide; CPM: counts per minute.
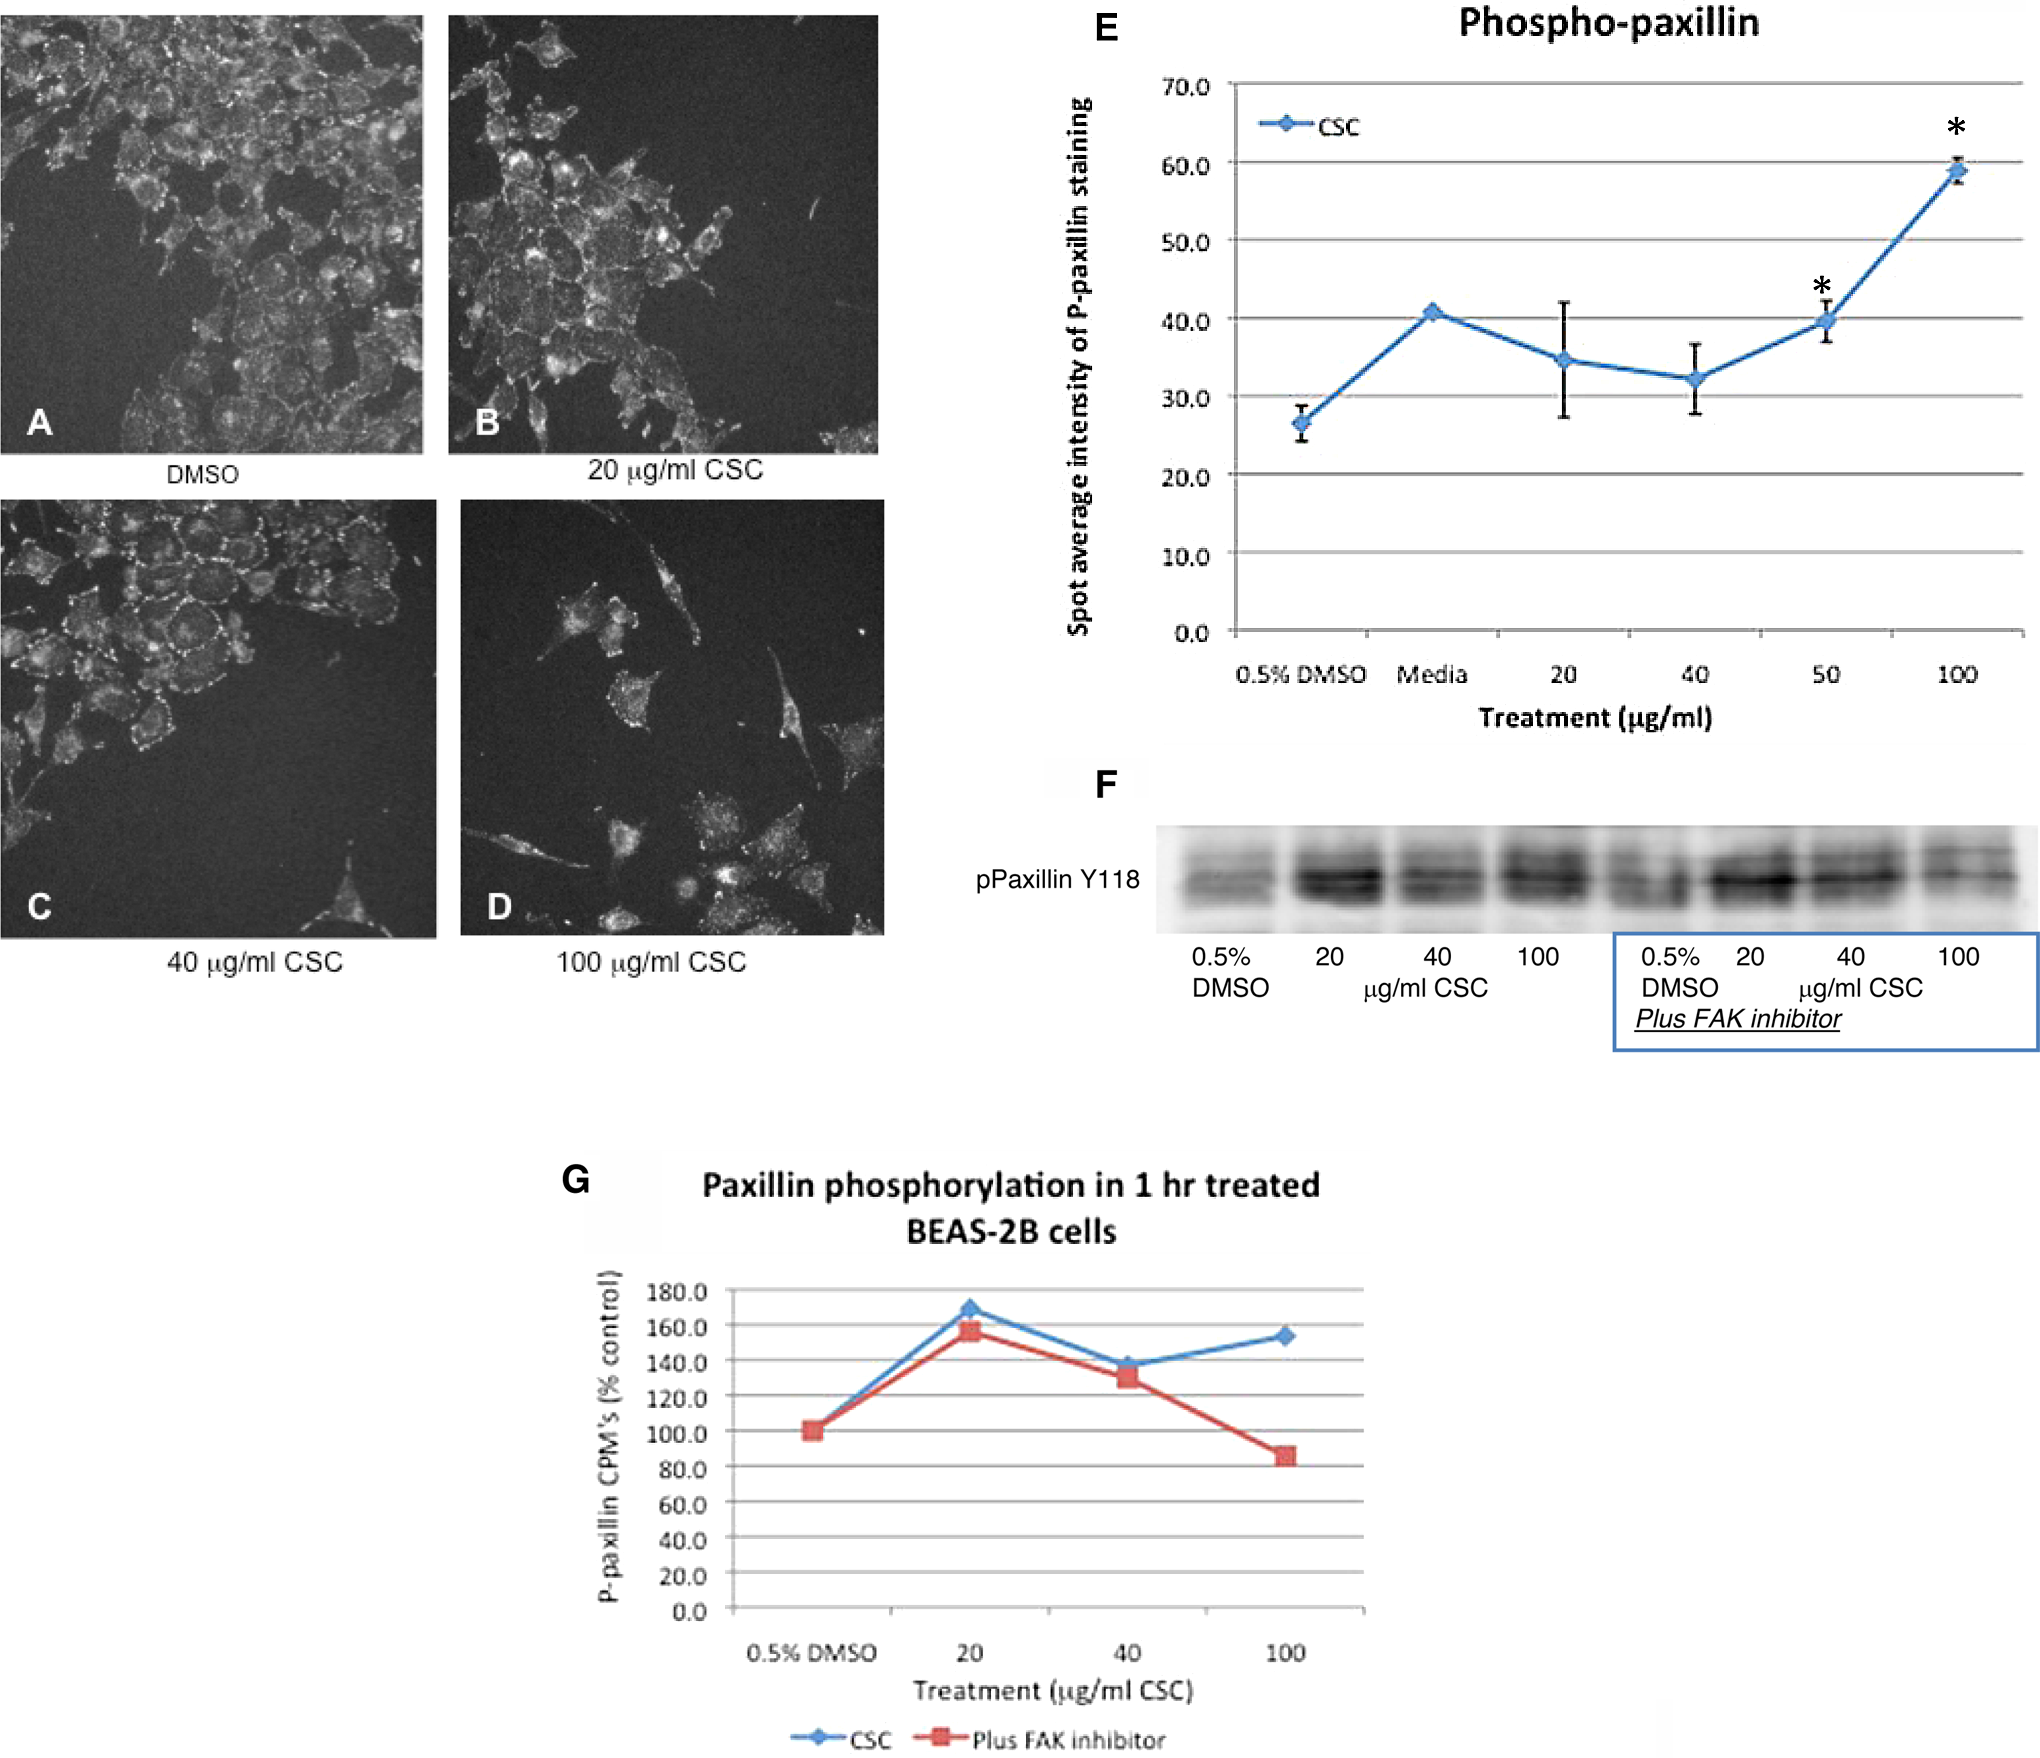
Phosphorylated paxillin (Y118) localizes to the cell periphery in DMSO vehicle control and with 20 and 40 μg/mL CSC treatment (A, B, C), with pronounced staining at the cell periphery at 40 μg/mL CSC (C). Treatment with 100 μg/mL CSC causes relocalization to the cell interior with some staining remaining at the cell periphery (D). E, CSC treatment significantly increases phosphorylated paxillin staining at 50 and 100 μg/mL CSC versus DMSO control when quantitated using Cellomics high content screening (*P < .05). F, G, Western blot evaluation shows that phosphorylated (Y118) paxillin is increased over DMSO controls with CSC treatment. When BEAS-2B cells are treated with a FAK inhibitor combined with 20 or 40 μg/mL CSC doses, phosphorylated paxillin (as CPM) is increased over DMSO controls. Western blot is a representative of 3 different experiments and is shown as percent control. FAK indicates focal adhesion kinase; CSC, cigarette smoke condensate; DMSO, dimethylsulfoxide; CPM: counts per minute.
F-Actin in BEAS-2B Cells Treated With CSC Alone or With FAK Inhibitor
BEAS-2B cells only exposed to media displayed scattered disrupted actin with occasional stress fibers (Figure 3A). F-actin staining in cell surface extensions especially lamellipodia was apparent. Treatment with FAK inhibitor for 1 hour caused F-actin to relocalize to the cell membrane and organized F-actin was absent (Figure 3B). Treatment with 50 μg/mL CSC for 1 hour caused F-actin to occur as disrupted aggregates with a few stress fibers remaining throughout the cells (Figure 3C). Figure 3D shows that the treatment with 50 μg/mL CSC plus FAK inhibitor for 1 hour caused F-actin to occur as disrupted aggregates in the cells with no apparent stress fibers and very limited staining at the cell periphery. This image shows a change in the FAK inhibitor effect alone induced by CSC.
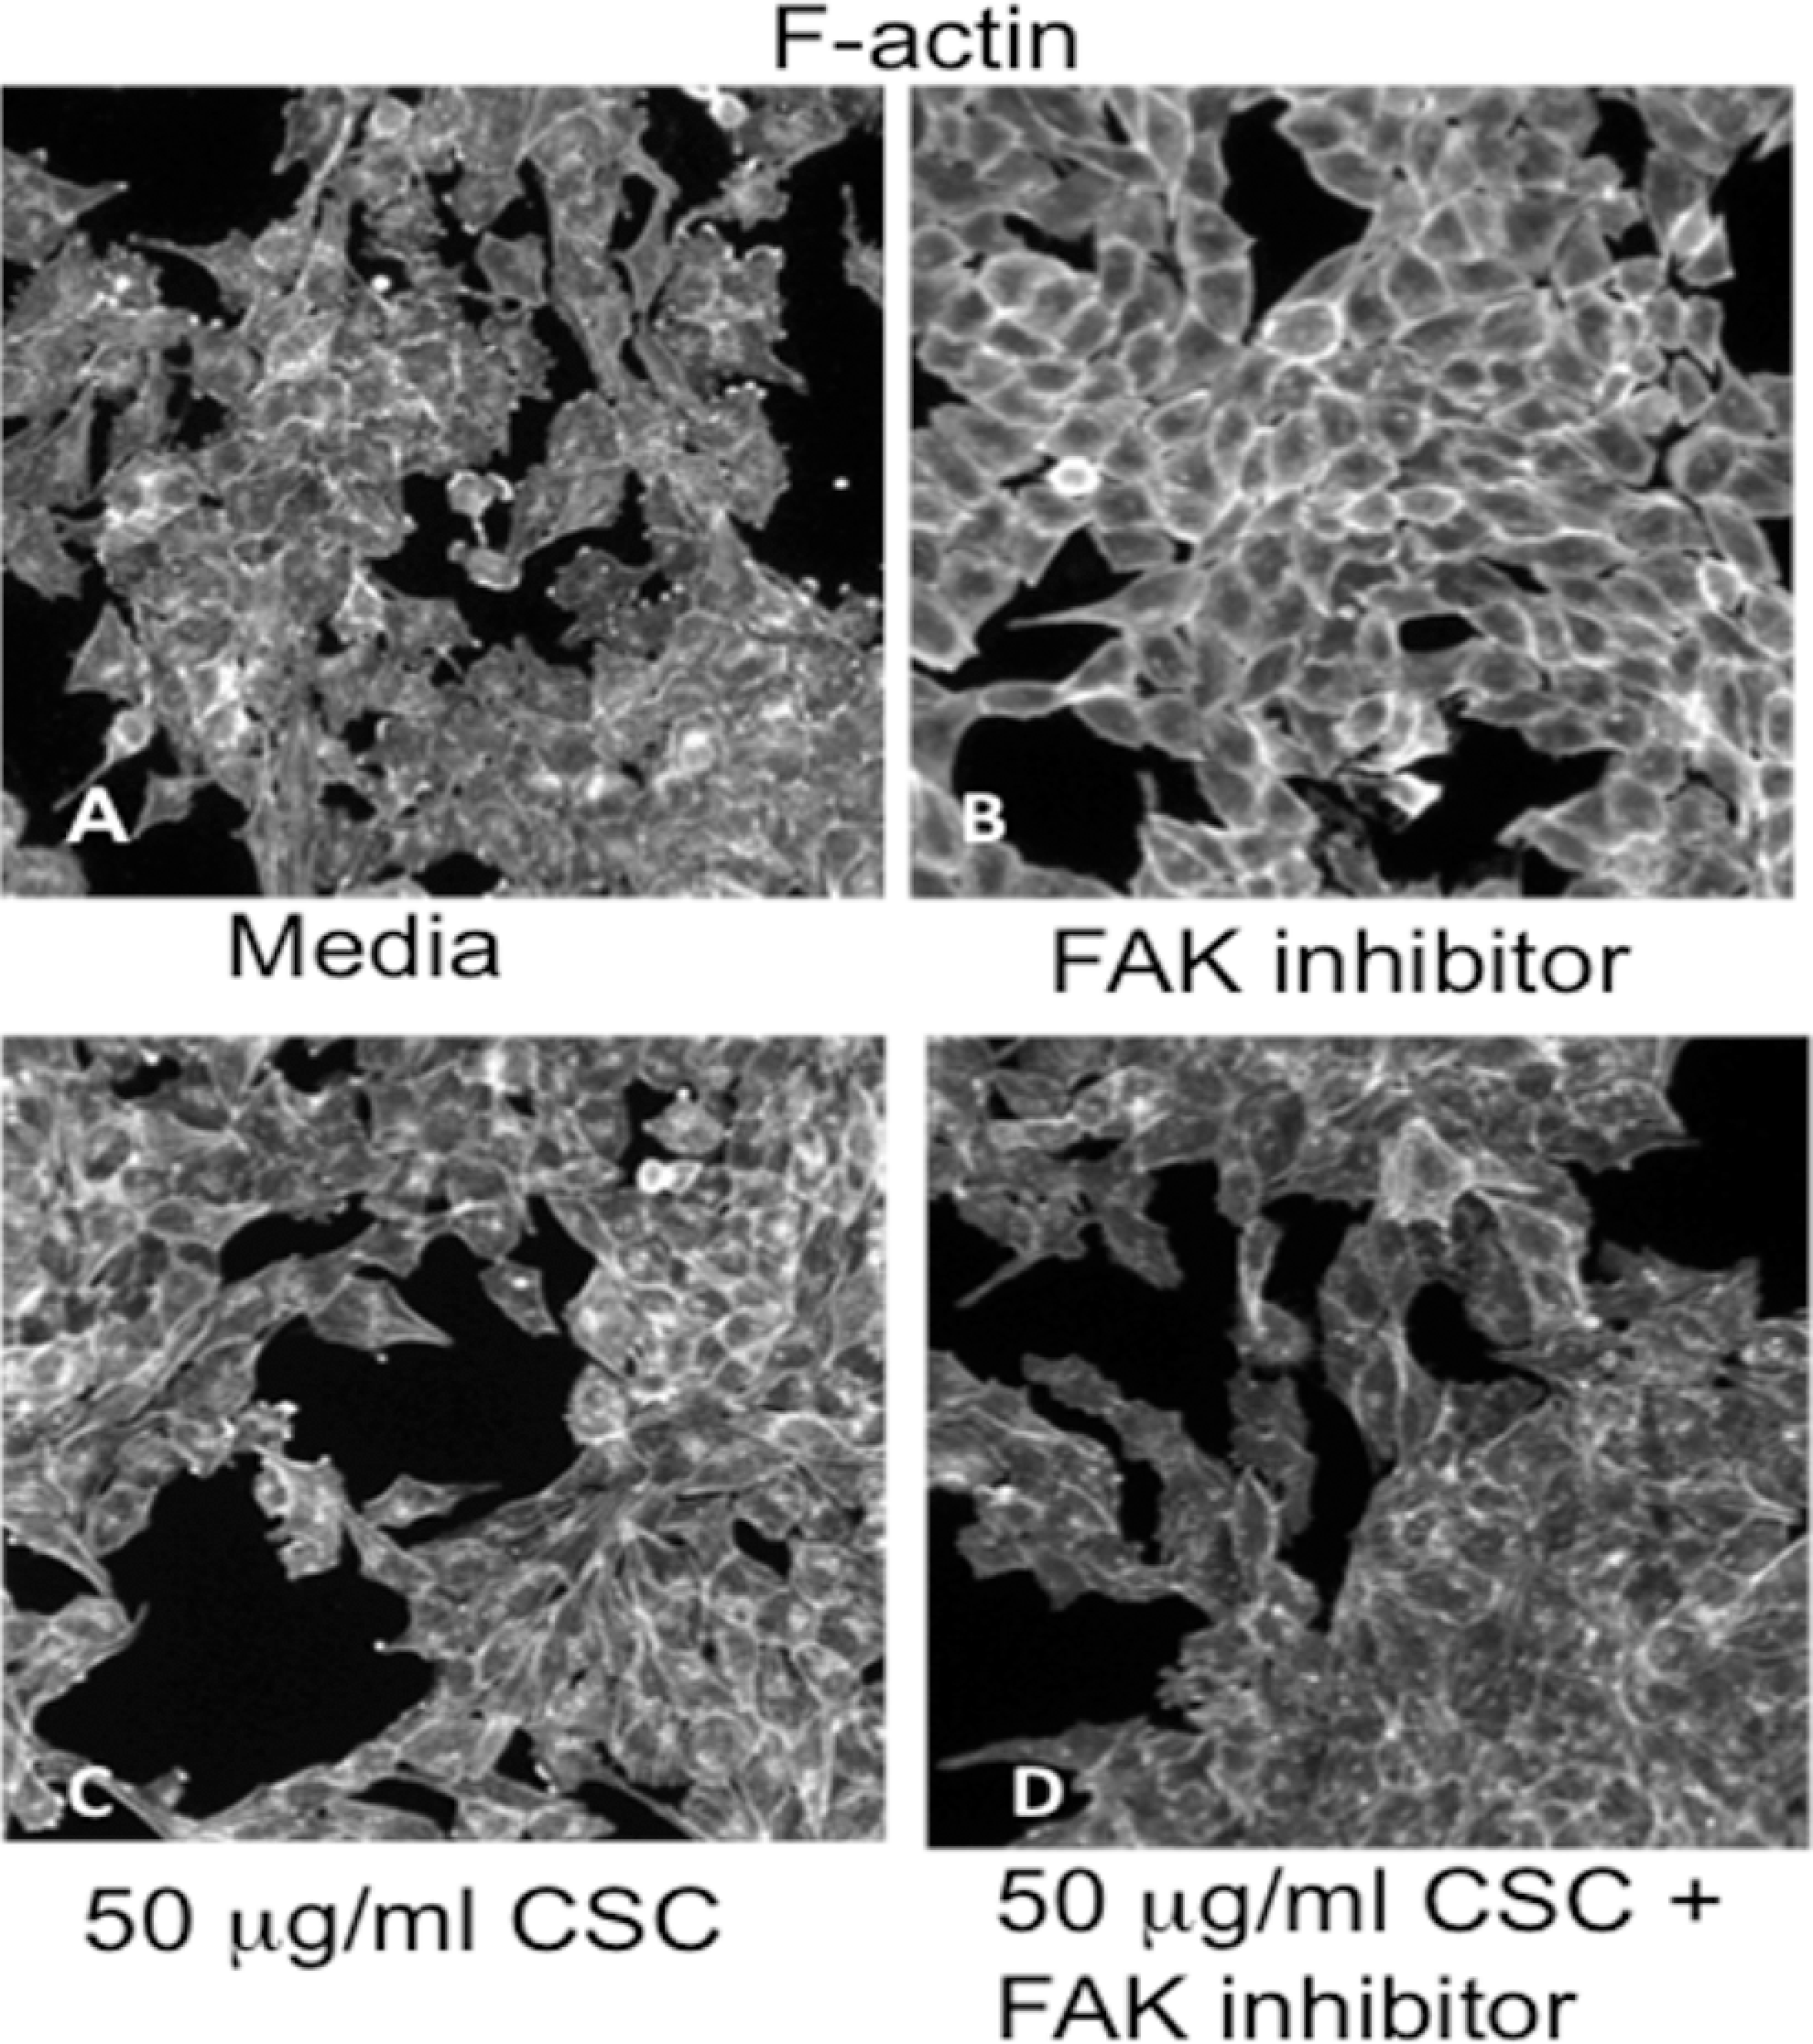
A, Media control cells display scattered disrupted actin with occasional stress fibers. F-actin staining in cell surface extensions especially lamellipodia is apparent. Treatment with FAK inhibitor causes the F-actin to relocalize to the cell membrane and organized F-actin is absent (B). Treatment with 50 μg/mL CSC causes F-actin to disappear from the cell surface extensions but continues to occur as disrupted spots with a few stress fibers (C). D, Figure shows that the treatment with 50 μg/mL CSC plus FAK inhibitor causes F-actin to occur as disrupted spots in the cells with no apparent stress fibers and very limited staining at the cell periphery. FAK indicates focal adhesion kinase; CSC, cigarette smoke condensate.
p38 and ERK in BEAS-2B Cells Treated With CSC Alone or With FAK Inhibitor
Treatment of BEAS-2B cells with increasing doses of CSC for 1 hour increased activated p38 and ERK concomitant with decreased nuclear size (Figure 4). Upon stimulation, ERK and p38 translocate to the nucleus. Figure 4 displays quantitation of activated p38, activated ERK, and nuclear size in BEAS-2B cells. Activated ERK and phosphorylated p38 increased at ≥40 μg/mL CSC versus DMSO controls (P < .05). When BEAS-2B cells were treated with increasing CSC doses combined with FAK inhibition, ERK was increased in a manner similar to CSC alone and phosphorylated p38 was increased with the only significant increase versus CSC alone at the 100 μg/mL CSC dose (data not shown).
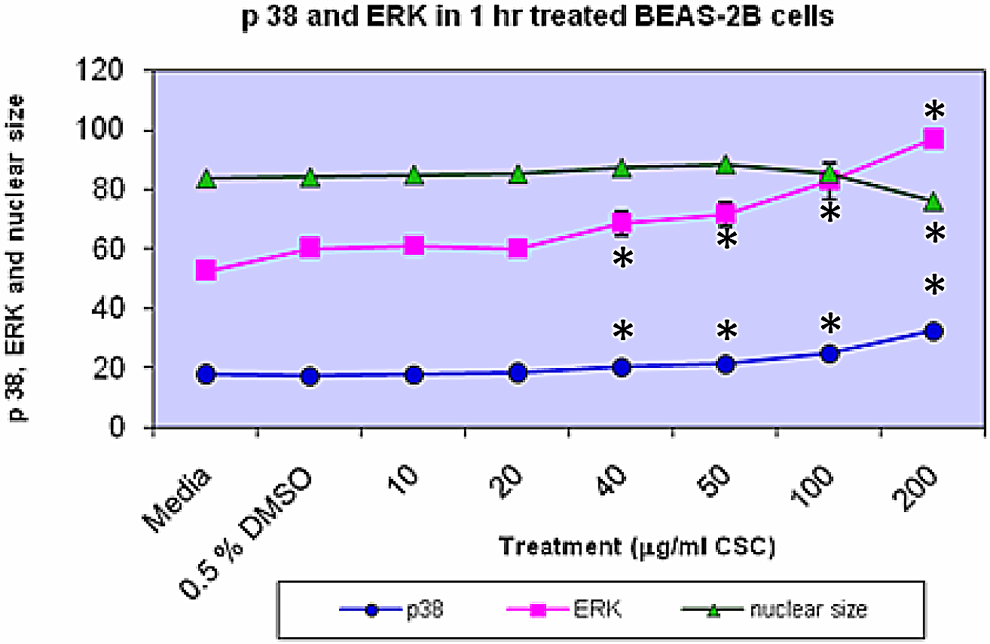
p38, ERK, and nuclear size in BEAS-2B cells. Treatment of BEAS-2B cells with increasing doses of CSC for 1 hour increases p38 and ERK concomitant with decreases in nuclear size. Increases in ERK and p38 occur at ≥40 μg/mL CSC versus DMSO controls, while there is a decrease in the nuclear size at 200 μg/mL CSC (*P < .05). Results are shown as mean ± SD, n = 3. CSC indicates cigarette smoke condensate; DMSO, dimethylsulfoxide; SD, standard deviation.
p-JNK, p-c-Jun, and Hsp27 in BEAS-2B Cells Treated With CSC Alone
Phosphorylated c-jun, pJNK, and nuclear size in BEAS-2B cells are shown in Figure 5. Treatment of BEAS-2B cells with increasing doses of CSC for 1 hour increased pJNK and p-c-Jun concomitant with decreased nuclear size. Increased p-c-Jun occurred at 200 μg/mL CSC versus DMSO controls (P < .05). Increased p-JNK occurred at ≥40 μg/mL CSC versus DMSO controls (P < .05). No difference was seen in the quantitation of p-c-jun and p-JNK, when BEAS-2B cells were treated with CSC doses combined with FAK inhibitor (data not shown). Treatment of BEAS-2B cells with increasing doses of CSC increased pHsp27 and total Hsp27 protein (Figure 6). Increased pHsp27 occurred at 200 μg/mL CSC versus DMSO controls and at 100 and 200 μg/mL CSC versus DMSO controls for total Hsp27 protein (P < .05).
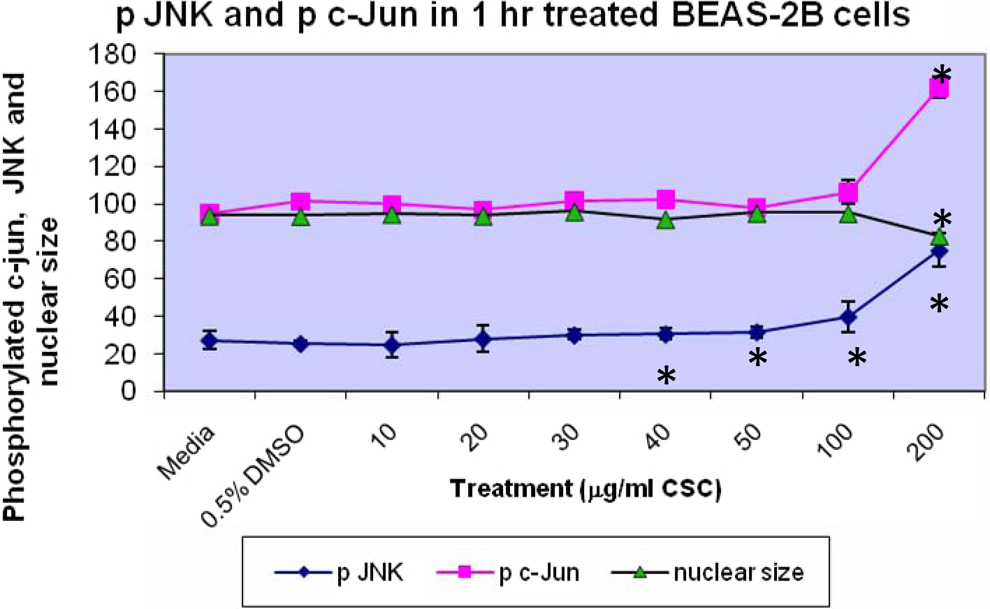
Phosphorylated c-jun, JNK, and nuclear size in BEAS-2B cells. Treatment of BEAS-2B cells with increasing doses of CSC increased p-JNK and p-c-Jun concomitant with decreases in nuclear size. Increases in p c-Jun occurred at 200 μg/mL CSC versus DMSO controls (*P < .05). Increases in p-JNK occurred at ≥40 μg/mL CSC versus DMSO controls (*P < .05), while decreases in nuclear size occurred at 200 μg/mL CSC versus DMSO controls (*P < .05). Results are shown as mean ± SD, n = 3. CSC indicates cigarette smoke condensate; DMSO, dimethylsulfoxide; SD, standard deviation.
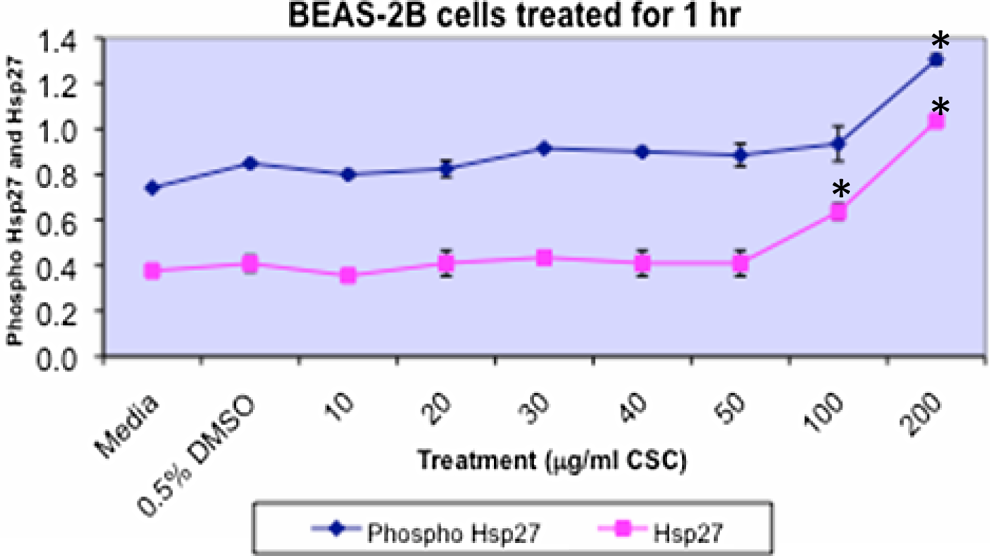
Treatment of BEAS-2B cells with increasing doses of CSC increases pHsp27 and total Hsp27 proteins. Increases in pHsp27 occur at 200 μg/mL CSC versus DMSO controls and at 100 μg/mL and 200 mg/mL CSC versus DMSO controls for total Hsp protein (*P < .05). Results are shown as mean ± SD, n = 3. CSC indicates cigarette smoke condensate; DMSO, dimethylsulfoxide; SD, standard deviation.
Changes at 24 Hours in BEAS-2B Cells Treated With CSC Alone or With FAK Inhibitor
BEAS-2B cells treated for 24 hours with CSC alone or FAK inhibitor combined with CSC caused a significant decrease in cell number at doses ≥20 μg/mL CSC versus DMSO control and at doses ≥40 μg/mL CSC combined with FAK inhibitor compared with DMSO control (*P < .05; Figure 7A), while FAK inhibitor plus CSC caused a decrease in cell number at all doses except for the 50 μg/mL CSC dose when compared with CSC alone (P < .05; Figure 7A). There was a dose-dependent increase in nuclear size with CSC alone at doses ≥20 μg/mL CSC and with FAK inhibitor plus CSC with doses 40 and 50 μg/mL CSC compared with DMSO controls (P < .05; Figure 7B). ERK was increased with doses ≥40 μg/mL CSC alone or combined with FAK inhibitor (*P < .05; Figure 7C). Caspase 3 was significantly increased at 100 μg/mL CSC compared with DMSO controls (Figure 8), concurrent with a significant decrease in cell number with doses ≥20 μg/mL CSC (*P <.05; Figure 7A), while caspase 3 was significantly increased in CSC treatments plus FAK inhibitor at 100 μg/mL CSC versus control, concurrent with a significant decrease in cell number at doses ≥40 μg/mL CSC combined with FAK inhibitor compared with control (*P < .05; Figures 7A and 8).
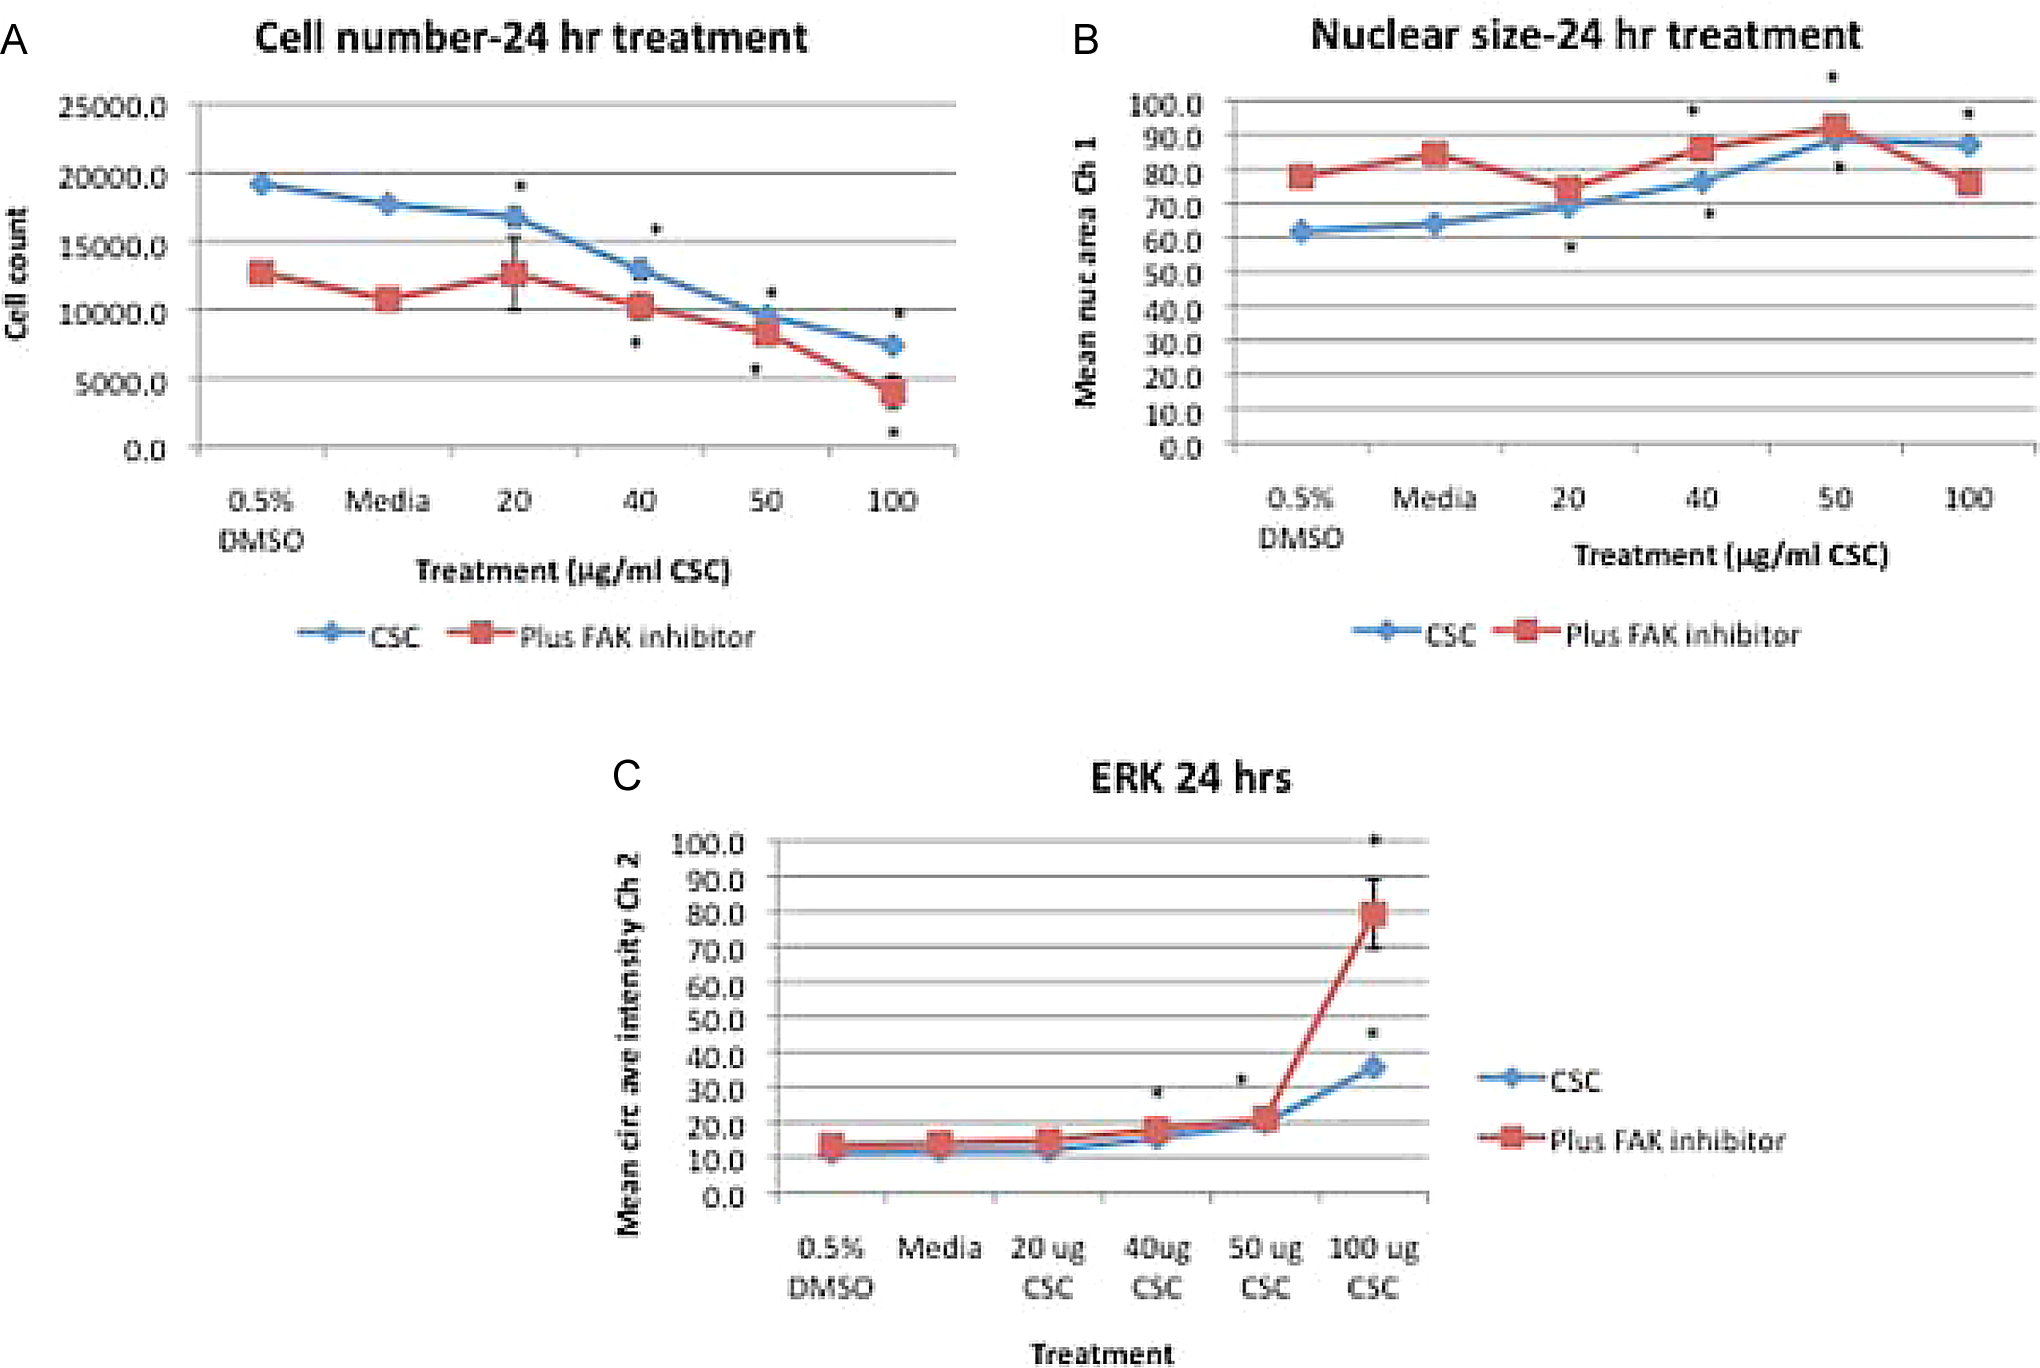
A, BEAS-2B cells treated for 24 hours with CSC alone or FAK inhibitor combined with CSC caused a significant decrease in cell number at the doses of ≥20 μg/mL CSC versus DMSO control and at ≥40 μg/mL CSC combined with FAK inhibitor compared with control (A; *P < .05), while FAK inhibitor plus CSC caused a cell number decrease at all doses except for the 50 μg/mL CSC dose when compared with CSC alone (A; P < .05). B, There was a dose-dependent increase in nuclear size with CSC alone at doses ≥20 μg/mL CSC and with FAK inhibitor plus CSC with doses of 40 and 50 μg/mL CSC compared with DMSO controls (*P < .05). C, ERK was increased with doses ≥40 μg/mL CSC alone or combined with FAK inhibitor (*P < .05). Results are shown as mean ± SD, n = 3. FAK indicates focal adhesion kinase; CSC, cigarette smoke condensate; DMSO, dimethylsulfoxide; SD, standard deviation.
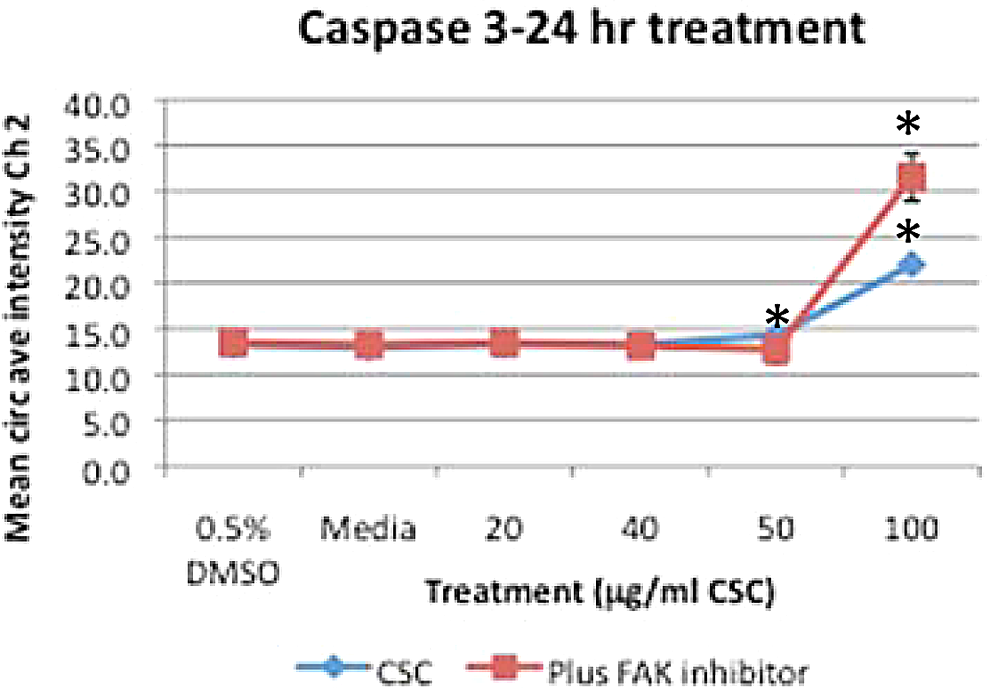
Treatment with CSC alone or CSC plus FAK inhibitor for 24 hours caused an increase in caspase 3 with 50 and 100 μg/mL CSC and 100 μg/mL CSC plus FAK inhibitor (*P < .05). Results are shown as mean ± SD, n = 3. FAK indicates focal adhesion kinase; CSC, cigarette smoke condensate; SD, standard deviation.
Changes in Cell Function in BEAS-2B Cells Treated With CSC Alone or With FAK Inhibitor
BEAS-2B cells treated with increasing doses of CSC alone or combined with FAK inhibitor display decreased cell spreading with statistically significant decreases at ≥20 μg/mL CSC (*P < .05; Figure 9). BEAS-2B cells treated with increasing doses of CSC display significantly decreased cell motility at ≥40 μg/mL CSC (*P < .05), while increasing doses of CSC combined with FAK inhibitor also display significantly decreased cell motility at ≥20 μg/mL CSC compared with DMSO controls (*P < .05; Figure 10). BEAS-2B cells concurrently treated with FAK inhibitor trend toward less cell motility than cells treated with CSC alone, with significant decreases in the motility occurring at the media, 20 μg/mL CSC and 40 μg/mL CSC plus FAK inhibitor (P < .05).
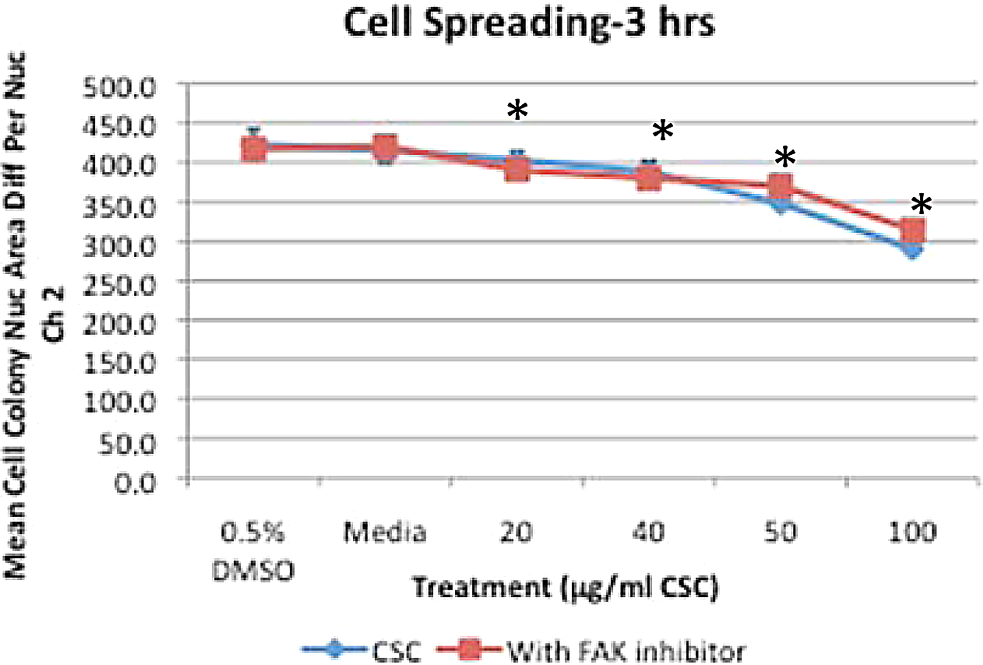
BEAS-2B cells treated with increasing doses of CSC alone or combined with FAK inhibitor display decreased cell spreading with statistically significant decreases at ≥20 μg/mL CSC compared with DMSO controls (*P < .05). Results are shown as mean ± SD, n = 3. FAK indicates focal adhesion kinase; CSC, cigarette smoke condensate; DMSO, dimethylsulfoxide; SD, standard deviation.
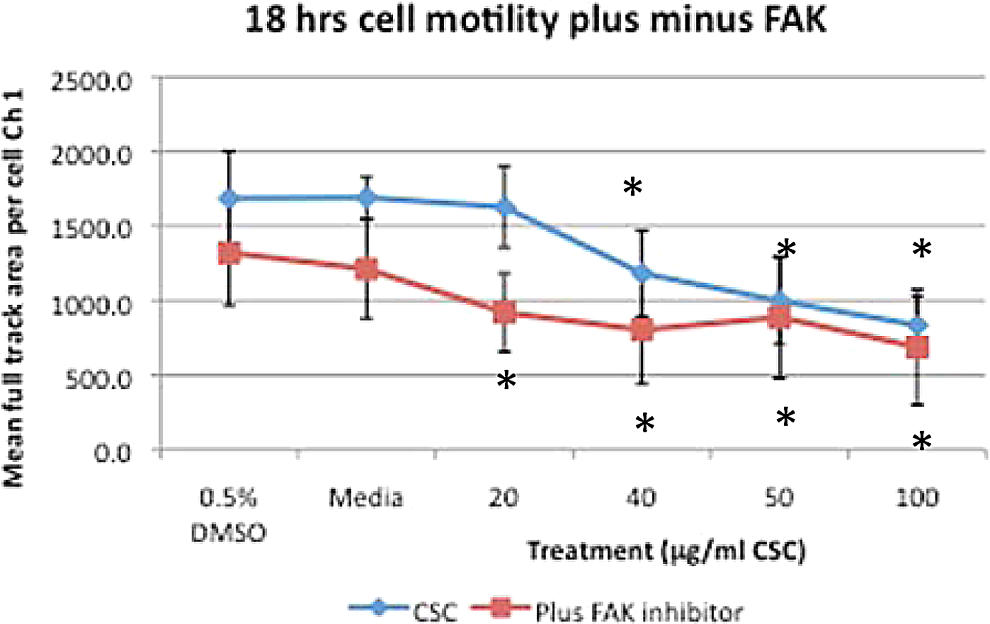
BEAS-2B cells treated with increasing doses of CSC alone or combined with FAK inhibitor display decreased cell motility. BEAS-2B cells treated with increasing doses of CSC display significantly decreased cell motility at ≥40 μg/mL CSC (*P < .05). while increasing doses of CSC combined with FAK inhibitor also display significantly decreased cell motility at ≥20 μg/mL CSC compared with DMSO controls (*P < .05). BEAS-2B cells concurrently treated with FAK inhibitor and CSC display less cell motility than cells treated with CSC alone, with significant decreases with media, 20 and 40 μg/mL CSC plus FAK inhibitor (P < .05). Results are shown as mean ± SD, n = 3. FAK indicates focal adhesion kinase; CSC, cigarette smoke condensate; DMSO, dimethylsulfoxide; SD, standard deviation.
Discussion
In this study, cigarette smoke activates disease pathways, disrupts F-actin, and makes cells less spread and less motile and induces cell death at higher doses. Previous work showed that the IC50 for CSC in BEAS-2B cells was 86 μg/mL for 1 hour and 19 μg/mL for 24 hours. 1 Exposure of corneal epithelial cells to second-hand smoke inhibited cell migration, actin reorganization, and phosphorylation of FAK. 18 CSC has been previously shown to cause actin filament disassembly into spot fibers. 1 FAK inhibition causes F-actin to localize only to the cell periphery but concurrent treatment of 50 μg/mL CSC changes this pattern to change to small, disrupted actin aggregates in the cells. This may be due to CSC-induced FAK activation. CSC plus FAK inhibition increases cell death and causes more pronounced decreases in cell motility. Activation of p38, ERK, and paxillin is associated with diseases such as cancer, but this activation correlates with increases in cell death in this study. This leads to the speculation that cells treated with designer drugs to inhibit FAK and exposed to toxins may be removed by apoptosis.
FAK regulates cell attachment to the substrate and multiple signaling pathways including the MAPKs. In this study, CSC activates FAK until a dose whereby cells die. While increasing doses of CSC cause Y397 FAK to increase then decrease at higher doses (100 μg/mL CSC), paxillin phosphorylation increases at 100 μg/mL CSC. When integrins bind to the extracellular matrix, they cluster on the cell surface resulting in the assembly of protein complexes, which include FAK, at these sites of adhesion. Cell adhesion induces FAK autophosphorylation at Y397, which creates docking sites for proteins with SH2 domains one of which is paxillin. 19 Increases in Y397 FAK shown in this article correlate well with increased adhesion of BEAS-2B cells at 20 to 40 μg/mL CSC described earlier, while decreases in FAK at higher CSC doses correlate with rounding of cells and lack of adhesion. 1 FAK signals to suppress anoikis using multiple pathways and distinct cell types use different subsets of these pathways. 20 Increases in paxillin at higher CSC doses may be due to the role of paxillin in survival signaling. Resistance to apoptosis occurred in vinculin-null cells because more paxillin was available for FAK phosphorylation 21 and paxillin is involved in apoptosis suppression. 20 Thus, phospho-paxillin may increase in BEAS-2B cells in the present study as Y397 FAK decreases in paxillin’s role to suppress apoptosis, but when FAK is inhibited combined with high-dose CSC treatment the cell detachment and apoptotic induction are too extensive for activated paxillin to engage in its role of apoptotic suppression. FAK phosphorylation caused apoptosis 22 and was also associated with increased cell adhesion and invasion. 23 Inhibition of FAK phosphorylation increased pancreatic cancer cell detachment and inhibited cell adhesion in a dose-dependent manner. 11 Other studies show that FAK inhibition inhibited cell adhesion in prostate and breast cancer cells and inhibited cell migration. 23 In A549 cells, activated FAK led to ERK1/2 activation, which could cause lung cancer metastatis. 4 The FAK inhibition by small interfering RNA caused inhibition of Src, ERK1/2, and PI3K activity in A549 cells. PND-1186 FAK inhibitor selectively promoted tumor cell apoptosis in 3-dimensional environments. 24 FAK and paxillin inhibited cell migration. 25 Similarly, in the present study, FAK and paxillin increases by CSC and are correlated with decreases in cell migration in BEAS-2B cells.
CSC activates p38 and ERK in BEAS-2B cells in the current study. Sidestream cigarette smoke stimulated p38 phosphorylation in human endothelial cells. 16 Increased p38 activation occurred in chronic obstructive pulmonary disease 26 and lung cancer stem cells. 27 p38 phosphorylates Hsp27. 28 Phosphorylation of Hsp27 and p38 activation were induced by airborne pollutant particulate matter. 29 Cigarette smoke activated ERK1/2 in human bronchial epithelial cells 15 and significantly increased phosphorylation of ERK1/2 in human aortic smooth muscle cells. 30 Thus, either smoke condensate or sidestream smoke activate p38, ERK1/2, and Hsp27.
CSC activates c-Jun and JNK in this study with 1 hour treatment. JNK is activated primarily by cytokines and exposure to environmental stress. 13 JNK plays a pro-oncogenic role possibly due to its ability to promote proliferation. 31 High concentrations of CSC inhibited cell proliferation of normal bronchial epithelial cells concurrent with the activation of p38 and JNK. 32 Cigarette smoke extract damaged vascular endothelial cells through the JNK pathway through oxidative stress pathways. 33 Smoke exposure increased levels of c-Jun in ferret lungs. 34 However, we have previously shown that rats exposed to cigarette smoke for a week show a decrease in JNK staining in bronchiolar epithelial cells and in macrophages of smoke-exposed tissues compared with controls. 14
FAK, ERK, and JNK can control phosphorylation of the focal adhesion protein paxillin. Paxillin is a substrate of several protein kinases such as Src, FAK, and JNK. Serine and threonine phosphorylation of paxillin appears to dictate its specific cellular activities. Paxillin is phosphorylated by FAK at Tyr118. 35 , 36 While paxillin interacts with FAK, FAK was not required for targeting paxillin to focal adhesions. 37 Paxillin is tyrosine-phosphorylated by FAK and Src upon integrin engagement or growth factor stimulation. Paxillin was increased in non–small-cell lung cancer. 10
FAK inhibition plus CSC treatment decreased cell number and cell motility and causes nuclear size increases at some doses. Increased ERK correlates with decreased cell number, increased nuclear size, and increased caspase 3. Increased nuclear size is consistent with apoptosis and correlates with an increase in caspase 3. Others have also shown that FAK inhibition decreased cell motility. 38
Anti-FAK drugs are being developed to treat diseases such as cancer, and consideration of the potential effects of these drugs on cells exposed to toxins should be evaluated. Potential resultant anoikisis or apoptosis may not be problematic, but reduced motility and hyperplasia could lead to disease. FAK is a target of certain toxicants and is also often increased in disease. A connection has even been established between adrenergic pathways and FAK activation in disease. Additionally, in rats, cigarette smoke activation of ERK1/2, p38, and JNK is associated with increases in norepinephrine. 17 Understanding more about the role of toxins in activating signaling pathways involved not only in the disease but also in the adrenergic stress response should contribute to increased understanding of environmental effects contributing to disease and better therapies for combating diseases.
Footnotes
Acknowledgments
The author thanks Litsa Blanis, Catherine Sutter, and Dr Stephen Pelech of Kinexus for their performance and quantitation of the Western blots. The helpful ideas and scientific discussion of Dr Bill Polk are much appreciated.
The author(s) declared no potential conflicts of interest with respect to the research, authorship, and/or publication of this article.
The author(s) received no financial support for the research, authorship, and/or publication of this article.