
Abstract
We developed a new end point of the mouse stem cell test (EST) for developmental neurotoxicity. We tested 2 developmental neurotoxicants, namely, lead (II) acetate and Aroclor 1254, using this EST. Our results showed that lead (II) acetate is nonembryotoxic, and Aroclor 1254 is weakly embryotoxic. To identify a new end point for developmental neurotoxicity, we used the default method of neuronal differentiation for D3 mouse embryonic stem cells with basic fibroblast growth factor (bFGF) and ascorbic acid. Flow cytometry and real-time polymerase chain reaction were used to quantify the inhibition of neuronal differentiation. Our results showed that both lead (II) acetate and Aroclor 1254 reduced the percentage of microtubule-associated protein 2 (MAP-2)-positive cells and the messenger RNA (mRNA) expression level of MAP-2 in a dose-dependent manner. These results suggested that these methods can be used to develop an additional end point of the EST for developmental neurotoxicity using default differentiation of mouse embryonic stem cells.
Keywords
Introduction
Among the many tissues and cells that have been tested for developing in vitro toxicity test methods, embryonic stem cells (ESCs) have the greatest capacity to differentiate into numerous cell types and to recapitulate the cellular developmental processes of early embryogenesis. As a result, many researchers are developing in vitro developmental toxicity tests using ESCs.1,2 Currently, the embryonic stem cell test (EST) is the only validated in vitro developmental toxicity test using ESCs. This assay is based on the capacity of murine ESCs to differentiate into a variety of cell types in vitro. The EST assesses the embryotoxic potential of chemicals according to their inhibitory effects on the differentiation of contracting myocardial cells, which can be detected by microscopy (Figure 1). As shown by a biostatistical model (Table 1), the accuracy of this assay (78%) is equal or greater than other in vitro embryotoxicity tests, such as the whole-embryo culture test and micromass test. In particular, the EST correctly predicted 100% of the strongly embryotoxic chemicals that were tested. 3 Although the EST is a reliable in vitro embryotoxicity test, it may not be useful for screening embryotoxic chemicals that affect differentiation into noncardiac tissues because the inhibition of cardiac differentiation is the only end point of differentiation in the EST. At the 2003 European Center for the Validation of Alternative Methods (ECVAM) workshop, it was suggested that additional important target tissues, such as nervous system and skeletal tissues, should be included in the EST to obtain more precise information about the teratogenic potential of chemicals.4,5 In addition, it was concluded that industrial chemicals and strongly embryotoxic chemicals with other toxicological mechanisms should be tested with the EST to enhance the reliability of the test. 6 To develop tissue-specific end points of the EST to accurately test a wide range of chemicals, various kinds of differentiation methods should be developed and optimized. Previously, zur Nieden et al reported molecular end points to identify the effects of chemicals on osteogenic, chondrogenic, and neural differentiation. 4 Recently, platelet endothelial cell adhesion molecule 1 (PECAM-1) and vascular endothelial (VE) cadherin were identified as molecular end points of endothelial differentiation of ESCs. 7 In addition, neurofilament 200 kDa and microtubule-associated protein 2 (MAP-2) were reported as neuronal differentiation end points.4,8 However, these end points of the EST have not been validated yet. In this study, we used 2 representative developmental neurotoxicants, lead (II) acetate and Aroclor 1254, to develop a new surrogate end point of the EST for developmental neurotoxicity.
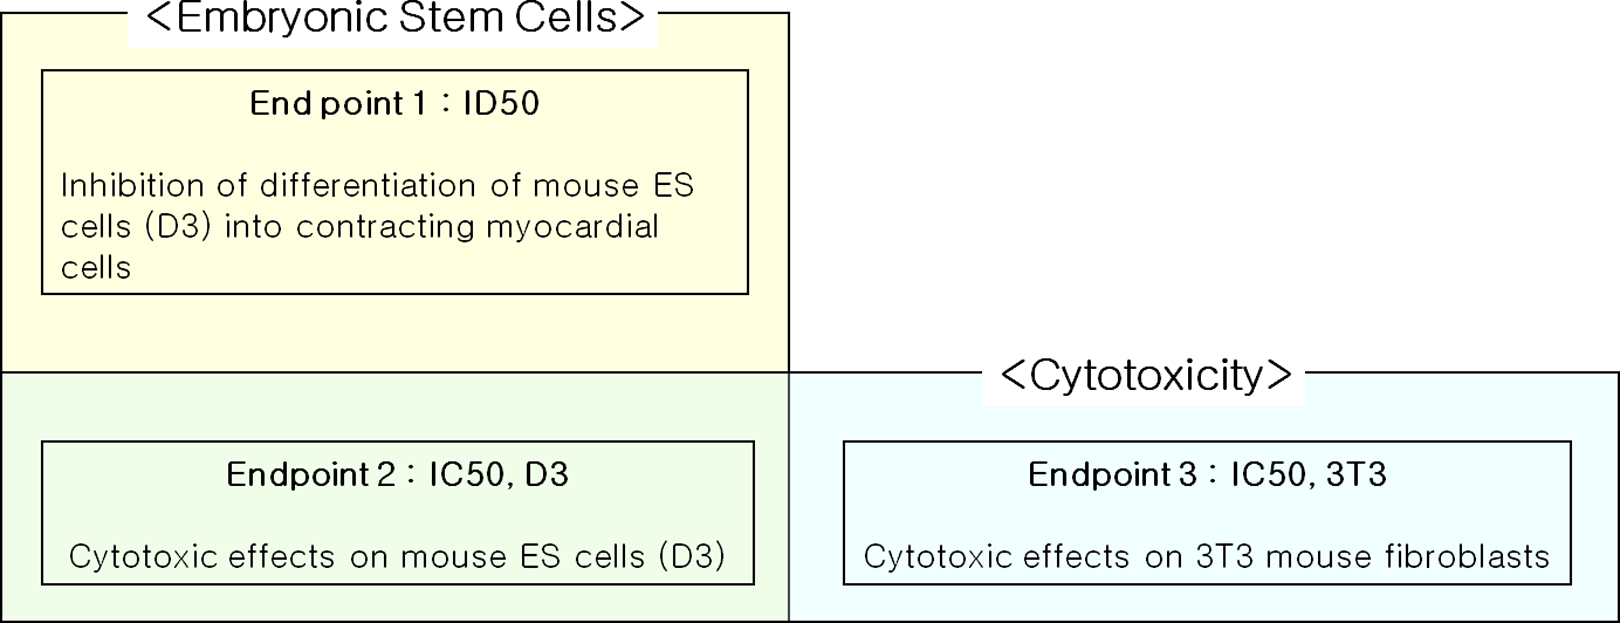
The end points of the embryonic stem cell test (EST) that was used to assess the embryotoxic potential of test compounds with 2 mouse cell lines, namely, 3T3 embryonic fibroblasts and D3 embryonic stem (ES-D3) cells.
The Prediction Model of the EST
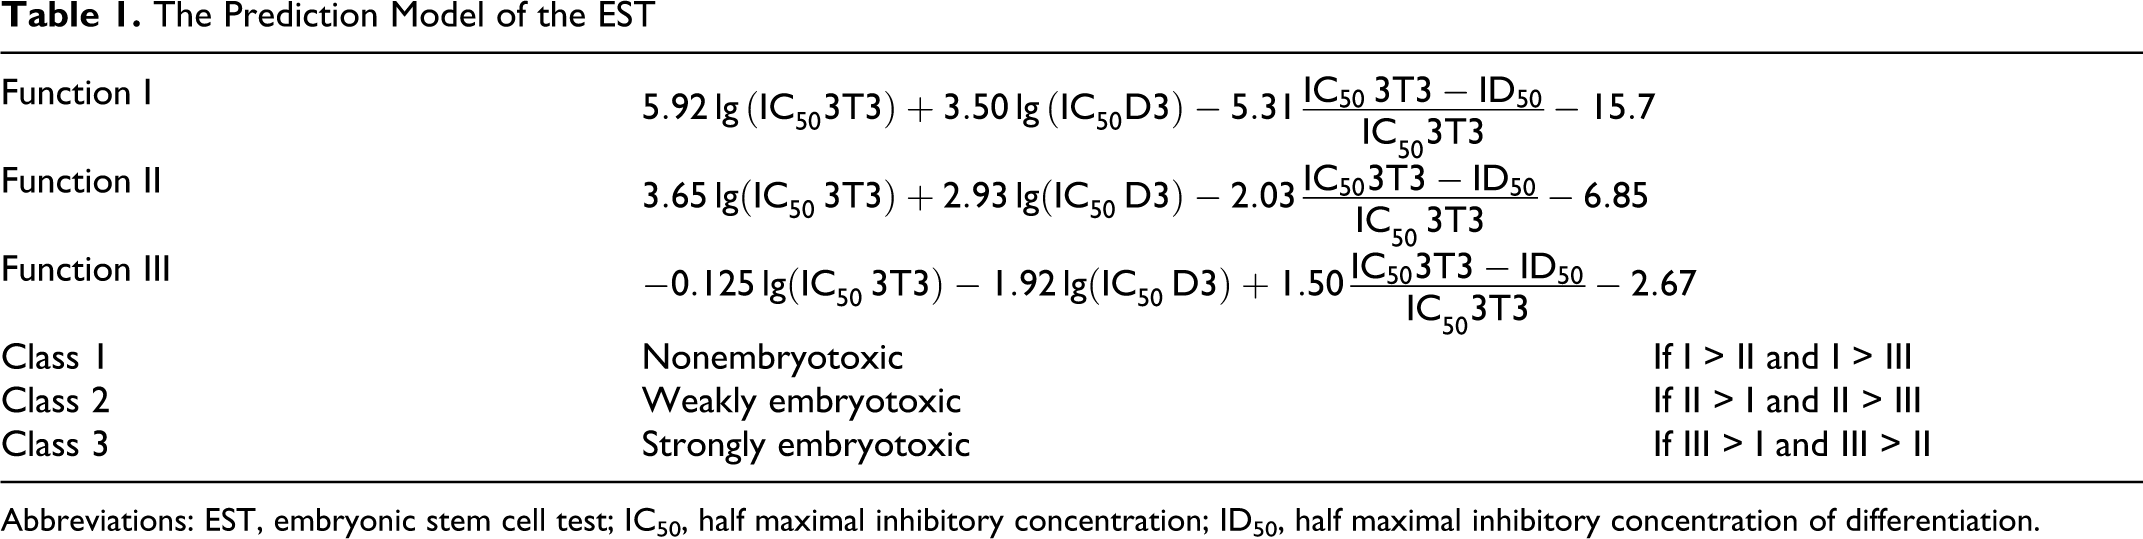
Abbreviations: EST, embryonic stem cell test; IC50, half maximal inhibitory concentration; ID50, half maximal inhibitory concentration of differentiation.
Lead is a ubiquitous toxic metal. The major health risk of lead is toxicity to the nervous system, and children, particularly toddlers and neonatal infants, are particularly susceptible. 9 Aroclor 1254, which is a mixture of polychlorinated biphenyls (PCBs), is one of the most widely used environmental chemicals. Infants are susceptible to Aroclor 1254 because it can be absorbed through the placenta and is found in breast milk. 10 Developmental exposure to PCBs can cause subtle behavioral and cognitive deficits, even at very low concentrations. 11 As a result, PCBs are model compounds for studying the mechanism of developmental neurotoxicity.
In this study, we determined the embryotoxicity of lead (II) acetate and Aroclor 1254 using the EST to determine whether the current end point can be used to identify developmental neurotoxicants. We also proposed a new surrogate end point for developmental neurotoxicity using flow cytometry and real-time polymerase chain reaction (RT-PCR) analysis of neuronal cells that were differentiated from mouse ESCs (mESCs) with an adherent monoculture differentiation method (Figure 2).
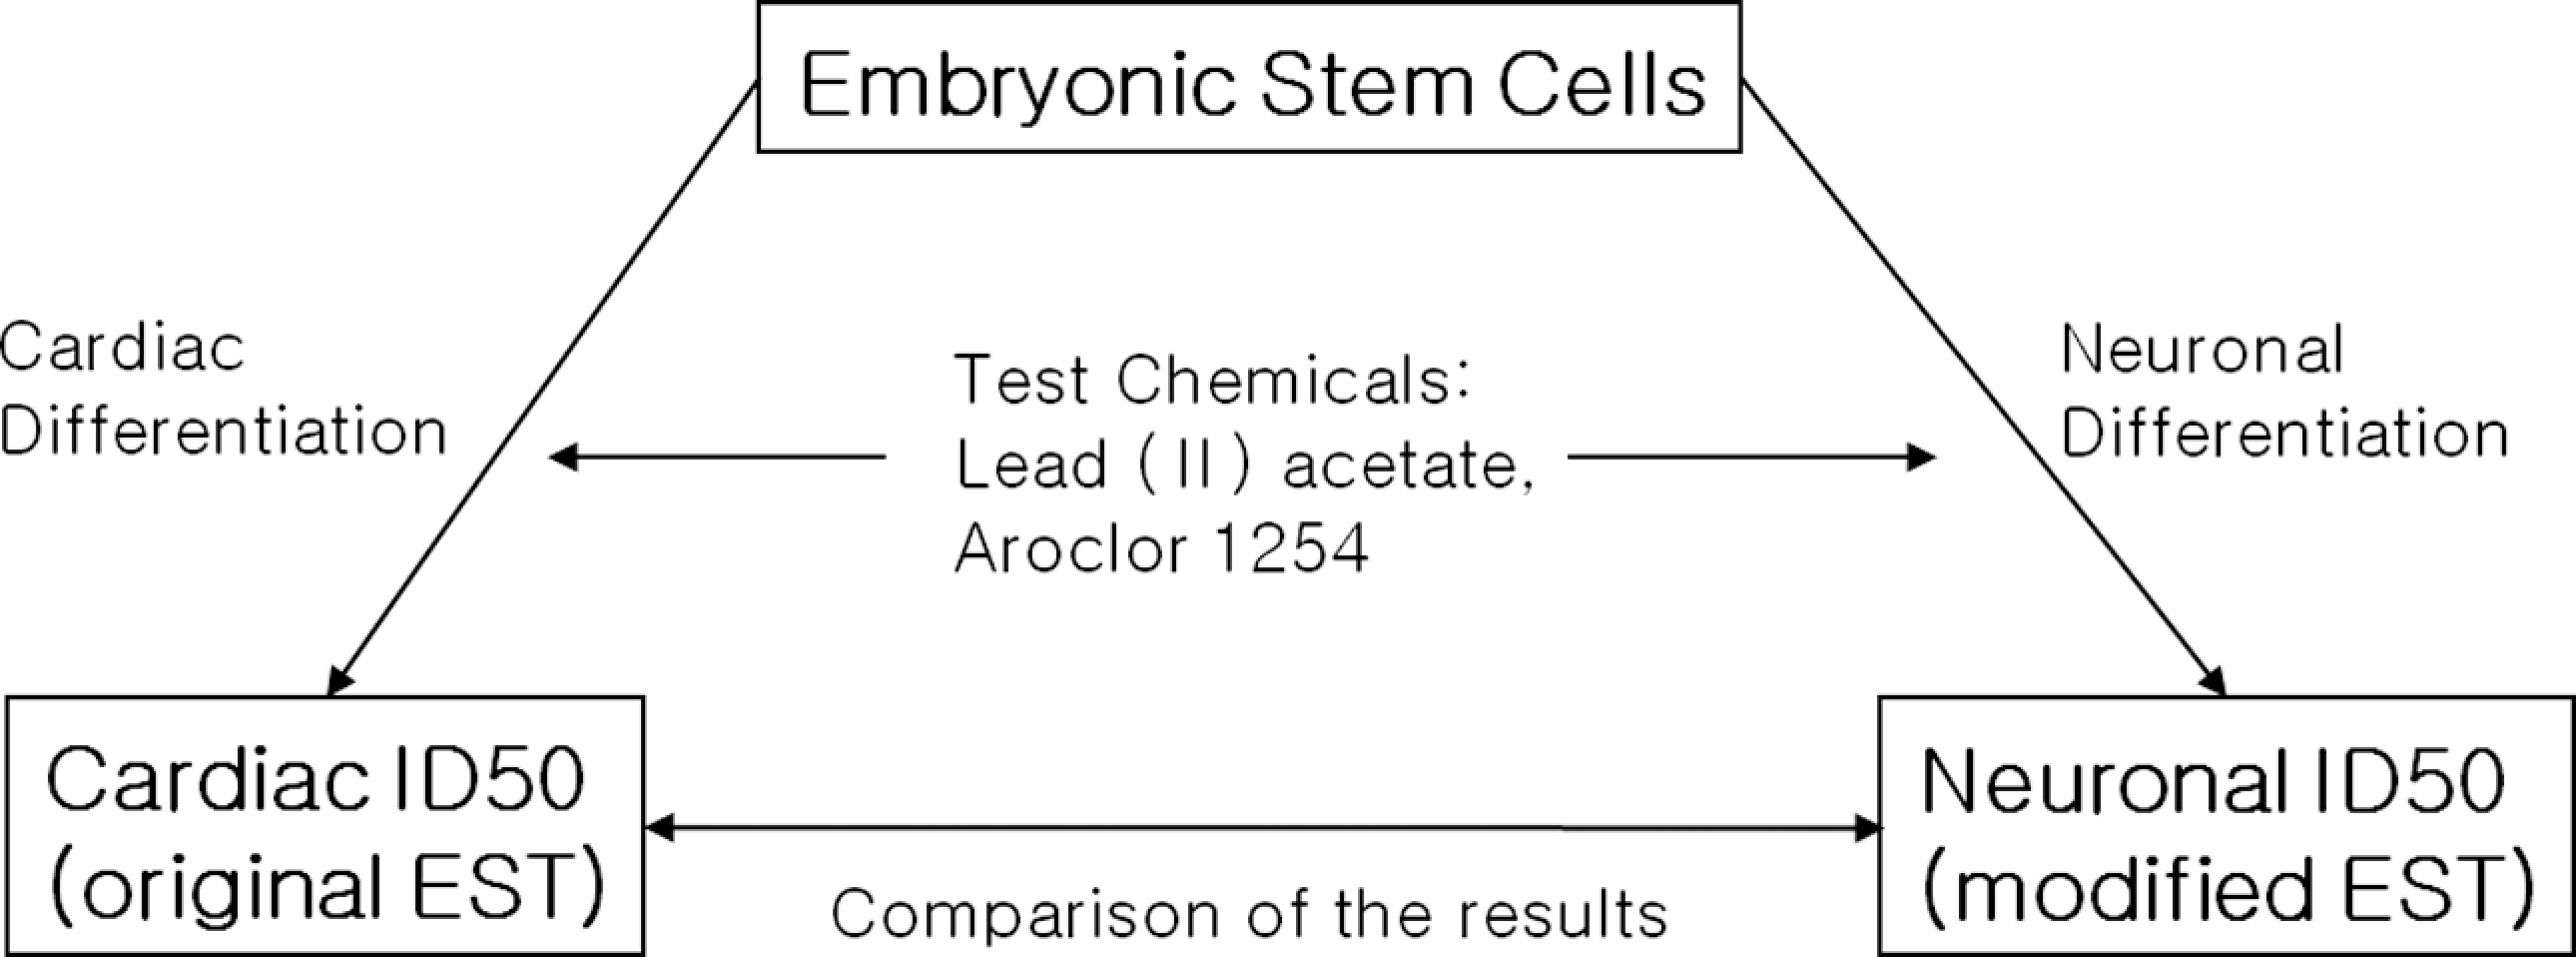
Overview of the study design. D3 embryonic stem (ES-D3) cells were differentiated into cardiac or neuronal cells. During the differentiation, the cells were treated with the test chemicals to obtain cardiac (ID50) and neuronal ID50 values. The result of the embryonic stem cell test (EST) using cardiac ID50 values was compared with the modified EST using neuronal ID50 values.
Materials and Methods
Materials
High-glucose Dulbecco's Modified Eagle's Medium (DMEM) with
Cell Types
D3 mouse ES (ES-D3) cells and 3T3 mouse embryonic fibroblast cells were purchased from American Type Culture Collection ([ATCC]; Rockville, Maryland, USA) and the Korean Cell Line Bank (Seoul, Republic of Korea), respectively.
Culture Media
The D3 assay media contained high-glucose DMEM with
Culture of Mouse Embryonic Stem Cells
D3 cells were cultured on 0.1% gelatin-coated 60 mm dishes with D3 assay media supplemented with 1000 U/mL mLIF. The cells were cultured in a humidified atmosphere with 5% CO2 at 37°C. When the confluency reached approximately 70%, the cells were detached with 0.05% trypsin and plated on new gelatin-coated 60 mm dishes at a 1:3 ratio.
Cardiac Differentiation of Mouse Embryonic Stem Cells
Hanging drops were used to make embryoid bodies as described previously. 12 After mixing D3 mESCs with D3 assay media (3.75 × 10⁴ cells/mL), 50 to 80 drops of this cell suspension were pipetted onto the inside of a 100-mm tissue culture dish lid. Then, the lid was carefully placed on top of a culture dish that was filled with 5 mL of PBS. These hanging drops were incubated in a 5% CO2 atmosphere at 37°C for 3 days. The resulting embryoid bodies were collected, transferred to a Petri dish with D3 assay media, and then incubated in a 5% CO2 atmosphere at 37°C for 2 days. Afterward, each embryoid body was transferred to its own well with 1 mL of D3 assay media in a 24-well tissue culture plate. The embryoid bodies were incubated in a 5% CO2 atmosphere at 37°C for 5 days. Finally, the differentiated myocardial cells were examined under a microscope to distinguish the beating area from the embryoid body (Figure 3).
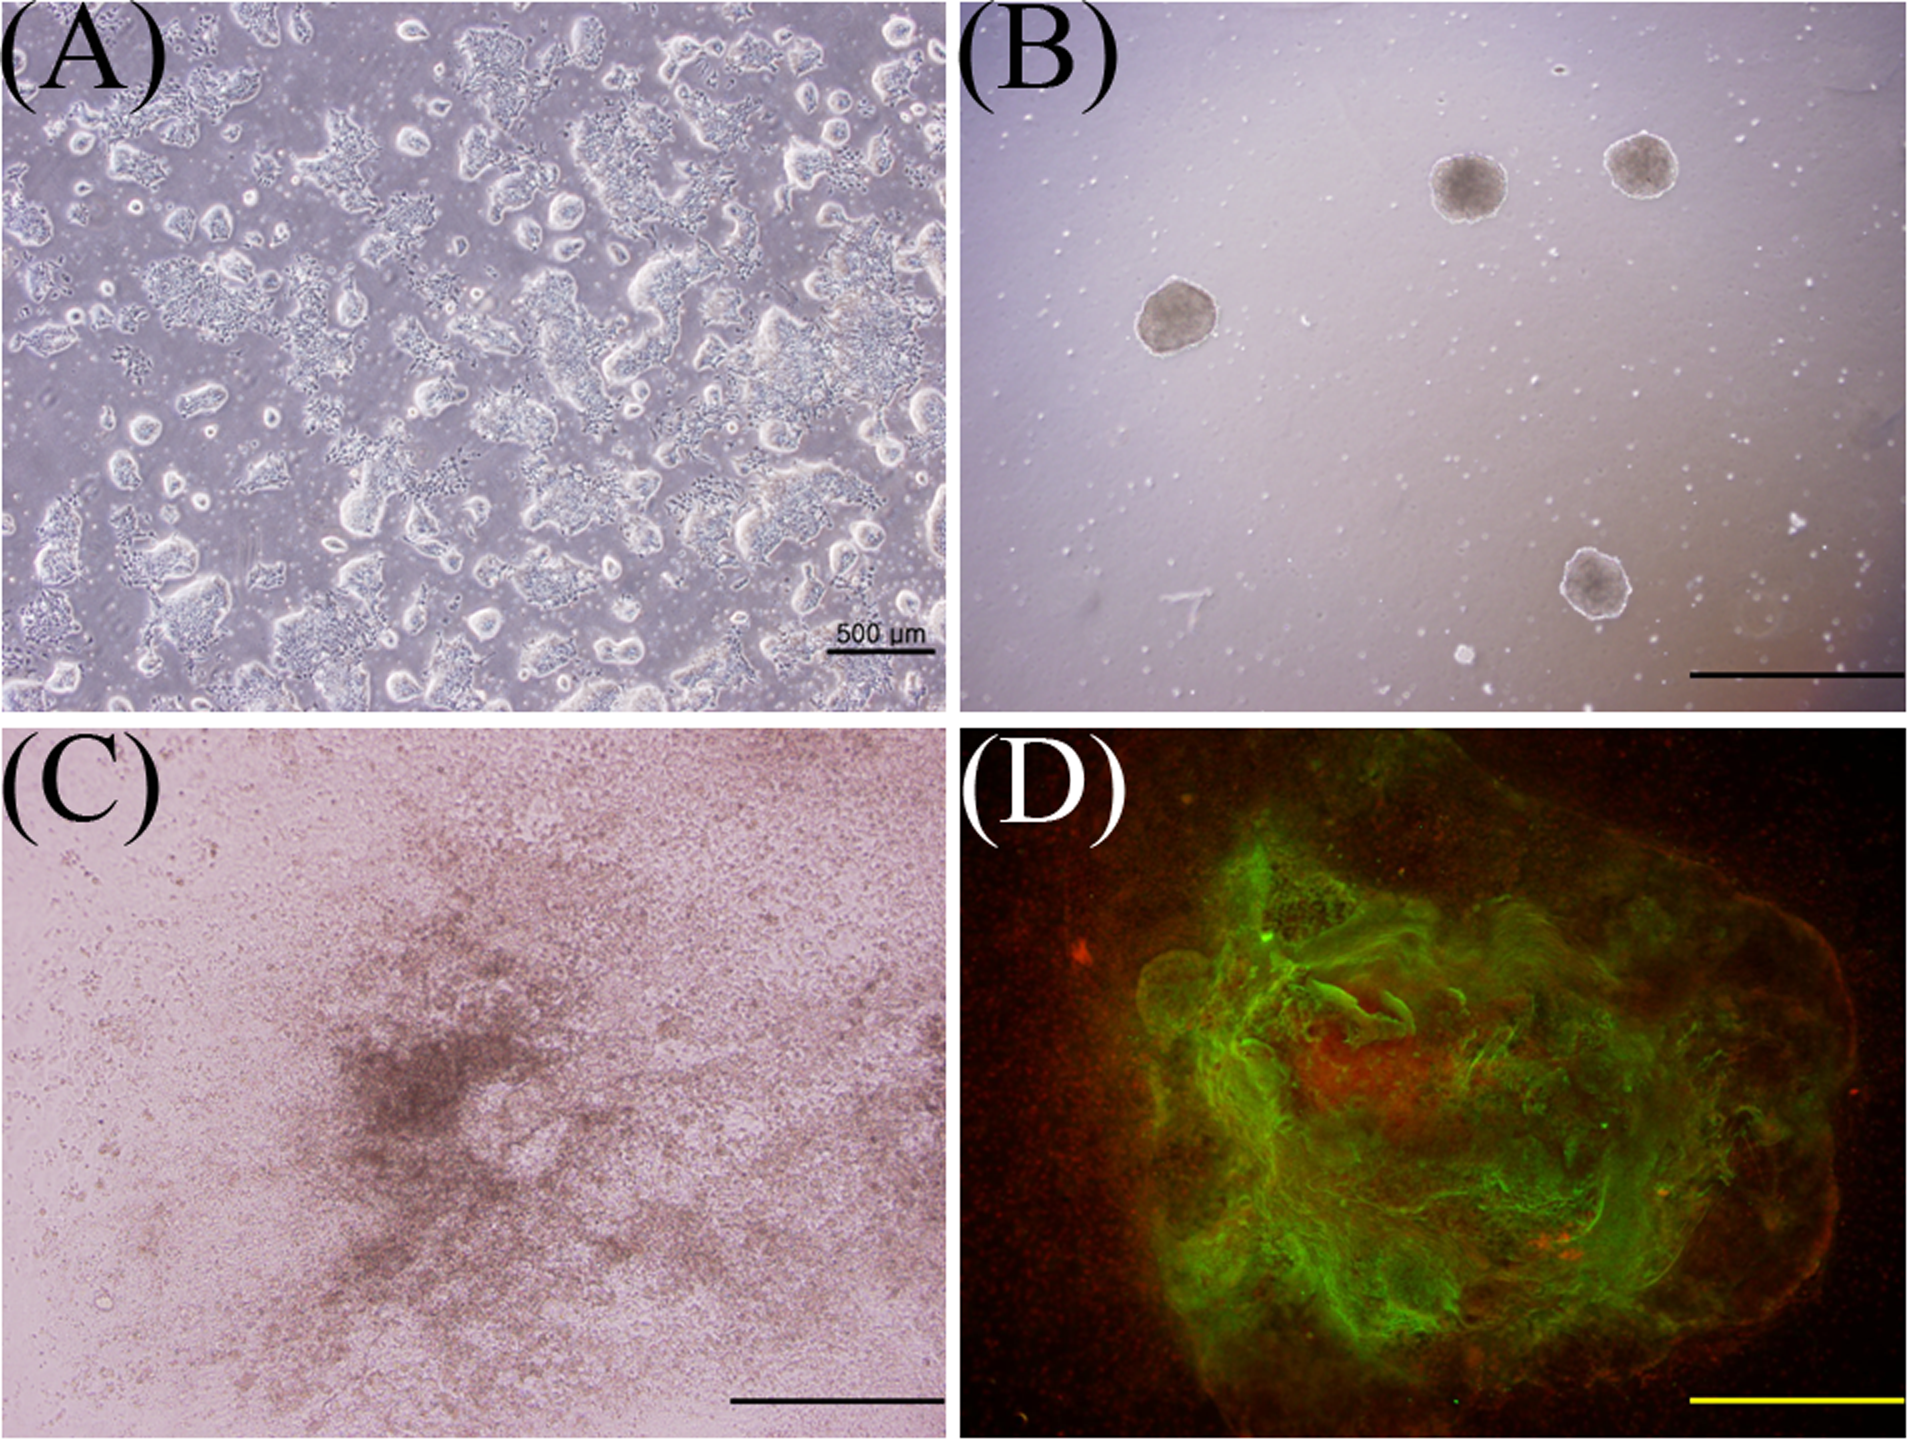
A, Undifferentiated D3 cells. B, Embryoid bodies in suspension culture. C, Differentiated cells from an embryoid body. D, Immunofluorescence of cardiac troponin T-positive cells (green), which consist of a beating area of an embryoid body. Scale bar = 500 μm (A), 250 μm (B, C, D).
Neuronal Differentiation of Embryonic Stem Cells
Five hundred cells and 2.5 × 10⁴ cells were plated in the 24- and 6-well plates, respectively, coated with 0.1% gelatin, and then incubated for 1 day in a 5% CO2 atmosphere at 37°C. The next day, the D3 media was replaced with N2B27 media. The D3 cells were cultured in N2B27 media for 14 days and the media was changed every other day.
Cytotoxicity Assay
D3 or 3T3 cells were plated in a 96-well plate (500 cells/100 uL/well), and then incubated in a 5% CO2 atmosphere at 37°C for 2 hours. Subsequently, 100 μL of media with an appropriate concentration of test material was added to each well. On days 3 and 5, the media was replaced with 200 μL fresh media with the same concentration of test material. The 3-(4,5-dimethylthiazol-2-yl)-2,5-diphenyltetrazolium bromide (MTT) cytotoxicity assay was performed on day 10. Briefly, 20 μL of 5 mg/mL MTT was added to each well, and then the plate was incubated in a 5% CO2 atmosphere at 37°C for 2 hours. Afterward, the supernatant was removed and 130 μL of DMSO was added to each well. The formazan product was dissolved for at least 15 minutes on a shaker until the solution cleared. Finally, the absorption of the solution was measured with a microplate reader at 562 nm.
Immunocytochemistry
Cells were washed 3 times with PBS with 0.1% Tween 20 (PBT) and fixed with 4% paraformaldehyde at room temperature for 20 minutes. Afterward, the cells were washed 3 times with PBT for 5 minutes each, and then blocked with normal goat serum containing 0.3% Triton X-100 at room temperature for 45 minutes. Subsequently, the cells were incubated overnight at 4°C with the primary antibody diluted in PBS and 10% normal goat serum. Next, the cells were washed 3 times with PBT for 5 minutes each, and then incubated with fluorescent-labeled secondary antibodies for 1 hour. The cells were washed with PBT, and then mounted on a glass slide with mounting medium with DAPI. The labeled cells were examined with an inverted fluorescent microscope (Olympus IX-71, Tokyo, Japan).
Flow Cytometry Analysis
Cells were dissociated from plates with 0.05% trypsin-EDTA, washed 3 times with ice-cold PBS containing 5% FCS and 1 mmol/L EDTA, and then fixed on ice with 4% paraformaldehyde for 25 minutes. Afterward, the cells were washed twice with PBS containing 1% BSA, and then blocked on ice with blocking solution (PBS with 10% goat serum, 1% BSA, and 0.15% saponin) for 30 minutes. Subsequently, the cells were incubated on ice with blocking solution containing the primary antibody for 1 hour, washed with PBS containing 1% BSA and 0.15% saponin. Next, the cells were incubated with blocking solution containing the secondary antibody for 30 minutes, washed 3 times with PBS containing 1% BSA and 0.15% saponin, and then resuspended in PBS with 1% BSA. Flow cytometry analysis was performed with a fluorescence-activated cell sorter (FACS) Calibur flow cytometer (Becton Dickinson, Franklin Lakes, New Jersey, USA).
Quantitative RT-PCR
On day 14 of neuronal differentiation, the total RNA was isolated using TRIzol or the RNeasy Mini kit. Complementary DNA (cDNA) was synthesized from 1 μg of total RNA using the Accupower RT premix kit (Bioneer, Daejeon, Republic of Korea) with 0.5 μg of an oligo(dT) primer. Subsequently, the synthesized cDNA was used as the template for real-time PCR on a 7900HT Sequence Detection System (Applied Biosystems, Foster City, California, USA). The 20 μL reaction included 2 μL of cDNA, 1 μL of Taqman Gene Expression Assays, and 10 μL of Taqman Universal PCR Master Mix. The cDNA amplification was performed according to the manufacturer’s instructions. The relative amount of MAP2 messenger RNA (mRNA) was calculated using the ΔΔCt method, and the data were normalized to the amount of GAPDH mRNA.
Quality Control of Data
For quality of the cardiac (ID50) values, the data were accepted when at least 21 (87.5%) of the 24 embryoid bodies differentiated into spontaneously contracting myocardial cells. To assure the quality of the MTT assay data, we used a quality control method for the EST. Briefly, 1000 μg/mL of penicillin G, 0.29 μg/mL of 5-fluorouracil (5-FU) for D3 cells, and 0.06 μg/mL of 5-FU for 3T3 cells were tested simultaneously. The data were accepted when penicillin G did not have any effect on cell survival and 5-FU inhibited the cell growth by 20% to 80%. For quality control of the neuronal ID50 values, the data were accepted when the percentage of spontaneously differentiated MAP-2-positive cells was greater than 30%.
Classification of Embryotoxicity
To predict the embryotoxic potential of a test compound in vivo, the prediction model of the current EST was used. 12 The prediction model consists of 3 linear discriminate functions that take 3 variables into account (cardiac ID50, half maximal inhibitory concentration [IC50] D3, and IC50 3T3) to discriminate among 3 classes of embryotoxicity (nonembryotoxic, weakly embryotoxic, and strongly embryotoxic). The function providing the highest value is used to determine the class of embryotoxicity (Table 1).
Results
Quality Control of the EST Using 5-FU
Before testing lead (II) acetate and Aroclor 1254, 5-FU was used as a positive control (Figure 4). The ID50 value was 0.044 (0.0083) μg/mL, and the IC50 values of D3 and 3T3 cells were 0.17 (0.0058) μg/mL and 0.25 (0.01) μg/mL, respectively. When the results were applied to the prediction model of the EST (Table 1), 5-FU was classified as strongly embryotoxic (class III). This result confirmed that the EST functioned correctly.
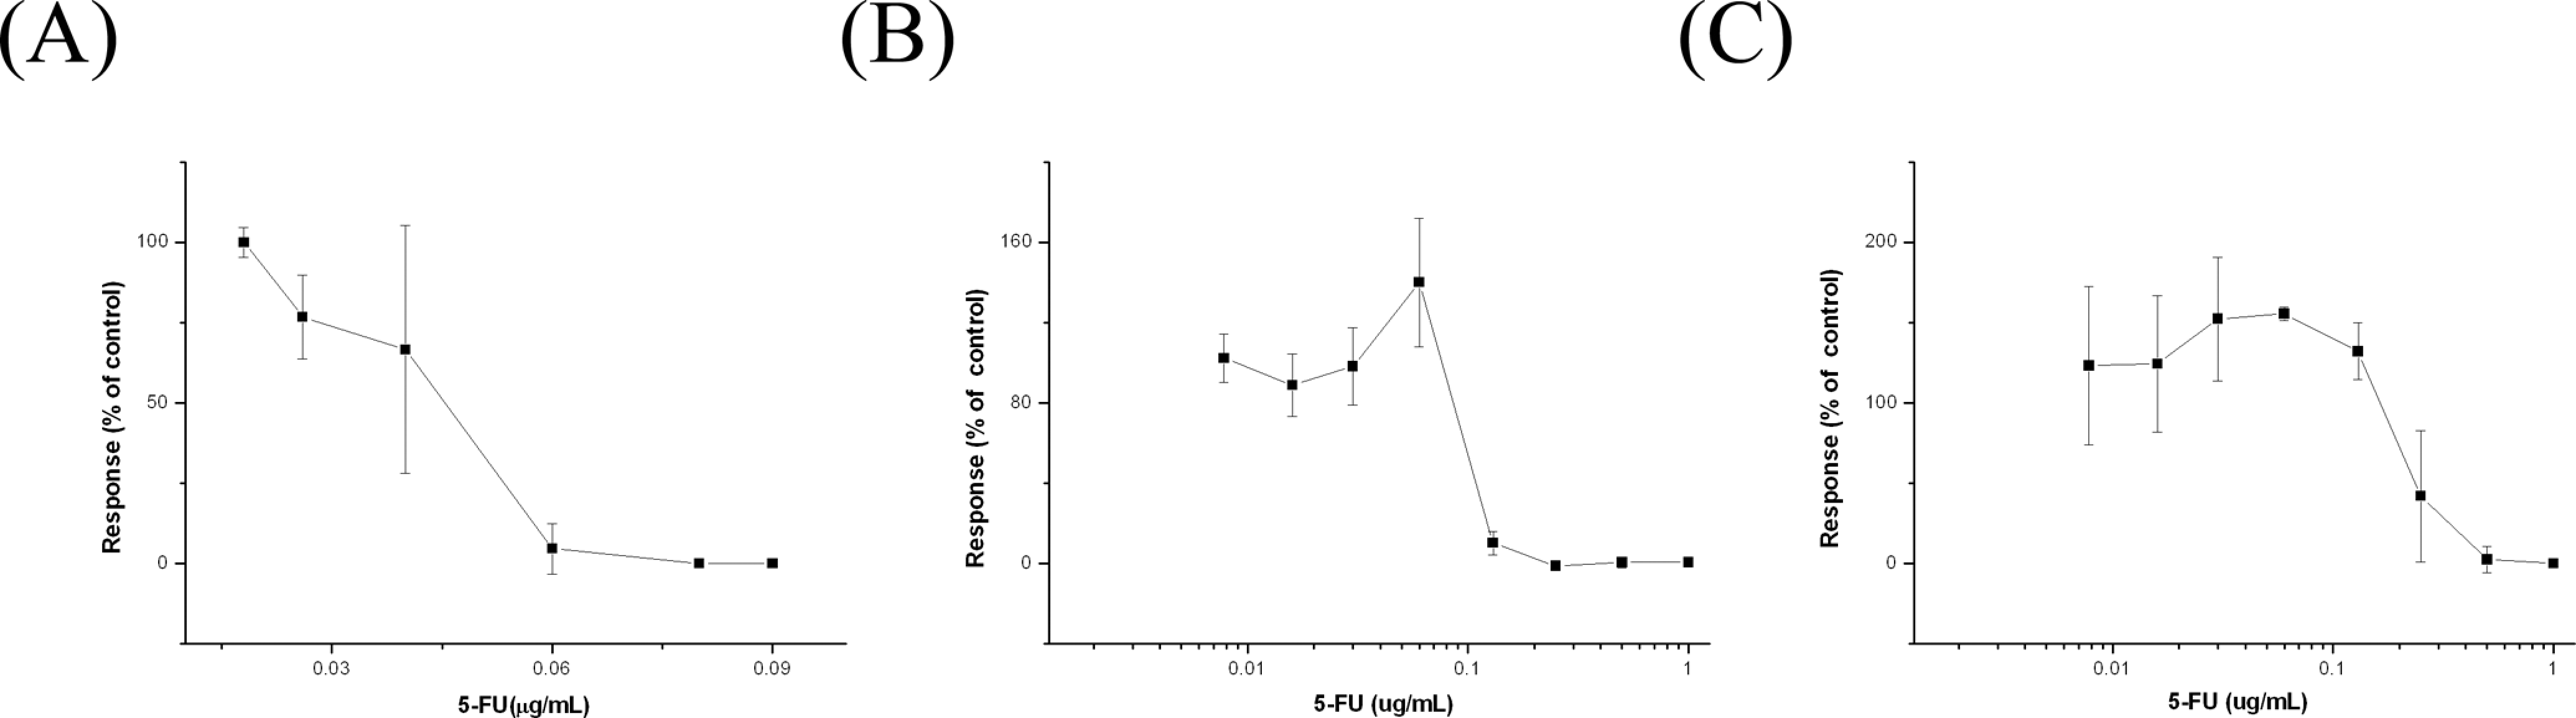
A, Concentration–response curves obtained from contraction counting after 5-florouracil (5-FU) treatment (n = 3). B and C, Concentration–response curves from the 3-(4,5-dimethylthiazol-2-yl)-2,5-diphenyltetrazolium bromide (MTT) cytotoxicity assay of D3 (B) and 3T3 cells (C) after 5-FU treatment (n = 3). The error bars indicate standard deviations.
The Effects of Developmental Neurotoxicants on Cardiac Differentiation of Embryonic Stem Cells
Two independent trials were performed for each developmental neurotoxicant with the current EST. For lead (II) acetate, the ID50 value was 174.5 μg/mL, and the IC50 values of D3 and 3T3 cells were 37.1 μg/mL and 5.7 μg/mL, respectively, in the first trial. In the second trial, the ID50 value was 116.3 μg/mL, and the IC50 values of D3 and 3T3 cells were 14.5 μg/mL and 26.2 μg/mL, respectively (Figure 5). When these results were applied to the prediction model of the EST, lead (II) acetate was classified as nonembryotoxic (class I; Table 2).
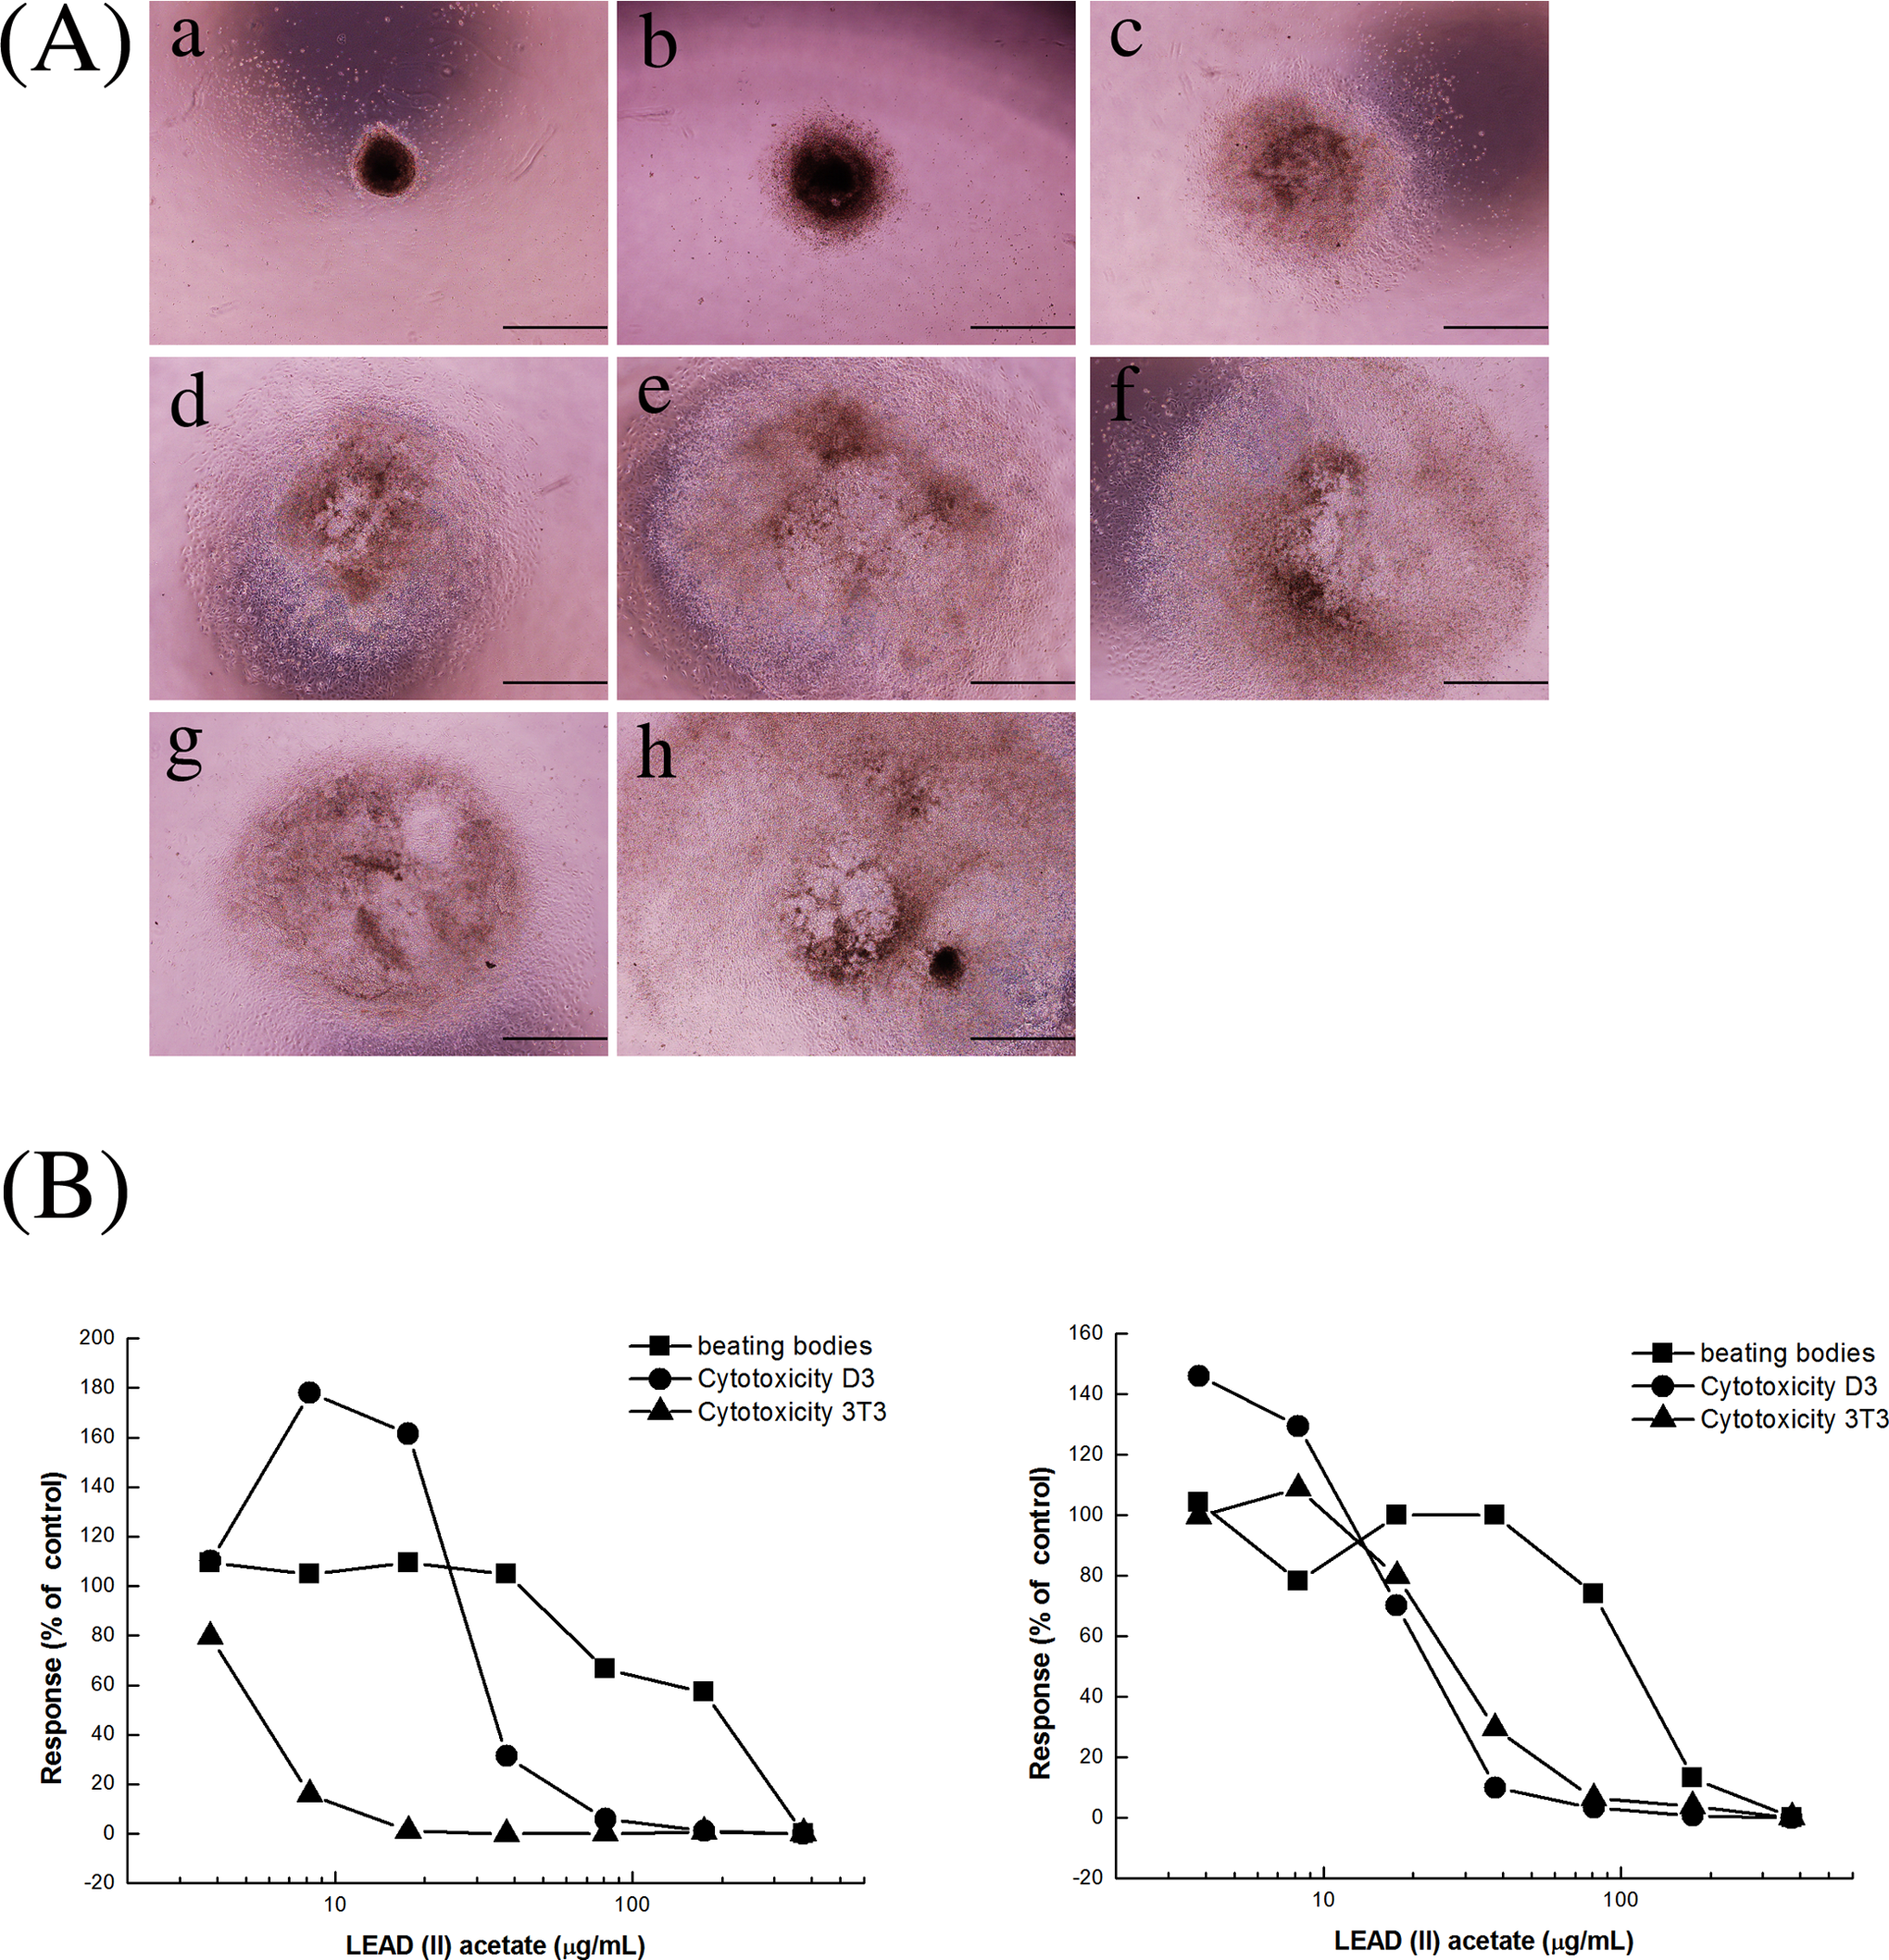
A, The differentiated embryoid bodies from D3 cells after 10 days of treatment with different concentrations of lead (II) acetate (a = 375 μg/mL, b = 174.4 μg/mL, c = 81.1 μg/mL, d = 37.7 μg/mL, e = 17.6 μg/mL, f = 8.2 μg/mL, g = 3.8 μg/mL, h = control). Scale bar = 1 mm. B, Concentration–response curves from the embryonic stem cell test (EST) assays after lead (II) acetate treatment. Two independent trials were performed (trial #1, left; trial #2, right).
The ID50 and IC50 Values of Cardiac and Neuronal Differentiation of D3 Cells After Treatment With Lead (II) Acetate or Aroclor 1254 a
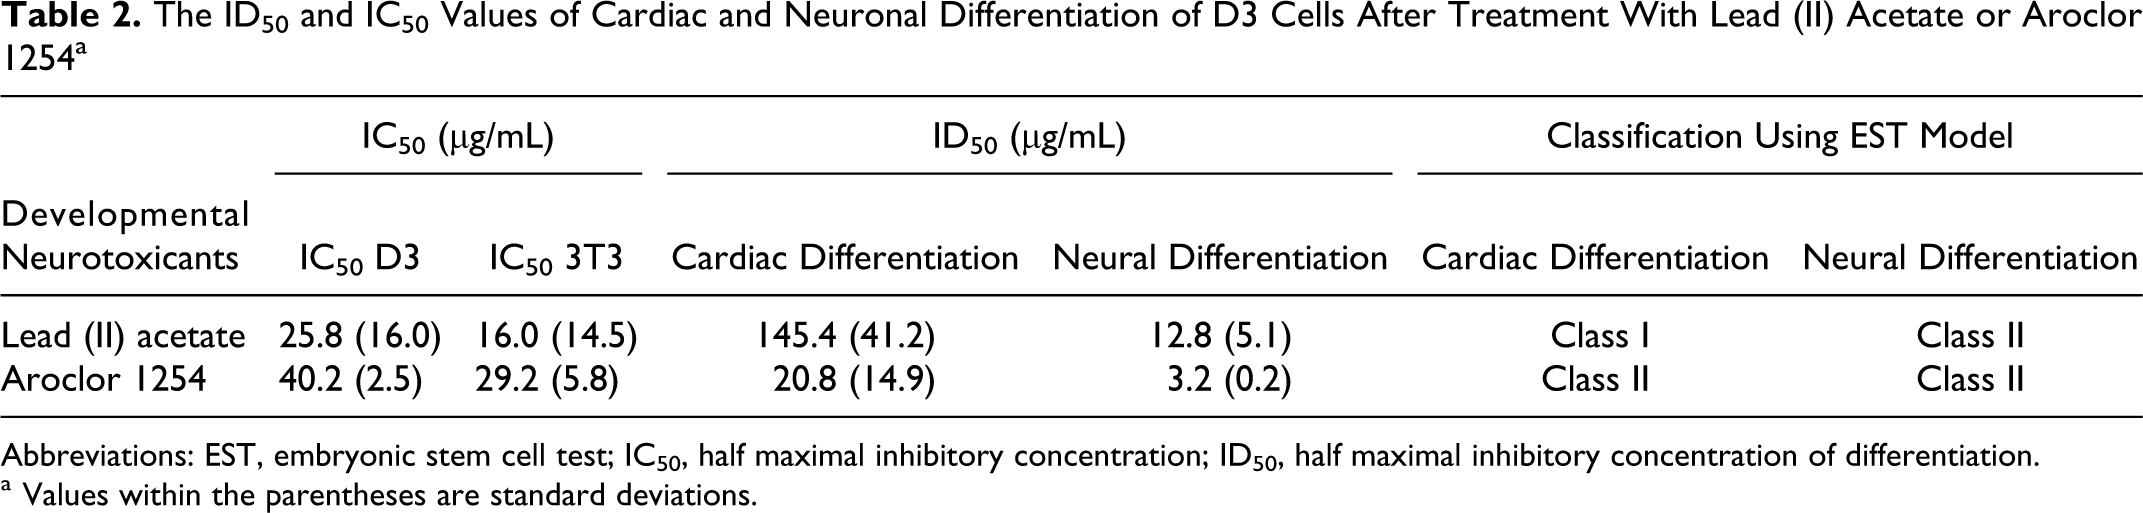
Abbreviations: EST, embryonic stem cell test; IC50, half maximal inhibitory concentration; ID50, half maximal inhibitory concentration of differentiation.
a Values within the parentheses are standard deviations.
For Aroclor 1254, the ID50 value was 31.3 μg/mL, and the IC50 values of D3 and 3T3 cells were 38.4 μg/mL and 33.3 μg/mL, respectively, in the first trial. In the second trial, the ID50 value was 10.2 μg/mL, and the IC50 values of D3 and 3T3 cells were 42.0 μg/mL and 25.1 μg/mL, respectively (Figure 6). When these results were applied to prediction model of the EST, Aroclor 1254 was predicted to be weakly embryotoxic (class II; Table 2).
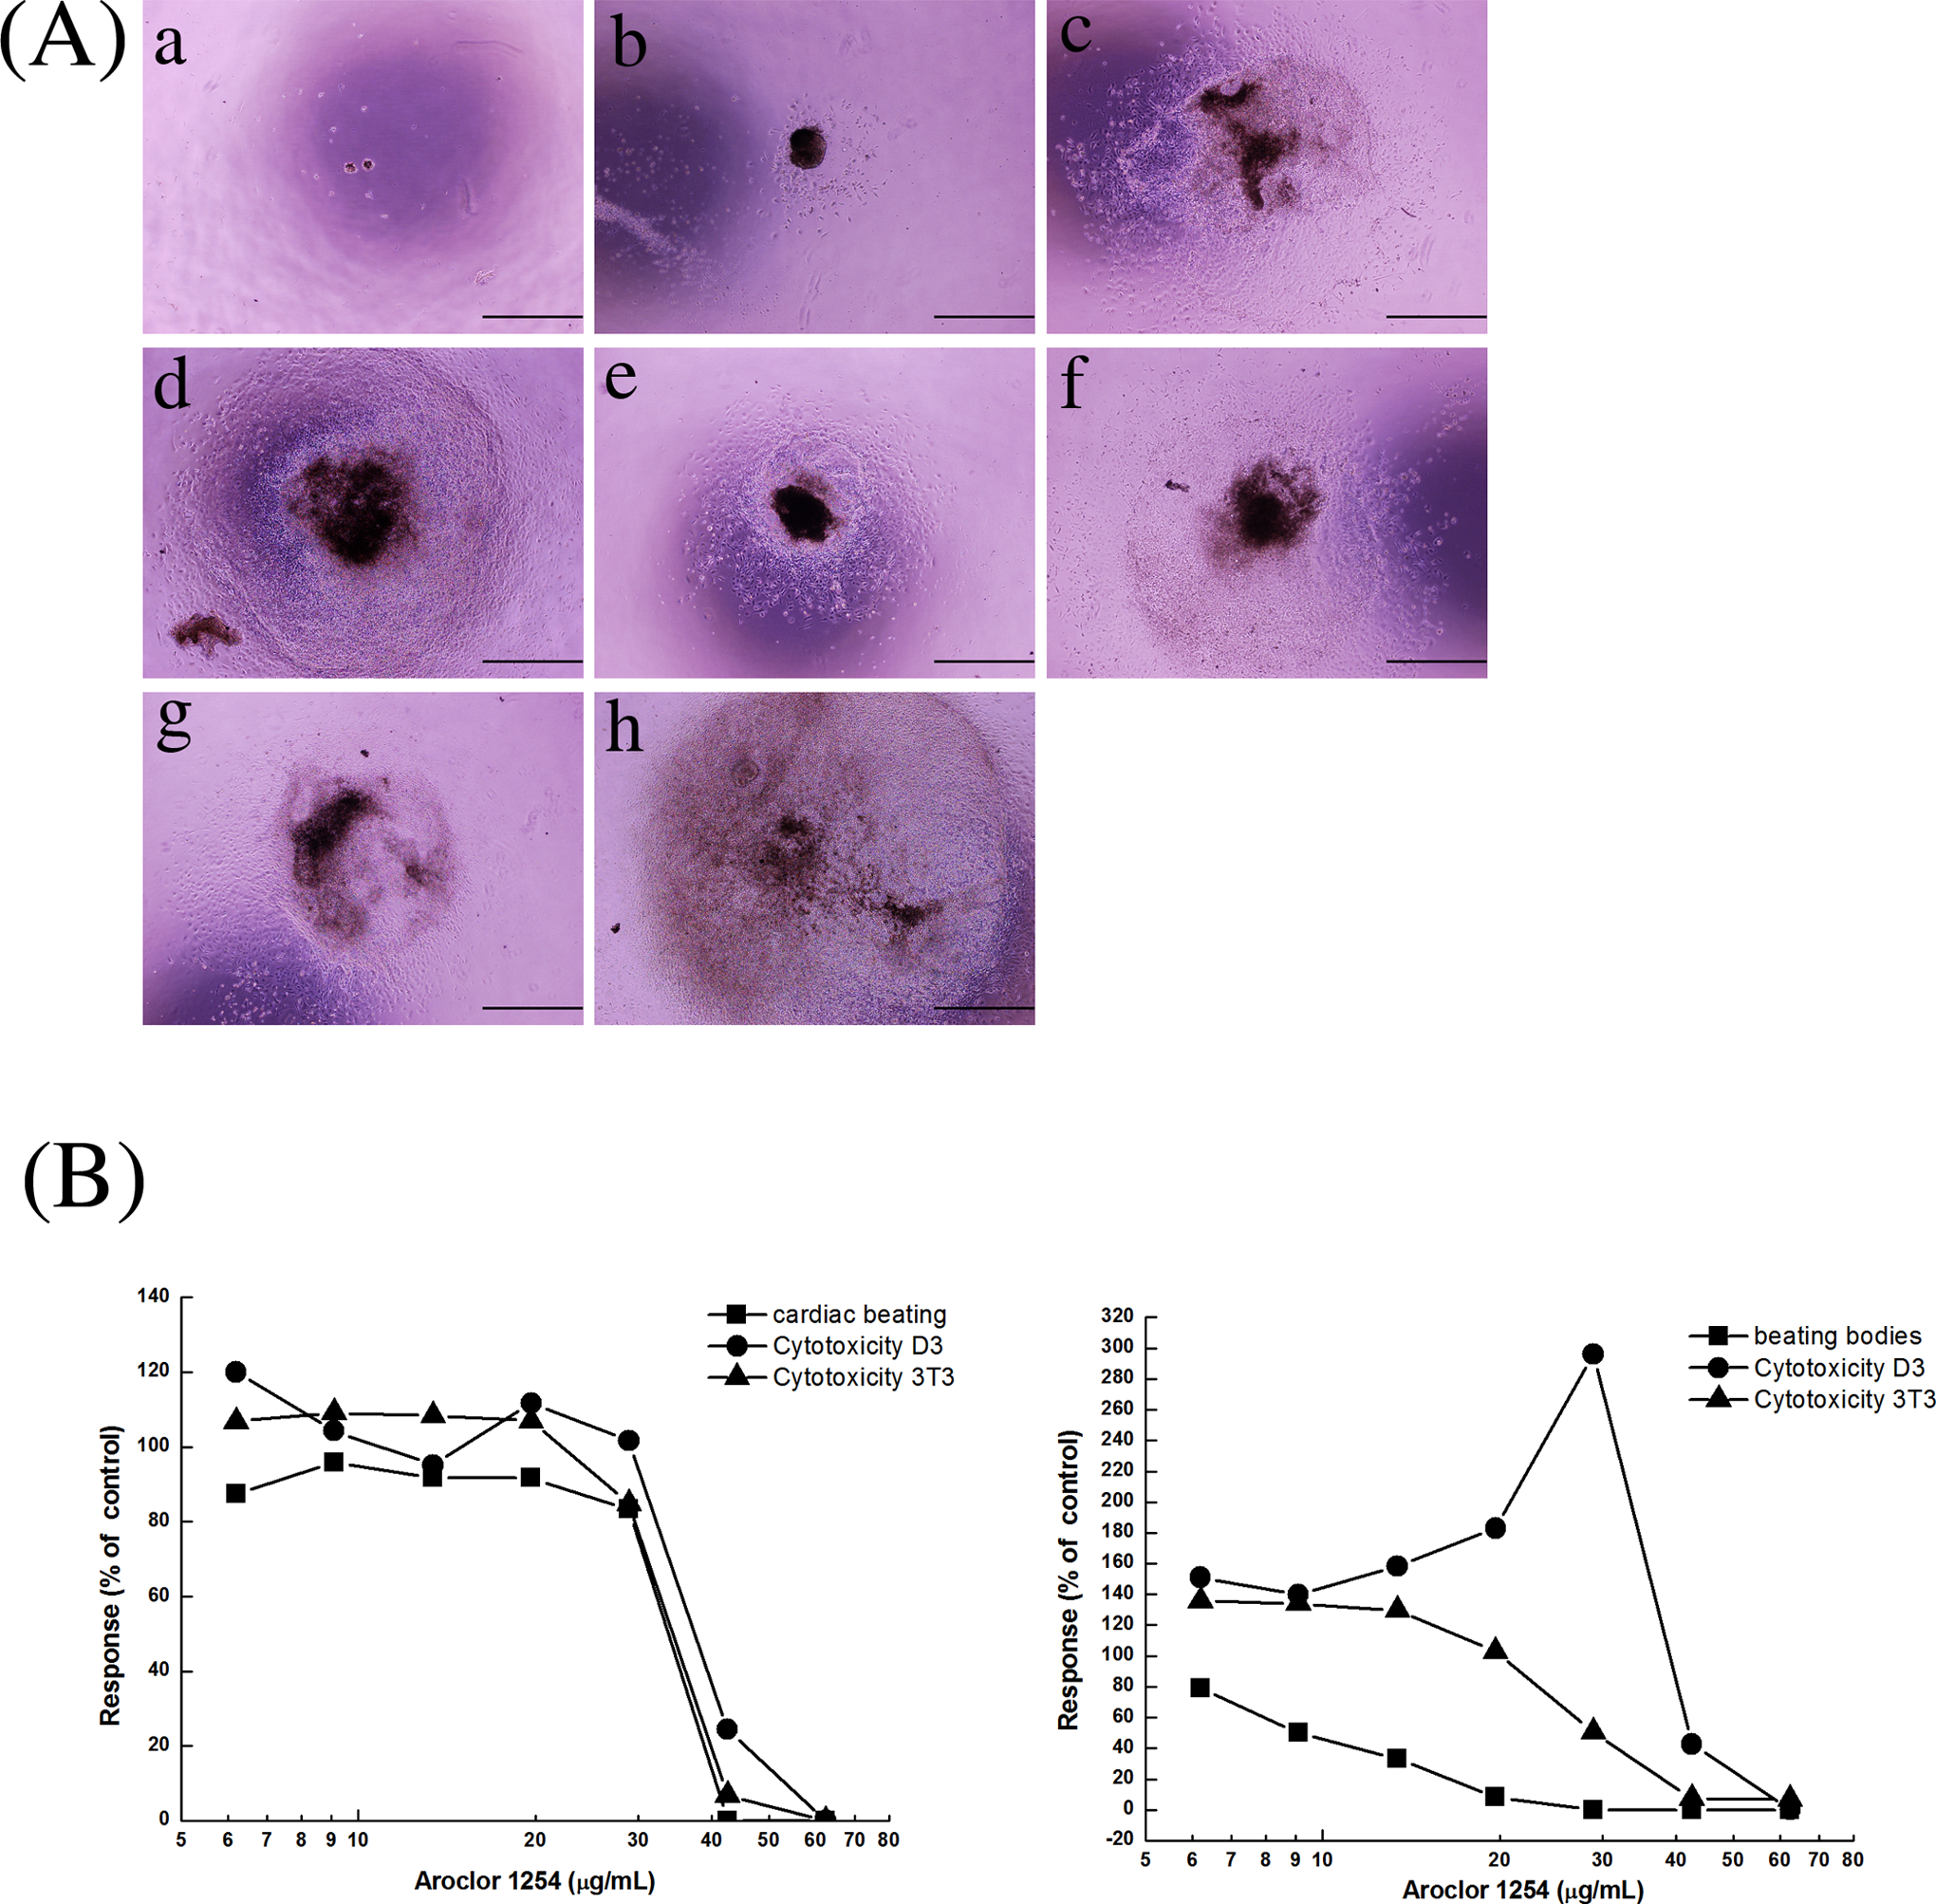
A, The differentiated embryoid bodies from D3 cells after 10 days of treatment with different concentrations of Aroclor 1254 (a = 62.5 μg/mL, b = 42.5 μg/mL, c = 28.9 μg/mL, d = 19.7 μg/mL, e = 13.4 μg/mL, f = 9.1 μg/mL, g = 6.2 μg/mL, h = control). Scale bar = 1 mm. B, Concentration–response curves from the embryonic stem cell test (EST) assays after Aroclor 1254 treatment. Two independent trials were performed (trial #1, left; and trial #2, right).
Selection of Neuronal Differentiation Protocol for Developmental Neurotoxicity Test
Since the current EST misclassified these 2 strong embryotoxicants, we investigated whether the use of neuronal tissues as an additional toxicological target could improve the predictive accuracy of the EST. To do this, we performed adherent monolayer neuronal differentiation of D3 cells using the method of Ying et al with some modifications. To increase the efficiency of neuronal differentiation, we added basic fibroblast growth factor (bFGF) and ascorbic acid to N2B27 media during differentiation. Specifically, cells were treated with 20 ng/mL of bFGF on days 5 to 7 and 200 μmol/L of ascorbic acid on days 8 to 14. The percentage of MAP-2-positive cells in the cytokine-treated group was 46.14% (13.73%) and that of the control group was 32.35% (10.87%; Figure 7). In addition, immunocytochemical analysis of the differentiated cells showed that they were both MAP-2 positive and GFAP positive (Figure 8).
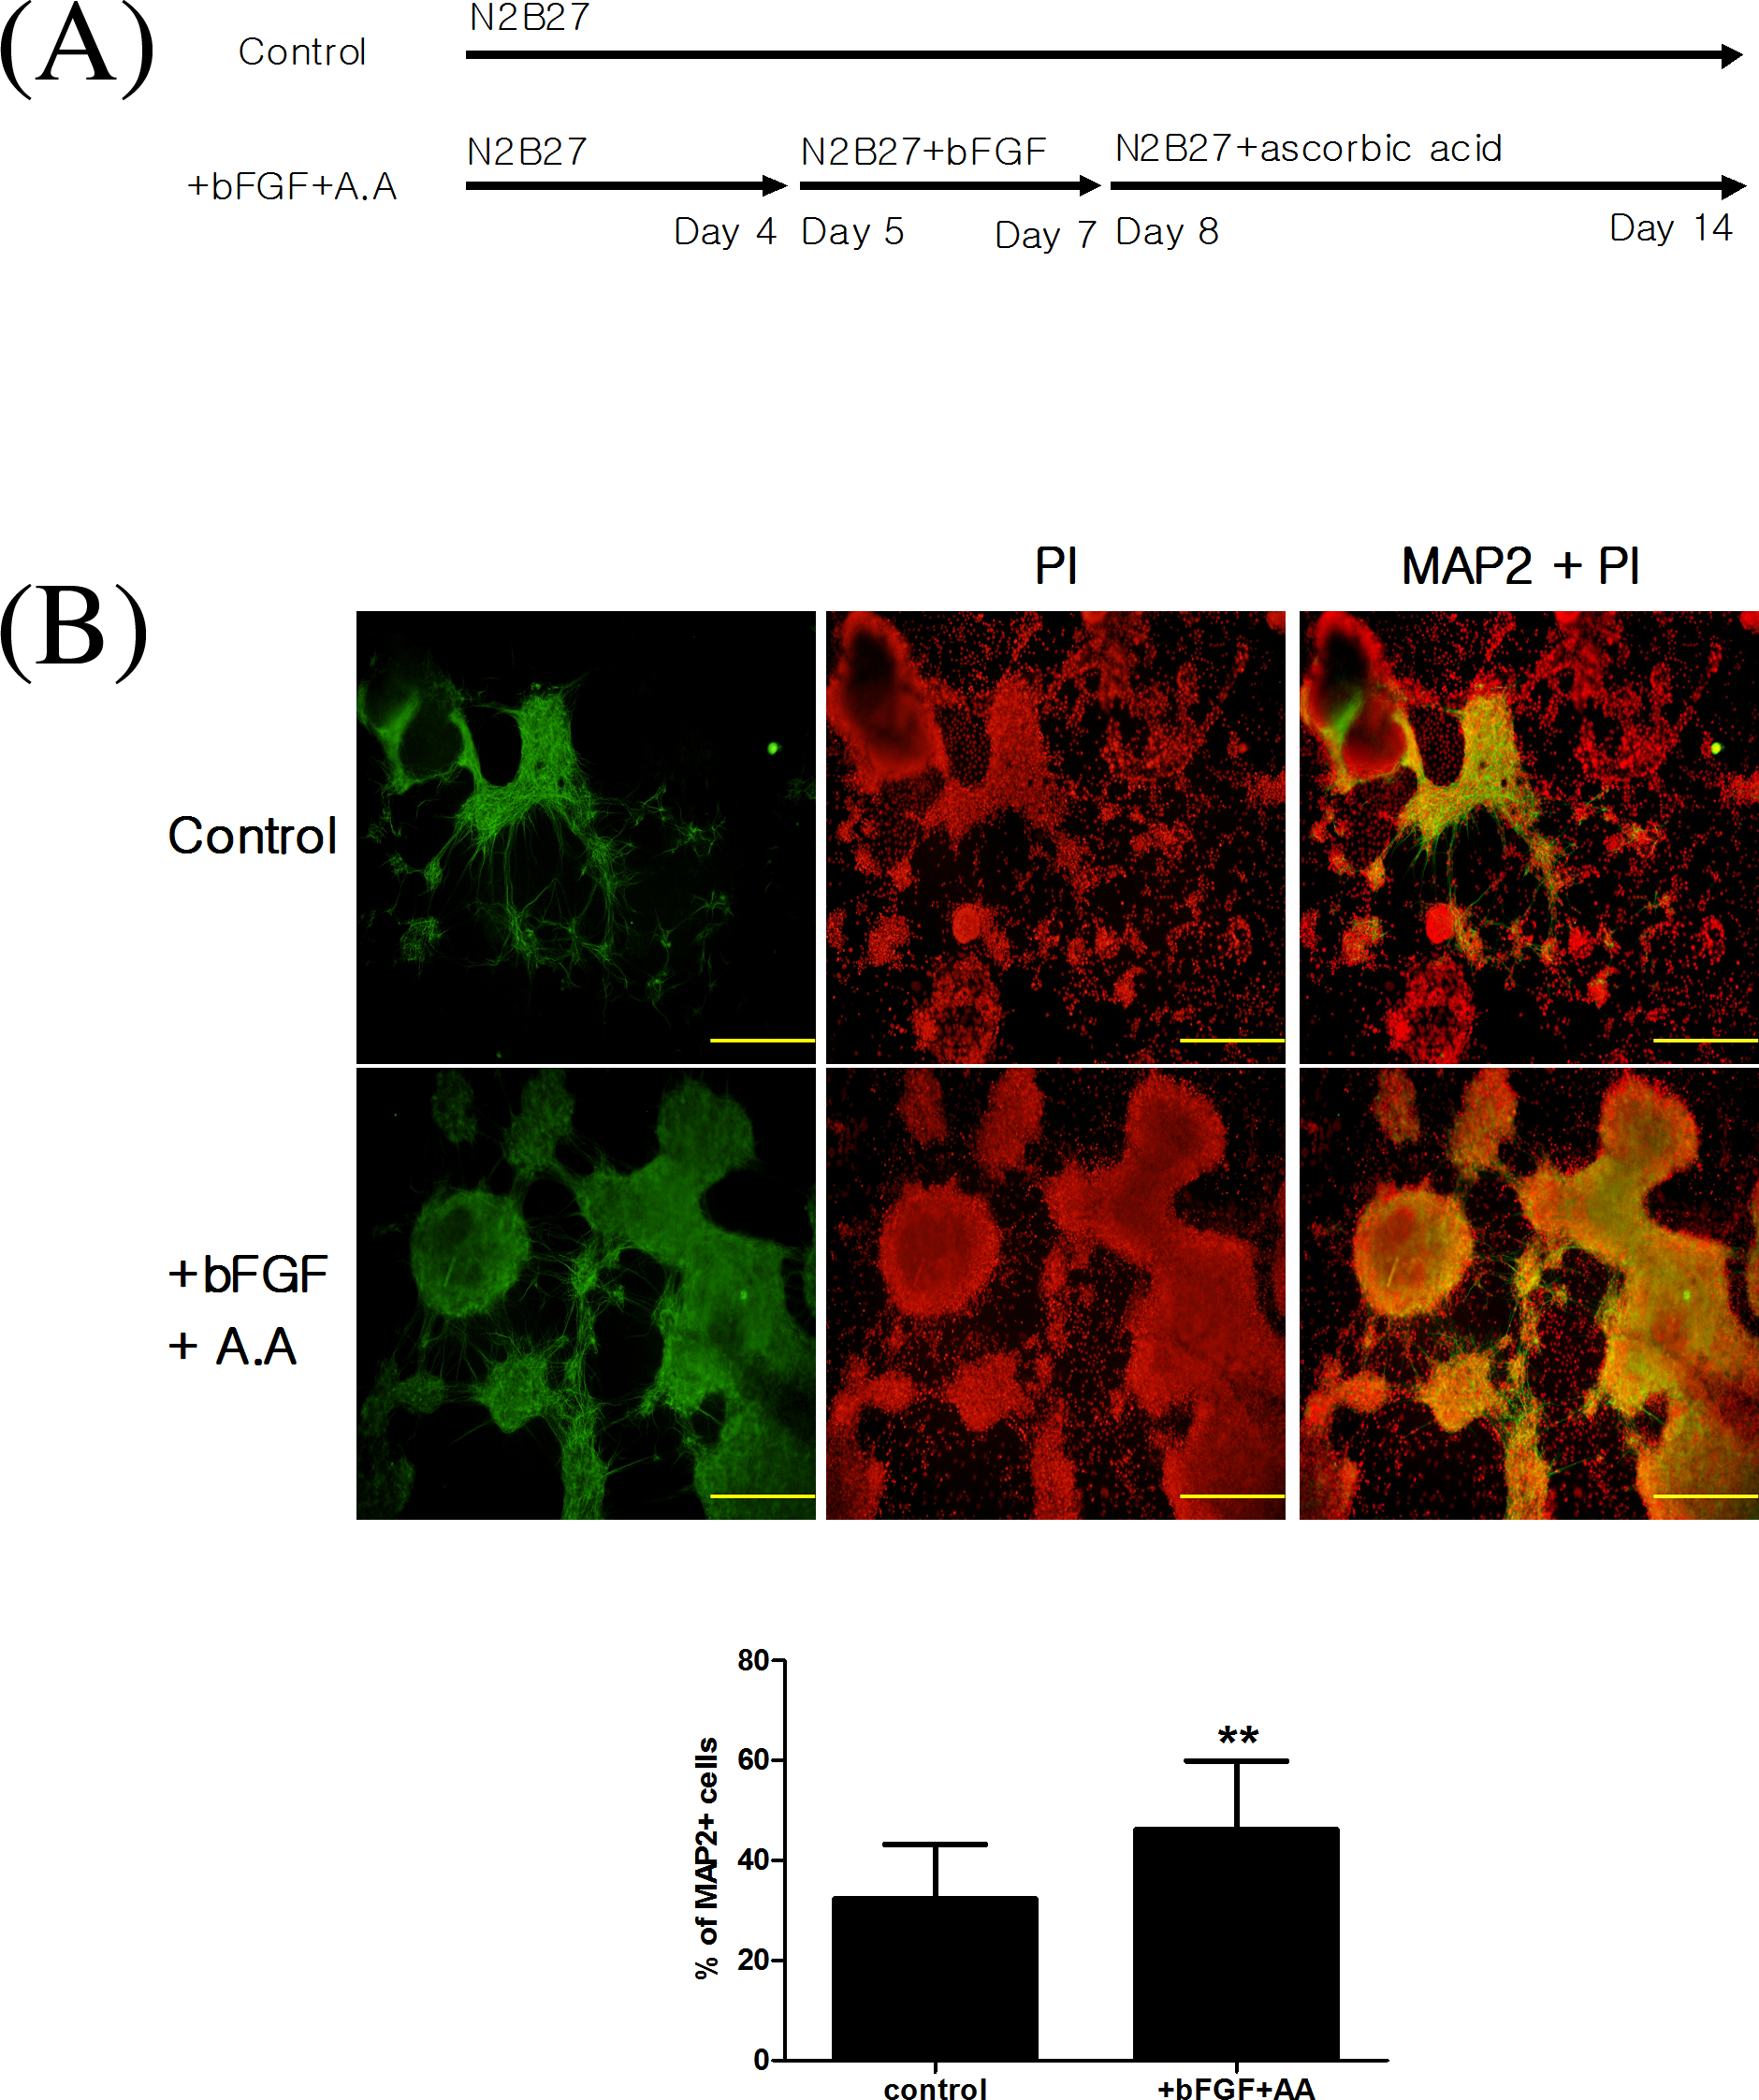
A, Cytokine treatments used to compare the efficiency of neuronal differentiation. B, Immunocytochemical analysis of microtubule-associated protein 2 ([MAP-2] green)/propidium iodide ([PI] red) – positive cells differentiated with or without basic fibroblast growth factor (bFGF), and ascorbic acid. The ratio of the area of MAP-2-positive cells to the area of PI-positive cells was calculated using an image analysis program (Image-Pro PLUS, Media Cybernetics). Scale bar = 1 mm. **P < .01.
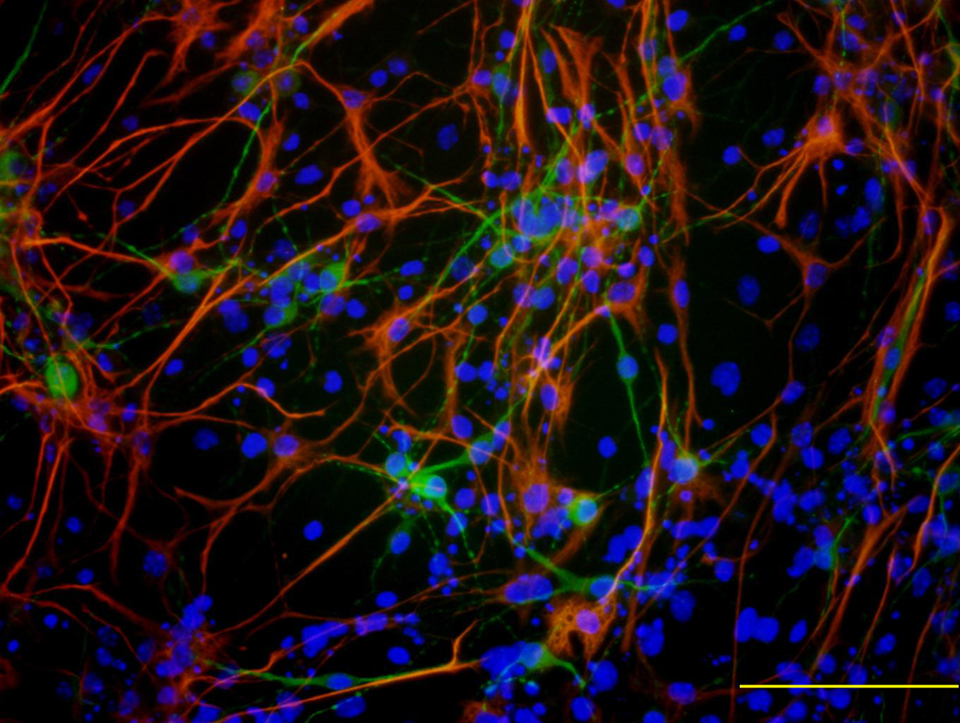
Immunofluorescence of microtubule-associated protein 2 (MAP-2; green), glial fibrillary acidic protein (GFAP; red), and 4′,6-diamidino-2-phenylindole (DAPI; blue) – positive cells differentiated in N2B27 media with basic fibroblast growth factor (bFGF) and ascorbic acid. MAP-2-positive and GFAP-positive cells do not overlap with each other. Scale bar = 200 μm.
Toxic Effects of Lead (II) Acetate and Aroclor 1254 on Neuronal Differentiation of Embryonic Stem Cells
Lead (II) acetate and Aroclor 1254 were applied to ES cells during neuronal differentiation to determine their effects on neuronal differentiation. First, immunocytochemistry was used to determine the range of concentrations of lead (II) acetate and Aroclor 1254 needed to inhibit neuronal differentiation. Our results showed that the number of MAP-2-positive cells decreased when more than 0.3 μg/mL of lead (II) acetate was applied and no MAP-2-positive cells were found when more than 30 μg/mL of lead (II) acetate was applied. Aroclor 1254 did not have any effect on the number of MAP-2-positive cells when less than 0.625 μg/mL was applied and no MAP-2-positive cells were found when more than 6.25 μg/mL was applied (Figure 9).
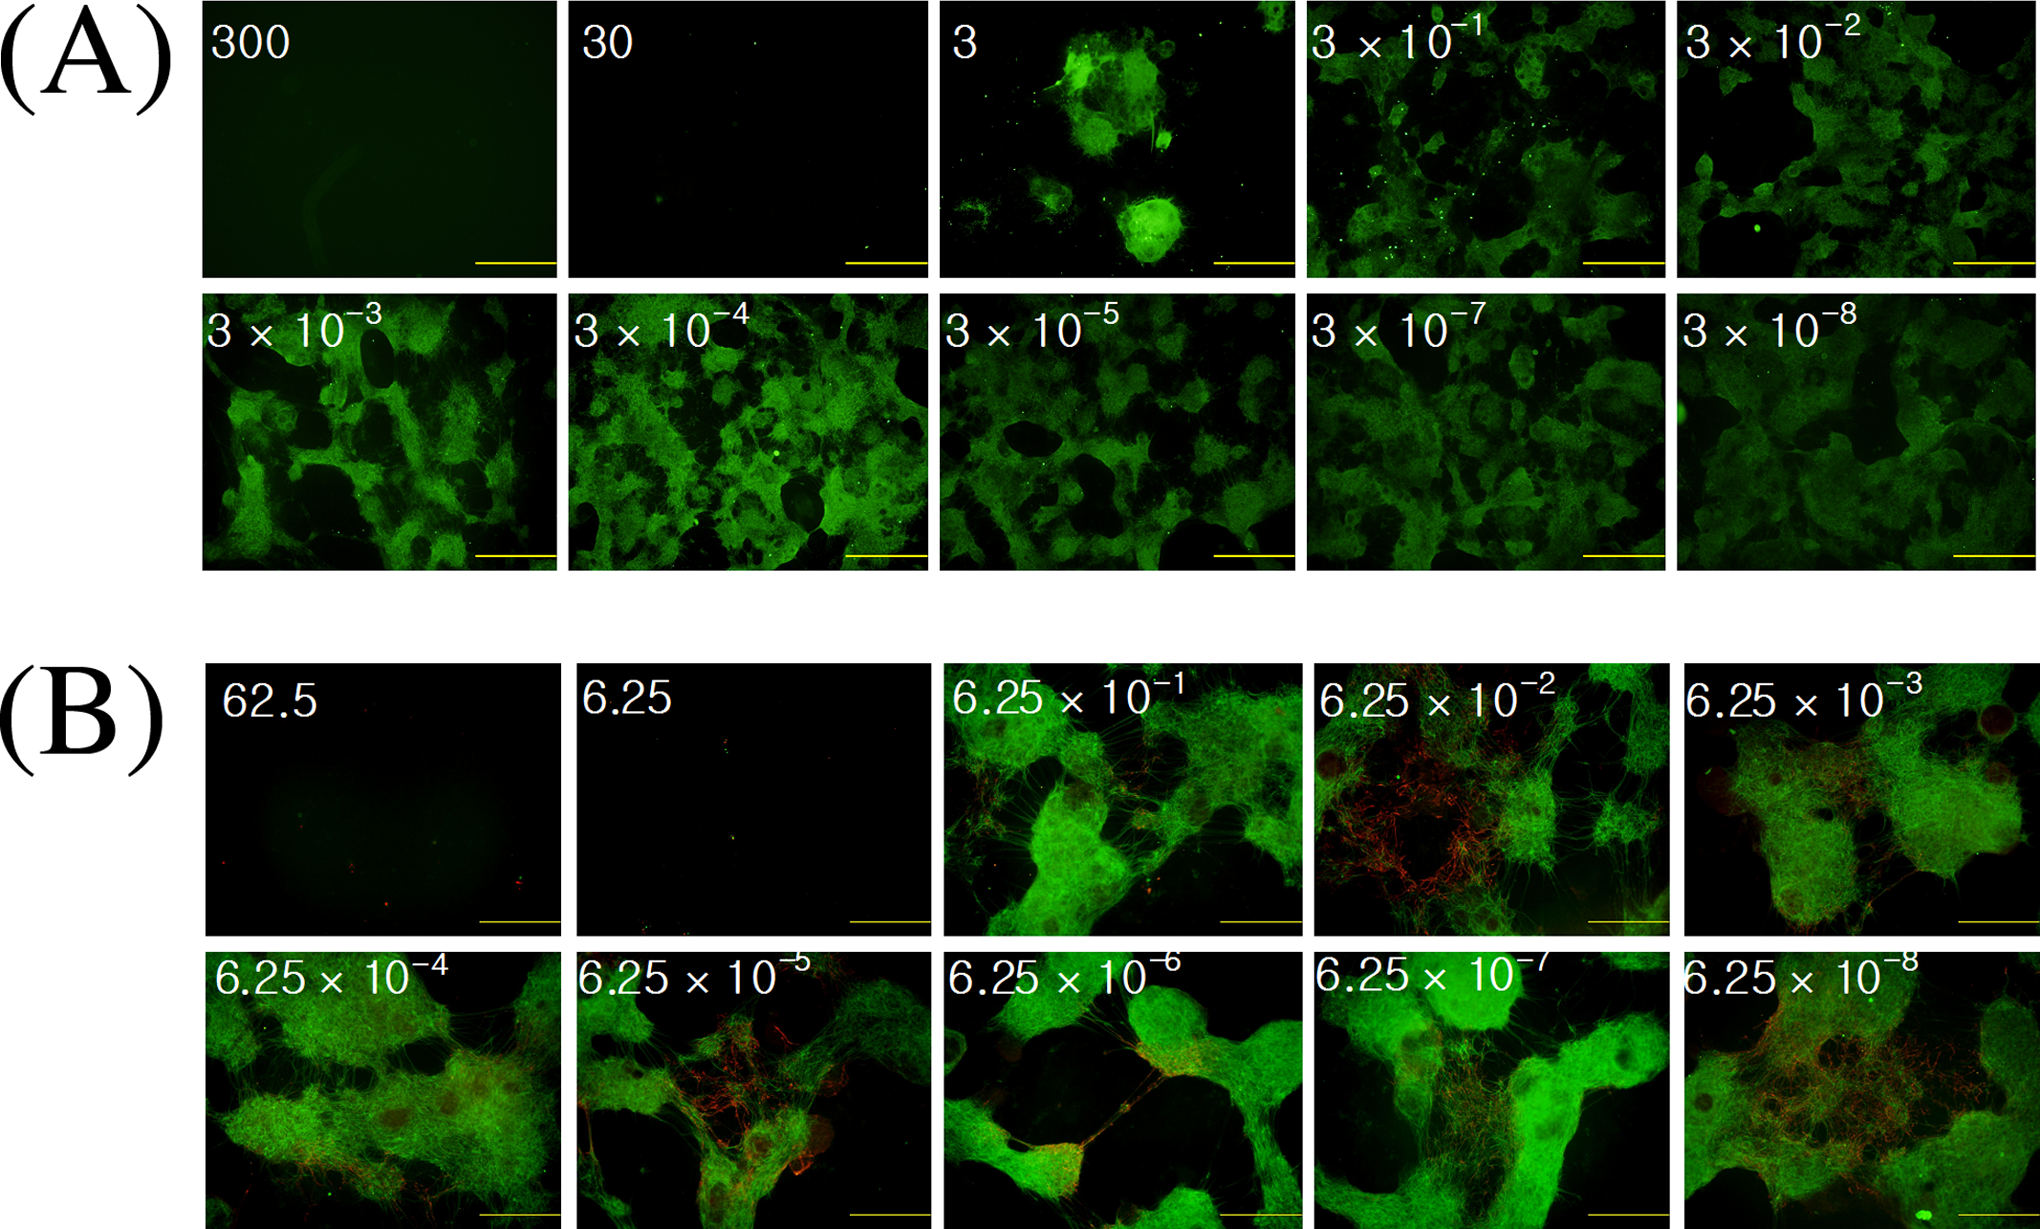
Immunofluorescence of microtubule-associated protein 2 (MAP-2) – positive cells after treatment with (A) lead (II) acetate or (B) Aroclor 1254. Number = concentration of toxicants (μg/mL). Scale bar = 1 mm.
In addition, flow cytometry analysis of MAP-2-positive cells and real-time PCR analysis of MAP2 mRNA were performed to confirm the ID50 of neuronal differentiation in the presence of 0.3 to 30 μg/mL of lead (II) acetate and 0.625 to 6.25 μg/mL of Aroclor 1254.
To quantify the inhibition of neuronal differentiation by increasing the concentrations of developmental neurotoxicants, we performed flow cytometry analysis of MAP-2-positive cells. In the presence of 0.3 to 10 μg/mL of lead (II) acetate, the percentage of MAP-2-positive cells increased relative to that of the vehicle control. However, most cells died in the presence of more than 13.95 μg/mL of lead (II) acetate. The ID50 value of lead (II) acetate was 12.75 (5.12; R 2 = .51; Figure 10A). In contrast, in the presence of 0.625 to 6.25 μg/mL of Aroclor 1254, the percentage of MAP-2-positive cells decreased relative to the vehicle control in a dose-dependent manner. The ID50 value of Aroclor 1254 was 3.21 (0.17) μg/mL (R 2 = .98; Figure 10B).
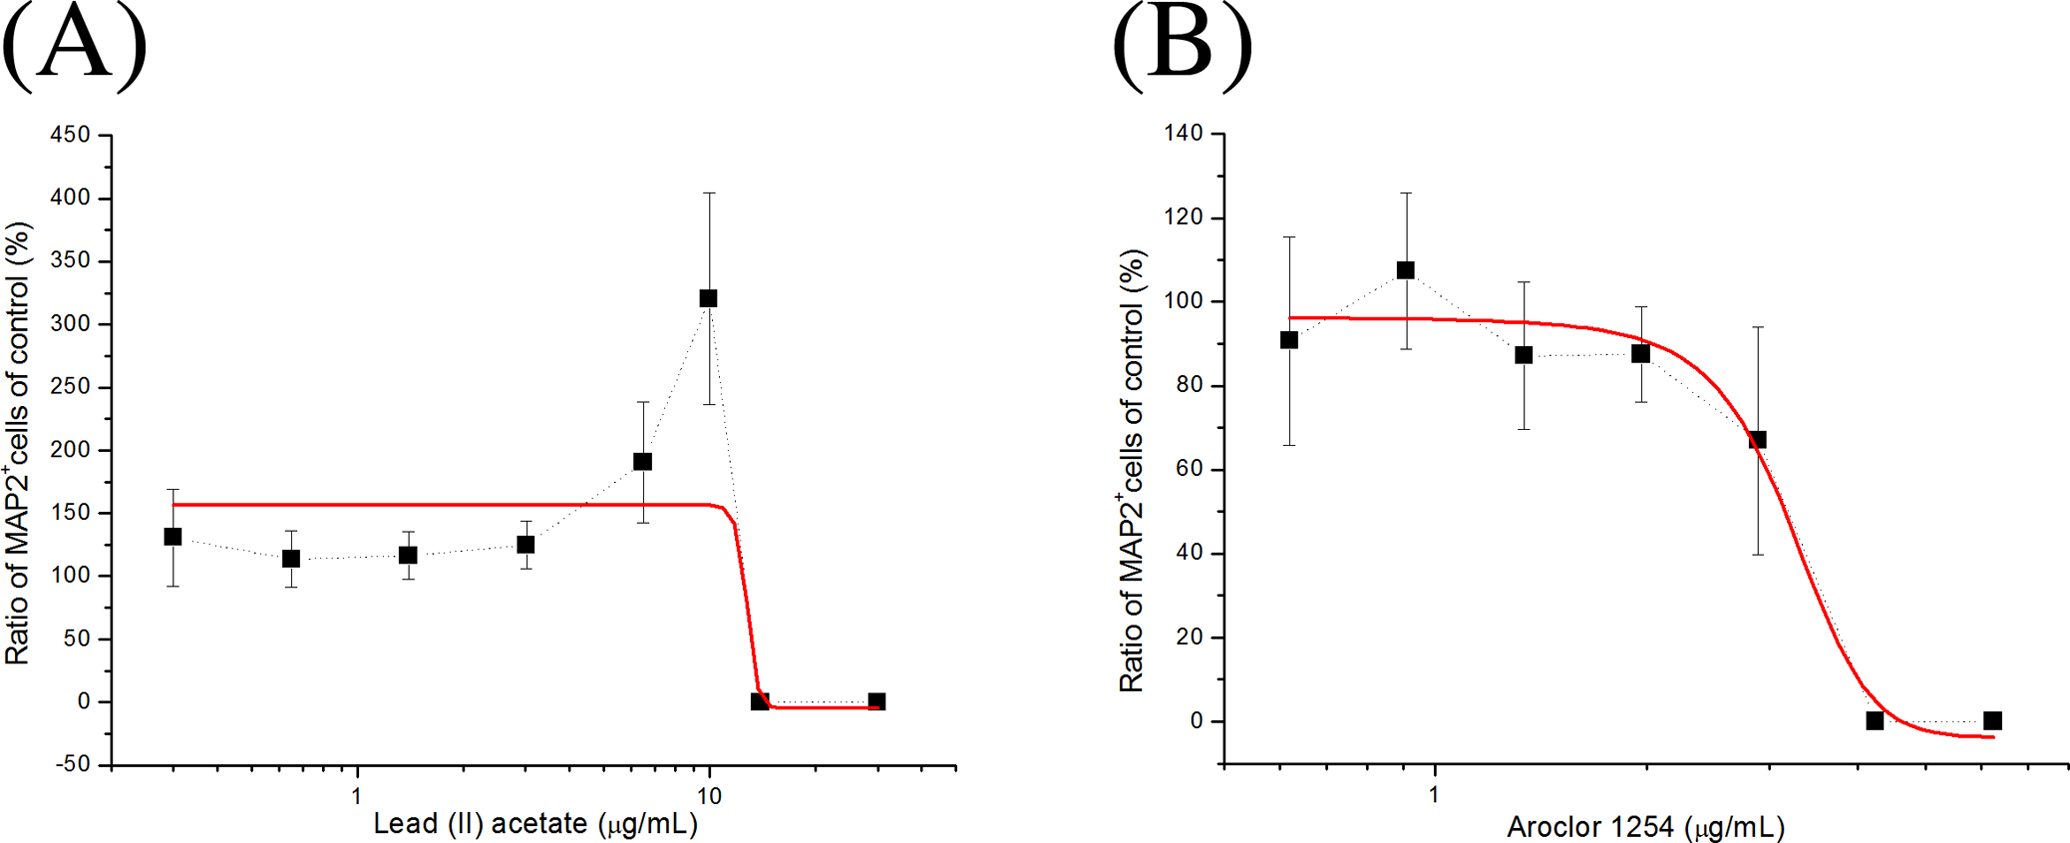
Dose–response curves of the percentage of microtubule-associated protein 2 (MAP-2) – positive cells after treatment with (A) lead (II) acetate or (B) Aroclor 1254. The dose range was 0.3 to 10 μg/mL for lead (II) acetate and 0.625 to 6.25 μg/mL for Aroclor 1254 (n = 3). The error bars indicate standard deviations. A solid red line of each graph indicates a best fitting line.
To confirm these ID50 values, we performed real-time PCR analysis of MAP2 mRNA. The relative amount of MAP2 mRNA increased by about 1.6 times in the presence of 0.3 to 3.02 μg/mL of lead (II) acetate but decreased in the presence of more than 6.42 μg/mL of lead (II) acetate. The ID50 of lead (II) acetate as determined by real-time PCR analysis was 5.09 (2.28) μg/mL (R 2 = .92; Figure 11A). Similarly, Aroclor 1254 also decreased the relative amount of MAP2 mRNA in a dose-dependent manner. Although the exact ID50 of Aroclor 1254 could not be calculated due to variations in the data, it was approximately 4.25 μg/mL (Figure 11B).
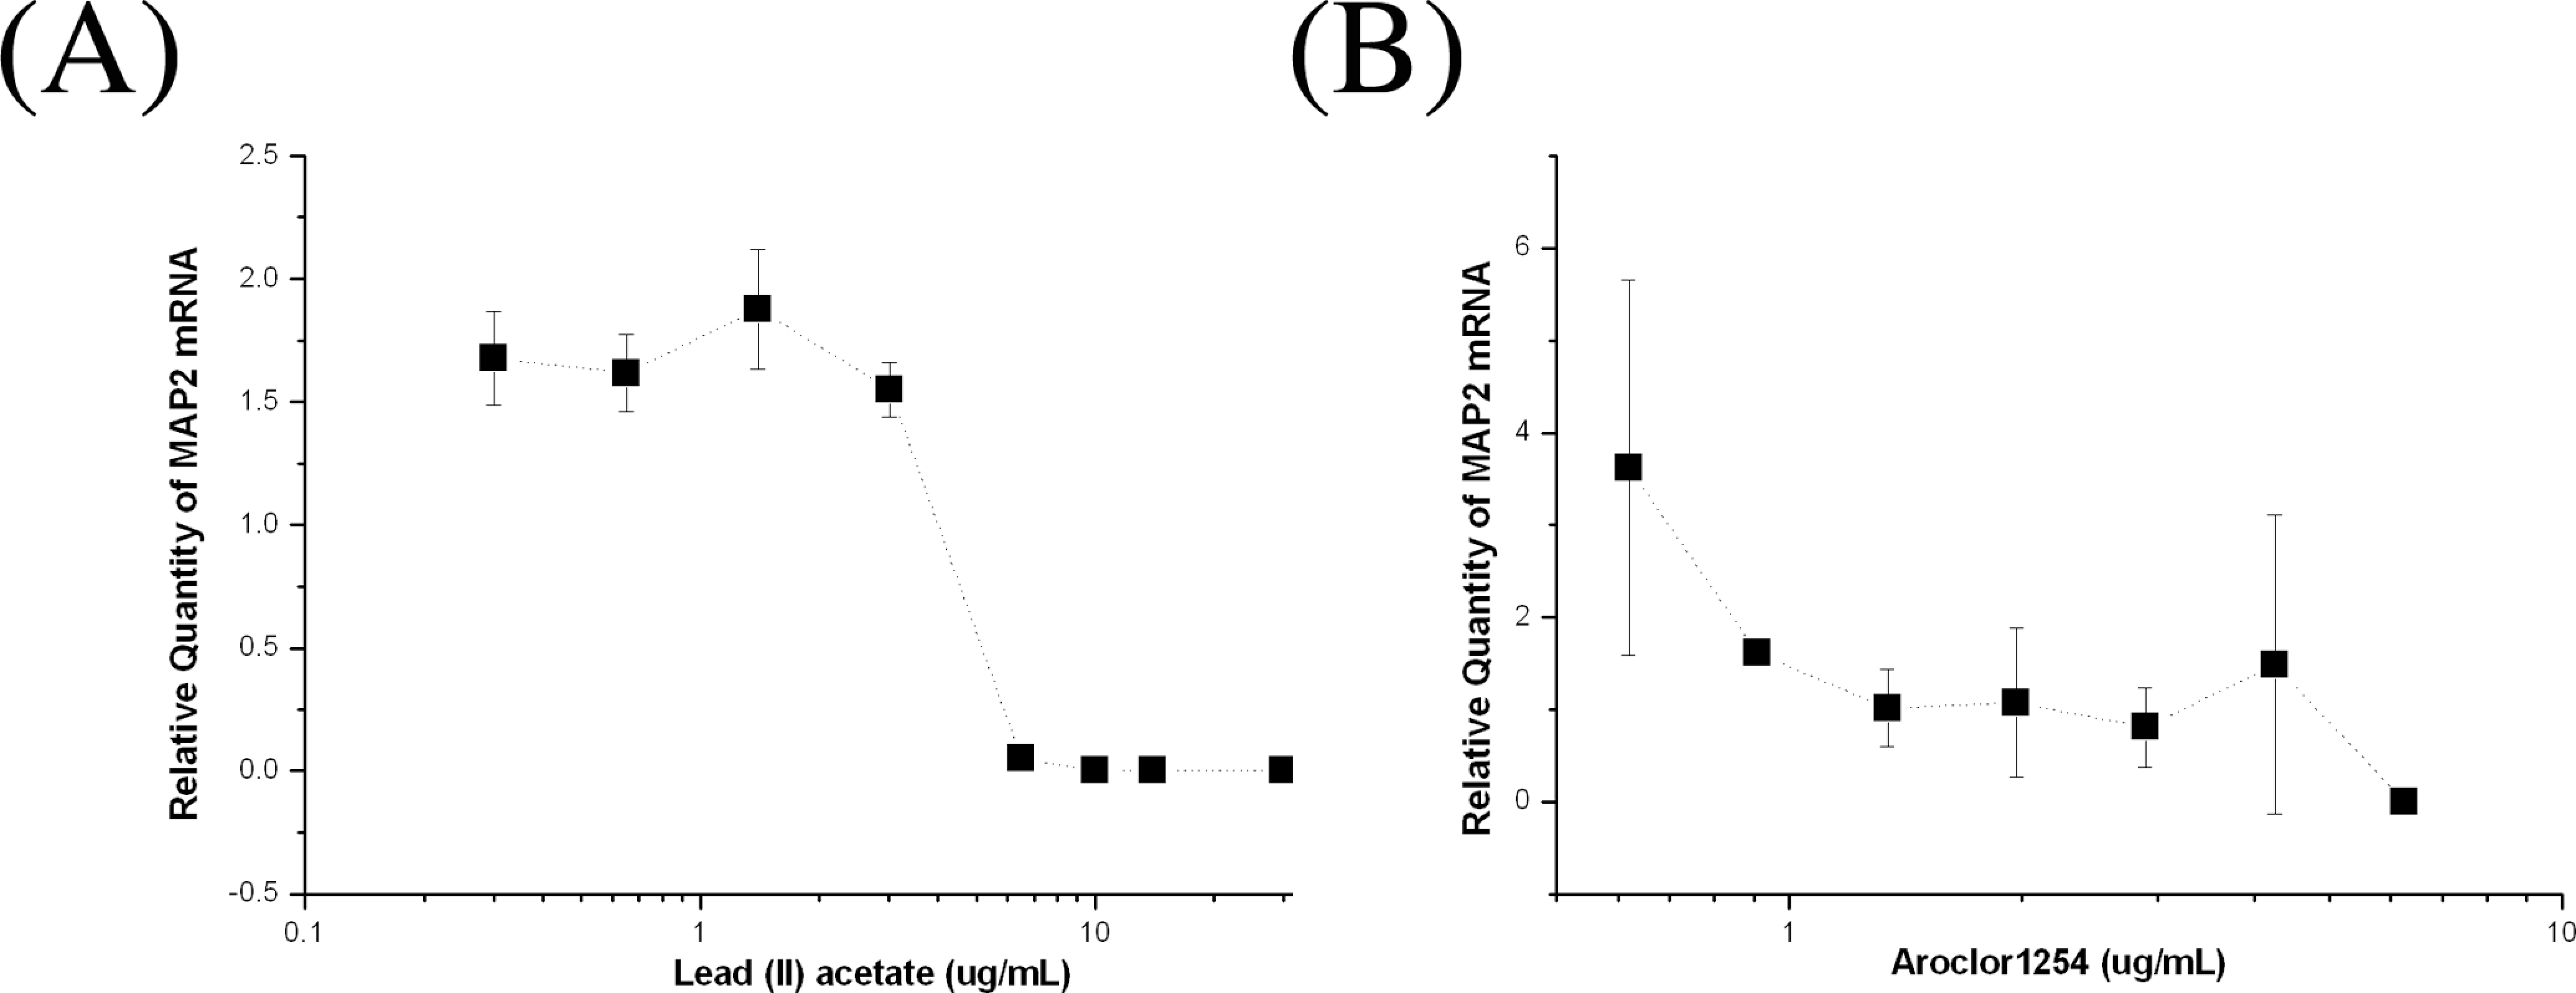
Real-time polymerase chain reaction analysis of microtubule-associated protein 2 (MAP2) mRNA expression in neuronally differentiated cells treated with (A) lead (II) acetate or (B) Aroclor 1254. The range of lead (II) acetate concentrations is 0.3 to 10 μg/mL and that of Aroclor 1254 is 0.625 to 6.25 μg/mL (n = duplicate × 2). The error bars indicate standard deviations.
When the neuronal ID50 values were used instead of the cardiac ID50 values in the EST, both lead (II) acetate and Aroclor 1254 were classified as weakly embryotoxic (class II; Table 2).
Discussion
In this study, we investigated whether the EST can predict the embryotoxicity of 2 representative developmental neurotoxicants, namely, lead (II) acetate and Aroclor 1254. The EST classified lead (II) acetate and Aroclor 1254 as class I (nonembryotoxic) and class II (weakly embryotoxic), respectively. These results indicated that the cardiac differentiation end point of the existing EST may not be suitable for screening some developmental neurotoxicants. Therefore, a new end point is needed. In a previous study, MAP-2, which is a neuron-specific marker for postmitotic neurons was used to develop an additional end point of the EST. 13 Recently, MAP2 mRNA expression also was reported to be a sensitive toxicological end point for methylmercury-induced neuronal embryotoxicity. 8 On the basis of these previous studies, we used the percentage of MAP2-positive cells and relative amount of MAP2 mRNA in neuronally differentiated mESCs as surrogate end points of the EST.
There are 3 methods of inducing neuronal differentiation in mESCs, namely, embryoid body-based differentiation, stromal feeder-based differentiation, and the default differentiation. 14 In monolayer neuronal differentiation, which is one of the default differentiation methods, ES cells are plated in a monolayer on gelatin-coated culture dishes, and then differentiated into neurons with N2B27 media. 15 We used this method in our study because it only requires 2 weeks to differentiate the mESCs into mature neurons and does not require hanging drops or embryoid bodies. 15 We optimized this method to increase the neuronal differentiation of D3 cells using N2B27 media with bFGF or ascorbic acid. In a previous study that used the embryoid body-based differentiation method, bFGF and ascorbic acid increased neuronal differentiation during the expansion stage (stage 4) and the differentiation stage (stage 5), respectively. 16 To distinguish between these stages, we examined the mRNA expression level of Sox1 during monolayer neural differentiation. Sex determining region Y-box 1 (Sox1) is a marker for undifferentiated neural precursor cells. 17 In this study, the mRNA expression level of Sox1 peaked between days 5 and 7, and then declined after day 9, which coincided with the onset of neuronal differentiation. Treatment with bFGF between days 5 and 7 and ascorbic acid between days 8 and 14 increased the efficiency of neuronal differentiation compared with the untreated cells. As a result, we used this optimized neuronal differentiation method in the modified EST for developmental neurotoxicity. However, the application of cytokines during differentiation may cause variations in the rate of differentiation because this differentiation method cannot clearly distinguish different differentiation stages. In this study, the percentage of MAP-2-positive cells that were differentiated by the vehicle control (N2B27 media with 0.1% distilled water) and treated with lead (II) acetate was 42.38% (17.25%; n = 3). This result suggested that the neuronal differentiation method can be further optimized to reduce variations in ID50 values.
Using immunocytochemistry, we showed that the completely differentiated cells were both MAP-2 positive and GFAP positive. This result indicated that this differentiation method can be used to screen not only toxicants that directly affect neurons but also those that indirectly affect neurons via glial cells. Related to this result, Rolletschek et al 18 showed that 1-methyl-4-phenyl-1,2,3,6-tetrahydropyridine (MPTP) neurotoxicity is mediated by astrocytic monoamine oxidase B activity.
We compared the usefulness of neuronal ID50 values as a surrogate end point for identifying developmental neurotoxicants with the existing end point, cardiac ID50 values, using 2 representative developmental neurotoxicants, namely, lead (II) acetate and Aroclor 1254. When lead (II) acetate was tested with this neuronal differentiation method, the percentage of MAP-2-positive cells increased at low concentrations (0.3-10 μg/mL) but decreased at high concentrations (13.95-30 μg/mL). This result suggested that different concentrations of lead (II) acetate have different mechanisms of action during neuronal differentiation of ES cells. The mechanism of lead toxicity is not fully understood; however, lead may interfere with calcium (Ca)-mediated cellular processes.19 –21 As a result, many studies have investigated the role of protein kinase C (PKC) in lead toxicity.22–24 For example, Lu et al 25 showed that lead increases DNA synthesis and cellular proliferation of human astrocytoma cells by activating PKCα. Similarly, Quilan et al 26 demonstrated that PKC activators increase the proliferation of mESCs in a dose-dependent manner. In addition, Sun et al 27 reported that Pb2+-activated PKCα at picomolar concentrations but inhibited all PKCs in the micromolar range. These findings suggest that low concentrations of lead can promote cell proliferation by activating PKCα, while higher concentrations of lead can inhibit cell proliferation by inhibiting PKCs. In this study, we observed that the percentage of MAP-2-positive cells increased in a dose-dependent manner at concentrations of lead (II) acetate that were less than 26.4 μmol/L but decreased at concentrations higher than 36.8 μmol/L (1 μmol/L lead [II] acetate = 0.379 μg/mL). This result suggested that low concentrations of lead may induce proliferation of undifferentiated ES cells and neural precursor cells. In addition, low cell density due to cell death might stimulate neuronal differentiation. Our flow cytometry data showed that the ID50 of lead (II) acetate was 10 to 13.95 μg/mL. Zurich et al 28 reported that 10−6 to 10−4 mol/L (0.379-37.9 μg/mL) of lead acetate was neurotoxic to immature rat neurons and glial cells. 28 Similarly, Oberto et al 29 reported that 50 to 100 μmol/L of lead induced neurotoxicity in newborn rat cerebellar neurons. These results suggest that the neurotoxicity of lead in ES cells and other immature neurons is similar.
In addition, we observed that Aroclor 1254 decreased the percentage of MAP-2-positive cells and relative amount of MAP2 mRNA. Unlike lead (II) acetate, Aroclor 1254 decreased the percentage of MAP-2-positive cells in a dose-dependent manner. These results suggested that lead (II) acetate and Aroclor 1254 may have different mechanisms of neurotoxicity. Although the mechanism of neurotoxicity of Aroclor 1254 is not completely understood, several previous studies have revealed that it disrupts Ca2+ homeostasis and Ca2+-mediated signal transduction. 30 The ID50 values of Aroclor 1254 from flow cytometry and real-time PCR analysis were about 3 μg/mL. These results showed that both of these methods can be used to quantitatively analyze developmental neurotoxicity.
Collectively, our results showed that much lower concentrations of lead (II) acetate and Aroclor 1254 inhibit neuronal differentiation than cardiac differentiation in the EST. The inhibition of differentiation was quantified using flow cytometry and quantitative real-time PCR analysis. As a result, a more sensitive end point for developmental neurotoxicants can be developed using an adherent monoculture differentiation method in the EST. However, further intra- and interlaboratory validation studies as well as tests of other chemicals are needed to establish the usefulness of the new surrogate end point.
In conclusion, we tested 2 representative developmental neurotoxicants, namely, lead (II) acetate and Aroclor 1254, in the EST and found that it did not correctly classify the embryotoxicity of lead (II) acetate. As a result, we have presented a new surrogate end point of the EST to more accurately classify developmental neurotoxicants using an adherent monoculture differentiation method to neuronally differentiate ES-D3 cells. If this end point can be validated, then it may improve the sensitivity and usefulness of the EST.
Footnotes
The author(s) declared no potential conflicts of interest with respect to the research, authorship, and/or publication of this article.
The author(s) disclosed receipt of the following financial support for the research, authorship, and/or publication of this article: Korea Food and Drug Administration (Grant No. 07151KFDA699).