
Abstract
The current study was designed to investigate the toxicity of 3Z-3-[(1H-pyrrol-2-yl)-methylidene]-1-(1-piperidinylmethyl)-1, 3-2H-indol-2-one (Z24), a novel synthetic indolin-2-ketone small molecule compound, using toxicogenomic techniques (complementary DNA [cDNA] microarray). Bioinformatic analysis suggested that the main functions of genes with altered expression were consistent with liver cell regeneration, apoptosis, metabolism of energy and fat, and the death receptor (DR)-mediated apoptosis-signaling pathway. Death receptor 4, Bcl-2, Bcl-xl, caspase 3, and cytochrome C, which are involved in the DR-mediated apoptosis-signaling pathway, were altered after Z24 treatment as determined by Western blotting analysis. When hepatocarcinoma cell line (HepG2 cells) treated with Z24 at 0.248 mmol/L for 24 hours, DNA fragmentation reached a maximum, and examination of cell morphology showed typical signs of apoptosis. These results indicate that Z24 can initiate apoptosis in hepatocytes, which in turn causes hepatotoxicity. A possible toxicological mechanism is that apoptosis was induced in hepatocytes by initiating the DR-mediated signal transduction pathway. Apoptosis of hepatocytes might lead to impairment of energy and lipid metabolism and provoke hepatocyte necrosis or inflammation, resulting in hepatotoxicity.
Keywords
Introduction
The development of novel approaches to high-throughput screening of chemical toxicity and investigation of toxicological mechanisms has become a major goal in drug development and environmental health research. The use of structural data, mutagenesis, and a host of other methods to predict the toxicology of chemical exposure have met with limited success. 1 Hence, a need exists to improve chemical toxicity prediction through such means as technologies focused on genomics, proteomics, and metabonomics. An advantage of the genomics-based approach is that gene expression analyses including studies intended to identify the toxicological mechanism of pharmaceutical agents or standard toxicants theoretically increase the chances of generating unique profiles associated with a chemical. 2 –4 Gene expression analysis has been applied to the identification of potential safety liabilities before other manifestations of toxicity have developed, such as changes reflected in clinical chemistry or histopathology. 5 –7 Additionally, there is evidence that toxicogenomics may be a valuable tool for bridging animals with humans in the study of toxicity. 8,9 However, despite these encouraging reports, the true value of toxicogenomics for use in the investigation of the toxicological mechanisms of drugs, especially new compounds in discovery phase, has yet to be studied thoroughly.
3Z-3-[(1H-pyrrol-2-yl)-methylidene]-1-(1-piperidinylmethyl)-1,3-2H-indol-2-one ([Z24]; Figure 1), a novel synthetic indolin-s-ketone compound, inhibited angiogenesis in new blood vessels, resulting in growth suppression of various types of tumors in vivo. 10 –12 Z24 is a structural analog of SU5416, which belongs to the indolin-2-ketones. A previous study hypothesized that Z24 had an anti-tumor effect similar to that of SU5416, 10 a tyrosine-kinase inhibitor targeted to the vascular endothelial growth factor (VEGF) receptor that was once considered to offer hope to many patients with cancer. 13,14 In this study, we analyzed the gene expression profile of hepatocarcinoma cell line (HepG2 cells) treated with the anti-angiogenesis compound Z24 using a complementary DNA (cDNA) microarray platform representing 1153 human genes. The results of cDNA microarray analysis were further verified in vitro to study the toxicological mechanism of Z24.
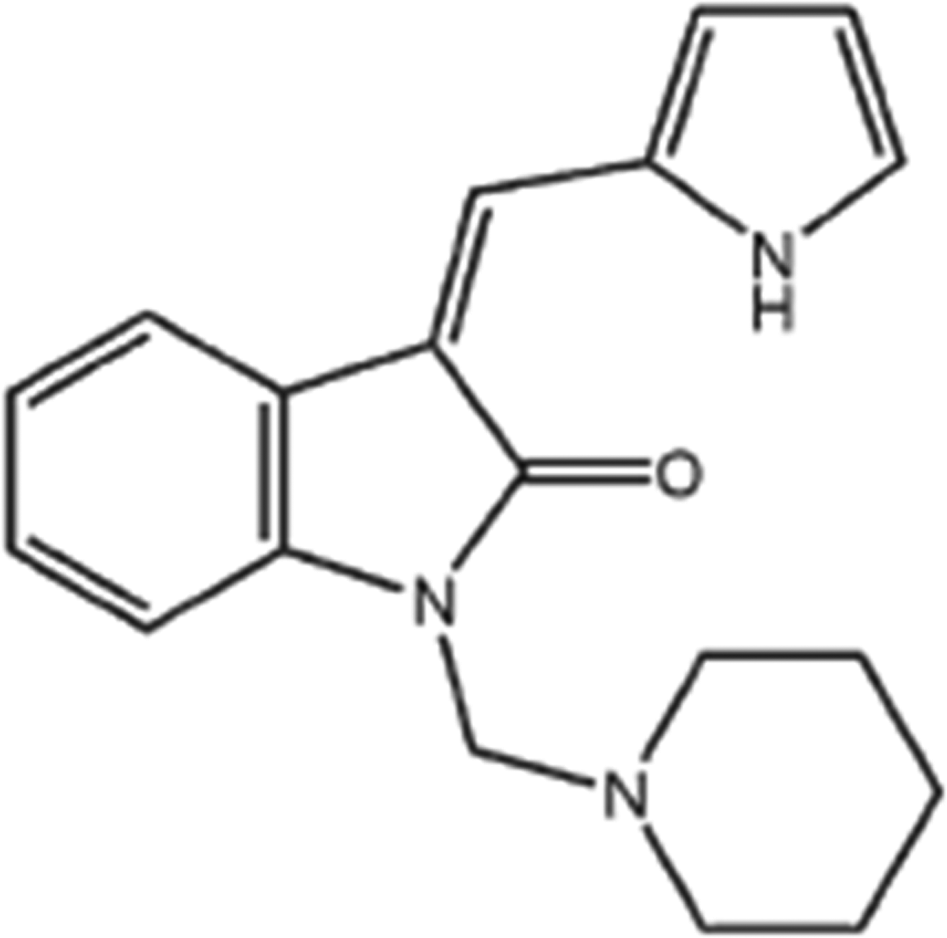
Chemical structure of Z24. Z24 indicates 3Z-3-[(1H-pyrrol-2-yl)-methylidene]-1-(1-piperidinylmethyl)-1, 3-2H-indol-2-one.
Materials and Methods
Materials
Z24 was provided by Dr Li of the Beijing Institute of Pharmacology and Toxicology, 15 at a purity >99.8% (Figure 1). The microarrays used in this study (1153 gene chips) were manufactured by the United Gene Holdings Group Co, Ltd (Shanghai, China). Antibodies to caspase 3, Bcl-2, Bcl-xl, death receptor 4 (DR4), nuclear factor kappa-light-chain-enhancer of activated B cells (NF-κB), Cyc, and actin and an electrogenerated chemiluminescence (ECL) staining kit were obtained from Santa Cruz (Delaware). The FastTrack 2.0 messenger RNA (mRNA) isolation kit was obtained from Invitrogen Life Technologies (California). All other drugs and chemicals, unless otherwise specified, were from Sigma (St Louis, Missouri).
Culture of HepG2 Cells
Human hepatoma HepG2 cells were purchased from the European Collection of Cell Cultures ([ECACC]; Porton Down, UK). HepG2 cells were routinely cultured in 175 cm2 dishes (Costar, Cambridge, Massachusetts) in Dulbecco Modified Eagle Medium (DMEM) supplemented with 10% (v/v) heat-inactivated fetal calf serum. Subculturing of HepG2 cells was performed using Trypsin/EDTA (Gibco California, USA).
Methyl Thiazolyl Tetrazolium Cytotoxicity Assay
HepG2 cells were seeded in round-bottomed 96-well plates at a density of 106 cells/mL and incubated overnight at 37°C in a 5% CO2 atmosphere. Cells were exposed to varying concentrations of Z24 diluted in DMEM for 24 hours, and the control cells treated with DMEM were included in each case. Following treatment, cells were washed with 200 μL of phosphate buffered saline (PBS) prior to the addition of 200 μL of methyl thiazolyl tetrazolium ([MTT]; 0.5 mg/mL, 37°C) and incubated at 37°C in 5% CO2 for 3 hours. Unreacted MTT was removed from the wells, and 200 μL of isopropanol was added. The microtiter plates were then shaken gently for 1 minute prior to being read at 570 nm on a microplate reader. Cytoviability was expressed as the percentage of cell survival compared with the untreated control. Five replicates were used per treatment.
Dosing of HepG2 Cells
HepG2 cells were seeded in 175 cm2 dishes at a density of 2 × 10⁶ cells/mL and incubated overnight at 37°C in 5% CO2. On reaching confluence, the cells were treated with Z24 (0.248 mmol/L and 0.786 mmol/L) for 24 hours. Concentrations of Z24 were chosen as being representative of 20% and 50% cell death as determined by MTT assay. 16 Five dishes of HepG2 cells were used per treatment.
Construction of Microarrays, mRNA Isolation, and Probe Preparation
The microarrays used in this study (comprising 1153 genes that were chosen from the literature as being relevant to hepatotoxicity and apoptosis) were constructed following Brown method. 17 The 1153 sequences on the microarrays consisted of full-length and partial cDNAs representing novel, known, and control genes provided by United Gene Holdings, Ltd. The known genes were selected from the National Center for Biotechnology Information (NCBI) Unigene data sets and cloned into a plasmid vector. The novel genes were obtained through systematic full-length cloning efforts carried out at United Gene Holding, Ltd.
Following the appropriate incubation period, HepG2 cells were washed several times in PBS and scraped into 5 mL of PBS per dish. The replicate dishes for each treatment were divided into 2 parts, combined into separate pools, and centrifuged at 2000g to pellet the cells. Cells were then lysed and mRNA extracted using the FastTrack 2.0 mRNA isolation kit according to the manufacturers' instructions. Extracted mRNA was treated with DNAse prior to use.
The fluorescent cDNA probes were prepared by reverse transcription of the isolated mRNAs and then purified according to the methods of Schena. 18,19 The RNA samples from the control cells were labeled with Cy3-dUTP (Deoxyuridine Triphosphate) and those from the experimental cells were labeled with Cy5-dUTP. The 2 labeled probes were then mixed, precipitated with ethanol, and dissolved in 20 µL of hybridization solution (5 × SSC [standard saline citrate] [0.75 mol/L NaCl and 0.075 mol/L sodium citrate], 0.4% sodium dodecyl sulfate [SDS], 50% formamide, and 5× Denhardt solution [0.1% Ficoll, 0.1% polyvinylpyrrolidone, and 0.1% BSA]).
Hybridization and Washing
Microarrays were prehybridized with hybridization solution containing 0.5 mg/mL of denatured salmon sperm DNA at 42°C for 6 hours. Fluorescent probe mixtures were denatured at 95°C for 5 minutes, and the denatured probe mixtures were applied to the prehybridized chip under a cover glass. The microarray was hybridized at 42°C for 15 to 17 hours before being washed at 60°C for 10 minutes each in solutions of 2× SSC and 0.2% SDS, 0.1 × SSC, and 0.2% SDS and 0.1× SSC, then dried at room temperature.
Detection and Data Analysis
The microarrays were scanned with a ScanArray 3000 (GSI Lumonics, Billerica, Massachusetts) at 2 wavelengths to detect emission from both Cy3 and Cy5. The acquired images were analyzed using ImaGene 3.0 software (BioDiscovery, Inc, Los Angeles, California). The intensities of each spot at the 2 wavelengths represented the quantity of Cy3-dUTP and Cy5-dUTP, respectively, hybridized to each spot. Ratios of Cy5 to Cy3 were computed for each location on each microarray. Overall intensities were normalized with a correction coefficient obtained using the ratios of 40 housekeeping genes. Genes were identified as differentially expressed if the absolute value of the natural logarithm of the ratios was >0.69. To minimize artifacts arising from low expression values, only genes with raw intensity values for both Cy3 and Cy5 of >800 counts were chosen for differential analysis. To improve the accuracy of the data, the experiment was repeated by labeling the same RNA template in 2 separate reactions. Only data points that were reproducible were used. This method allowed the generation of high-quality data for the 2 dose groups. Prior to clustering, ratio values from duplicate experiments were averaged, log-transformed (base 2), and stored in a table. We applied hierarchical clustering to both axes, using the weighted pair-group method with a centroid average as implemented by the program CLUSTER (Michael B. Eisen: http://www.microarrays.org/software.html). 20 The distance matrices used were the Pearson correlation for clustering the arrays and the inner product of vectors normalized to magnitude 1 for the genes (a slight variation of the Pearson correlation).
Signal and Metabolism Pathway Analysis of Genes With Altered Expression
The Basic Local Alignment Search Tool (BLAST) algorithm 21 was used to match all gene sequences showing altered expression in microarray analysis with the genome’s protein sequences in 2 databases, the Cell Signaling Networks Database ([CSNDB]; http://geo.nihs.go.jp/csndb/) 22 and the Kyoto Encyclopedia of Genes and Genomes database ([KEGG]; http://www.genome.ad.jp/kegg/). 23 Matches were considered to meet the acceptance criteria if the E-value was not equal to 0.0 24 and the signal and metabolism pathway in which the changed genes are involved could be found in the CSNDB or KEGG database.
Reverse Transcription−Polymerase Chain Reaction
Complementary DNA (1 μL) was amplified in a total volume of 30 μL containing 50 mmol/L KCL, 1.5 mmol/L MgCl2, 10 mmol/L Tris-HCl pH 8.3, 200 μmol/L deoxynucleotide triphosphates, 1 U of Taq polymerase, and 0.3 μmol/L of each primer. For quantitative analysis, cDNAs were diluted and the polymerase chain reaction (PCR) cycles were adjusted empirically for each gene to ensure that the PCR products reflected the exponential phase of DNA amplification. Under these conditions, the amount of product was proportional to the input cDNA. Polymerase chain reaction was performed using a DNA thermal cycler (Perkin-Elmer, Massachusetts, USA) with the following parameters: 94°C for 1 minute, 55°C for 1 minute, and 72°C for 1 minute, usually for 33 cycles, followed by a final extension at 72°C for 7 minutes. Polymerase chain reaction products were electrophoresed on a 1.8% agarose gel, stained with ethidium bromide, and photoscanned (Bio-1D; Bio-Rad, Beijing, China). Bands were analyzed and quantified using Bio-1D software Version 1.1. All signals were normalized against β-actin, which was amplified from the same dilution series.
The primers were designed using Primer Express (r) software (Applied Biosystems, Foster City, California) and custom-made (Bioasia Co Ltd). Primers producing a single product that could be visualized on a 2% agarose gel were as follows: DR4 (forward primer CATCCTGGAGCCTGTAACCG, reverse primer CAGAGACGAAAGTGGACAGCG); phorbol-12-myristate-13-acetate-induced protein 1 ([PMAIP1]; forward primer GCAAGAACGCTCAACCGAG, reverse primer CCGCCCAGTCTAATCACAGG); tumor necrosis factor receptor superfamily ([TNFRSF5]; forward primer GTCTCACCTCGCTATGGTTCG, reverse primer GATGGCAAACAGGATCCCG); epidermal growth factor receptor ([EGFR]; forward primer GTGTGCAGATCGCAAAGGG, reverse primer GGGCACGGTAGAAGTTGGAGT); chemokine (C-X-C motif), receptor 4 ([CXCR4]; forward primer GGCAGCAGGTAGCAAAGTGAC, reverse primer GAAGGCCAGGATGAGGACAC); and β-actin (forward primer CGCGAGAAGATGACCCAG, reverse primer GGCCATCTCTCTTGCTCGAAG).
Cell Morphology and DNA Fragmentation Analysis
Cell morphology was examined using hematoxylin and eosin (H&E) staining and electron microscopy. A quantitative DNA fragmentation assay was carried out using the method of Sellins and Cohen. 25,26 Briefly, after Z24 treatment, cells were incubated at 1 to 5 × 10⁶/mL tissue culture medium (TCM) for various lengths of time in 24-well Costar plates (Costar). The cells were harvested by centrifugation at 2000g for 10 minutes. The pellet was lysed with 0.4 mL hypotonic lysis buffer (10 mmol/L Tris, 1 mmol/L EDTA, pH 7.5) containing 0.2% Triton X-100 and the lysates were centrifuged at 13 000g for 10 minutes to separate intact and fragmented chromatin. The supernatant containing fragmented DNA was placed in a separate microfuge tube, and both pellet and supernatant were precipitated overnight at 4°C in 12.5% trichloroacetic acid. The precipitates were sedimented at 13 000g for 4 minutes.
DNA Quantitation
The DNA in the precipitates was hydrolyzed by heating to 90°C for 10 minutes in 80 μL of 5% trichloroacetic acid and was quantitated by a modification of the diphenylamine (DPA) method of Burton. 27 Briefly, 0.16 mL of DPA reagent (0.15 g DPA, Fisher Scientific, Fairlawn, New Jersey), 0.15 mL sulfuric acid, and 0.05 mL of acetaldehyde (16 mg/mL stock)/10 mL of glacial acetic acid was added to each tube. After overnight color development, 0.2 mL of each sample was transferred to wells of a 96-well flat-bottomed plate, and optical density was read at 570 nm in a 1420 Multilabel counter (Perkin Elmer Co).
The “percentage fragments” was calculated as the ratio of DNA contained in the supernatant after centrifugation at 13 000g to the total DNA recovered in both the supernatant and pellet after centrifugation at 13 000g.
Western Blotting
Cells treated with Z24 were collected by centrifugation at 2000g for 10 minutes and lysed with lysis buffer containing protease inhibitors. Total cellular proteins were separated by 12% sodium dodecyl sulfate−polyacrylamide gel electrophoresis (SDS-PAGE) and transferred to Polyvinylidene fluoride (PVDF) membranes which had been blocked for 2 hours at room temperature with 5% nonfat dry milk in blotting solution (20 mmol/L Tris-HCl, pH 7.5, 150 mmol/L NaCl, and 0.1% Tween 20). The PVDF membranes were incubated for 2 hours at room temperature with primary antibody. The membranes were washed 3 times for 10 minutes each with 1% nonfat milk in blotting solution, and incubated for 1 hour at room temperature with secondary antibody conjugated to horseradish peroxidase. The membranes were washed 4 times for 20 minutes each with blotting solution. Protein−antibody interactions were visualized by adding a chemiluminescent reagent after which the membranes were exposed to Kodak film. β-actin, a housekeeping protein, was used as a loading control and analyzed following the same procedure.
Preparation of Cytosolic Fraction for Assessment of Cytochrome C
To estimate mitochondrial cytochrome c release, cytosolic protein extracts (S-100) were obtained. After treatment with Z24, cells were washed twice with PBS. The cell pellets were allowed to swell in 500 µL of ice-cold buffer (containing 20 mmol/L 4-(2-hydroxyethyl)-1-piperazineethanesulfonic acid [HEPES], pH 7.5, 10 mmol/L KCl, 1.5 mmol/L MgCl2, 1 mmol/L EDTA, 1 mmol/L ethyleneglycol bis(2-aminoethyl ether)tetraacetic acid [EGTA], 1 mmol/L dithiothreitol, and 1 mmol/L phenylmethyl sulfonylfluoride [PMSF]), and stand on ice for 20 minutes. The cells were then homogenized with homogenizer, and centrifuged at 100 000g for 60 minutes, and the supernatant was stored at −80°C until further analysis. Cytochrome C levels in the resulting supernatant were analyzed by immunoblotting as described above.
Statistical Analysis
Values were expressed as the mean ± SD. Statistical comparisons were made using analysis of variance (ANOVA) followed by Newman-Keul multiple comparison test. A value of P < .05 was chosen as the limit for statistical significance.
Results
Methyl Thiazolyl Tetrazolium Cytotoxicity Assay
HepG2 cells were exposed to concentrations of Z24 ranging from 0.01 mmol/L to 10 mmol/L. Figure 2 shows that the cell damage induced by Z24 was dose-dependent. Following 24-hour treatment with Z24, 20% cell death was observed with 0.248 mmol/L Z24, and 50% cell death was observed with 0.786 mmol/L Z24. Therefore, we used these 2 concentrations for microarray analysis based on the previous literature. 16
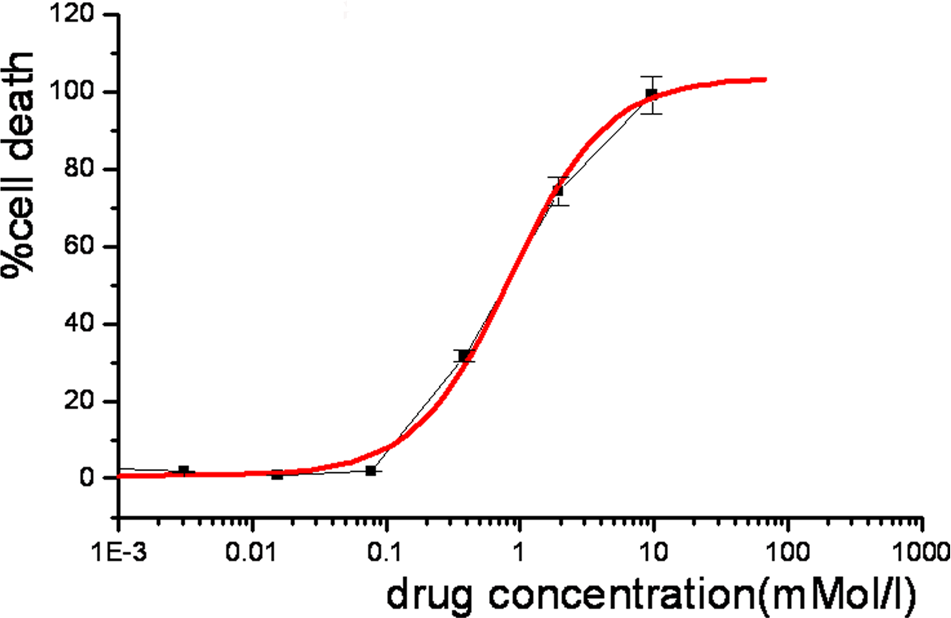
Results of the cytotoxicity assay of HepG2 cells treated with Z24 over 24 hours. HepG2 indicates hepatocarcinoma cell line; Z24, 3Z-3-[(1H-pyrrol-2-yl)-methylidene]-1-(1-piperidinylmethyl)-1, 3-2H-indol-2-one.
Microarray Analysis
To study the underlying mechanism of Z24-mediated toxicology, Z24-treated HepG2 cells or control samples were analyzed on 1153-gene microarrays. Each dose group was hybridized to 2 replicate arrays.
Dunnett test, a commonly used statistical test in toxicology, was applied to the microarray data to determine statistical differences between compound-treated groups and controls. The Dennett test and a 95% confidence interval were used to minimize false negative results. Using HepG2 cells treated with Z24 at the concentrations described above, the expression of 15 genes was significantly altered compared with controls at a Z24 concentration of 0.248 mmol/L (Supplementary Table 1). The number of genes with altered expression increased to 244 at a Z24 concentration of 0.786 mmol/L, including 109 genes that were upregulated and 135 genes that were downregulated (Supplementary Table 2).
Signal and Metabolic Pathway Analysis
Using the Basic Local Alignment Search Tool (BLAST), 21 we identified several biological processes and signal pathways that were affected at the 2 concentrations of Z24. Supplementary Tables 1 and 2 show the number of genes whose expression was modulated in each experiment. The affected genes were mainly involved in the cell cycle, apoptosis, amino acid metabolism, energy metabolism, nucleotide metabolism, and liver function.
Validation of cDNA Microarray Data by RT-PCR a
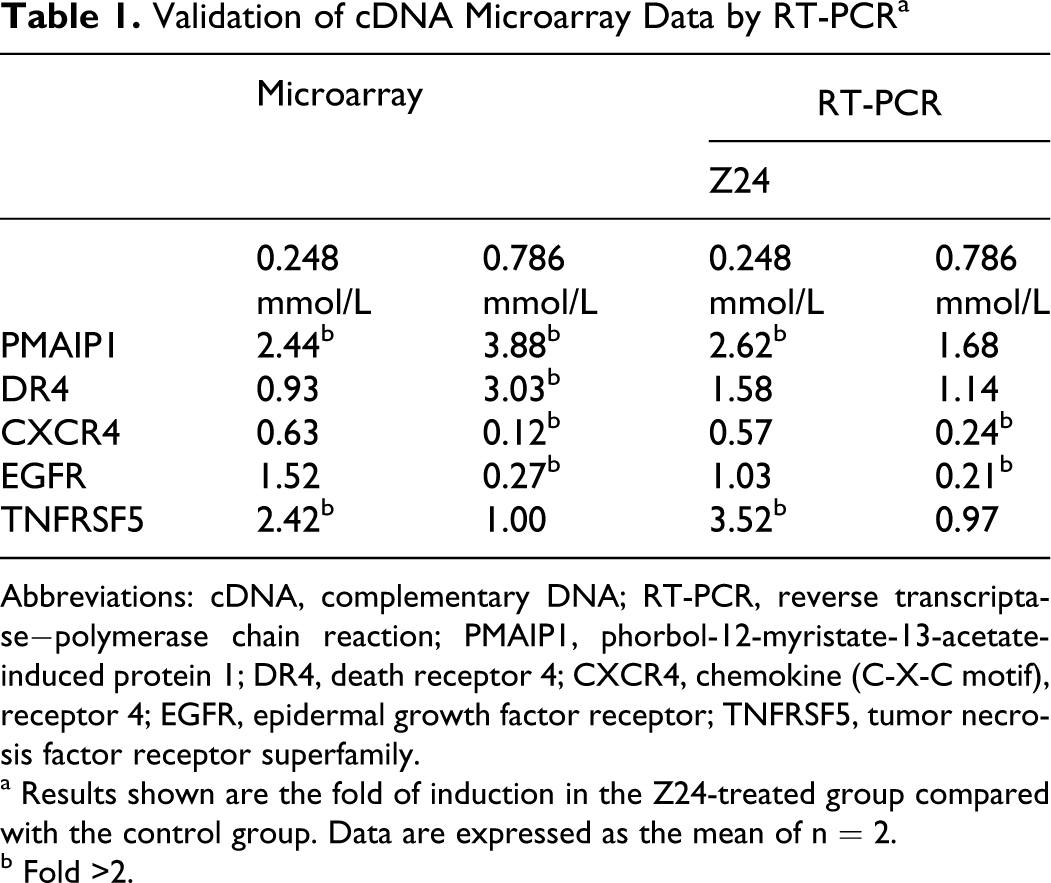
Abbreviations: cDNA, complementary DNA; RT-PCR, reverse transcriptase−polymerase chain reaction; PMAIP1, phorbol-12-myristate-13-acetate-induced protein 1; DR4, death receptor 4; CXCR4, chemokine (C-X-C motif), receptor 4; EGFR, epidermal growth factor receptor; TNFRSF5, tumor necrosis factor receptor superfamily.
a Results shown are the fold of induction in the Z24-treated group compared with the control group. Data are expressed as the mean of n = 2.
b Fold >2.
Z24-Induced DNA Fragmentation in HepG2 Cells a
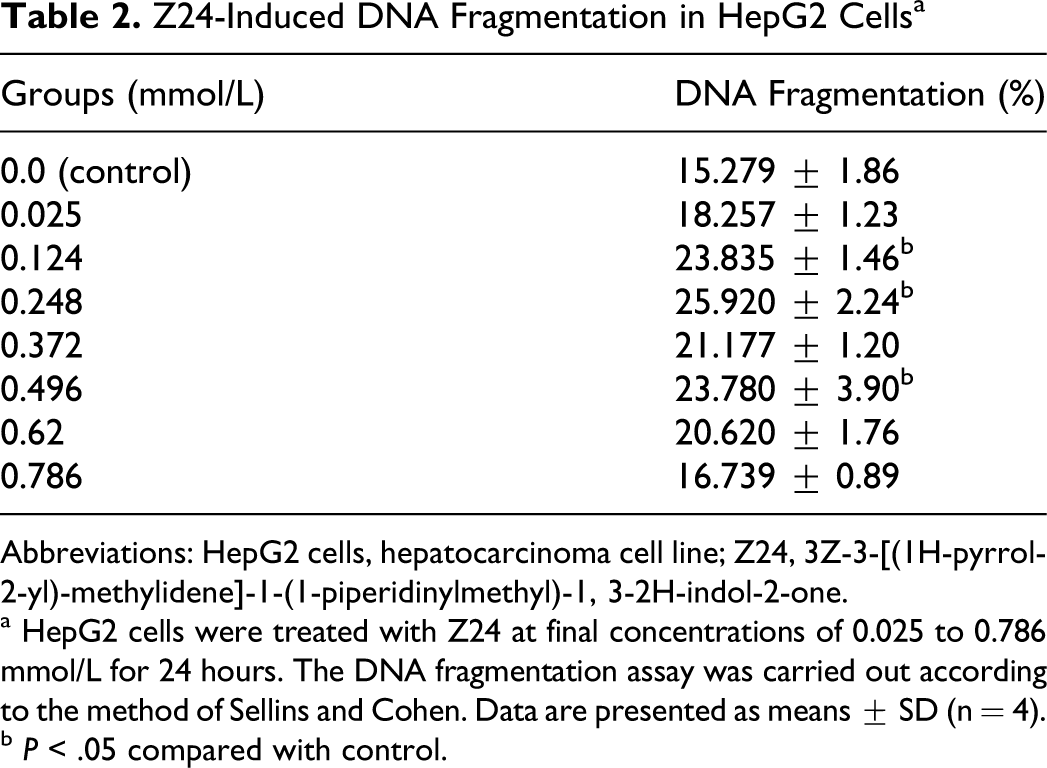
Abbreviations: HepG2 cells, hepatocarcinoma cell line; Z24, 3Z-3-[(1H-pyrrol-2-yl)-methylidene]-1-(1-piperidinylmethyl)-1, 3-2H-indol-2-one.
a HepG2 cells were treated with Z24 at final concentrations of 0.025 to 0.786 mmol/L for 24 hours. The DNA fragmentation assay was carried out according to the method of Sellins and Cohen. Data are presented as means ± SD (n = 4).
b P < .05 compared with control.
The main signaling pathways affected included apoptosis, immune function, cell growth, and calcium ion channel signaling. Genes involved in the apoptosis pathway were catenin (CAD), DR4 (TNFRSF10A), and survival of motor neuron 2, centromeric (SMN), and CD40 was a gene involved in immune function; genes involved in the cell growth pathway were cathepsin S (CTSS), mitogen-activated protein kinase 14 (MAPK14), phospholipase-C, and spleen tyrosine kinase (SYK); those in the phosphatidylinositol-3-kinase (PI3K-PKB) pathway were CTSS, MAPK14, MADH4, and those in the calcium ion channel pathway were phospholipase C-γ-1 (PLC-γ-1) and PL-C. According to the classification system of CSNDB, the genes with altered expression belonged to 16 different pathways, and genes in the DR-mediated apoptosis pathway acted as connecting points to the other pathways.
In analyses using the KEGG database, the main alterations in gene expression occurred in genes belonging to metabolic pathways involving glycolysis/gluconeogenesis, the citrate cycle (TCA cycle), the urea cycle, and metabolism of amino groups, arginine and proline, oxidative phosphorylation, C21-steroid hormone metabolism, and inositol phosphate metabolism. A larger proportion of genes with altered expression were involved in pathways involving energy metabolism, including the glycolysis and lipid metabolism pathways, rather than in other pathways.
Gene Expression Validation
In the current study, the gene expression data was validated using replicates in microarray analysis and also using the real-time PCR assay, which was used to confirm changes in the 5 genes identified by microarray analysis (PMAIP1, DR4, TNFRSF5, EGFR, and CXCR4).
The results of the real-time PCR assay agreed with the microarray results (Table 1). According to both analyses, the expression level of PMAIP1, TNFRSF5, EGFR, and CXCR4 was significantly increased by Z24. Changes in DR4 expression were less prominent in the results of microarray analysis than in those observed using real-time PCR (Table 1). Although the same gene was analyzed using both methods, the lack of consistency between the 2 methods was not surprising because the specific sequences assessed may have been different. It was apparent that most of the results of the real-time PCR assay confirmed the results observed with microarrays.
Z24 Induces Apoptosis in HepG2 Cells
Examinations of DNA fragmentation and observation of cell morphology with light and electron microscopy consistently revealed that Z24 induced apoptosis of HepG2 cells, showing that cells treated with Z24 underwent prominent cytoplasmic aggregation, nuclear condensation, and fragmentation, which are typical features of apoptosis (Figure 3B and Figure 4B and C). Nonrandom DNA fragmentation is regarded one of the typical end results of apoptosis. 28 Table 2 illustrates that the DNA fragmentation induced by Z24 was concentration-dependent; DNA fragmentation increased when concentrations of Z24 increased to 0.496 mmol/L in 24hours, but DNA fragmentation was decreased if the concentration of Z24 was over 0.496 mmol/L.
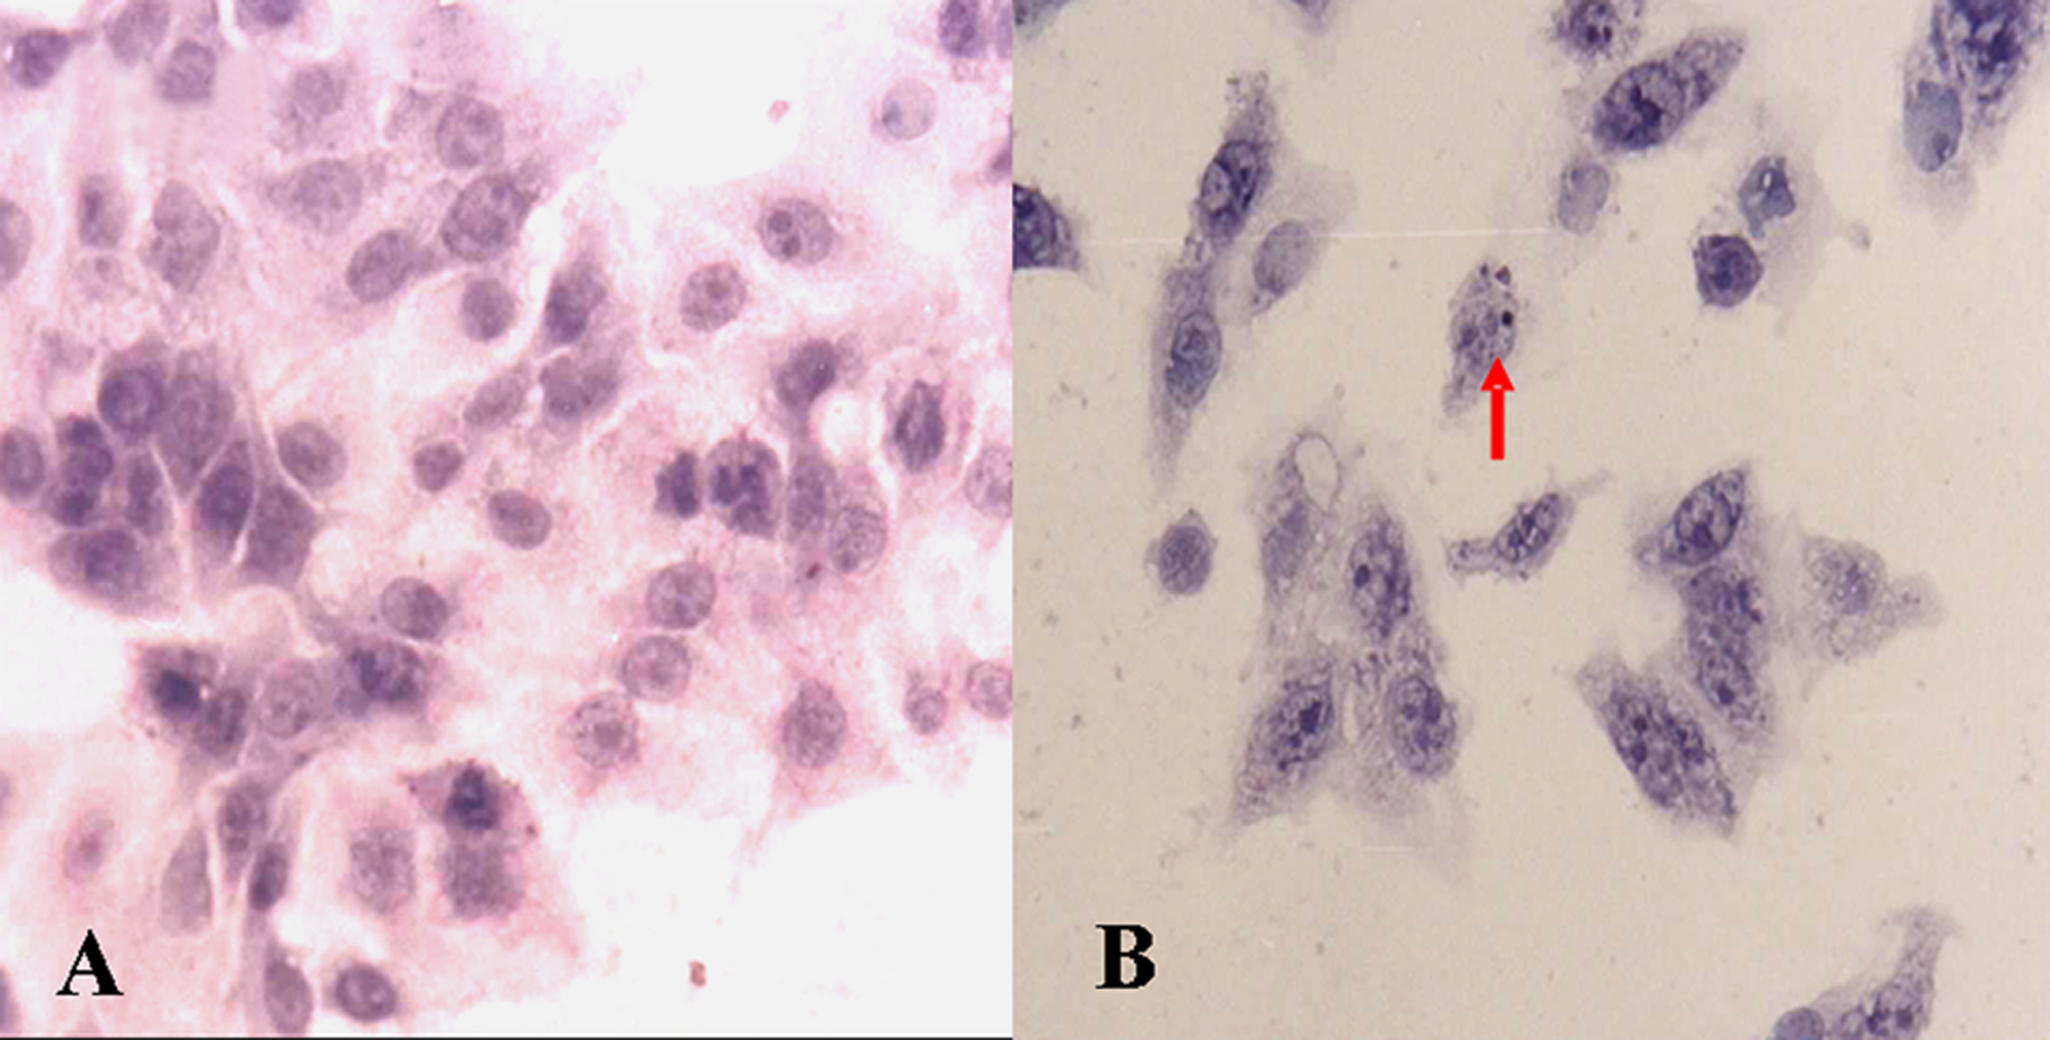
Microscopic examination of HepG2 cell morphology after Z24 treatment (×20, H&E). A, Control. B, Cells treated with 0.248 mmol/L Z24 for 24 hours. Note the formation of apoptotic bodies (indicated by the arrow). HepG2 indicates hepatocarcinoma cell line; Z24, 3Z-3-[(1H-pyrrol-2-yl)-methylidene]-1-(1-piperidinylmethyl)-1, 3-2H-indol-2-one; H&E, hematoxylin and eosin.
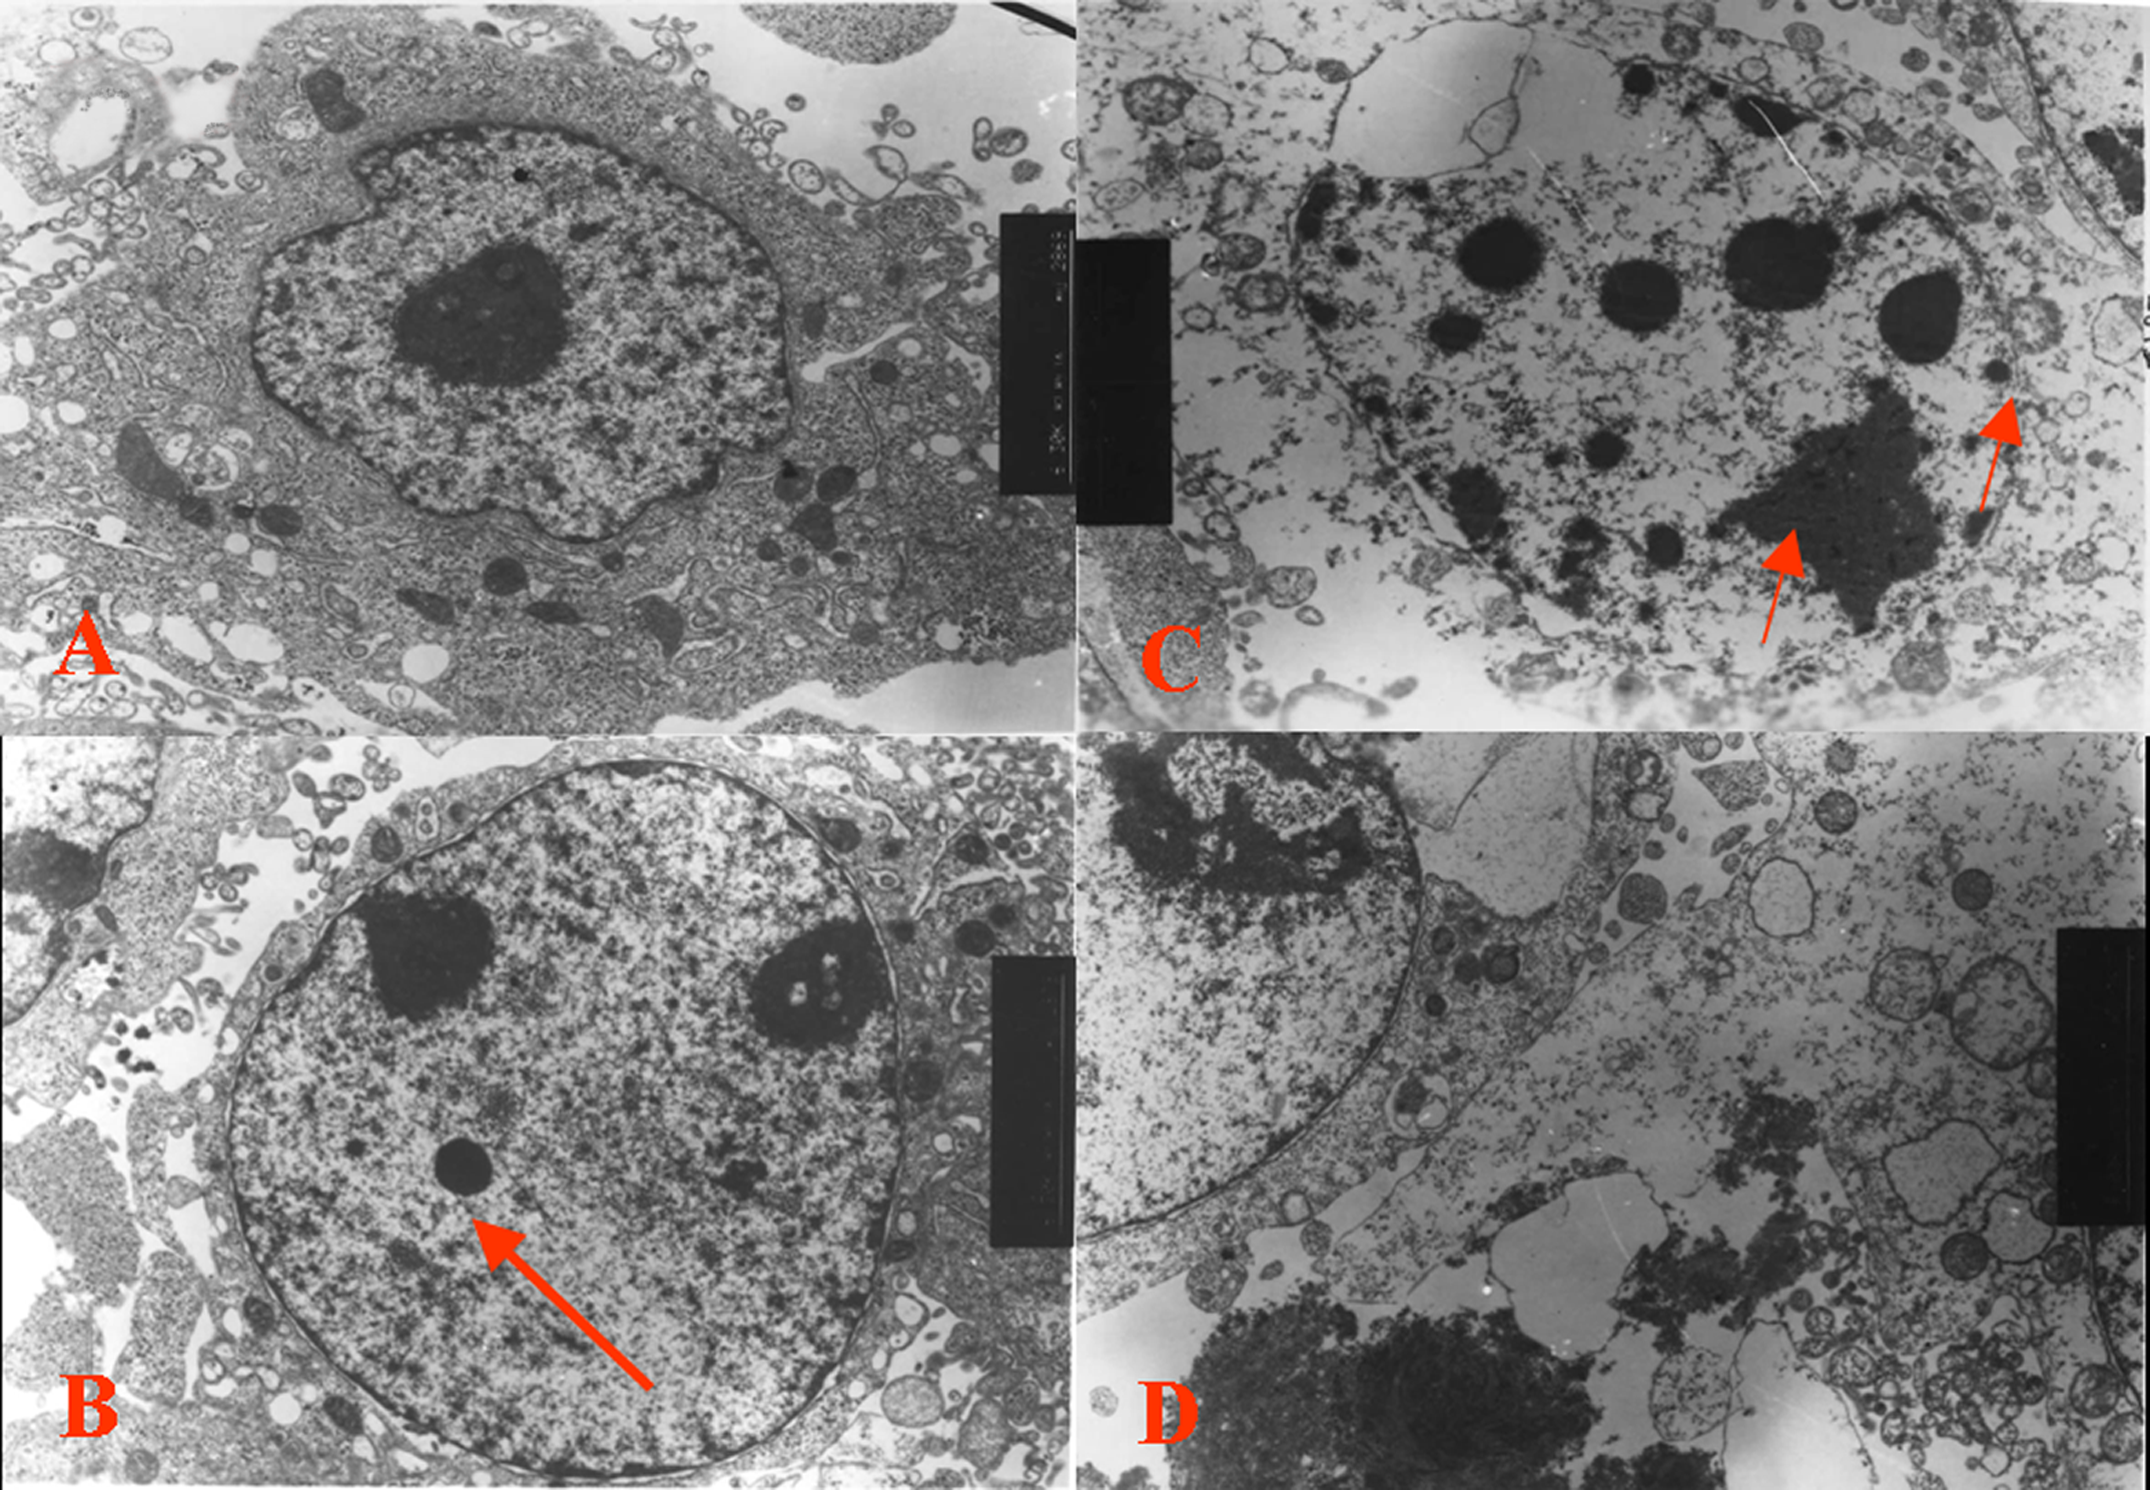
Electron micrographs of HepG2 cells after Z24 treatment. A, Control. B, Cells treated with 0.248 mmol/L Z24 for 24 hours. Note the nuclear condensation. C, Cells treated with 0.496 mmol/L Z24 for 24 hours. Note the loss of cytoplasmic volume, degradation of the cytoskeleton, and nuclear condensation. D, Cells treated with 0.786 mmol/L Z24 for 24 hours. Note the prominent chromatin condensation present in these cells (indicated by the arrows). HepG2 indicates hepatocarcinoma cell line; Z24, 3Z-3-[(1H-pyrrol-2-yl)-methylidene]-1-(1-piperidinylmethyl)-1, 3-2H-indol-2-one.
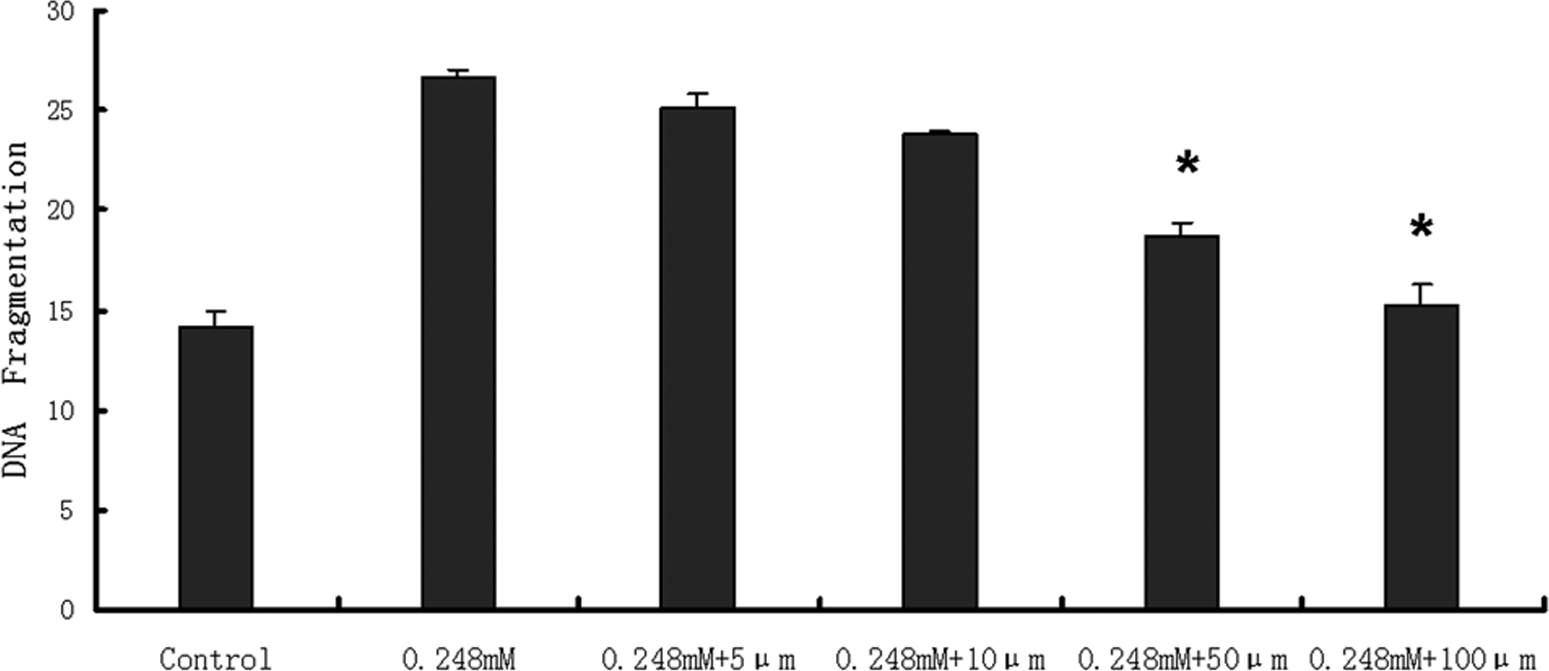
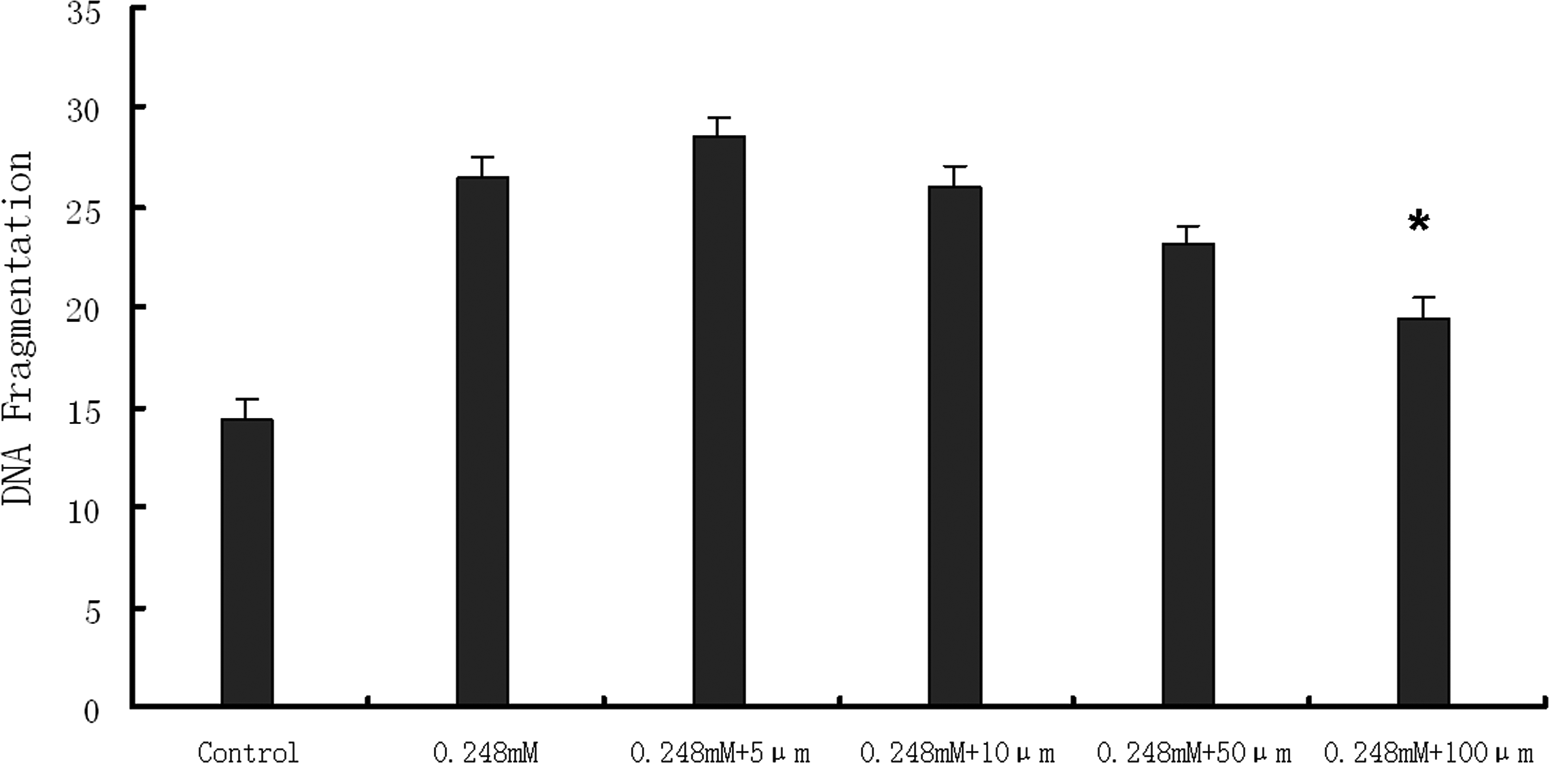
Because DNA fragmentation reached a maximum when HepG2 cells were treated with Z24 at 0.248 mmol/L, we used that concentration in assays examining the effects of caspase inhibitors on Z24-induced DNA fragmentation. First, Z-VAD-FMK (caspase inhibitor 1), a broad-spectrum, irreversible caspase inhibitor, was used, which almost completely inhibited Z24-induced DNA fragmentation at 100 µmol/L concentration (Figure 5); caspase 3 inhibitor (Z-DEVD-FMK) also prevented DNA fragmentation (Figure 6). However, caspase inhibitor 1 was more effective than caspase 3 inhibitor at the same concentration (Figure 6). These results demonstrated that Z24-induced apoptotic cell death was partly caspase-dependent.
The effect of caspase inhibitor 1 (Z-VAD-FMK) on DNA fragmentation induced by Z24. After 2 hours of preincubation with caspase inhibitor 1 at various doses, HepG2 cells were treated with 0.248 mmol/L Z24. DNA fragmentation assays were carried out according to the method of Sellins and Cohen. Data are presented as means ± SD (n = 3). *P < .05 compared with 0.248 mmol/L (n = 3). HepG2 indicates hepatocarcinoma cell line; Z24, 3Z-3-[(1H-pyrrol-2-yl)-methylidene]-1-(1-piperidinylmethyl)-1, 3-2H-indol-2-one.
The effect of caspase 3 inhibitor (Z-DEVD-FMK) on DNA fragmentation induced by Z24. After 2 hours of preincubation with caspase 3 inhibitor at various doses, HepG2 cells were treated with 0.248 mmol/L Z24. DNA fragmentation assays were carried out according to the method of Sellins and Cohen. Data are presented as means ± SD (n = 3). *P < .05 compared with 0.248 mmol/L. HepG2 indicates hepatocarcinoma cell line; Z24, 3Z-3-[(1H-pyrrol-2-yl)-methylidene]-1-(1-piperidinylmethyl)-1, 3-2H-indol-2-one.
Western Blotting Results
After HepG2 cells were treated with Z24 at the indicated concentrations (0.248 and 0.786 mmol/L) for 24 hours, cell proteins were extracted and separated by SDS-PAGE. Expression of proteins involved in the DR-mediated signaling pathway (DR4), Cyc (cytochrome c), caspase 3, Bcl-xl, Bcl-2, and NF-κB) was analyzed by immunoblotting. Results showed that expression of Bcl-xl significantly decreased in a concentration-dependent manner; however, the expression of NF-κB, cytochrome c, and DR4 significantly increased. Caspase 3 activation was detected in extracts of Z24-treated cells, as determined by measurement of the active forms (p17/20) of caspase 3 (Figure 7). 29
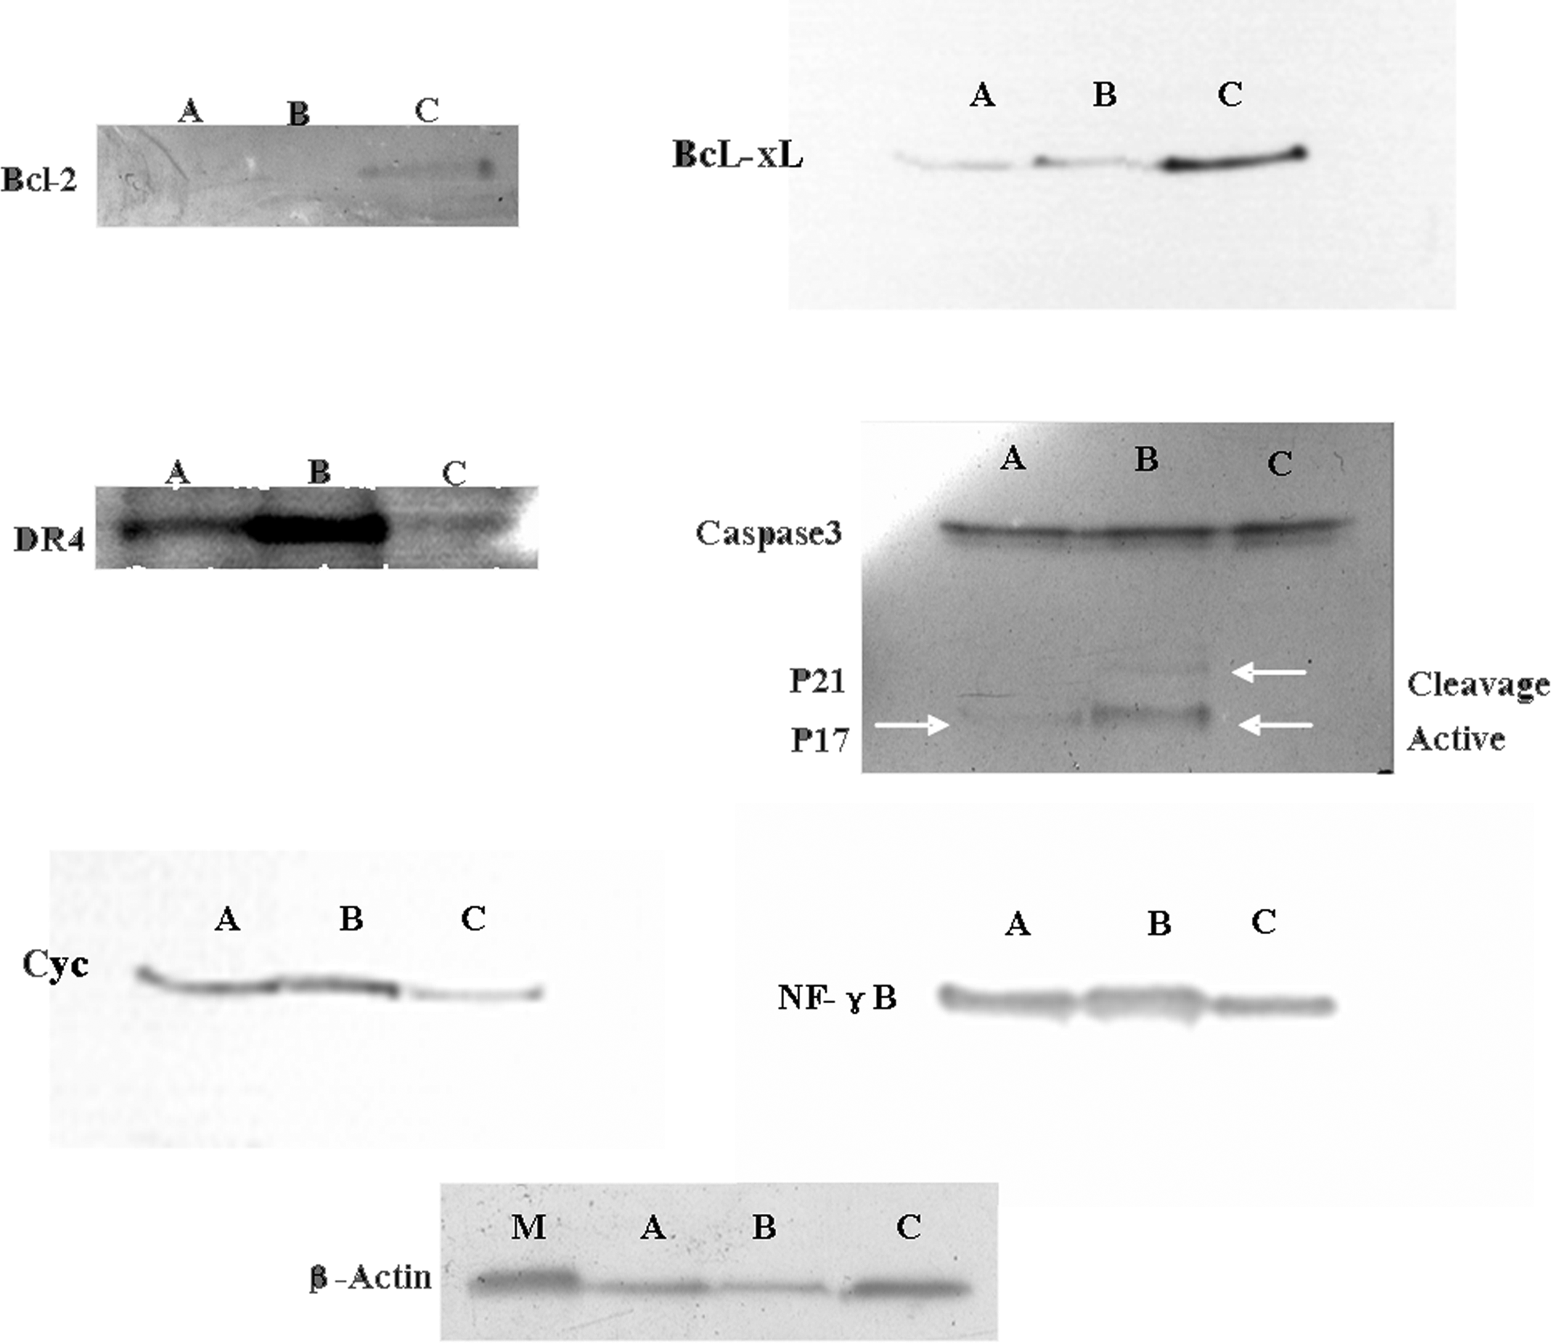
The expression of several proteins belonging to the DR-mediated signaling pathway after Z24 treatment. A, Cells treated with 0.248 mmol/L Z24 for 24 hours. B, Cells treated with 0.786 mmol/L Z24 for 24 hours. C indicates control cells; M, β-actin standard; DR, death receptor; Z24, 3Z-3-[(1H-pyrrol-2-yl)-methylidene]-1-(1-piperidinylmethyl)-1, 3-2H-indol-2-one.
Discussion
Toxicogenomic technologies are more frequently used to further investigate compounds whose toxicity has been identified to some extent than to predict the toxicity of new compounds and investigate their toxicological mechanisms. In this study, we used a cDNA platform representing 1153 genes that were chosen from the literature as being relevant to toxicity to study the gene expression profile of HepG2 cells after Z24 treatment and to predict the toxicity of Z24, a novel synthetic indolin-s-ketone compound, and to investigate its toxicological mechanism.
We found that Z24 altered the expression level of approximately 300 HepG2 genes by at least 2-fold. These findings imply that the cellular adaptation to Z24 was notably complex and was associated with changes in gene expression. Through CLUSTER and BLAST analysis of these changed genes (as described in detail elsewhere), 20 we found that Z24 toxicity was primarily associated with liver cell regeneration, apoptosis, and metabolism of energy and fat (Supplementary Tables 1 and 2).
Among the upregulated genes, TNFRSF5, DNA fragmentation factor, beta polypeptide (caspase-activated DNase [DFFB]), caspase 6, and DR4 are associated with apoptosis. MGST3, GPX3, NQO1, COX8, and GAD67 are related to amino acid and glutathione metabolism, and oxidative phosphorylation. The TNFRSF5 gene belongs to the apoptosis signaling pathway and plays a role in transducing extracellular apoptosis signals by activating intracellular enzymes. DFFB is a DNA lyase, whose overexpression would intensify DNA fragmentation. 30 Caspase 6 is a protease that plays a key role in apoptosis. The higher the expression of caspase 6, the more apoptosis will occur. 31 DR4 induces apoptosis by binding to death domains. 32
We also observed downregulation of some genes including NCKAP1 (NCK-associated protein 1), BNIP3 (BCL2/adenovirus E1B 19kD-interacting protein 3), PKM2 (pyruvate kinase, muscle), ATP6B2 (ATPase, H+ transporting, lysosomal (vacuolar proton pump), beta 56/58 kDa, isoform 2), LDHA (Lactate dehydrogenase A), AKR1C2 (aldo-keto reductase family 1, member C2) and INSIG1 (insulin induced gene 1) after Z24 treatment. NCKAP1 and BNIP3 are genes whose expression pattern is associated with apoptosis; PKM2, ATP6B2, and LDHA are genes related to gluconeogenesis and energy metabolism. It was reported that the apoptosis pathway was initiated when NCKAP1 expression decreased. 33 Similarly to Bcl-2, low expression of BNIP3 results in shifting the balance of apoptosis-related factors toward preapoptosis. 34 INSIG1 and AKR1C2 genes are closely associated with liver function. 35
The alteration of expression levels of INSIG1, PHKA2 (phosphorylase kinase, alpha 2 [liver]), and HPX (hemopexin) genes associated with liver function suggests that treatment with Z24 might have a significant impact on liver function. 35 In CSNDB analysis, the primary signaling pathway affected by Z24 treatment was DR-mediated apoptosis signaling. The DR4 (death receptor 4) and caspase 6 genes belong to this pathway. Death receptors are involved in the regulation of apoptosis and often appear in hepatotoxicity pathways. 36 Using the KEGG database, the main pathway altered was the energy metabolism pathway (including the citrate cycle and oxidative phosphorylation). Based on our cDNA microarray analysis, we hypothesize that Z24 initiates liver cell apoptosis by activating the DR-mediated signaling pathway and inducing energy metabolism impairment, which results in liver necrosis and hepatotoxicity. One of the main mechanisms of drug-induced liver injury is DR-mediated hepatocyte apoptosis. 36 The signaling pathway of DR-mediated hepatocyte apoptosis might be activated by the binding of oligomers to DRs on the cell surface. A “priming” or “upstream” caspase (such as caspases 2, 8, and 9) might activate apoptosis because of the binding of overexpressed DR4 and Apo2L. 37,38 Caspase 3, an “effective” or “downstream” caspase 38 may directly degrade protein if it is activated by an upstream caspase or Cyc released from mitochondria. 39 –41 Overexpressed DR4 may activate NF-κB. 42 Previous studies have suggested that all (or most) of the cytochrome c in mitochondria could be released during apoptosis. 43 Bcl-2 family members, including proapoptotic (Bax and Bid) or antiapoptotic (Bcl-2 and Bcl-xl) proteins, play a vital role in the regulation of the mitochondrial apoptotic pathway. 44 Here, we showed that the expression of DR4 protein was increased and the expression of Bcl-2 was inhibited by treatment with Z24 (Figure 7). Z24 is a potential Bcl-2 inhibitor, as suggested by computational screening based on the 3-dimensional (3D) protein structure of Bcl-2. 11 HepG2 cells contain a low level of Bcl-2 and a much higher level of Bcl-xl, another antiapoptotic factor of the same family. 45 When the cells were exposed to Z24, the level of Bcl-xl diminished. After the DR-mediated signaling pathway was activated, Cyc was released from mitochondria, caspase 3 was activated, and apoptosis occurred in HepG2 cells (Figures 3, 4, and 7). Z24 also caused the release of cytochrome c from mitochondria and the activation of caspase 3. Caspases can also activate some factors that lead to DNA fragmentation. 46 Nonrandom DNA fragmentation is regarded one of the typical end results of apoptosis. 28 Studies have shown that caspase 3 plays a critical role in the DNA fragmentation induced by apoptosis. 47 In the current study, the observation that the caspase inhibitor Z-DEVD-FMK markedly reduced the degree of DNA fragmentation induced by Z24 clearly demonstrated that caspases play an important role in Z24-induced apoptosis. The results discussed above provide support for the hypothesis that Z24 initiates liver cell apoptosis by activating the DR-mediated signal pathway.
The involvement of metabolic pathways identified by microarray analysis has been confirmed in rats by metabonomic techniques, 48 suggesting that Z24 inhibited mitochondrial function in rats by altering energy and lipid metabolism, which resulted in the accumulation of free fatty acids and lactate due to the lack of aerobic respiration. Some metabolic pathways such as energy metabolism and lipid metabolism might be initiated by the DR-mediated apoptosis pathway and by Cyc released from mitochondria during apoptosis. 49,50 The results of the current study suggest that Z24 has hepatotoxicity, and a possible hepatotoxicological mechanism might be that apoptosis was induced in hepatocytes by initiating the DR-mediated signal transduction pathway, and the apoptosis of hepatocytes may impair energy and lipid metabolism, provoke hepatocyte necrosis and inflammation, and ultimately result in hepatotoxicity.
This study indicated that apoptosis was mainly responsible for the hepatotoxicity of Z24. However, further experiments, such as small interfering RNA (siRNA) or receptor binding assays, may be needed to demonstrate whether the DR-mediated apoptosis pathway is the only pathway involved in the regulation of apoptosis and hepatotoxicity. Despite its preliminary character, this study suggests the possible hepatotoxicological mechanism of Z24 to HepG2 cells and provides evidence that cDNA microarray technology could reliably detect alterations in gene expression that shed light on this toxicological mechanism.
Footnotes
Acknowledgments
The authors thank Hezhang Sheng, Yufeng Li, Yansheng Dong, and Jiadi Shen for expert assistance with sampling blood and clinical chemistry examination.
Notes
The author(s) declared no conflicts of interest with respect to the authorship and/or publication of this article.
The author(s) disclosed receipt of the following financial support for the research and/or authorship of this article: A grant from Beijing Natural Science Foundation (7092079), Beijing Science Foundation (Z08030203080818), and National Foundation (Project 2008ZX09305-003 and No 2001AA235091). Patent involved China Paten.1365972A. 2002.08.28.