
Abstract
To provide mechanistic insight in the induction of phospholipidosis and the appearance of the proposed biomarker di-docosahexaenoyl (C22:6)-bis(monoacylglycerol) phosphate (BMP), rats were treated with 150 mg/kg amiodarone for 12 consecutive days and analyzed at three different time points (day 4, 9, and 12). Biochemical analysis of the serum revealed a significant increase in cholesterol and phospholipids at the three time points. Bio-analysis on the serum and urine detected a time-dependent increase in BMP, as high as 10-fold compared to vehicle-treated animals on day 12. Paralleling these increases, micro-array analysis on the liver of treated rats identified cholesterol biosynthesis and glycerophospholipid metabolism as highly modulated pathways. This modulation indicates that during phospholipidosis-induction interactions take place between the cationic amphiphilic drug and phospholipids at the level of BMP-rich internal membranes of endosomes, impeding cholesterol sorting and leading to an accumulation of internal membranes, converting into multilamellar bodies. This process shows analogy to Niemann-Pick disease type C (NPC). Whereas the NPC-induced lipid traffic jam is situated at the cholesterol sorting proteins NPC1 and NPC2, the amiodarone-induced traffic jam is thought to be located at the BMP level, demonstrating its role in the mechanism of phospholipidosis-induction and its significance for use as a biomarker.
Keywords
Introduction
Tissue phospholipidosis (PLD), a lysosomal phospholipid storage disorder, has been a recognized side effect of cationic amphiphilic drugs (CADs) since the late 1960s; and since then, more than 200 drug candidates have shown to induce phospholipidosis in preclinical studies (Tengstrand, Miwa, and Hsieh 2010). Potential phospholipidosis-inducing drugs are typically characterized by a high logP and a high pKb as they render the drug lysosomotrophic (De Duve 1968) and will concentrate the drug in the lysosomes or late endosomes (Hein, Lüllmann-Rauch, and Mohr 1990). Interaction with negatively charged phospholipids results in a massive accumulation of both phospholipids and the inducing drug in affected tissues, noted as electron dense lamellar inclusions or whorls in the cytoplasm when observed with transmission electron microscopy (T.E.M.) (Hein, Lüllmann-Rauch, and Mohr 1990). Phospholipidosis can occur in virtually any tissue, and three dominant patterns of phospholipidosis are mainly encountered: (1) macrophage-dominant phospholipidosis, in which mainly the resident macrophages of the tissues demonstrate phospholipidosis; (2) parenchymal cell-dominant phospholipidosis, in which phospholipidosis is also evident in the parenchymal cells of the tissues; and (3) localized phospholipidosis, in which the ductal cells of the bile are affected (Nonoyama and Fukuda 2008).
Although the induction mechanism is well understood and generally accepted, the prevalence and toxicological implications in humans are still unclear (Reasor and Kacew 2001). In vitro and in vivo investigations do suggest impairment of lysosomal protein degradation, fusion abilities, and pino- and endocytosis, but experimental evidence for a direct link between lysosomal phospholipid storage and consecutive lysosomal dysfunction or cellular toxicity is still lacking (Nonoyama and Fukuda 2008). The isolated clinical cases in which organ toxicity has been reported concomitant with the occurrence of phospholipidosis (neurogenic muscular atrophy in the case of perhexiline [Lüllmann-Rauch 1979]; myopathy in the case of chloroquine [Le Quintrec and Le Quintrec 1991]; hepatocellular dysfunction after treatment with 4,4’diethylaminoethoxyhexestrol [Lüllmann-Rauch 1979]) may indicate that the link with toxicity is rather more target organ dependent than a general phenomenon. The lack of this understanding and the similarities between drug-induced phospholipidosis and fatal, inherited lysosomal storage disorders, such as Niemann-Pick type C (NPC) disease, present an issue for health authorities. Due to the current lack of biomarkers, phospholipidosis induction and progression cannot be followed in healthy volunteers or patients and can therefore restrain drug development or drug approval (Reasor, Hasting, and Ulrich 2006). Pharmaceutical companies are currently implementing early in silico and in vitro strategies to screen out potential phospholipidosis-inducing drugs in the selection of drug candidates (Morelli et al. 2006; Tomizawa et al. 2006; Nioi et al. 2007; Chatman et al. 2009; Mesens et al. 2009, 2010). However, the typical amphiphilic characteristics of CADs are often favorable for a candidate drug in order to cross biological membranes, for example, the blood brain barrier, when targeting the CNS. A potential phospholipidosis-inducing drug candidate can be a highly promising drug that is unlikely to be screened out in early screening assays. Complementary to this deselecting approach, an alternative strategy of early follow up of potential phospholipidosis issues in vivo, via an early, sensitive and noninvasive biomarker, translatable to the clinic, would be of great benefit in both preclinical and clinical drug development phases.
Recently specific derivatives of bis(monoacylglycerol) phosphate (BMP), such as di-docosahexaenoyl (C22:6)-bis(monoacylglycerol) phosphate, have been suggested as noninvasive biomarkers to monitor the onset and time-course of drug-induced phospholipidosis (Mortuza et al. 2003; Baronas et al. 2007; Tengstrand, Miwa, and Hsieh 2010). Di-(C22:6)-BMP is increased in the tissues of animals and humans with PLD and patients with NPC (Rouser et al. 1968; Matsuzawa et al. 1977; Yamamoto et al. 1971). This unique phospholipid has an unusual sn-1: sn-1’ configuration and one fatty acid attached to each of the glycerol moieties, in contrast to all other mammalian glycerophospholipids that have an sn-3 glycerophosphate stereo configuration (Hullin-Matsuda et al. 2009; see Figure 1A). The specificity of an increase in this phospholipid for drug-induced phospholipidosis may have been questioned in the past, but recent insights in the etiology of NPC reveal the interconnectivity between BMP, cholesterol transport, and phospholipid accumulation in the late endosomes and lysosomes (Tengstrand, Miwa, and Hsieh 2010).
Lysosomal membrane degradation is a complex process and involves the formation of intra-endosomal and intra-lysosomal membrane structures, originating from the cellular membranes by endocytosis, phagocytosis, or autophagy (Schulze, Kolter, and Sandhoff 2009; Figure 1a). To ensure selective degradation of the phospholipids of these intra-lysosomal vesicles, the lipid composition differs from that of the outer membrane. During maturation of endosomes, cholesterol content on these intra-organellar membranes decreases and the concentration of a unique phospholipid BMP increases (Schulze, Kolter, and Sandhoff 2009; Figure 1B). This enables a negatively charged fluid phase, accessible for cationic proteins, degrading some of the membrane lipids. The decrease in cholesterol content is achieved by Niemann-Pick protein 2 (NPC2), which appears to reside in the intra-endosomal vesicles, removing cholesterol and delivering it to Niemann-Pick protein 1 (NPC1) in the limiting membrane, transporting cholesterol from late endosomes to the Golgi apparatus (Liscum and Sturley 2004; Abdul-Hammed et al. 2010; Figure 1C). Due to NPC1 and/or NPC2 dysfunction, the membrane stabilizing cholesterol content of the late endosomal vesicles increases, disturbing their specific low lipid profile (low cholesterol, high BMP content) normally ensuring their degradation by the lysosomal hydrolases and lipases (Kolter and Sandhoff 2005, 2010). A lipid and cholesterol traffic jam consequently occurs (Liscum 2000), causing the formation of detergent-resistant membranes, or rafts, which remain accumulated in the late endosomes, containing high levels of undegraded phospholipids, cholesterol, and BMP (Figure 1C). Overcrowding of rafts is speculated to lead to conversion of the terminal endocytic compartments into the typical multilamellar bodies (Lusa et al. 2001; Liscum and Sturley 2004). Since the NPC1 and NPC2 phenotypes can be mimicked by anti-BMP antibodies, as shown by Kobayashi, Stang, and Fang (1998) and Kobayashi et al. (1999); BMP is also postulated to play a role in the cholesterol sorting and phospholipid transport between endosomes and lysosomes (Figure 1). Moreover, Kobayashi has shown that the NPC1 and NPC2 phenotypes can be obtained by treatment with the CAD U18666A, which binds to negatively charged phospholipids such as BMP.
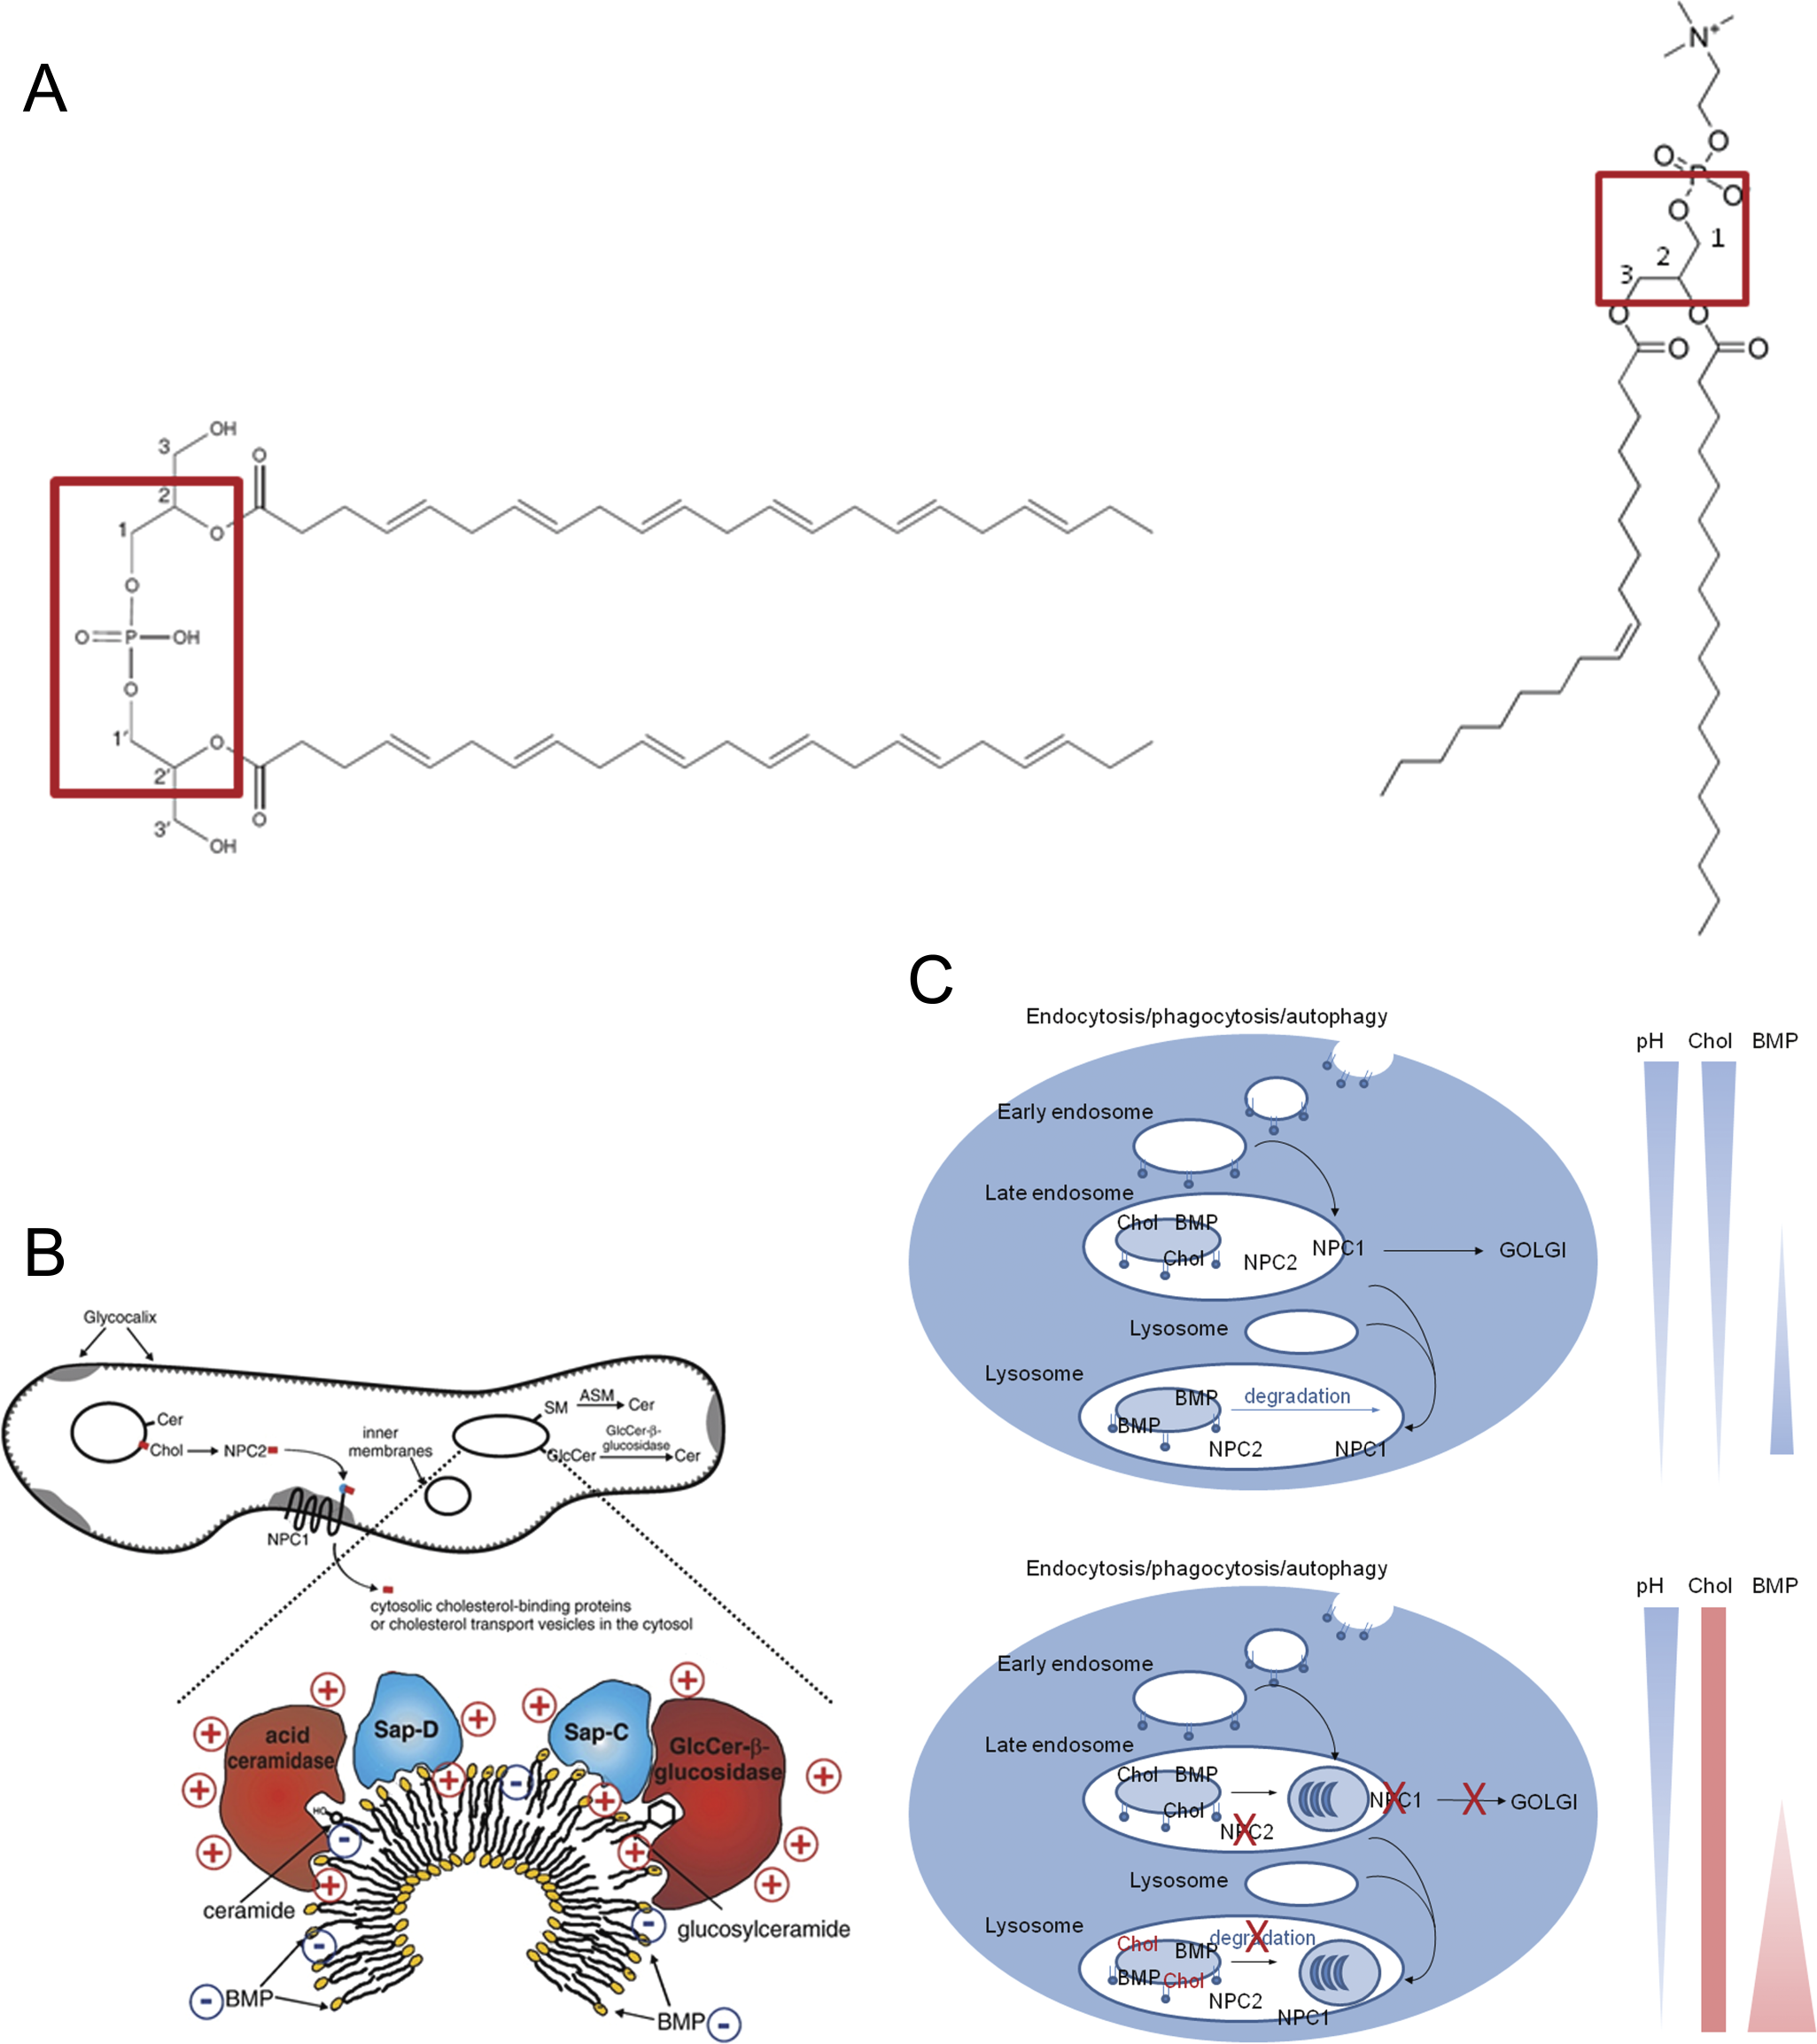
The unusual structure of BMP showing the sn-2: sn-2’ configuration, compared to the sn-2-3 configuration of phosphatidylcholine. B: Detailed structure of an intra-endosomal or intra-lysosomal membrane vesicle. (Obtained from Schulze et al. 2009.) C: Comparison of the endocytotic process in normal cells and NPC cells/phospholipidotic cells. Chol: cholesterol; BMP: BMP residing on the internal membranes of the late endosomes and lysosomes. pH, cholesterol and BMP decrease and increase are indicated by a narrowing and lightening or thickening and darkening of the forms, respectively (obtained from Schulze et al. 2009). Red crosses show mutations in NPC1 or NPC2 and the consequent physiological processes: inhibition of cholesterol sorting to the golgi apparatus, inhibition of degradation of the internal membranes, and the accumulation of multilamellar bodies.
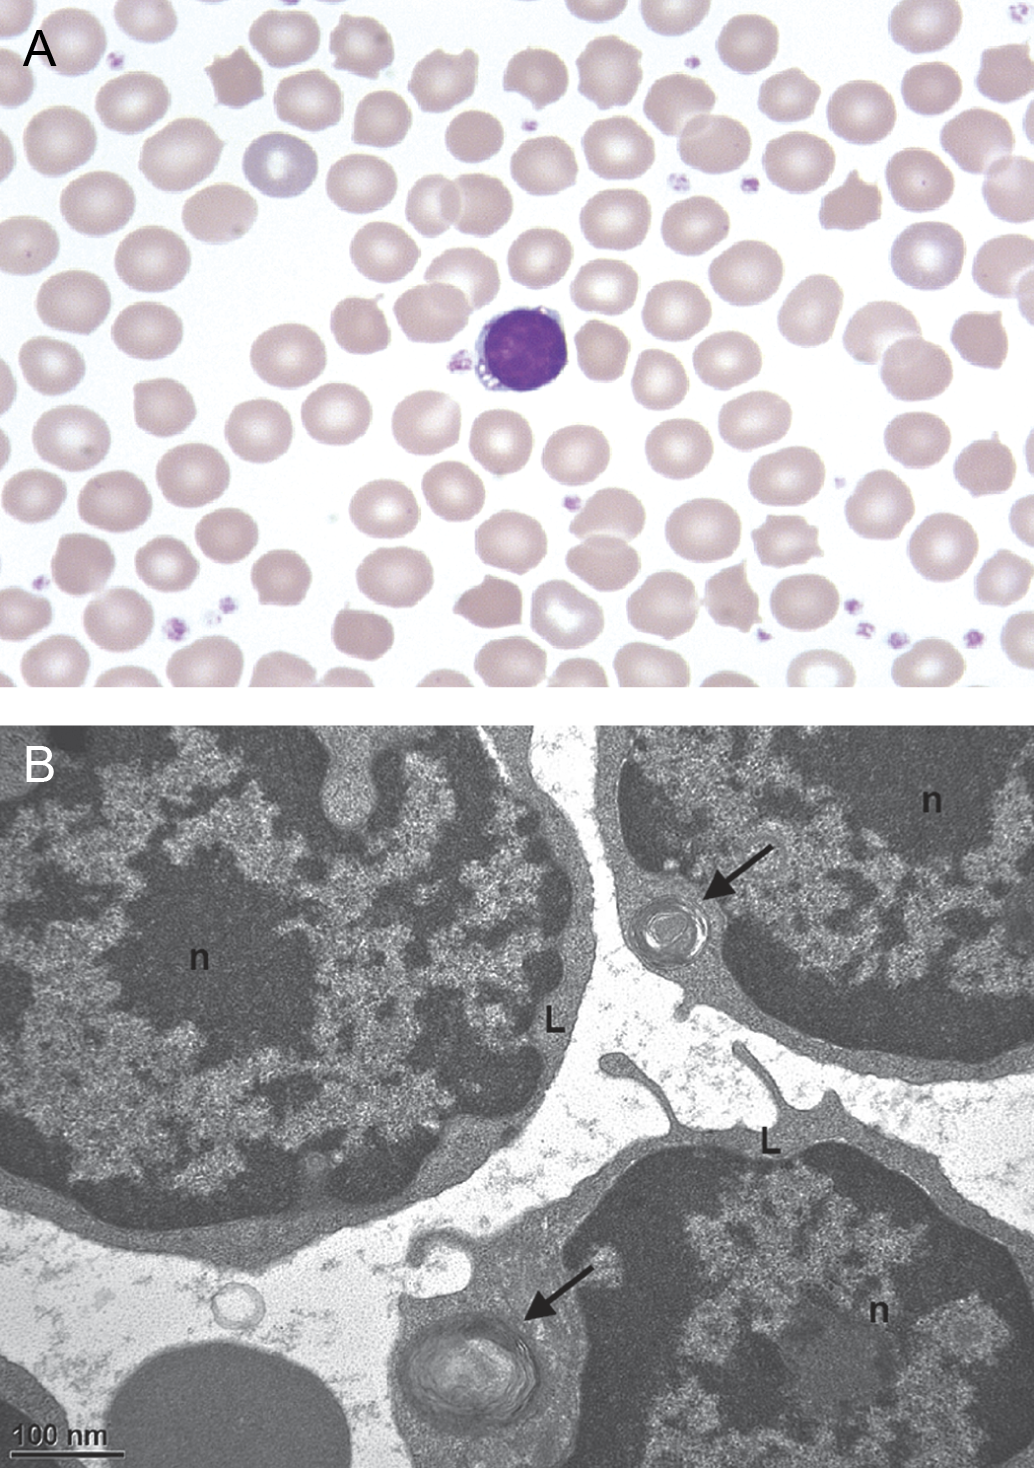
Light microscopic evaluation of peripheral blood smears of H123 after 4 days of amiodarone treatment. Wright’s stain, Magnification 100 X. Picture shows a lymphocyte containing several distinct cytoplasmic vacuoles. B: T.E.M. evaluation of blood lymphocytes in the buffy coat preparation after 12 days of amiodarone treatment (H131). Thirty-three percent of the peripheral blood lymphocytes contained 1 to 4 lamellated inclusion bodies. Picture shows lymphocytes (L) with a lamellated inclusion body (see arrow). n: nucleus. Magnification as indicated.
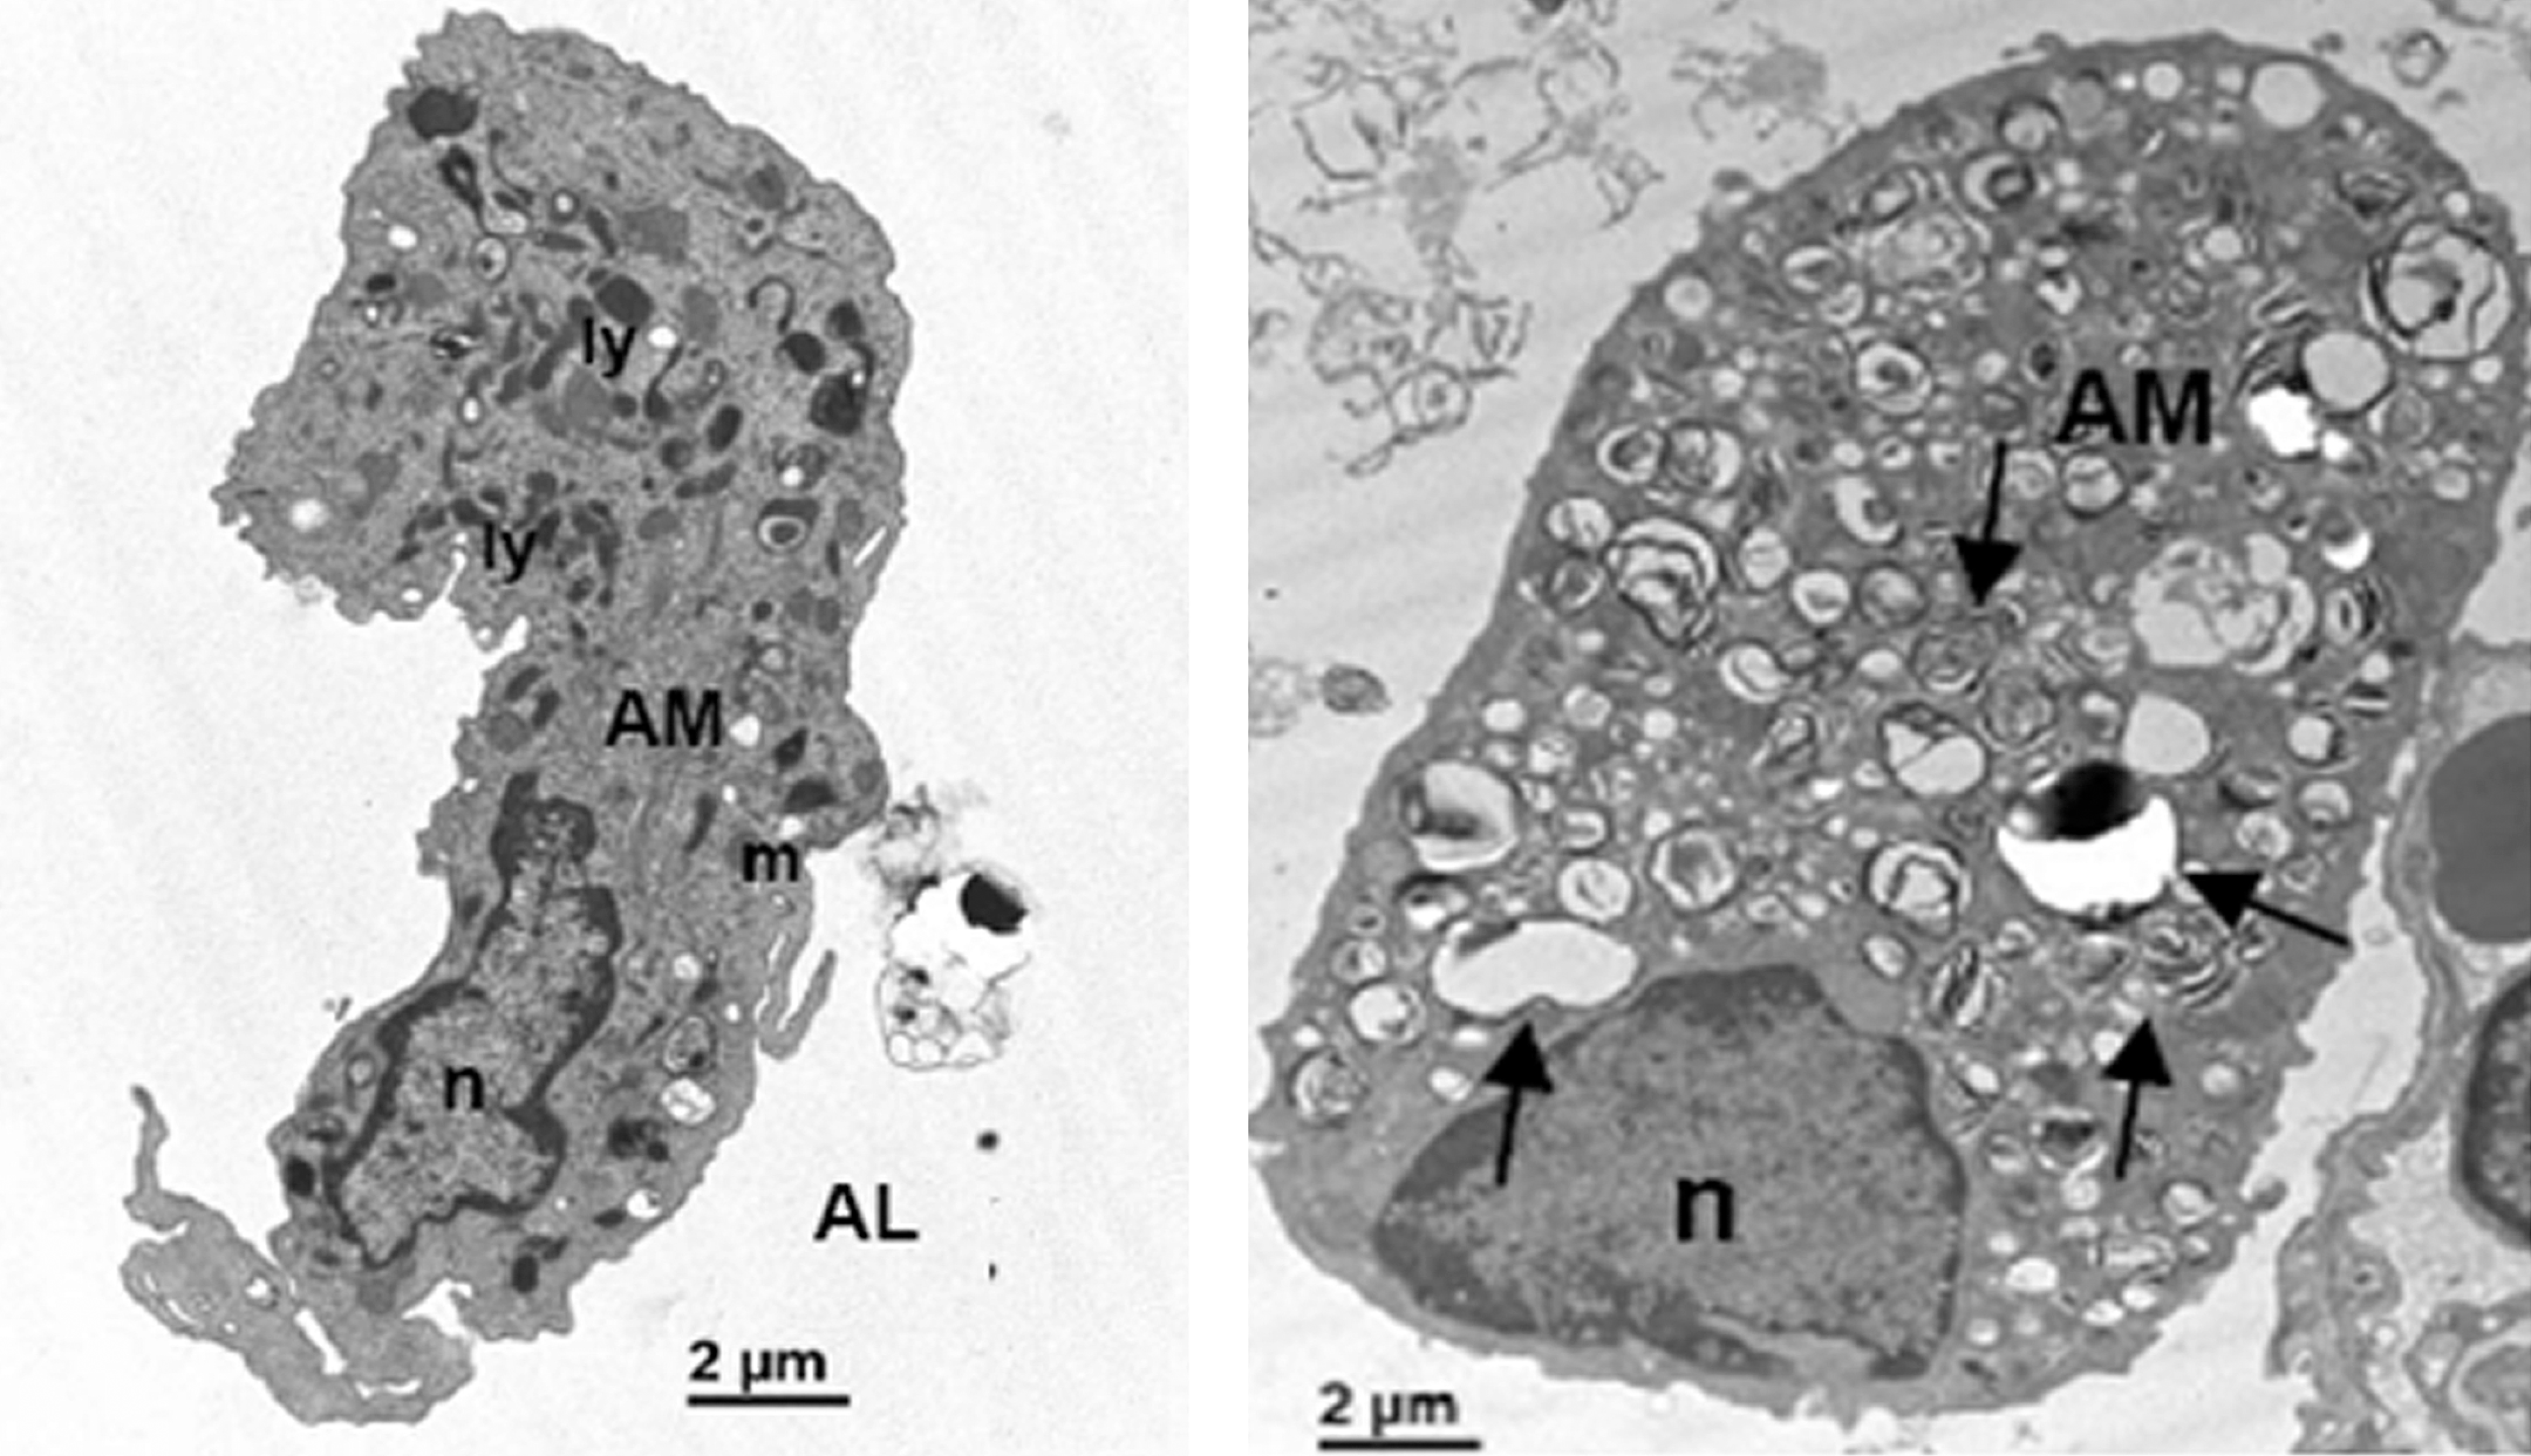
Comparison of the ultrastructure (T.E.M.) of the lung of a vehicle treated rat (left) and an amiodarone-treated rat at day 12 (right). Magnification as indicated. Lamellated inclusion bodies (arrows) are seen in the alveolar macrophages (AM).
The striking similarity between the phenotypes induced by CADs and Niemann-Pick disease C on one hand, and the chemical structures of U18666A and phospholipidosis-inducing drugs on the other hand, hints toward a role of BMP in phospholipidosis-induction and supports the hypothesis that a cholesterol and lipid traffic jam occurs as well (Liscum 2000).
To obtain more mechanistic insight in the increase in BMP and link with phospholipidosis-induction, a 12-day repeated dose oral toxicity study of amiodarone in the rat was performed. Amiodarone is a well-known phospholipidosis-inducer with clinical relevance and target organs for phospholipidosis are well described, including lung, liver, and spleen (Goldman et al. 1985; Guigui et al. 1988; Lewis et al. 1988; Kannan et al. 1991; Reasor et al. 1996), justifying its widespread use as the reference drug for the general phenomenon of CAD-induced phospholipidosis. In addition to histology and serum chemistry, bio-analysis was performed on the urine and whole genome micro-array analysis was carried out on the livers after treatment.
Materials and Methods
Experimental Design
Thirty-two young and healthy male SPF-certified Sprague-Dawley rats (Crl: CD℗(SD) IGS), supplied by Charles River, aged 14–15 weeks, were used in the study. On arrival, they were approximately 9 weeks old and they were not subjected to previous experimental procedures. A health certificate with SPF specifications was transmitted at delivery. All animals were housed in an animal facility that is fully compliant with the European policy on the use of laboratory animals. Experimental protocols were approved by the Institutional Review Committee of Janssen Pharmaceutica (Beerse, Belgium), meeting the European and Belgian guidelines on animal experimentation. Rats were given free and continuous access to water and fed ad libitum with pelleted rat food throughout the study. Animals were deprived of food (overnight) prior to blood sampling, during urine collection, and prior to terminal kill.
From the age of 14 to 15 weeks, all 32 rats were randomly divided into two dose groups: a vehicle group (nos. 101–116) receiving placebo formulation (hydroxypropyl methylcellulose) in aqueous suspension and a treated group (nos. 121–137) receiving the test article formulation amiodarone hydrochloride at a dose of 150 mg eq./kg body weight/day. Both the test article formulation and the vehicle solution were administered manually orally via gavage by use of a stomach tube at a daily volume of 1 ml per 100 g body weight. Five rats per group were euthanized after 4, 9, and 12 once daily doses, respectively (day 5, 10, and 13 of the study).
The study was carried out in the Johnson & Johnson vivarium facilities in compliance with the current Good Laboratory Practice principles of the OECD GLP guidelines. The facilities meet or exceed inspection agency standards, and all animals were treated humanely and cared for in accordance with the European and Belgian guidelines and with the principles of euthanasia as stated in the Report of the American Veterinary Medical Association Panel.
Blood and Urine Sampling
Blood was collected prior to necropsy on day 5, 10, and 13, after 4, 9, and 12 days of treatment, respectively. Urine samples were collected overnight at day 4, 9, and 12, before necropsy.
Blood
Blood samples were collected from fasted rats from the sublingual veins or from the carotid artery after anesthesia with isoflurane. Blood was collected for serum preparation. In addition, peripheral blood smears and buffy coats were prepared from each animal. Wright-stained blood smears were evaluated by light microscopy and the number of vacuolated lymphocytes was counted along the way of counting 100 white blood cells. Buffy coats were prepared for T.E.M. evaluation. For this purpose, anticoagulated blood was centrifuged immediately after collection (10 minutes, 4,000 rpm). Plasma was removed and the buffy coat was fixed with 3% gluteraldehyde in potassium phosphate buffer 0.09 M containing 1.4% sucrose. Complete fixation was allowed to take place for 30 min prior to isolation of the buffy coat.
Urine
Urine was collected overnight via metabolic cages (rats deprived of food but not of water). Urine samples were maintained at room temperature during collection and stored at –80°C until analysis afterward.
Serum Chemistry
Clinical chemistry parameters (sodium, potassium, chloride, calcium, inorganic phosphorus, total protein, albumin, glucose, cholesterol, triglycerides, blood urea nitrogen, creatinine, total bilirubin, alkaline phosphatase, aspartate aminotransferase, alanine aminotransferase, gamma glutamyl transferase, high- and low-density lipoprotein-associated cholesterol [HDL-C and LHL-C]) were measured on a Hitachi Modular automated Clinical Chemistry analyzer (Roche Diagnostics) using commercial assays. For the analysis of total (choline-containing) phospholipids, a choline oxidase—DAOS method (Wako Pure Chemicals Industries, Ltd.) was used, according to the manufacturer’s instructions.
Analysis of di-(C22:6)-BMP in Urine and Serum
Di-(C22:6)-BMP was determined in urine and serum collected prior to necropsy from all rats.
High-Resolution Mass Spectrometry
An API-5600 (AB Sciex) Quadrupole Time of Flight Mass spectrometer was used, equipped with a Duosource operated in the Ionspray negative ion mode to obtain product ion spectra for confirmation of the identity of di-(C22:6)-BMP.
Triple Quadrupole Mass Spectrometry
An API-4000 (AB Sciex) Triple Quadrupole Mass Spectrometer was used, equipped with a Turbo V Ionspray source and used in the multiple reaction monitoring (MRM) negative ion mode. For di-(22:6) BMP a mass transition of m/z 865.5 à 327.2 was monitored. Typical mass spectrometer settings were: gas 1, nitrogen (40 psi); gas 2, nitrogen (50 psi); ionspray voltage, –4,000 V; ion source temperature, 500ºC; curtain gas, nitrogen (30 psi); collision gas, nitrogen, setting 5; declustering potential, –15 V; collision energy, –48 V.
Chromatography
An HP1100 (Agilent) Quaternary pump and an SIL-HTc (Shimadzu) autosampler were used. A linear gradient was applied, with a mobile phase consisting of 0.01 M NH4OAc in water (A) and methanol (B) at a flow rate of 1.0 ml/min at room temperature. The gradient started at 20% A, changed to 2 % A in 5.0 min, and was subsequently held constant at 2% A for another 4.0 min. Next, the column was re-equilibrated for 1.0 min at 20% A before start of the next injection. The autosampler was set at 4ºC. 500 µl water/acetonitrile 50/50 (v/v) was used both as weak and as strong wash. The di-(22:6)-BMP peak eluted at a retention time of approximately 6.2 min.
Sample extraction
Three hundred µl of urine or serum was transferred to a 1.5 ml eppendorf tube. Five hundred µl chloroform/methanol (3:1 v/v) containing BHT at a concentration of 50 µg/ml was added where after the sample was vortexed for 30 seconds. Next, 100 µl 0.1% Formic Acid in water was added and the sample was vortex-mixed again for 30 seconds. The tubes were centrifuged for 10 min at 10,000 g, where after the majority of the upper water layer was removed. From the bottom organic layer, an aliquot of 250 µl was transferred to a glass tube and subsequently evaporated to dryness under a gentle nitrogen stream at room temperature. The residue was reconstituted in 100 µl acetonitrile/methanol (2:1 v/v) containing 0.05% formic acid. A 20 µl aliquot was subsequently injected onto the LC-MS/MS system.
Sample analysis
No reference material for di-(22:6)-BMP was available. For this reason, it was not feasible to analyze the samples using a calibration curve and provide absolute quantitative data. Therefore, results were reported as “peak area” and could be used in a relative way to compare treated animals with untreated animals. During the analysis, a “control sample” (which was a urine sample from a treated animal) was injected repeatedly during an analytical run in order to monitor the sensitivity and drift of the analytical system during the analysis. The peak area of the control sample was very constant during the analytical runs. Therefore, it can be concluded that there was no significant drift or change in sensitivity during the analyses.
Stability
The stability of di-(22:6)-BMP in urine was assessed by analyzing a urine aliquot from a treated rat directly and after storage for 24 hours on melting and room temperature.
The stability of di-(22:6) BMP in serum was assessed by adding a small amount of urine to a pooled rat serum sample. Aliquots were analyzed directly and after storage for 1, 2, and 4 hours at room temperature and on melting ice.
Concentrations of urinary di-(C22:6)-BMP were normalized to urinary creatinine. Urinary creatinine was measured by means of an enzymatic colorimetric method on a Hitachi Modular automated Clinical Chemistry analyzer (Roche Diagnostics).
Post-Mortem Evaluation
Necropsy and gross pathology
On the day of terminal kill, a complete physical examination was performed and body weight was recorded. Limited necropsy was performed and all macroscopic changes were reported. Absolute and relative (to body weight) weights of lung, liver, and spleen were determined and samples were collected for microscopy and gene expression analysis.
Histotechnology
For histopathological examination, the liver, lung, and spleen were trimmed and embedded. Afterward, they were sectioned and stained with hematoxylin-eosin (H.E.).
Microscopy
Light microscopy: Light microscopic examination was performed on hematoxylin-eosin (H.E.) stained sections of the liver, lung, and spleen of all rats.
Transmission electron microscopy: Peripheral white blood cells (buffy coat), lung, and spleen of one vehicle and one amiodarone treated rat were examined. Tissues were immersion fixed in glutaraldehyde 3% in potassiumphosphate buffer 0.09 M 1.4% sucrose. Samples were embedded and cut in semithin and ultrathin sections. For contrast, the ultrathin sections were incubated for 8 min on a drop of 0.5% uranyl acetate in Milli-Q, then rinsed thoroughly with Milli-Q, and further stained for 8 min on a drop of lead citrate in Milli-Q, rinsed again and dried before examination in a Philips CM100 electron microscope.
Gene Expression Analysis
For gene expression analysis, a sample of the liver was taken, immediately frozen in liquid nitrogen and stored at –80ºC.
RNA extraction and microarray experiments
Total RNA was extracted from rat liver using the RNeasy mini kit (Quiagen, Hilden, Germany) following the manufacturer’s instructions. An additional on-column DNAse incubation step was performed for removal of any contaminating genomic DNA during the isolation process. RNA yield was quantified using a NanoDrop ND-1000 spectrophotometer (NanoDrop Technologies, USA). Samples for microarray analysis on the Affymetrix platform were prepared according to the protocols of the manufacturer (Affymetrix, Santa Clara, CA, USA). In short, 1.5 µg of total RNA was converted to double-strand cDNA using an oligo(dT) primer. The cDNA was used as a template to generate biotinylated cRNA during an in vitro transcription step using the one-cycle target labelling kit (Affymetrix, USA). Ten micrograms of the cRNA was purified, chemically fragmented, and hybridized onto Affymetrix Rat Genome 230 2.0 GeneChips at 45°C for 16 h in a hybridization oven set at 60 rpm. The arrays were washed and stained using an Affymetrix Fluidics Station 450 and scanned with an Affymetrix GeneChip Scanner 3000 according to the manufacturer’s instructions.
Data analysis
CEL files were imported in the R statistical package and were GC-RMA normalized. SAM analysis was performed to identify differentially expressed genes between vehicle and amiodarone-exposed samples. The data were also imported in the GeneMath XT package (Applied Maths, Belgium) for performing t-tests among individual groups of samples. Lists of differentially expressed genes were imported in KEGG (Kyoto Encyclopedia of Genes and Genomes) and MetaCore for pathway analyses.
Results
Light and Electron Microscopic Evaluation of Peripheral Blood Smears
Vacuolated lymphocytes in peripheral blood smears were present in all amiodarone-treated rats with low incidence, while they were not or rarely detected in the vehicle treated rats.
The mean percentages of vacuolated lymphocytes in treated rats were 4.6% on day 4, 7.3% on day 9, and 6.4% on day 12 (see Figure 2A). Vacuoles in the lymphocytes were confirmed to be lamellated inclusion bodies with T.E.M. (see Figure 2B). In the buffy coat preparation, around 33% of all lymphocytes contained 1 to 4 lamellated inclusion bodies.
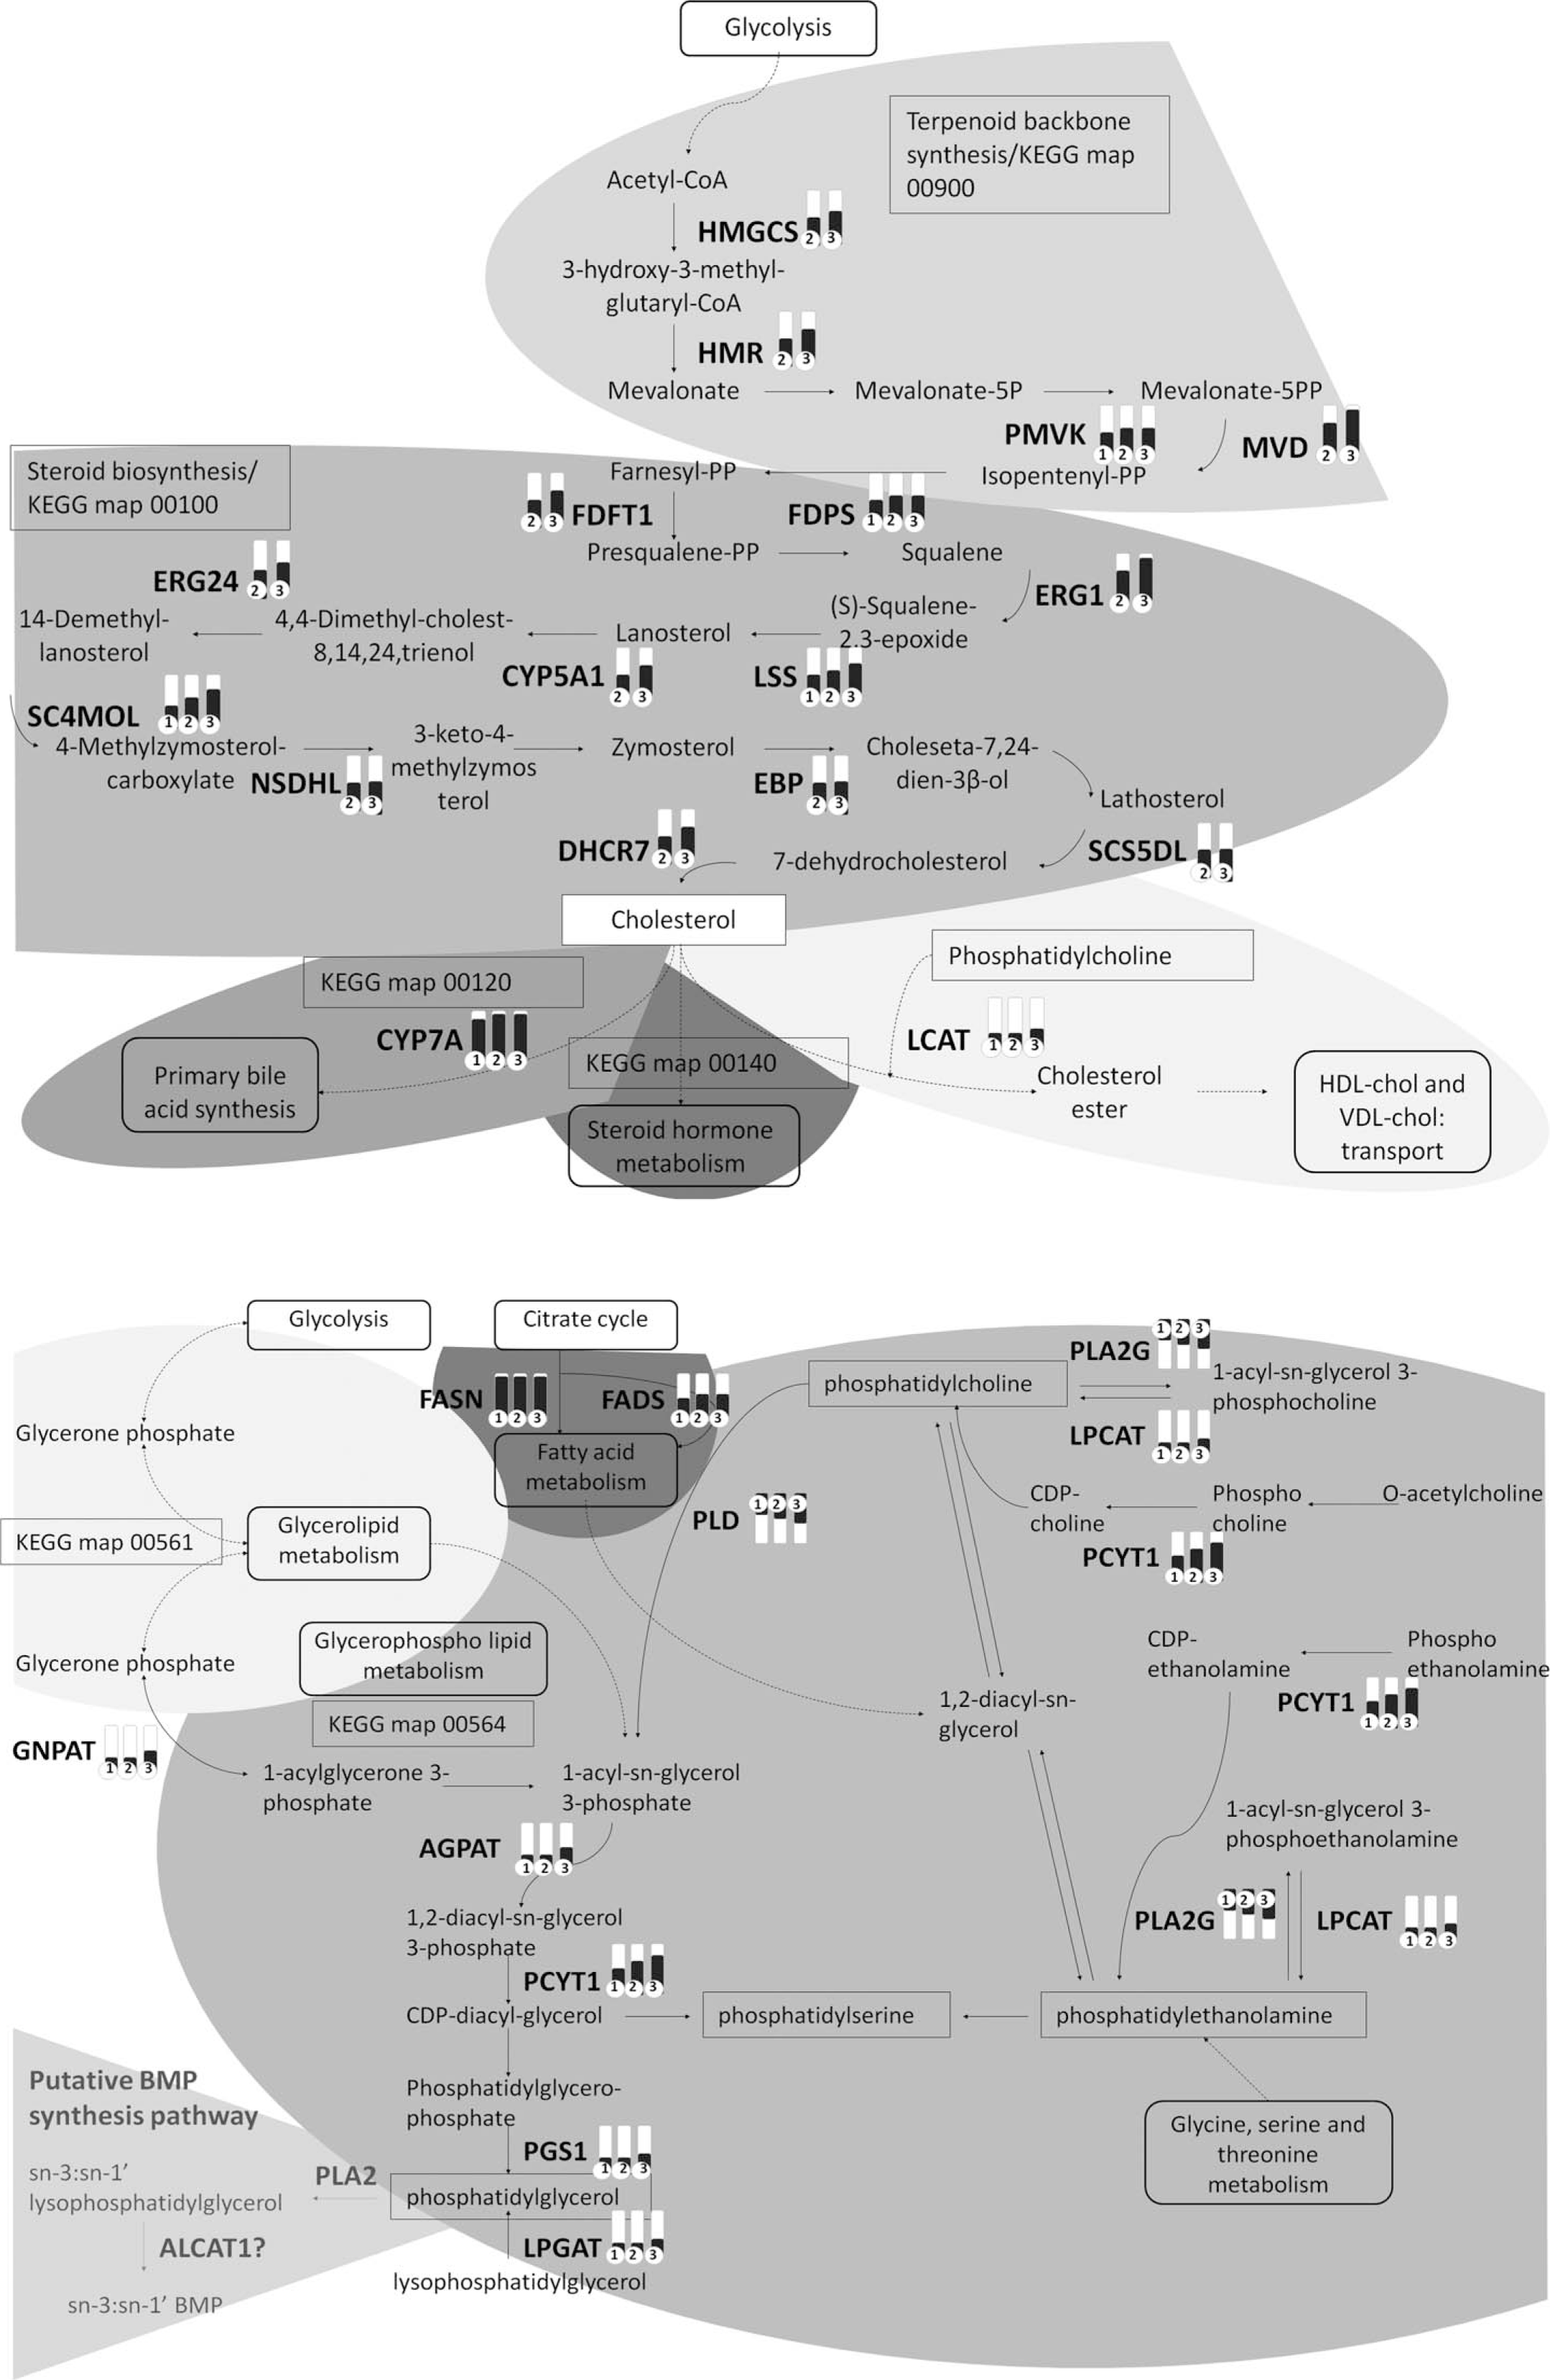
KEGG pathway analysis of (1) the cholesterol biosysthesis patway (top) and (2) the glycerophospholipid metabolism (bottom). Bars indicate the level of up-regulation or down-regulation of the genes encoding the enzymes (bars placed above or below, respectively). Numbers 1, 2, and 3 indicate the samples taken at different days: day 4, day 9, and day 12, respectively.
Serum Chemistry
Total (choline-containing) phospholipids, as well as cholesterol (including HDL-C and LDL-C) were significantly increased in the treated rats from day 4 onward and throughout the treatment. No clear time-related response could be seen; however, a small tendency toward higher significantly different values (p-value = .003 on day 12 versus .008 on day 4 and day 9) could be observed at day 12. In addition, alanine aminotransferase (ALT) and aspartate aminotransferase (AST) presented minor increases (less than 2-fold vs. vehicle) on day 12. Results are shown in Table 1.
Serum chemistry analysis of the vehicle (V) rats compared to amiodarone (H) the treated rats at different time points (day 4, day 9, and day 11).
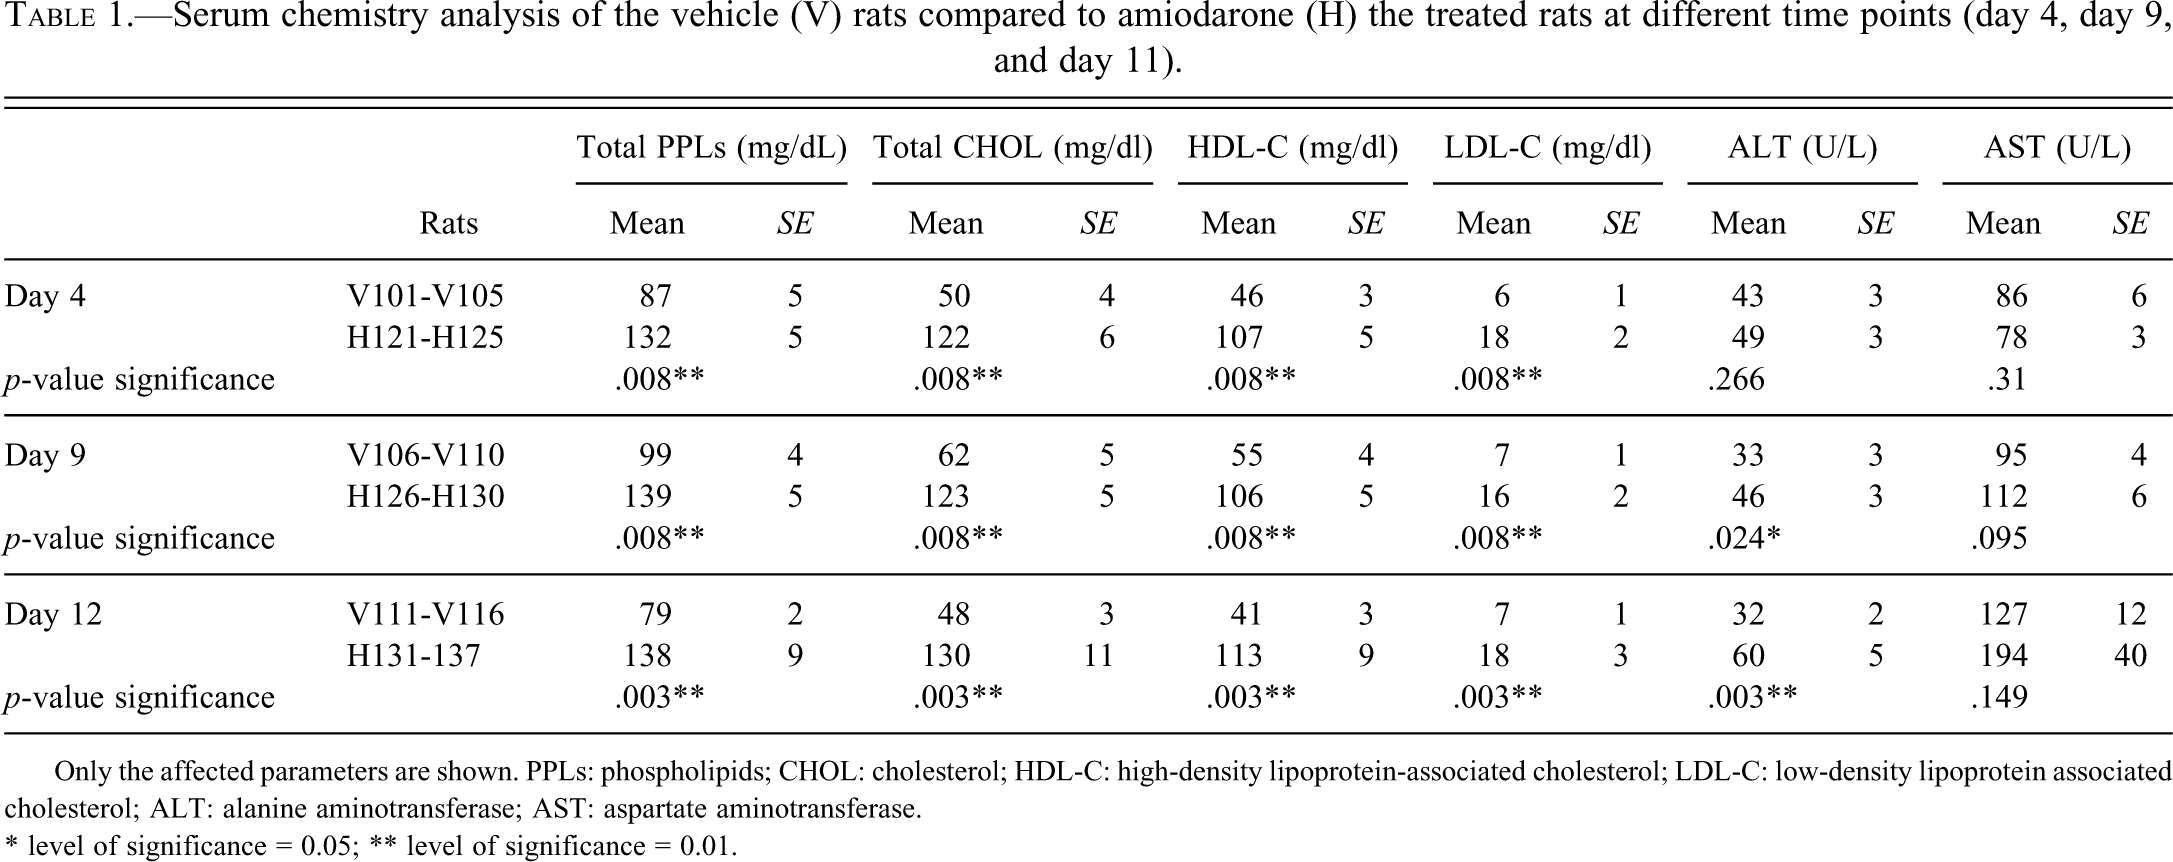
Only the affected parameters are shown. PPLs: phospholipids; CHOL: cholesterol; HDL-C: high-density lipoprotein-associated cholesterol; LDL-C: low-density lipoprotein associated cholesterol; ALT: alanine aminotransferase; AST: aspartate aminotransferase.
* level of significance = 0.05; ** level of significance = 0.01.
Confirmation of Identity of Di-(C22:6)-BMP
In the high-resolution MS/MS product ion spectrum of the peak eluting at approximately 6.2 min in the chromatogram of a urine sample, three closely eluting peaks were found: the mother ion at 865.5012 Da (–0.9 ppm) and the two major fragment ions at 327.3222 Da (–0.3 ppm) and 283.3436 Da (0 ppm), respectively, were all within 1 ppm of the expected exact mass, demonstrating that the identity of the peak at 6.2 minutes is indeed di-(C22:6)-BMP with a high level of confidence.
Analysis of Di-(C22:6)-BMP in Urine
Di-(C22:6)-BMP was shown to be stable in urine for at least 24 hours, both at room temperature and on melting ice. Analysis of BMP in urine revealed a time-dependent increase in di-(C22:6)-BMP in the amiodarone-treated rats (Table 3). Di-(C22:6)-BMP increased significantly to 2.8-fold on day 4, 5.7-fold on day 9, and 10.8-fold on day 12.
Organ weight changes (absolute; relative to body weight [BW]) and histopathology of the group amiodarone treated rats (compared to the vehicle animals killed at the same time point).
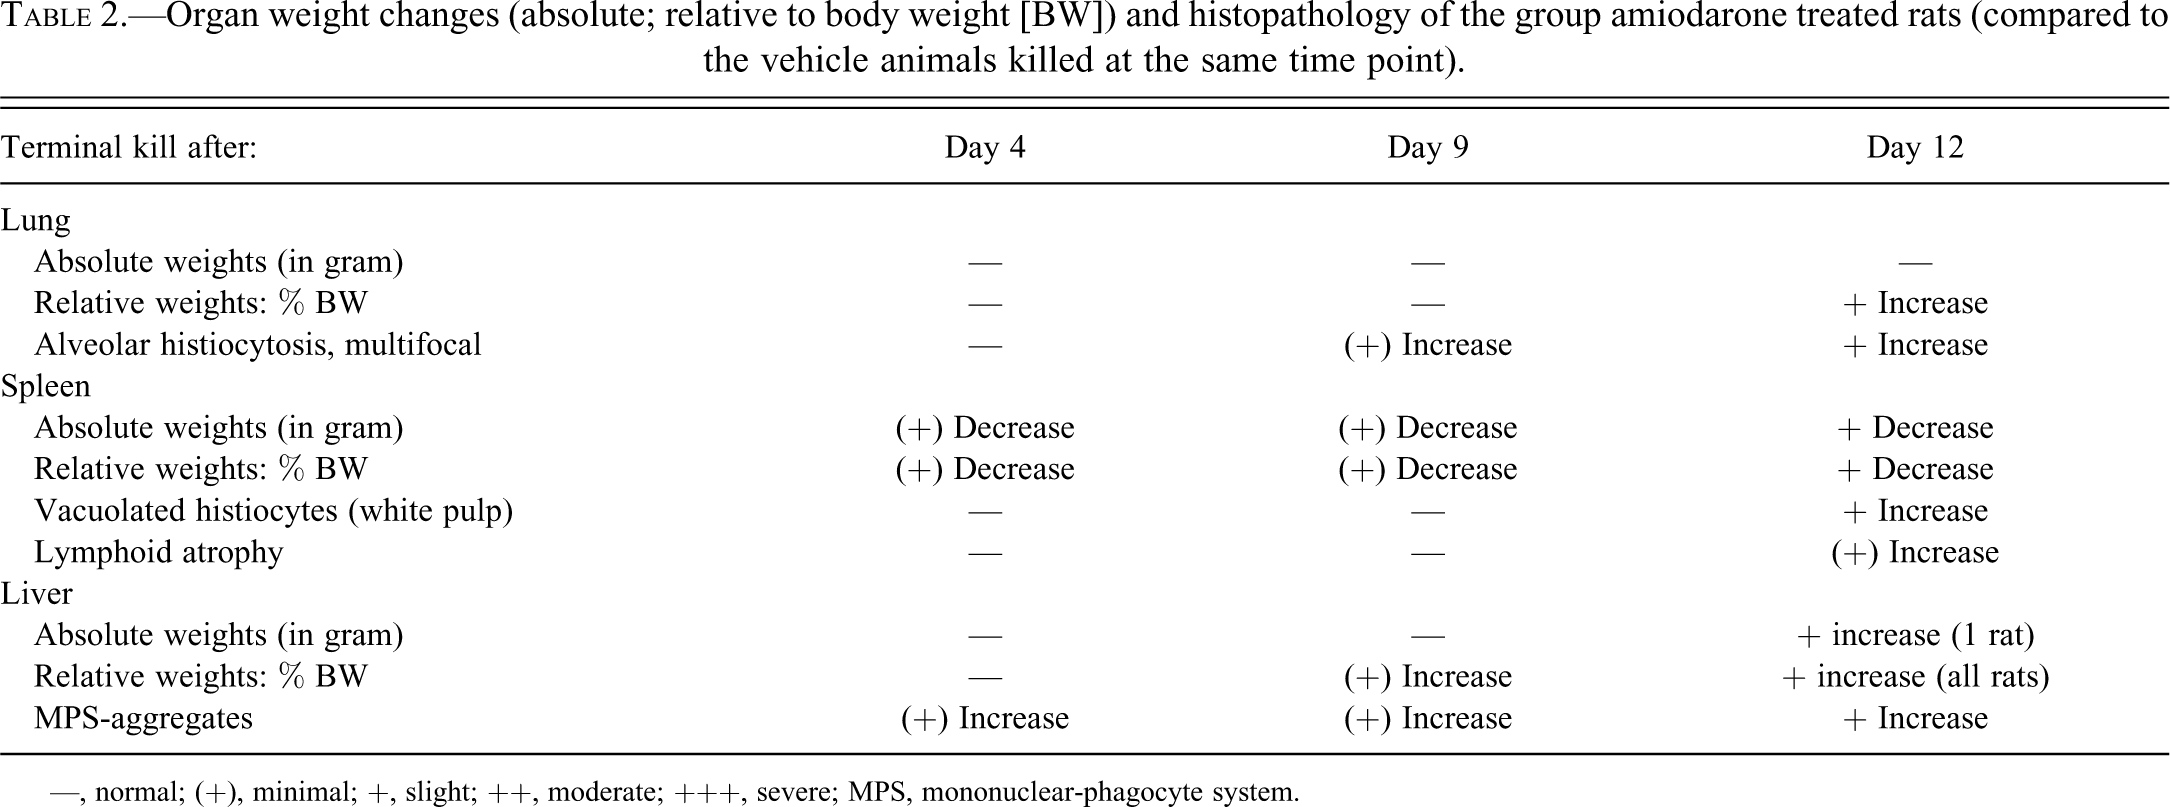
—, normal; (+), minimal; +, slight; ++, moderate; +++, severe; MPS, mononuclear-phagocyte system.
Bio-analysis results of the detection of di-(22:6) BMP in the serum and the urine respectively; at different time points (day 4, day 9, and day 12) in vehicle (V) vs. amiodarone (H) treated rats.
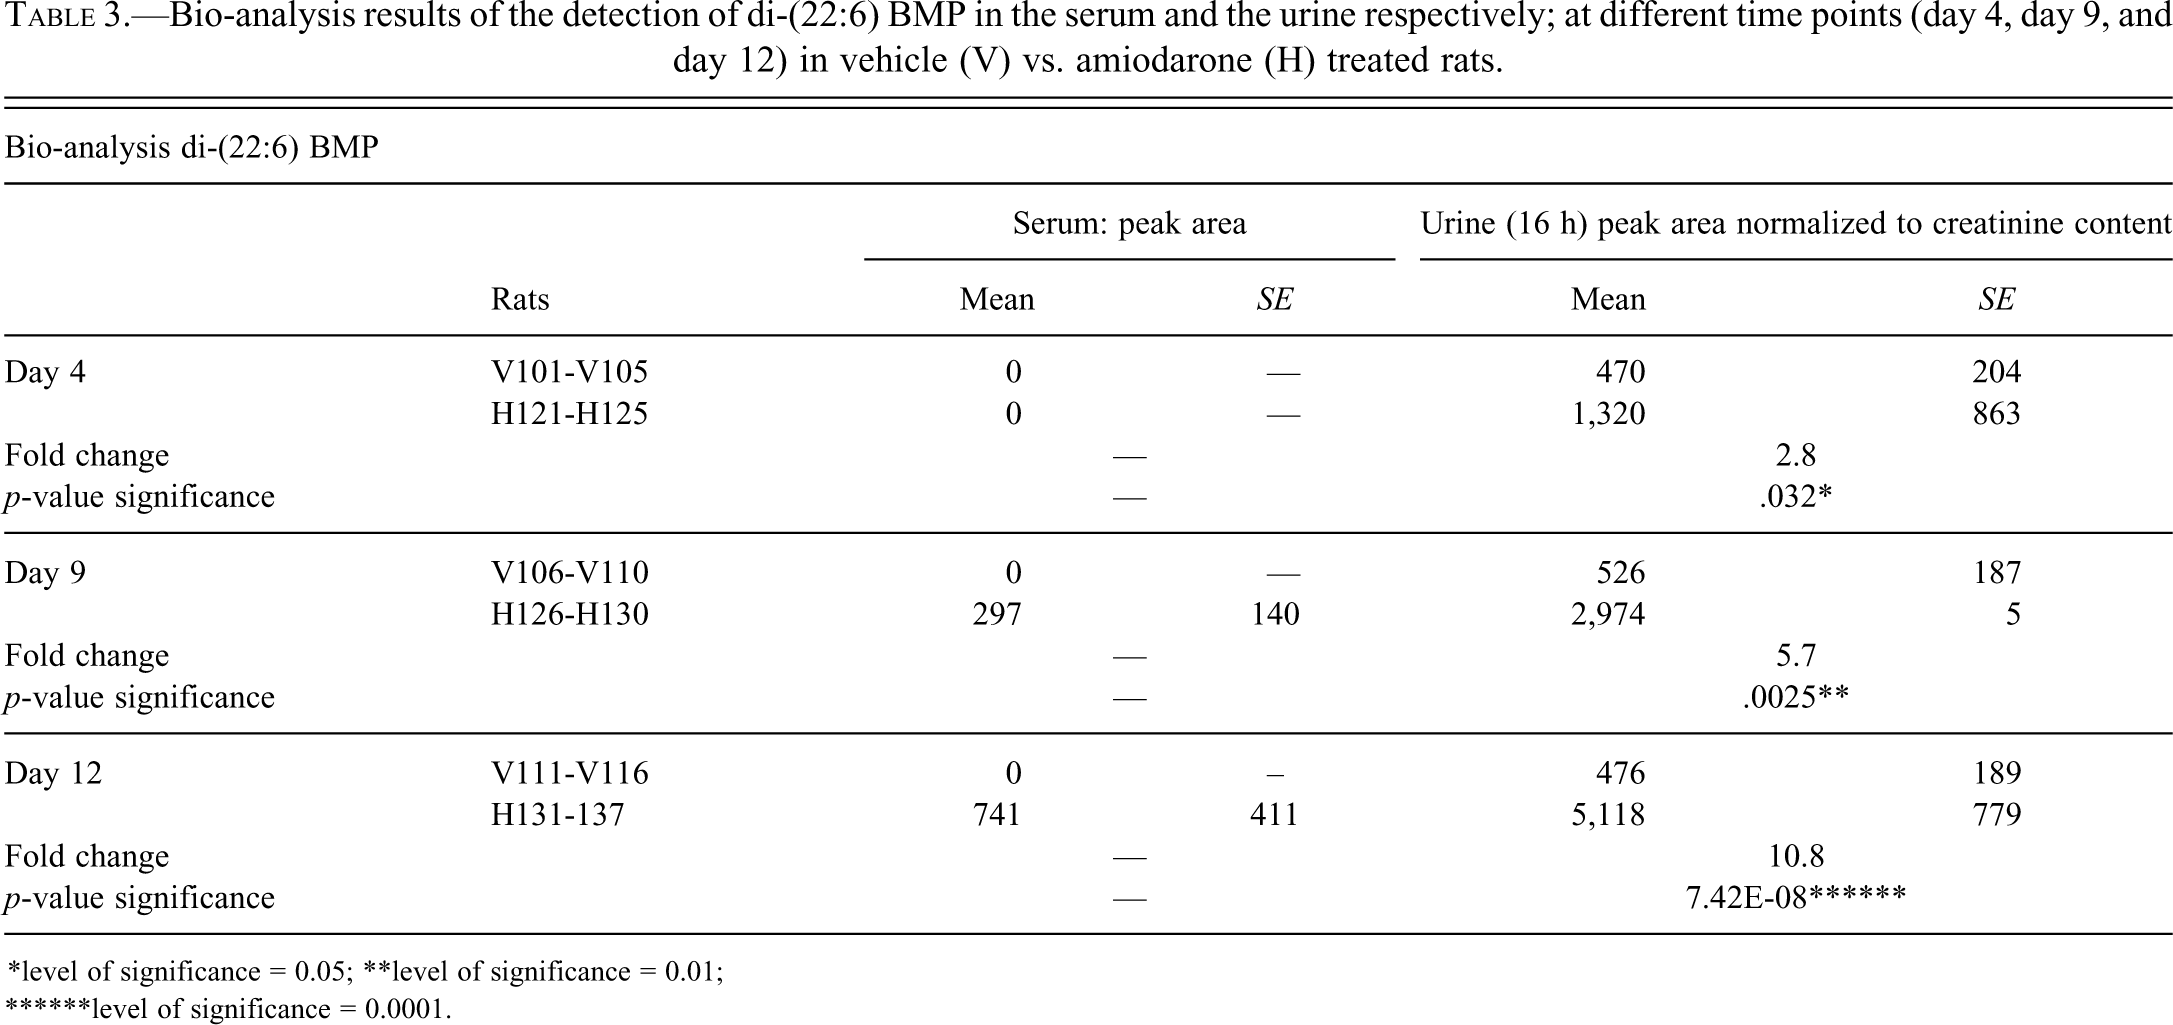
*level of significance = 0.05; **level of significance = 0.01;
******level of significance = 0.0001.
The di-(C22:6)-BMP peak actually consists of 3 closely eluting peaks (results not shown). An explanation for the presence of 3 peaks is acyl-migration. This can either occur from the 1-position to the 2-position, from the 1’-position to the 2’-position, or both, thus resulting in 3 different peaks (sn-1: sn-1’; sn-2: sn-1’and sn-1: sn-2; sn-2;sn-2’). In the analysis, the three peaks were summed, assuming that the response factors of the individual isomers are identical. Although this assumption could not be tested for di-(C22:6)-BMP because no reference compound was available, some tests were conducted with a similar compound, di-(18:1)-BMP. Results with this compound showed that the isomerisation had no significant impact on the absolute response. The summation of the 3 peaks was thus considered valid.
Analysis of Di-(C22:6)-BMP in Serum
Di-(C22:6)-BMP was shown to be stable in serum for at least 4 hours at room temperature and for at least 2 hours on melting ice.
In serum, 2 peaks were found at the mass transition of di-(C22:6)-BMP. A minor peak was found at 6.2 min and a major peak was found at 7.8 min. Further identification experiments using Mass Spectrometry revealed that the peak at 7.8 min was not related to di-(C22:6)-BMP, therefore this peak was not taken into account. The peak at 6.2 min is di-(C22:6)-BMP, but the levels were below the limit of detection on day 0 and day 4 and very low on day 9 and day 12. A 2.5 fold increase was observed between day 9 and day 12 in the amiodarone treated rats (Table 3).
Post-Mortem Evaluation of Lung, Liver, and Spleen
The target organs of amiodarone-induced phospholipidosis were analyzed to investigate signs of phospholipidosis by organ weight changes, histopathology, and T.E.M.
Organ weights and histopathology
Overall, slight changes were observed after 12 days of dosing in the lung, liver, and spleen and less pronounced changes were observed in the dosed groups killed at earlier time points. From day 4, a minimal to slight decreased weight of the spleen was observed and a minimal increase in MPS-aggregates was seen in the liver. Additionally, from day 9, progressive multifocal alveolar histocytosis in the lungs was noted. At day 12, the lung (rel.) and liver weights (abs. and rel.) were increased, and in the spleen vacuolated histiocytes were seen, with some lymphoid atrophy (Table 2).
Apart from the minimal increases in lung and liver weights and the appearance of histiocytosis with vacuolated histiocytes, which could be indicative of the occurrence of phospholipidosis, no obvious histopathological changes were observed. Transmission electron microscopy (T.E.M.) was therefore performed on the organs to provide evidence of amiodarone-induced phospholipidosis.
Transmission electron microscopy
In the vehicle-treated rat, early stage alveolar macrophages contained many highly electron dense lysosomes (Figure 3 left). In this vehicle dosed animal, the alveolar lumen of the lung was largely free of secreted surfactant material. In the amiodarone-dosed rat, lamellated inclusion bodies were seen to accumulate in the alveolar macrophages (Figure 3 right), bronchiolar Clara cells, and ciliated epithelial cells. Furthermore, lamellated inclusion bodies and not the typical lamellar surfactant granules were observed in the type II pneumocytes. Lamellated inclusion bodies were also evident in type I pneumocytes and capillary endothelial cells.
In the spleen of the vehicle-dosed rat, the macrophages contained many rather moderate electron dense lysosomal bodies without lamellated membranes. In the amiodarone-dosed rat, 12 days of amiodarone treatment resulted in lysosomes of the macrophages largely filled with lamellated inclusion bodies. Part of the reticulocytes, lymphocytes, neutrophils, smooth muscle cells, and endothelial cells contained one or more lamellated inclusion bodies.
Transmission electron microscopy thus confirmed the occurrence of phospholipidosis.
Microarray Analysis
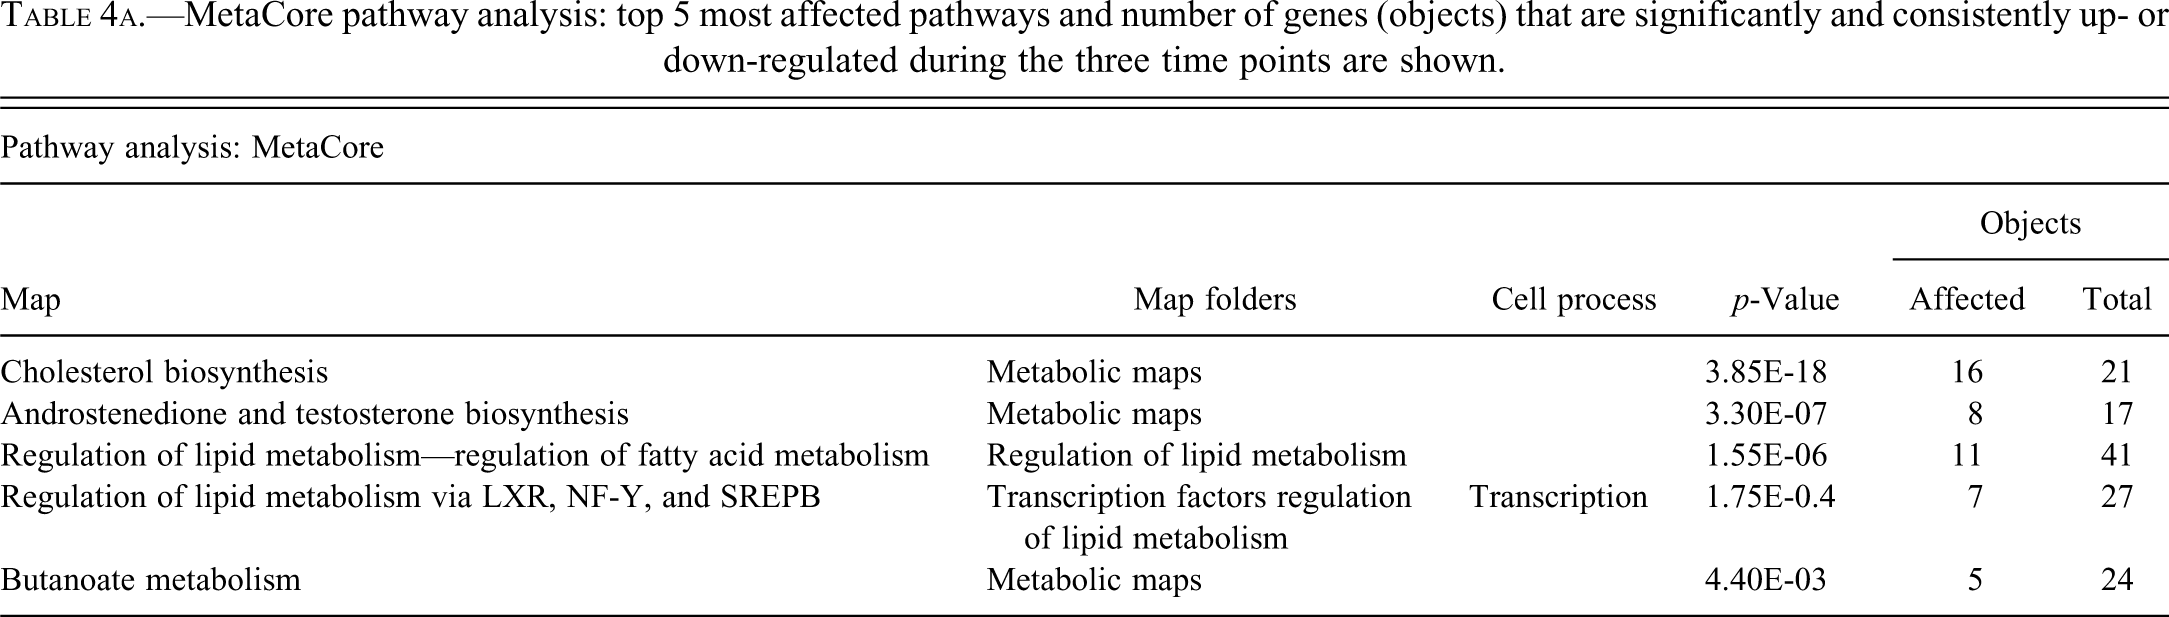
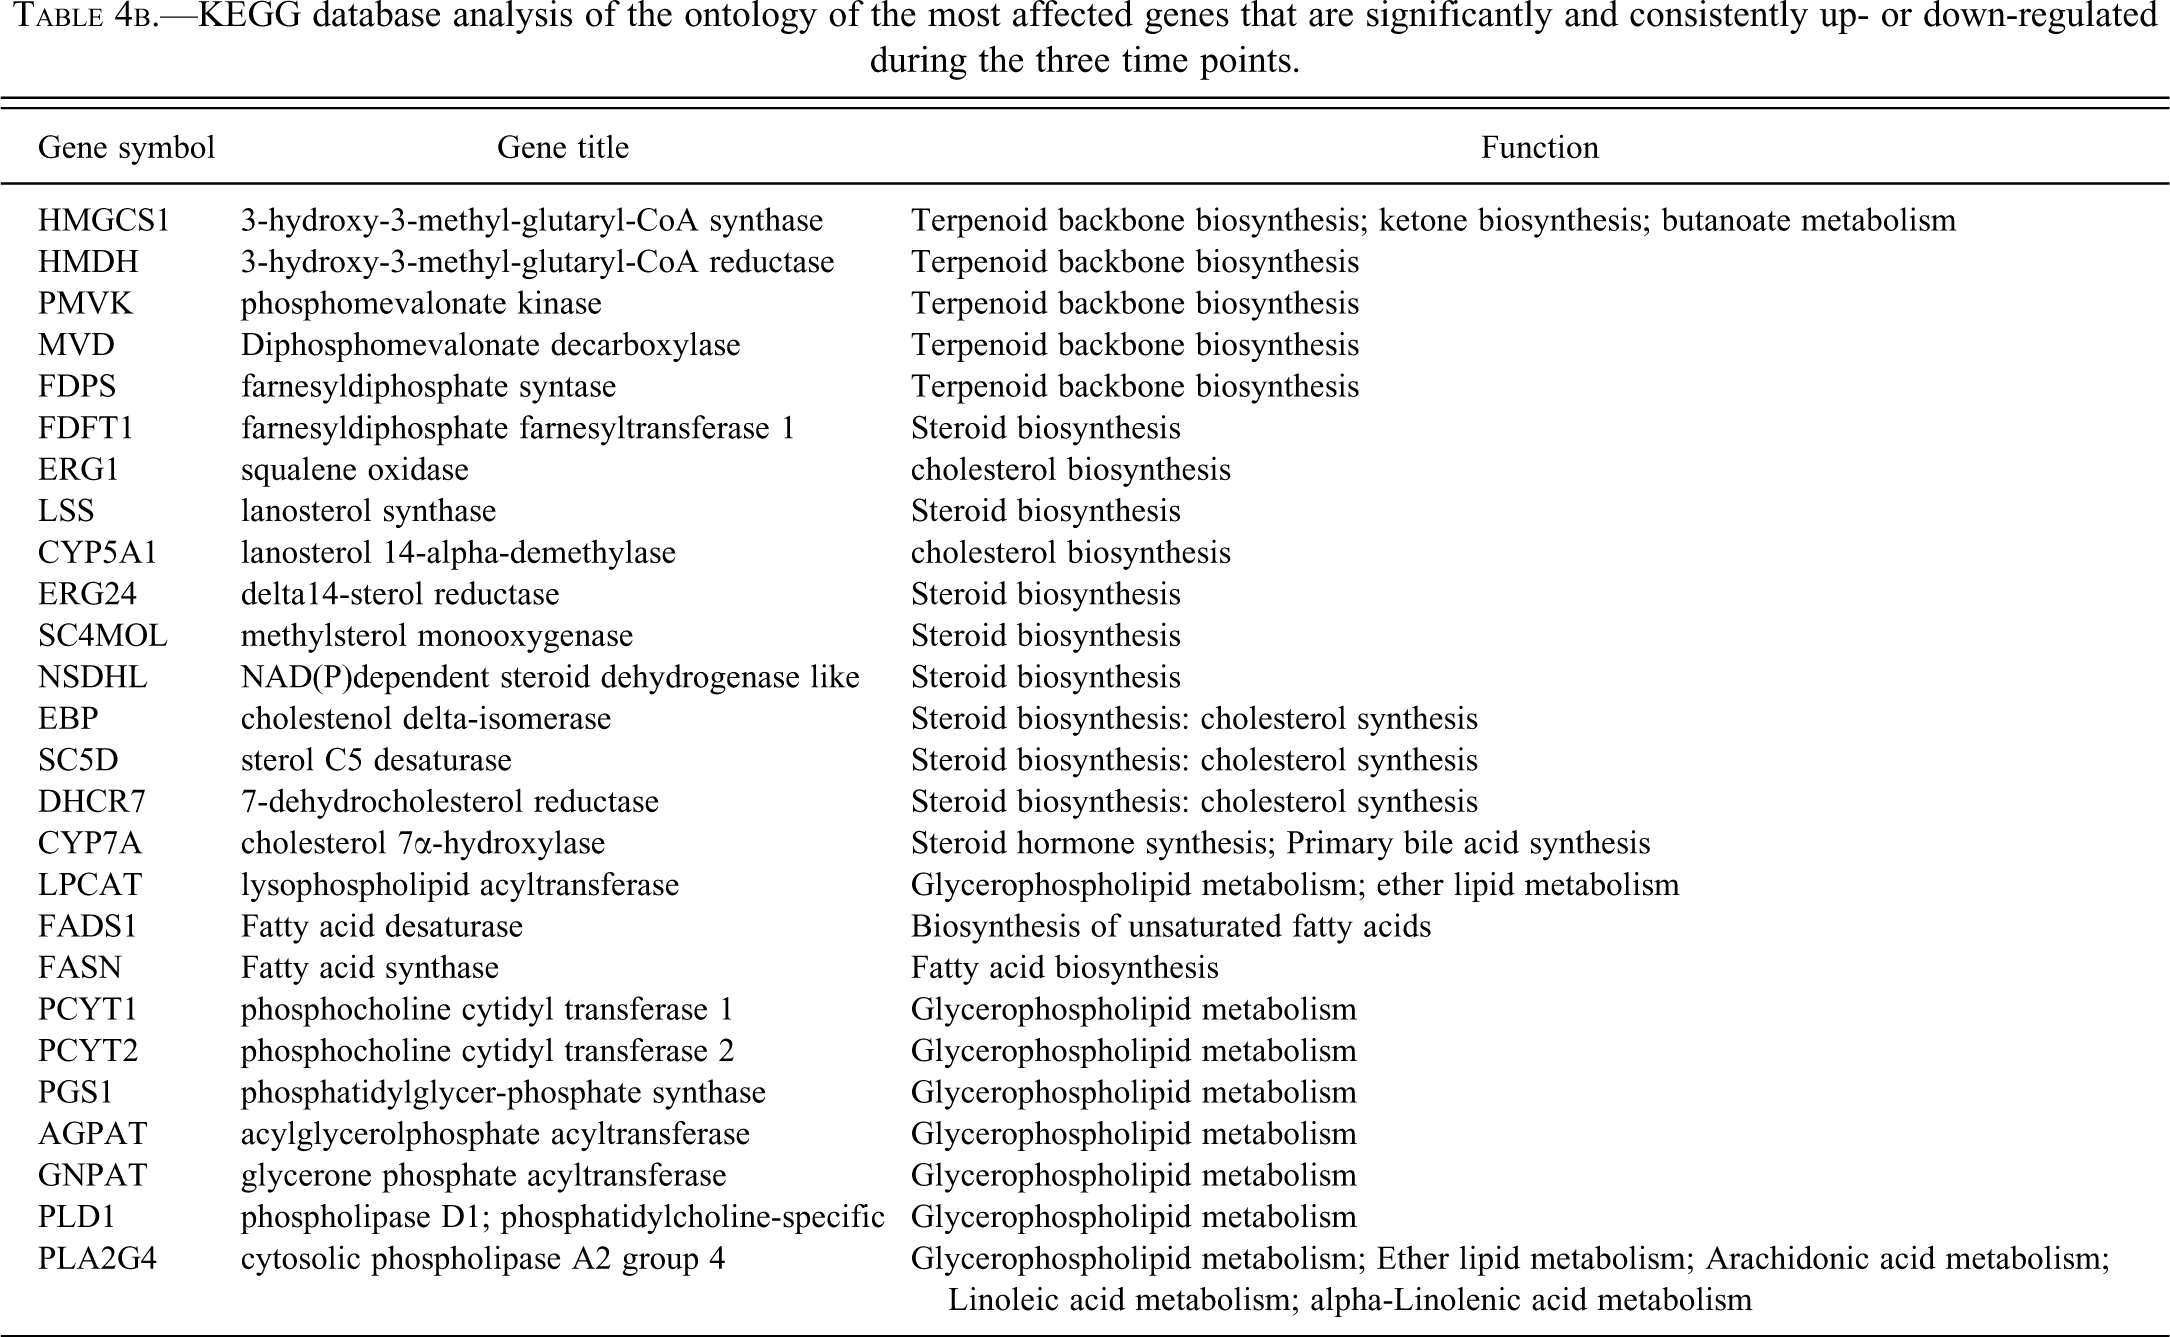
Microarray analysis showed that several probesets were significantly modulated at each time point investigated and the number of significantly modified probesets increased with the time of exposure to amiodarone. A global SAM analysis, comparing all amiodarone samples to the vehicle samples, indicated that more than 480 probe sets were significantly modulated. Pathway analysis with MetaCore revealed significant modulation of many metabolic pathways involving lipid metabolism. The most affected pathways were cholesterol biosynthesis, androstenedione and testosterone biosynthesis, regulation of lipid metabolism and butanoate metabolism (Table 4a). The genes associated with these pathways, which were significantly and consistently up or down regulated during the three time points (day 4, day 9, and day 12) are shown in Table 4b. Further analysis of the genes involved in the pathways was performed with KEGG pathway analysis.
MetaCore pathway analysis: top 5 most affected pathways and number of genes (objects) that are significantly and consistently up- or down-regulated during the three time points are shown.
KEGG database analysis of the ontology of the most affected genes that are significantly and consistently up- or down-regulated during the three time points.
Butanoate metabolism
Butanoate metabolism, together with a number of genes in the ketone body production, was significantly up-regulated (KEGG map 00650; figure not shown). These pathways are considered to be unrelated to phospholipidosis-induction with amiodarone. Amiodarone is also a steatosis-inducer and is thus known to inhibit the β-oxidation of fatty acids. Ketone bodies serve as an alternative fuel source, and the ketone body production might be up-regulated for this purpose. Otherwise, the loss in body weight during the study (around 16%) might be responsible for the induction of this process.
De novo cholesterol biosynthesis
The most affected pathway, in which all affected genes were up regulated from day 9, was the cholesterol biosynthesis pathway (KEGG maps 00900 and 00100; Figure 4). In addition to the cholesterol synthesis, a number of pathways were up-regulated, starting from de novo synthesized cholesterol. Most evident is the steroid hormone pathway, containing the androstenedione and testosterone biosynthesis (KEGG map 00140; figure not shown). In addition two pathways are upregulated: the primary bile acid synthesis, synthesizing bile acids from de novo cholesterol via CYP7A and the formation of a cholesterol ester via lecithine-cholesterol acyltransferase (LCAT) and phosphatidylcholine—both up-regulated as well, to prepare cholesterol for transport from the liver to other tissues.
Glycerophospholipid metabolism
Most other affected genes were situated in the glycerophospholipid pathway (KEGG map 00564; Figure 4). A first up-regulated reaction is the synthesis toward phosphatidylglycerol, evidenced by the up-regulation of five of seven genes. From this phospholipid, a putative pathway toward BMP is suggested (Hullin-Matsuda et al. 2009; Tengstrand, Miwa, and Hsieh 2010). Other reactions in this metabolic pathway involve the generation of the phospholipids phosphatidylcholine, phosphatidylethanolamine, and phosphatidylserine. Interconversion between the phosphatidyl and the 1-acyl-sn-glycerol-3 form is driven toward the phosphatidyl via up-regulation of LPCAT and down-regulation of the phospholipases PLA2G and PLD (Figure 4). Synthesis of phospholipids can also be initiated from the fatty acid metabolism, as both the fatty acid synthase and the fatty acid reductase were strongly up-regulated.
Discussion
Due to the current lack of validated biomarkers for monitoring drug-induced phospholipidosis, the onset and time course cannot be followed in healthy volunteers or patients and can therefore restrain drug development or drug approval (Reasor, Hasting, and Ulrich 2006). Recently, possible biomarkers have been proposed: the occurrence of vacuolated lymphocytes in the blood (Muller and Dieterle 2009) and the occurrence of a specific phospholipid in urine and serum of treated animals: bis (22:6) monoacylglycerophosphate (Mortuza et al. 2003; Baronas et al. 2007). To gain more insight in the generation of this specific phospholipid and to provide a correlation with the more conventional detection techniques, a mechanistic in vivo study was set up in which rats were treated with amiodarone, a known phospholipidosis-inducer (Goldman et al. 1985; Guigui et al. 1988; Lewis et al. 1988; Kannan et al. 1991; Reasor et al. 1996).
Phospholipidosis occurrence in the tissues was first confirmed with the conventional detection techniques of light microscopy and subsequent T.E.M. The short treatment time (12 days) was not sufficient to detect vacuolated cells in the target organs of amiodarone-induced phospholipidosis with light microscopy, indicating that extensive PLD, occurring for weeks or even months, is probably needed to identify vacuolated cells with this detection technique. The more sensitive T.E.M., however, did confirm the occurrence of PLD. The same observations were made in the blood lymphocytes: light microscopically, around 5% of the lymphocytes contained one or multiple vacuoles at all three time points (day 4, day 9, and day 12), whereas T.E.M revealed that around 33% of the lymphocytes were affected. With light microscopy having a low sensitivity and T.E.M. being highly labor-intensive and time-consuming, a sensitive and noninvasive biomarker that is easily measurable would be of particular interest.
Serum chemistry analysis showed a significant increase in phospholipids and HDL- and LDL-associated cholesterol in the amiodarone treated rats. These observations could be properly explained by the micro-array analysis on the liver of the treated rats. The most affected pathway was the de novo cholesterol biosynthesis, and subsequent esterification of the OH-group of cholesterol by lecithine-cholesterol acyltransferase (LCAT), preparing cholesterol for transport by the subsequent partitioning of the cholesterol esters in the interior of the lipoprotein particles HDL and LDL. The other most affected pathways involved phospholipid metabolism, and with the KEGG pathway analysis, glycerophospholipid metabolism appeared to be mostly affected. In the glycerophospholipid metabolism pathway, all reactions were up-regulated toward the formation of the phospholipids phosphatidylglycerol, -ethanolamine, -serine, and –choline, again correlating with the serum analysis. As slightly increased ALT-values were also evident, an increase in these serum phospholipids by leakage in the serum due to liver damage was also considered; however, microarray analysis indicated that synthesis of phospholipids is the most plausible explanation and relevance of the minimally increased ALT values in amiodarone-treated rats in the absence of histological liver changes is limited.
By analysis of urine, an increase in di-(C22:6)-BMP during treatment was evident. Di-(C22:6)-BMP increased up to 10-fold in the urine by the end of treatment. This increase could be due to the decreased degradation in BMP in the PLD affected tissues, as cited in the literature (Yamamoto et al. 1971; Matsuzawa et al. 1977). BMP could also be increased due to an increased synthesis of BMP, or to a combination of both.
Combining the genomic, biochemical, and bioanalytical results, our results suggest that an interaction takes place between the CAD amiodarone and phospholipids at the level of BMP-rich membranes, impeding cholesterol sorting and leading to an accumulation of internal membranes, converting into multilamellar bodies. We speculate that during amiodarone-induced phospholipidosis, analogous to NPC, a lipid traffic jam occurs at the late endosomes/lysosomes, leading to accumulation of cholesterol, phospholipids, and a rise in BMP. In response to this lipid traffic jam, the cholesterol shortage must be compensated and the phospholipid balance must be restored. Speculated is that the BMP synthesis is increased as well, to repair the disturbed lipid balance in the late endosomes. This suggested synthesis pathway starts mainly from phosphatidylglycerol, but could also start from phosphatidylcholine (Tengstrand, Miwa, and Hsieh 2010). Support for the lipid traffic jam hypothesis can be found in the micro-array analysis data, showing clear up-regulation of de novo cholesterol and phospholipid synthesis, as well as of the specific phospholipids suggested being the starting material of BMP. Furthermore, in experiments with npc1-/- mice, cholesterol biosynthesis was also up-regulated. The amount of de novo cholesterol synthesized was measured and equaled the amount of cholesterol that was trapped in the late endosomes (Beltroy et al. 2007).
Whereas the NPC-induced lipid traffic jam is situated at the level of the cholesterol sorting proteins NPC1 and NPC2, we speculate the amiodarone-induced traffic jam is located at the BMP level, ultimately leading to the same functional consequences (cholesterol increase and phospholipid increase) and the same phenotype (multilamellar bodies). We hypothesize that CADs, having a high affinity for negatively charged phospholipids, bind BMP of these internal membranes (Tengstrand, Miwa, and Hsieh 2010), thereby disturbing the lipid balance of the membrane vesicles. In normal cells the acid sphingomyelinase is assumed to generate ceramide from sphingomyelin in the internal vesicles by binding to the negatively charged BMP (Abdul-Hammed et al. 2010, Fig. 1d). Ceramide has a relatively weak affinity toward cholesterol, compared to sphingomyelin, and thereby an increase in ceramide content will result in a decrease in cholesterol during endosomal maturation. In case of phospholipidosis, CADs binding to BMP are assumed to displace the sphingomyelinase, which is also a cationic lipid binding protein, as has been demonstrated for the CAD desimipramine (Schulze, Kolter, and Sandhoff 2009). Consequently sphingomyelin remains resided in the internal vesicles, having a high affinity towards cholesterol. It is speculated this impedes cholesterol removal by NPC1 and NPC2, thereby disturbing the BMP/cholesterol lipid balance and inducing a lipid traffic jam.
In conclusion, mechanistic insights from this study support a role for BMP in the induction mechanism of phospholipidosis, which increases the significance of BMP as a potential biomarker for this drug-induced side effect. From this and three other published BMP studies (Mortuza et al. 2003; Baronas et al. 2006; Tengstrand, Miwa, and Hsieh 2010), di-(C22:6)-BMP is proven to be a sensitive biomarker for at least three CADs that induce phospholipidosis: amiodarone, gentamycin, and azithromycin. The time-related increase observed by Baronas et al. (2006) could be repeated, showing reproducibility. From the results obtained in this study, we consider urine as the best matrix to screen for BMP. Serum is a less suitable matrix than urine, as only a very small di-(C22:6)-BMP peak was observed in the treated animals and the levels were only above the limit of detection from day 9 onward. If the sensitivity of the analytical method would be improved, serum might be an alternative matrix for urine.
Di-(C22:6)-BMP is certainly a more sensitive surrogate marker than the detection of circulating vacuolated lymphocytes by light microscopy. Only low percentages of vacuolated lymphocytes could be detected and no time related increase was observed. Because of these limitations of light microscopy, a considerable discrepancy was evident between the percentage of vacuolated lymphocytes (5%) and the percentage lymphocytes containing multilamellar bodies (33%). Furthermore, clinical studies trying to monitor drug-induced phospholipidosis with the detection of vacuolated lymphocytes so far only retrieved noninterpretable results (Pospischil, Walther, and Dingemanse 2009).
Before di-(C22:6)-BMP can be used in regulatory settings as a validated biomarker for drug-induced phospholipidosis, additional validation studies are required. Additional studies are needed to determine the usefulness of BMP determination in urine for tissue-specific phospholipidosis, when phospholipidosis is limited to only one organ, like the peripheral and central nervous system, or skeletal muscle cells. Part of this work will be the subject of the Food and Drug Administration (FDA) phospholipidosis working group in the near future (FDA Projects in Scientific Priority Areas 2009). If successful, this sensitive translatable biomarker for drug-induced phospholipidosis will enable both preclinical and clinical follow-up of potential phospholipidosis issues.
Footnotes
The authors declared no potential conflicts of interests with respect to the authorship and/or publication of this article. The authors received no financial support for the research and/or authorship of this article.