
Abstract
Ginkgo biloba leaf extract (GBE) has been used for centuries in traditional Chinese medicine and today is used as an herbal supplement touted for improving neural function and for its antioxidant and anticancer effects. Herbal supplements have the potential for consumption over extended periods of time, with a general lack of sufficient data on long-term carcinogenicity risk. Exposure of B6C3F1 mice to GBE in the 2-year National Toxicology Program carcinogenicity bioassay resulted in a dose-dependent increase in hepatocellular tumors, including hepatocellular carcinoma (HCC). We show that the mechanism of hepatocarcinogenesis in GBE exposed animals is complex, involving alterations in H-ras and Ctnnb1 mutation spectra, WNT pathway dysregulation, and significantly altered gene expression associated with oncogenesis, HCC development, and chronic xenobiotic and oxidative stress compared to spontaneous HCC. This study provides a molecular context for the genetic changes associated with hepatocarcinogenesis in GBE exposed mice and illustrates the marked differences between these tumors and those arising spontaneously in the B6C3F1 mouse. The molecular changes observed in HCC from GBE-treated animals may be of relevance to those seen in human HCC and other types of cancer, and provide important data on potential mechanisms of GBE hepatocarcinogenesis.
Introduction
Ginkgo biloba leaf extract (GBE) is one of the most widely used herbal supplements in the United States and has been used in traditional Chinese medicine for centuries (Chan, Xia, and Fu 2007). Today, it is used commonly for its purported effects in improving brain function, antioxidant properties, and anticancer effects (Chan, Xia, and Fu 2007; Moon, Wang, and Morris 2006). GBE has been used widely for treatment of various central nervous system diseases including peripheral and cerebral vascular disorders and ischemic or Alzheimer-type dementia (Chan, Xia, and Fu 2007; Le Bars et al. 1997) and is reported to possess anticancer properties related to its antioxidant, anticlastogenic, and gene-regulatory actions (DeFeudis, Papadopoulos, and Drieu 2003; Moon, Wang, and Morris 2006). Its powerful antioxidant properties include scavenging free radicals and related reactive oxygen species (Deby et al. 1993; Gardes-Albert et al. 1993; Maitra et al. 1995; Marcocci et al. 1994; Oyama et al. 1996), chelating prooxidant transition metal ions (Gohil and Packer 2002), inhibiting enzymes catalyzing the generation of free radicals (Monboisse et al. 1993; Packer et al. 1995; Pasquier, Babin-Chevaye, and Marquetty 1996; Pietri et al. 1997; Pincemail et al. 1987), and enhancing expression of genes that encode antioxidant enzymes (Chen et al. 2001; Gohil et al. 2000; Rimbach et al. 2001). GBE has been reported to reverse hepatic fibrosis due to chronic hepatic injury (Zhang et al. 2006) and to possess hepatoprotective, cardioprotective, antiasthmatic, antidiabetic (Naik and Panda 2007), and antiangiogenic properties (DeFeudis, Papadopoulos, and Drieu 2003). However, despite its many reported beneficial effects, the exact mechanism by which GBE functions to produce them is still unclear.
GBE was nominated for study by the National Cancer Institute (NCI) as part of a review of botanicals being used as dietary supplements in the United States. GBE was selected for review because (1) GBE and its active ingredients, the flavonoids and ginkgolides, have demonstrated biological activity, (2) there is widespread exposure to GBE and it may potentially be consumed in large amounts for prolonged periods of time, (3) there are insufficient studies to evaluate for potential carcinogenicity after prolonged use, and (4) some ingredients in GBE are known in vitro mutagens. For example, quercetin, the most well-characterized mutagenic constituent and a high-dose rodent carcinogen, is concentrated from the Ginkgo leaf during processing (National Toxicology Program [NTP] 2012).
As with all herbals in the NTP testing program, selection of a test article is challenging due to the complexity of the materials and the breadth of products represented in the marketplace. GBE, in particular, is a complex mixture with many diverse constituents. The terpene lactones and flavonol glycosides are generally regarded as the active constituents responsible for the positive biological activity ascribed to GBE (van Beek and Montoro 2009), while the ginkgolic acids have been associated with cytotoxicity and mutagenicity in vitro (Westendorf and Regan 2000). Standardized GBE is designed to contain at least 24% flavonol glycosides and 6% terpene lactones, and limit the amount of ginkgolic acids to 5 ppm or less. However, these recommended levels are not enforced in U.S. products and constituent concentrations vary widely in GBE available on the marketplace with a recent European survey finding variation of 27 to 358% of the target concentration for terpene lactones and 86 to 418% for flavonoids (Fransen et al. 2010). Furthermore, Kressmann et al. found in a survey of GBE products available in the U.S. market, that the majority of products tested were not in accordance with the stated specifications and that ginkgolic acid concentrations displayed a wide range from <500 ppm to around 90,000 ppm (Kressmann, Muller, and Blume 2002). In this context, the GBE test article selected for study in the 2-year bioassay is comparable to other GBE products available in the marketplace. The GBE used in the 2-year bioassay contained levels of flavonol glycosides (31.2%) and terpene lactones (15.4%) on the higher end of the spectrum, while ginkgolic acids (10.45 ppm) were on the low end of those measured in products available in the marketplace (Kressmann, Muller, and Blume 2002).
Hepatocellular carcinoma (HCC) in humans is an extremely complex disease, involving dysregulation of numerous growth and oncogenic pathways, chromosomal aberrations, and genetic mutations. The disease accounts for greater than 90% of liver cancer in humans and is the third leading cause of cancer mortality worldwide (Altekruse, McGlynn, and Reichman 2009). The cause and pathophysiology of human HCC is multifactorial, associated with various carcinogens, infectious agents (hepatitis B virus, hepatitis C virus), toxic agents (aflatoxin B1), genetic disease, and lifestyle factors such as chronic excessive alcohol intake (El-Serag and Rudolph 2007). HCCs occur spontaneously as a background lesion in ad libitum–fed B6C3F1 mice (34.7% in males, 12.1% in females by all routes; NTP historical controls 2011), and share some similarities at the histologic and genetic level with human HCCs (Hoenerhoff et al. 2011). Despite the complex nature of HCC in terms of molecular alterations and differences in etiology and pathogenesis between rodents and humans, HCC in both species share some key molecular alterations (Hoenerhoff et al. 2011; Kim, Sills, and Houle 2005). For example, mutation of the β-catenin gene (Ctnnb1) is a common event in mouse and human hepatocarcinogenesis, which results in unrestricted Wnt pathway signaling and oncogenesis (Devereux et al. 1999). Mutation of exon 2 of Ctnnb1 in mice is a well-known early event in hepatocarcinogenesis, and corresponds with exon 3 in humans, which is the “hot spot” region altered in approximately 25% of human HCC (de La Coste et al. 1998; Devereux et al. 1999; Stahl et al. 2005). In addition, alterations of H-ras are frequently found in spontaneous mouse HCC and may be induced by various chemicals (Maronpot et al. 1995; Watson et al. 1995). While HRAS gene mutation is uncommon in human HCC, overexpression of the HRAS protein occurs in up to 30% of cases (Tang et al. 1998) and is associated with increased tumor invasion and poor prognosis (Zhou 2002). The incidence of alterations in these genes may be influenced by chemical exposure. Differences in mutation spectra and expression of key cancer genes and pathways may occur between background spontaneous HCC and chemically induced tumors, and differentiating between tumors associated with chemical exposure and background is of critical importance when determining the relevance of a tumor response to compound exposure. Therefore, the goal of this study was 3-fold: to investigate spontaneous and GBE-treated HCC for relevant mutations that have been identified in human and mouse HCC, to assess alterations in pathways associated with HCC development (including the Wnt/Ctnnb1 pathway), and given the marked complexity of this disease and the inherent complexity of this compound, to evaluate these tumors for differences in global gene expression in order to define potential mechanisms of hepatocarcinogenesis in GBE exposed mice. Characterizing the molecular alterations that occur during hepatocarcinogenesis in GBE-exposed animals may provide insights into the mechanisms of tumorigenesis of this compound in B6C3F1 mice and aid in the assessment of this compound’s potential impact on human health.
Materials and Methods
Ginkgo biloba Extract Test Material
The Ginkgo biloba extract used for the NTP subchronic 90-day and chronic 2-year bioassays was obtained from Shanghai Xing Ling Science and Technology Pharmaceutical Company, Ltd. The key values measured in the extract included 31.2% flavonol glycosides, 15.4% terpene lactones, and 10ppm ginkgolic acids. The NTP determined that the Shanghai Xing Ling extract is similar to EGb 761®, and within a range of concentrations of the various constituents to what is available in the marketplace.
Hepatocellular Neoplasms
Male and female B6C3F1 mice were exposed to 0, 200, 600, and 2,000 mg/kg GBE by corn-oil gavage, 5 days a week for 2 years (Table 1; NTP 2012). The statistical trend analysis from the incidences of spontaneous and GBE-treated hepatocellular tumors were evaluated statistically using the poly-3 test. Husbandry and experimental procedures were in compliance with requirements set forth by the Public Health Service’s Guide for the Care and Use of Laboratory Animals. At necropsy, tissues were fixed in 10% neutral-buffered formalin, processed routinely, embedded in paraffin, and 5 µm sections were cut and stained with hematoxylin and eosin (H&E). Sections of normal liver and spontaneous HCC from vehicle control animals, and HCC from GBE-treated animals were collected and flash-frozen in liquid nitrogen at the time of necropsy for molecular analysis.
Incidences of select hepatic lesions in B6C3F1 mice treated with GBE by gavage in subchronic (90-day) and chronic (2-year) National Toxicology Program studies.
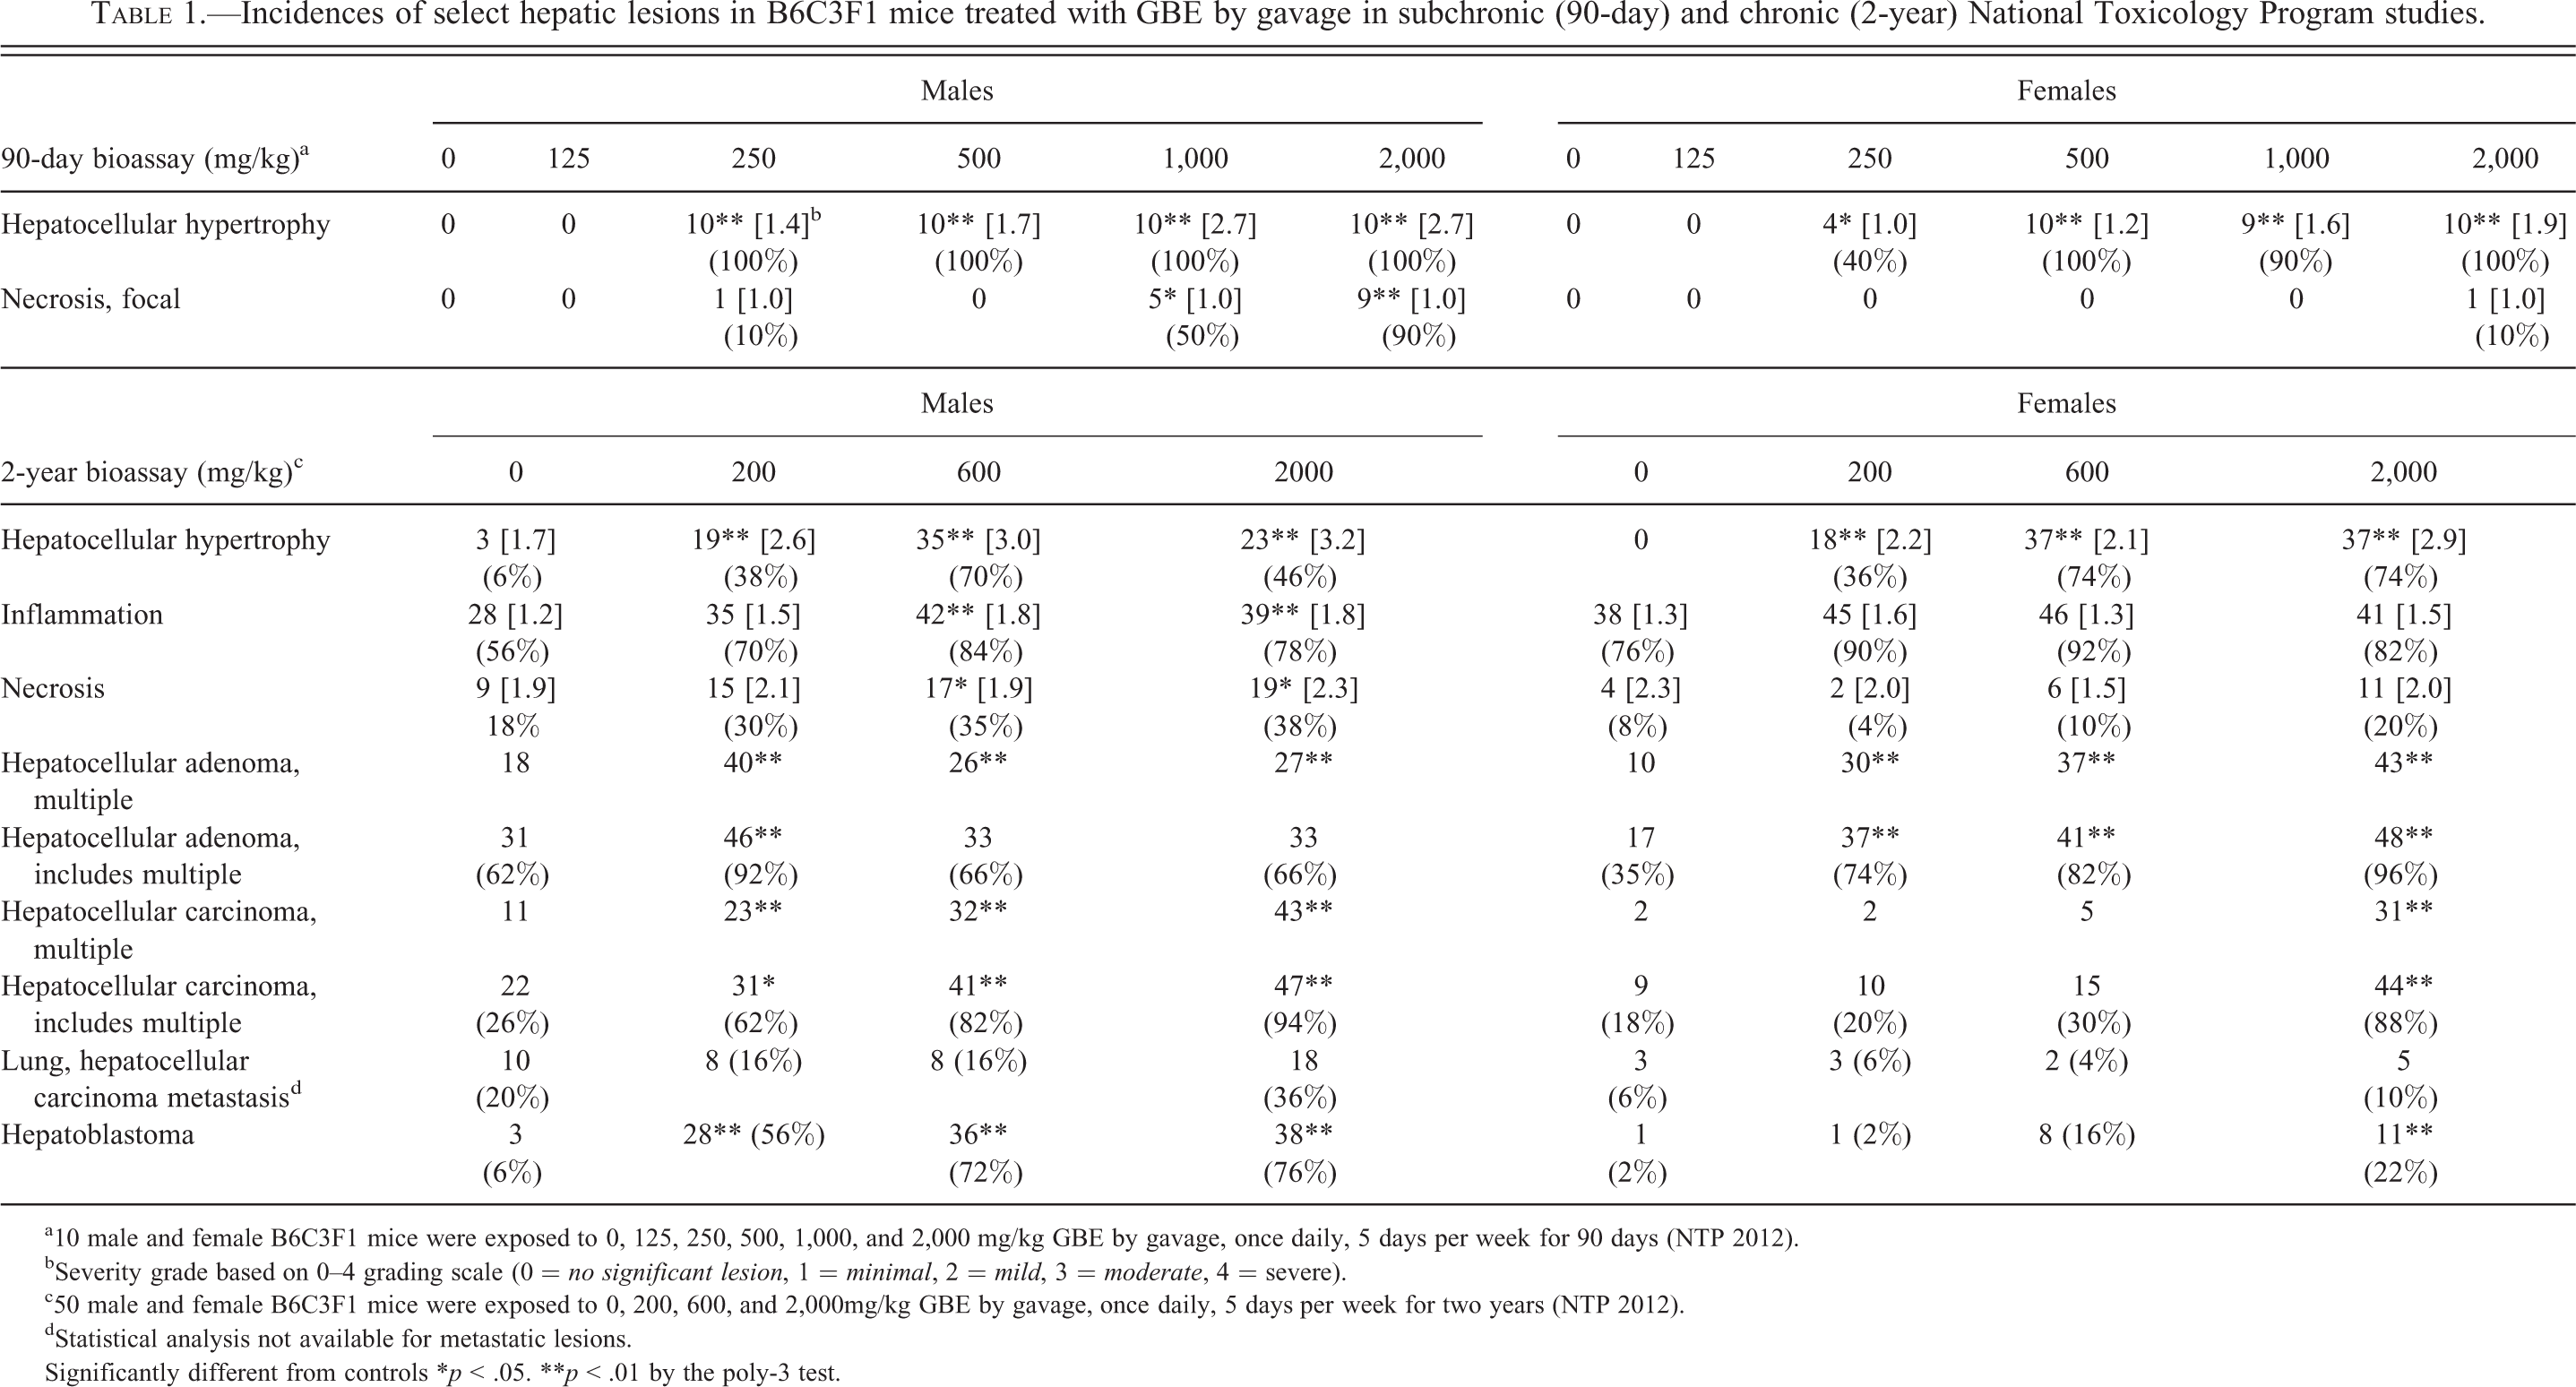
a10 male and female B6C3F1 mice were exposed to 0, 125, 250, 500, 1,000, and 2,000 mg/kg GBE by gavage, once daily, 5 days per week for 90 days (NTP 2012).
bSeverity grade based on 0–4 grading scale (0 = no significant lesion, 1 = minimal, 2 = mild, 3 = moderate, 4 = severe).
c50 male and female B6C3F1 mice were exposed to 0, 200, 600, and 2,000mg/kg GBE by gavage, once daily, 5 days per week for two years (NTP 2012).
dStatistical analysis not available for metastatic lesions.
Significantly different from controls *p < .05. **p < .01 by the poly-3 test.
In Vitro Genotoxicity
GBE was assessed for mutagenic potential in a bacterial mutagenicity assay that employed Salmonella typhimurium strains TA98 and TA100 (obtained from Dr. Bruce Ames, University of California, Berkeley, CA), and Escherichia coli strain WP2 uvrA pKM101 (supplied by Ms. Judy Mayo, Pharmacia Corporation, Kalamazoo, MI; procedure modified from Zeiger et al., 1992); these strains each have a mutation in the histidine operon that confers histidine dependence. Briefly, tester strains were incubated with GBE (concentration range: 1,000–10,000 µg/plate) either in buffer or S9 mix (metabolic activation enzymes and cofactors from Aroclor 1254-induced male Sprague-Dawley rat liver; MOLTOX, Boone, NC) for 20 min at 37°C. Concurrent positive and solvent (dimethylsulfoxide) control cultures were included in each trial. After 20 min, top agar supplemented with
DNA/RNA Isolation, Polymerase Chain Reaction (PCR) Amplification, and Autosequencing
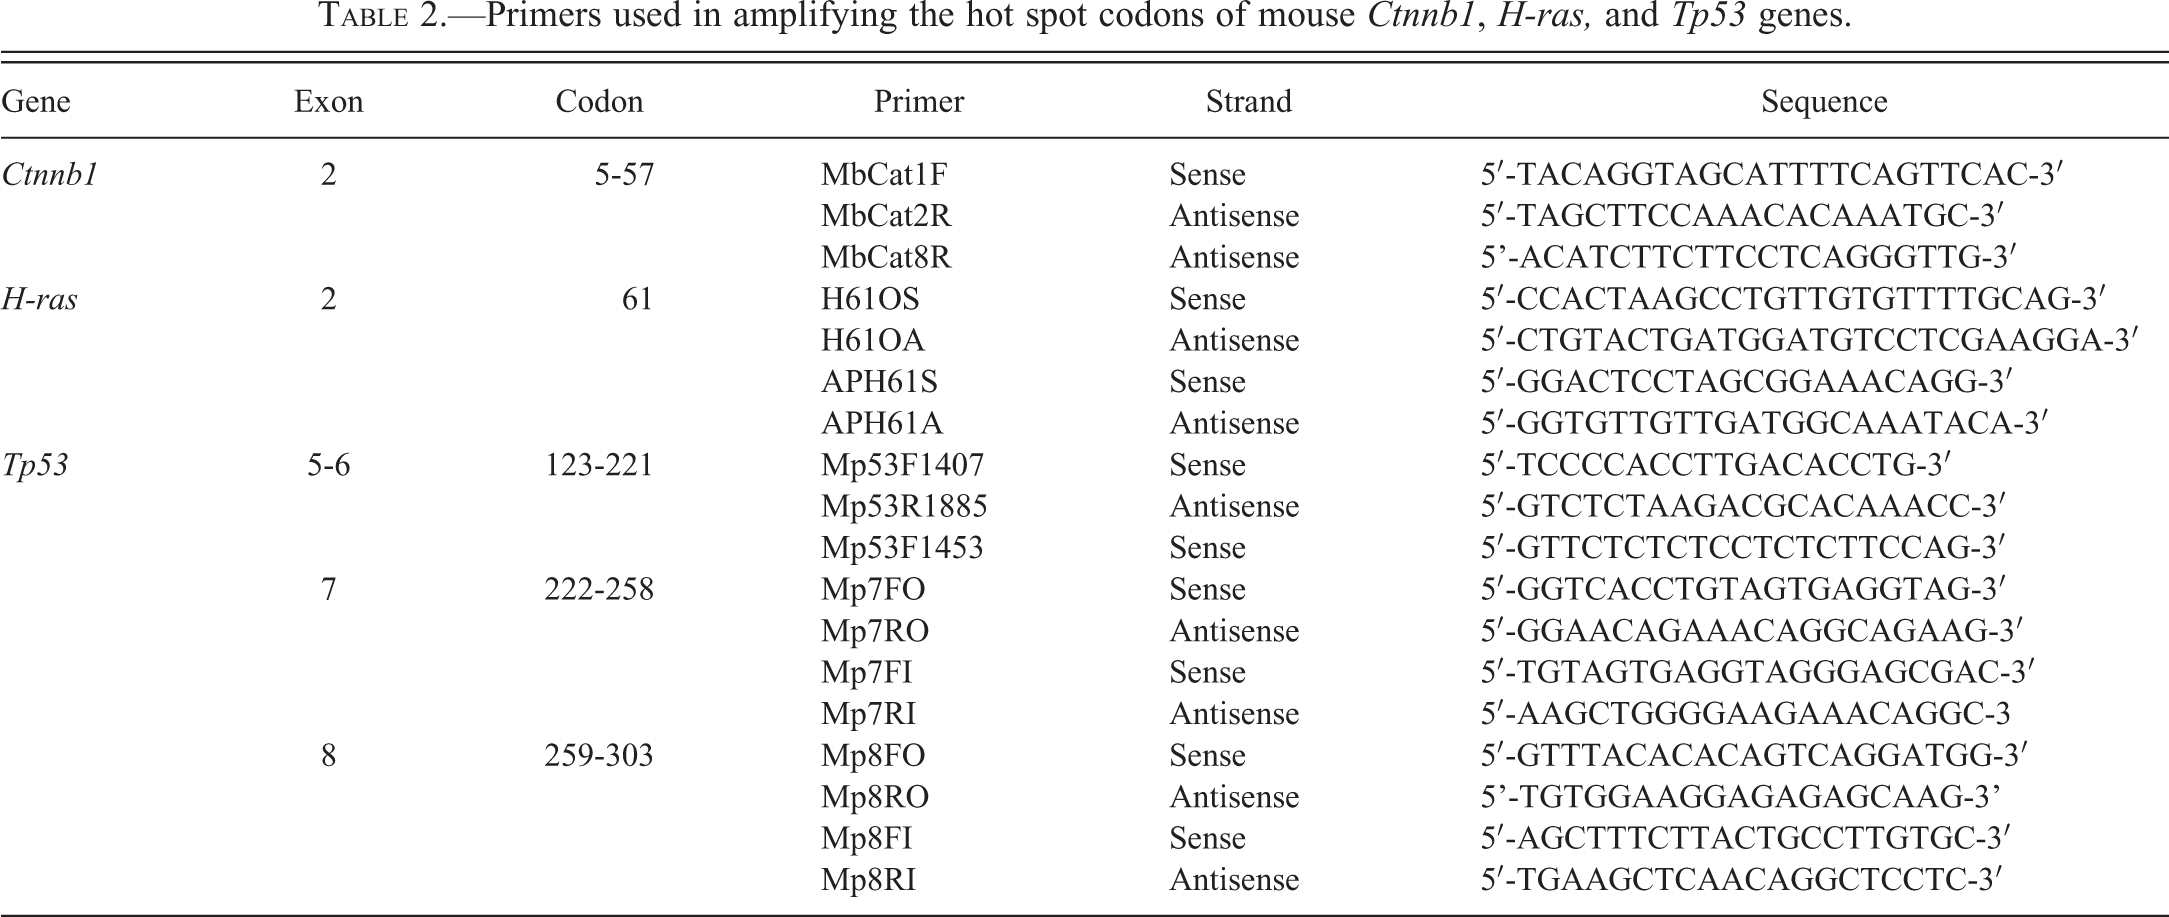
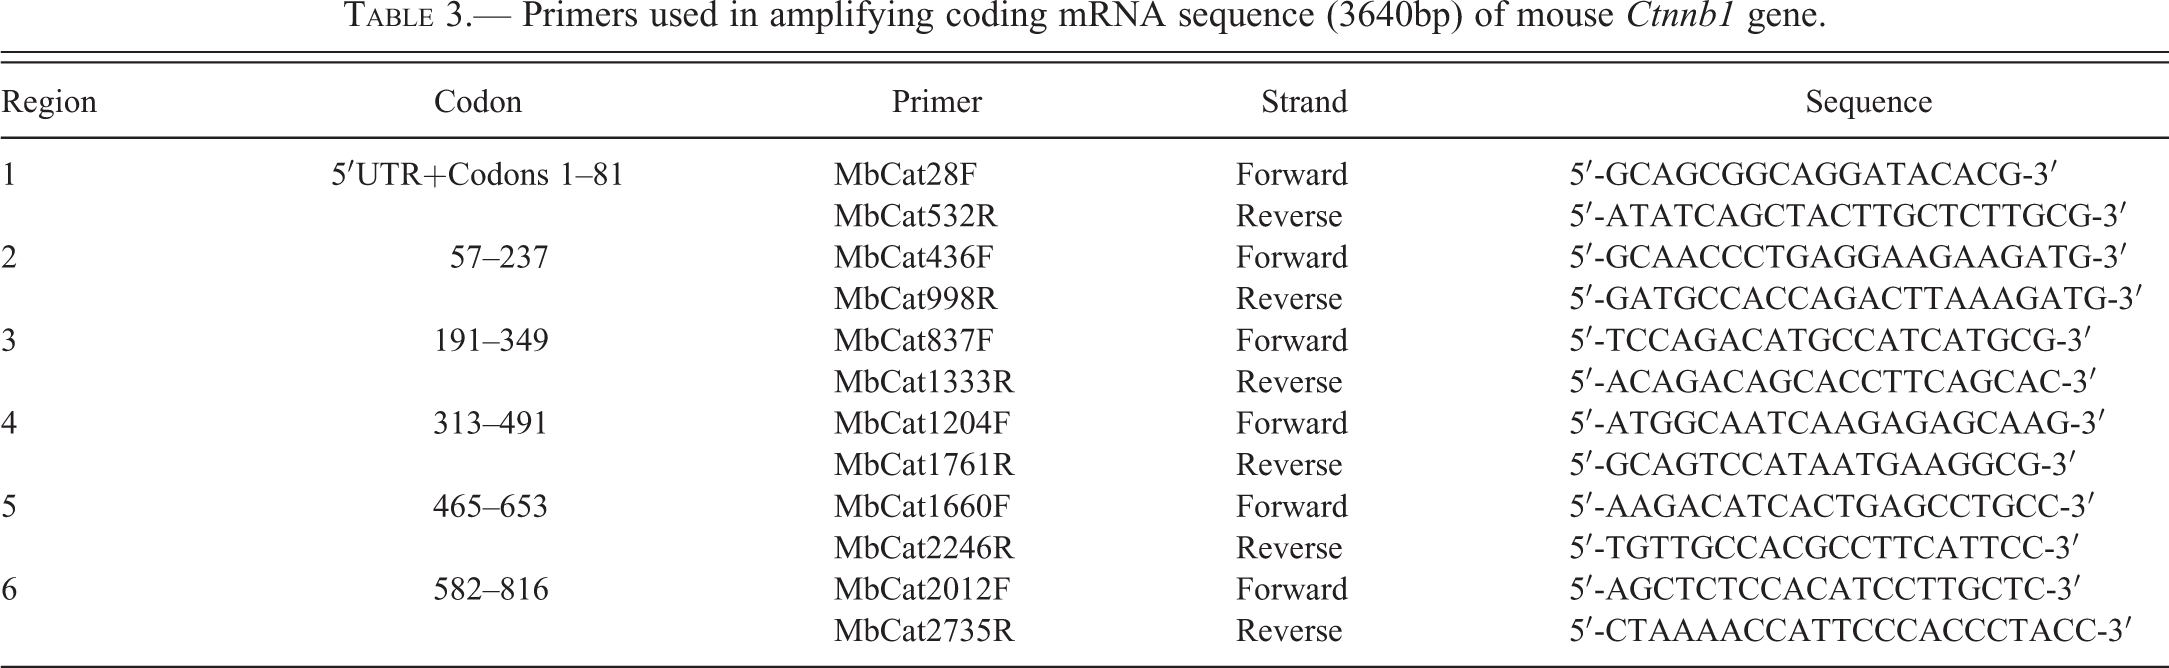
Sixty GBE-treated and 20 spontaneous HCCs were evaluated for mutations in exon 2 (codons 5-57) of Ctnnb1 and exon 2 (codon 61) of H-ras, and 10 spontaneous and 15 GBE-treated HCCs were evaluated for mutations in exons 5-8 (codons 123-303) of Tp53, representing the hot spot regions in these genes that correlate with mutations observed in human HCC. DNA was isolated and extracted from ten 10 µm sections of formalin-fixed, paraffin-embedded normal liver, GBE-treated, and spontaneous HCCs with DNeasy Tissue Kit (Qiagen, Valencia, CA). Amplification reactions were carried out by semi-nested PCR using the primer sets for exon 2 (corresponding to exon 3 in humans; codons 5-57) of the mouse Ctnnb1 gene, exon 2 (codon 61) of the mouse H-ras gene, and exons 5-6 (codons 123-221), exon 7 (codons 222-258), and exon 8 (codons 259-303) of the mouse Tp53 gene (Table 2). To assess mutation status of the entire Ctnnb1 gene sequence, total RNA was extracted from freshly frozen and histologically confirmed GBE-treated HCCs with Invitrogen TRIzol Kit (Cat# 12183-018A PureLink Mini Kit, Life Technologies Corporation, Carlsbad, CA). One µg of total RNA was subjected to reverse-transcription PCR to generate complementary DNA (cDNA). Amplification of the cDNA including GBE-treated HCC with single band and double band on Western blot were analyzed using 6 sets of designed primers (Table 3), according to mRNA sequences from entire coding regions of the Ctnnb1 gene (3,640 bp). PCR amplification employing Platinum Taq DNA polymerase were cycled 35 times through denature at 94°C for 30 s, anneal at 56°C for 30 s, extend at 72°C for 30 s, and controls lacking template DNA were run with all sets of reactions. PCR products for all gene targets were purified using a QIAquick Gel Extraction Kit (Qiagen, Valencia, CA). The purified PCR products were cycled with Terminal Ready Reaction Mix-Big Dye (Perkin Elmer, Foster City, CA), then purified extension products with DyeEx 2.0 Spin Kit (Qiagen, Valencia, CA). The lyophilized PCR products were sequenced with an automatic sequencer (Perkin-Elmer ABI Model 3100). The automated ABI DNA sequencing system detects fluorescence from different dyes that are used to identify the A, C, G, and T extension of the sequence reaction. Each sequence generates a 4-color chromatogram showing the analyzed data from which the machine determined the nucleotide sequence. The file of the electropherogram on the Mildred server was used for comparison between the control and the treated groups.
Primers used in amplifying the hot spot codons of mouse Ctnnb1, H-ras, and Tp53 genes.
Primers used in amplifying coding mRNA sequence (3640bp) of mouse Ctnnb1 gene.
Microarray Analysis and Quantitative Real-time (QRT)-PCR Validation
Global gene expression analysis was used to examine differential gene expression across normal, spontaneous, and GBE-treated HCCs. Affymetrix Mouse Genome 430 2.0 GeneChip arrays (Affymetrix, Santa Clara, CA) were used to assess gene expression. Amplification of 1 µg total RNA was performed as instructed in the Affymetrix One-Cycle cDNA Synthesis protocol. For each array, 15 µg of amplified biotin-cRNAs were fragmented and hybridized to each array for 16 hour at 45°C in a rotating hybridization oven using the Affymetrix Eukaryotic Target Hybridization protocol. Array slides were double stained with streptavidin/phycoerythrin and washed using the EukGE-WS2v5 protocol from the Affymetrix Fluidics Station FS450 for antibody amplification. Arrays were scanned in an Affymetrix Scanner 3000, and GeneChip® Command Console Software (AGCC; Version 1.1) was used to obtain the data. Fluorescent pixel intensity measurements were processed using the MAS5 algorithm (Hubbell, Liu, and Mei 2002), and signals were background subtracted and averaged across probes within a probeset using a mean Tukey biweight function. Control probes on the array were removed and then the gene expression data from the remaining probsets were normalized across the groups of samples using the Robust Multi-array Analysis (RMA) methodology (Irizarry et al. 2003) in the R statistical software.
QRT-PCR was performed with the ABI PRISM 7900HT Sequence Detection System (Applied Biosystems) and TaqMan MGB probes (FAM™ dye labeled). Primers and probes were obtained from Applied Biosystems Assays-on-Demand Gene Expression products. For amplification, cDNA was combined with a reaction mixture containing TaqMan universal PCR Master Mix (Applied Biosystems, Catalog No. 4304437) according to manufacturer's instructions. Technical duplicates for each sample were analyzed, and a sample without RT was included in each plate to detect genomic DNA contamination. Amplification steps included cycles at 50°C for 2 min for uracil-N-glycosylase incubation, denaturation at 95°C for 10 min, and denaturation and amplification at 95°C for 15 s, then 60°C for 30 s, for 40 cycles. Fold changes in gene expression in spontaneous and GBE-treated HCC were determined by quantification of target samples relative to vehicle control liver. The 18S RNA gene was used as the endogenous control for normalization of RNA levels. To determine this normalized value, 2−(ΔΔCt) values were compared between tumor and control samples, where the changes in crossing threshold (ΔCt)=CtTarget gene−Ct18S RNA, and ΔΔCt=ΔCtcontrol−ΔCttarget.
Bioinformatics Data Processing and Statistical Analysis
Arrays were scanned in an Affymetrix Scanner 3000, and data were obtained using the GeneChip® Command Console Software (AGCC; Version 1.1), and Partek Genomics Suite (6.4) was used to perform principal component analysis (PCA) on the normalized data and to generate heat maps to compare samples as previously described (Hoenerhoff et al. 2011). The methodology described by Guo, Sarkar, and Peddada (2010) was used to control the false discovery rate at p < .05. To identify enriched gene categories among all differentially expressed genes in spontaneous and GBE-treated HCC, Ingenuity Systems Pathway analysis (IPA; Ingenuity® Systems, www.ingenuity.com) was used to perform comparison analysis to identify concordant and discordant molecular pathways between spontaneous and GBE-treated HCC, relative to vehicle control normal liver. Microarray data files (.cel) and associated annotations have been submitted to the GEO database: Accession GSE29813 (http://www.ncbi.nlm.nih.gov/geo/query/acc.cgi?token=lletlmoigcksyxu&acc=GSE29813). Trend tests reported in Table 4 were performed using ORIOGEN software (Peddada et al. 2005).
Incidence of Ctnnb1 and H-ras mutation in GBE-treated and spontaneous HCC.
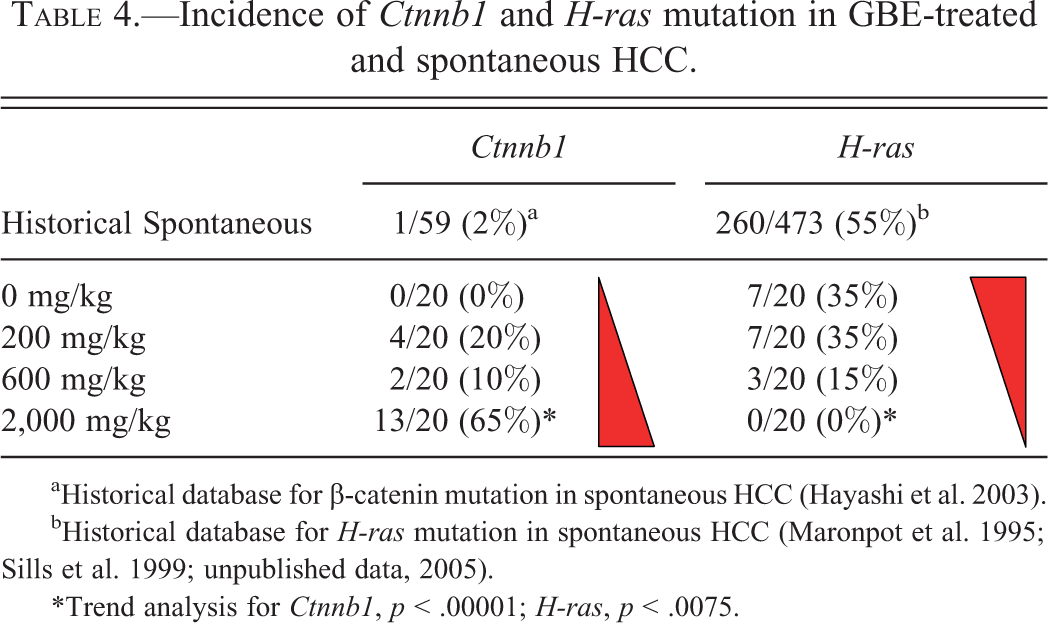
aHistorical database for β-catenin mutation in spontaneous HCC (Hayashi et al. 2003).
bHistorical database for H-ras mutation in spontaneous HCC (Maronpot et al. 1995; Sills et al. 1999; unpublished data, 2005).
*Trend analysis for Ctnnb1, p < .00001; H-ras, p < .0075.
Immunohistochemistry and Western Blot Analysis
For immunohistochemical analysis, following deparaffinization, rehydration, antigen retrieval, and quenching of endogenous peroxidase activity, polyclonal or monoclonal primary antibodies were applied. These included goat polyclonal CTNNB1 (sc-1496, 1:50; Santa Cruz Biotechnology, Santa Cruz CA), mouse monoclonal E-cadherin (CDH1; C20820, 1:50; Transduction Labs, Lexington KY), and rabbit polyclonal Glutamine synthetase (GLUL; ab49873, 1:10,000; Abcam, Cambridge MA) antibodies. Negative controls were obtained by substitution of the primary antibody with normal serum of the species that the secondary antibody was made in. Following washing, the labeled streptavidin ABC technique was employed for detection of primary antibody binding. For visualization, 3,3-diaminobenzidine (DAB) was applied and counterstained with Mayer’s hematoxylin. The sections were dehydrated through graded alcohols, immersed in xylene, and mounted with coverslips. Detailed immunohistochemistry protocols can be found at http://www.niehs.nih.gov/research/atniehs/labs/lep/path-support/core-support/immuno/protocols/. For Western blotting, spontaneous and GBE-treated tumor and normal liver lysates were prepared as previously described (Hoenerhoff et al. 2011), and the following antibodies were used: N-terminus goat polyclonal CTNNB1 (C-18; sc-1496, 1:100; Santa Cruz Biotechnology, Santa Cruz, CA); C-terminus rabbit polyclonal CTNNB1 (E247; ab32572, 1:2500; Abcam, Cambridge MA); rabbit polyclonal Calpain 1 (H-240; sc-30064, 1:500; Santa Cruz Biotechnology) and Calpain 2 (ab39165, 1:250; Abcam); and rabbit polyclonal CYP2B (generous gift from Tatsuya Sueyoshi, Pharmacogenetics Group, NIEHS, 1:50,000).
CTNNB1 Immunoprecipitation and Protein Microcharacterization
Tissue homogenates were prepared in radioimmunoprecipitation assay (RIPA) buffer containing protease and phosphatase inhibitors. The supernatants obtained after centrifuging the homogenates at 12,000 × g for 15 min at 4°C were used for analysis. Protein concentration was measured using the bicinchoninic acid (BCA) assay (Pierce, Rockford, IL). Samples containing 500 µg of protein were incubated with 10 µl of agarose-conjugated CTNNB1 antibody (sc-1496 AC; Santa Cruz Biotechnology, Santa Cruz, CA) at 4°C with constant rotation. The samples were centrifuged at 12,000 rpm for 2 min at 4°C, the supernatant was removed, and the agarose-protein immune complexes were washed 3 times in PBS. The pellet was resuspended in 50 µl of 2× loading buffer, and the samples were fractionated by SDS-PAGE. After electrophoresis, the gel was cut in half. One half of the gel was stained with SimplyBlue SafeStain (Invitrogen, Carlsbad, CA). Briefly, the gel was rinsed 3 times for 5 min each in deionized water and stained in SimplyBlue SafeStain for 1 hr at room temperature with gentle shaking. Following staining, the gel was washed in water for 1 hr and submitted for protein microcharacterization. The other half of the gel was transferred to a nitrocellulose membrane (Invitrogen, Carlsbad, CA), and nonspecific binding sites were blocked using 10% nonfat dry milk. The membranes were incubated with an antibody to CTNNB1 (1:100 dilution; sc-1496; Santa Cruz Biotechnology, Santa Cruz, CA) for 1 hr at room temperature with gentle agitation. Immunoreactivity was detected using horseradish peroxidase (HRP) conjugated IgG (1:5,000 dilution; sc-2020; Santa Cruz Biotechnology, Santa Cruz, CA), ECL Plus Western Blotting reagents (Amersham, Piscataway, NJ), and film autoradiography.
For protein microcharacterization, the area of interest (as determined by Western blot analysis) was digested with trypsin (Promega, Madison, WI) for 8 hr using a ProGest robotic digester (Digilab, Holliston, MA). Briefly, minced gel bands were incubated 2 times in 25 mM ammonium bicarbonate, and 50% (v/v) acetonitrile for a total of 30min. The gel was dehydrated in acetonitrile for 20 min, dried under a nitrogen stream, and incubated with 250 ng of trypsin for 8 hr at 37°C. The resulting peptides were extracted using 5% (v/v) formic acid, 50% (v/v) acetonitrile and lyophilized. The lyophilized samples were resuspended in 0.1% formic acid, loaded onto an Agilent C18 chip, and washed with 5% acetonitrile, 0.1% formic acid. NanoLC-ESI-MS/MS analysis was performed using the Agilent 1100 nanoLC system and the Agilent XCT Ultra ion trap mass spectrometer with a mass range of 200 to 2,200 m/z, an ionization potential of 2.1 kV, an Ion Charge Control (ICC) smart target of 10,000 or 200 ms of accumulation, and 1.0 volt fragmentation amplitude. Peptides were eluted from the Agilent chip by applying a linear gradient of acetonitrile (5 to 95%) and 0.1% formic acid. MS/MS data were acquired using the data extractor feature of the SpectrumMill software (Agilent, Santa Clara, CA) with an ion size limit 300 to 5,000 Da and retention time of 10 to 60 min. The resulting spectra containing sequence tag information of greater than 2 residues were submitted for database searching in the NCBI database with the following restrictions: trypsin specificity with one missed cleavage, a precursor ion mass tolerance of 2Da, a product ion mass tolerance of 1.0 Da, variable methionine oxidation, and a minimum matched spectral intensity of 70%. Proteins identified with an MS/MS search score greater than 25 were tabulated. The false positive rate was 0% as determined by a reverse sequence database search and manual sequence validation.
Results
Oral exposure to GBE results in a dose-dependent increase in the incidence of hepatocellular necrosis and centrilobular hypertrophy
Exposure of male and female B6C3F1 mice to 125, 250, 500, 1,000, and 2,000 mg/kg GBE over a 90-day period resulted in a treatment related increase in hepatocellular hypertrophy and focal hepatocellular necrosis (Table 1 and Figure 1A). Hepatocyte hypertrophy was characterized by centrilobular to midzonal enlargement of hepatocytes, with increased amounts of homogenous to finely granular eosinophilic to amphophilic cytoplasm and enlarged nuclei. Focal necrosis (Figure 1A) was characterized by loss of hepatocyte architecture, hypereosinophilia, and nuclear pyknosis, karyorrhexis, and karyolysis. In the 2-year bioassay, treatment with 200, 600, and 2,000 mg/kg GBE resulted in a dose-dependent increased incidence and severity of centrilobular hepatocellular hypertrophy in male and female mice. These lesions were also accompanied by a dose-related increase in hepatocellular necrosis in all treated males and mid- and high-dose females, and inflammatory cell infiltrates composed predominantly of lymphocytes, plasma cells, neutrophils, and rare macrophages (Figure 1B and Table 1). These findings indicate that oral exposure to GBE at the indicated doses results in hepatocellular hypertrophy and damage that increases in severity over time with continued exposure.
Hepatic lesions in B6C3F1 mice exposed to GBE for 90 days and 2 years by gavage; 90-day GBE exposure induced marked centrilobular hepatocellular hypertrophy (A) (arrowheads, 10×) and focal hepatocellular necrosis (box, 10× and inset, 40×). At 2-year exposure, hepatocellular hypertrophy was accompanied by minimal to mild necrosis (arrowheads) and inflammatory infiltrates (B) (arrows, 20×) composed predominantly of neutrophils, lymphocytes, and rare macrophages in all male treated groups and mid- and high-dose females groups. Two-year GBE exposure resulted in a dose-dependent increase in hepatocellular adenoma (C), carcinoma (D), and hepatoblastoma (E). Hepatocellular adenomas (C) were expansile and solid proliferations of sheets of hepatocytes (arrowheads, 4×), some of which had atypical features of enlarged cells with abundant eosinophilic cytoplasm, large nuclei and areas with numerous mitotic figures (inset, 20×). Hepatocellular caricnomas (D) (10×) were characterized by invasive cords, trabeculae, and sheets of atypical hepatocytes (inset, 20×). Hepatoblastomas (E) invariably arose within hepatocellular carcinomas and were composed of solid lobules and sheets of densely packed ovoid to round cells with deeply basophilic cytoplasm and dense, angular to ovoid nuclei, with frequent mitoses (inset, 20×). Hepatocellular carcinomas in B6C3F1 mice exposed to GBE were associated with a marked increase in point mutations in exon 2, codon 42 of Ctnnb1 (F). By Western blotting, in addition to the expected 98kDa CTNNB1 protein, approximately 50% of GBE-treated HCC had an additional 75-kDa CTNNB1 protein product (arrow) not observed in spontaneous HCC (G).
Oral exposure to GBE results in a dose-dependent increase in the incidence of hepatocellular tumors by 2 years
Exposure of male and female B6C3F1 mice to GBE over a 2-year period resulted in a dose-related increase in the incidence of hepatocellular adenomas and carcinomas (single and multiple) in male and female mice (Table 1). Histologically, hepatocellular adenomas and carcinomas associated with GBE treatment were similar to spontaneously arising tumors in vehicle control groups. Hepatocellular adenomas were generally well-circumscribed proliferations of variably sized, well-differentiated hepatocytes with variable tinctoral characteristics and displayed loss of the normal hepatic lobular architecture (Figure 1C). Adenomas varied from solid growth patterns to cords of cells 1 to 3 cell layers thick. Some adenomas were atypical and consisted of large cells with abundant eosinophilic cytoplasm, large nuclei, and areas with numerous mitotic figures (2–3 per 40× field; Figure 1C, inset). Fatty change (lipidosis) and eosinophilic intracytoplasmic inclusions were noted in some adenomas.
HCCs (Figure 1D) were poorly demarcated with irregular borders and focal invasion into the surrounding parenchyma. HCCs tended to present as larger masses than adenomas, often replacing nearly the entire hepatic lobe. Cellular atypia and mitotic figures were common. Nucleoli were often enlarged and multiple. Cells had variable tinctorial appearances from eosinophilic, basophilic, or vacuolated, to a combination of these phenotypes. Carcinomas exhibited multiple growth patterns, including trabecular, solid, and pseudoglandular patterns, often within the same tumor as previously described (Hoenerhoff et al. 2011). Tumors with a trabecular pattern were composed of cords of atypical hepatocytes three or more cell layers thick, separated by dilated vascular spaces (Figure 1D). When the solid growth pattern was present, the cells tended to be anaplastic, characterized by large size, large hyperchromatic irregular nuclei or double nuclei, 2 or 3 nucleoli, and abundant eosinophilic cytoplasm, and numerous mitoses (2 or 3 per 40× field). Although tumor phenotypes did not differ considerably between spontaneous and GBE-treated HCC, tumor multiplicity (in all treated males and high dose females) and pulmonary metastasis (in high-dose males) was more pronounced in GBE-treated mice, and often zones of marked hepatocellular hypertrophy merged imperceptibly with hepatocellular adenomas or carcinomas in these tumors.
Generally, a dose-related increase in hepatoblastomas (single and multiple) was also noted in treated males, and in mid- and high-dose females (Figure 1E). Hepatoblastomas were characterized by expansile irregular proliferations of compacted basophilic neoplastic cells arranged in sheets, often palisading around vascular spaces (pseudorosettes). Nuclei were generally oval to round to irregular, with scant basophilic cytoplasm, and mitoses were frequent. Blood-filled cystic spaces, necrosis, and hemorrhage were common components of hepatoblastomas. These tumors frequently arose within HCCs.
GBE Is Genotoxic at High Doses and GBE-treated HCCs Are Associated with Alterations in Ctnnb1 and H-ras Mutation Spectra
In the bacterial gene mutation assay (Ames assay), GBE was mutagenic at high doses (generally >2,000 µg/plate) in S. typhimurium strains TA100, TA98, and the E.coli tester strain, with and without 10% induced rat liver S9 (NTP 2012). The strongest responses were seen in strain TA98 in the presence of S9 (8.6-fold increase in mutant colonies compared with the control); this strain mutates via frame shifting (it carries a −1 frame shift mutation affecting the reading frame of a –C-G-C-G- repetitive sequence located nearby) whereas the other two tester strains employed in this study mutate via base substitution (GC base pair target for TA100 and an AT target for the E. coli strain; Mortelmans and Zeiger 2000). Since these data indicated that GBE is capable of inducing mutations in DNA, spontaneous and GBE-treated HCC were evaluated for mutations in HCC genes. Interestingly, Ctnnb1 and H-ras mutations were mutually exclusive in GBE-treated and spontaneous tumors, respectively, except for one high-dose female. With increasing dose, we observed a statistically significant increase in trend (p < .00001, Table 4) of Ctnnb1 mutation in GBE-exposed animals (Figure 1F), in contrast to the relatively low incidence in historical controls (Hayashi et al. 2003). In addition, we observed multiple mutations per tumor in some high dose animals, and an increased incidence of deletion mutations, which is not typical for spontaneous HCC in the B6C3F1 mouse. Conversely, we observed a statistically significant decrease in trend of H-ras mutation with decreasing dose in GBE-treated animals (p < .0075, Table 4), contrary to the modest incidence (55%) of this mutation observed in spontaneous HCC (Maronpot et al. 1995; Sills et al. 1999, and unpublished data 2005). Mutations in Tp53 were not observed in spontaneous or GBE-treated HCC.
GBE-treated HCCs Are Associated with Modification of CTNNB1 Protein and Alterations in the Expression of Other Wnt Mediators
Since there was a statistically significant increasing trend in Ctnnb1 mutations in GBE-treated HCC that are associated with constitutive activation of the protein, we assessed GBE-treated and spontaneous tumors for alterations in CTNNB1 protein expression by Western blotting. Interestingly, using a C-terminus antibody, in addition to the expected 98kDa CTNNB1 protein fragment, we detected a smaller, 75-kDa fragment in approximately 50% of GBE-treated HCC samples, which was not observed in spontaneous HCC (Figure 1G). In order to determine whether this protein alteration was the result of a novel deletion mutation in the Ctnnb1 gene, or a unique post-translational modification or splice variant of the CTNNB1 protein, we sequenced the coding region of the Ctnnb1 gene and immunoprecipitated the CTNNB1 protein for identification by mass spectroscopy. The resulting sequence data showed that there was no difference in the Ctnnb1 sequence between GBE-treated tumors with a single 98kDa band, and those with the double band, indicating that a deletion mutation was not present.
Recent studies in breast and prostate cancer have identified a similar 75kDa protein cleavage product that is associated with a more metastatic phenotype (Benetti et al. 2005; Rios-Doria et al. 2004). In these studies, cleavage of CTNNB1 by the calpain enzyme system occurs at the N-terminus, resulting in loss of the GSK3β phosphorylation site responsible for CTNNB1 degradation, resulting in a constitutively active protein fragment that retains transcriptional activity. To determine if the observed 75kDa band in GBE-treated HCC in this study was a result of such post-translational modification, an N-terminus CTNNB1 antibody was used to evaluate for changes in this region of the protein. Results of Western blotting using the N-terminus antibody showed loss of the second 75-kDa band, indicating N-terminal CTNNB1 cleavage (Figure 1G). To assess expression of the Calpain system, Calpain 1 (Capn1) and 2 (Capn2) downstream protein expression was measured by Western blotting in spontaneous and GBE-treated HCC. While Capn1 was upregulated by microarray in GBE-treated HCC (1.4-fold) compared to vehicle control normal liver and spontaneous HCC, the protein expression of CAPN1 as assessed by Western blotting was not significantly correlated with the presence of the 75-kDa CTNNB1 fragment (Figure 1G).
Since there was a significant increase in Ctnnb1 activating mutations and alterations in the CTNNB1 protein by Western blotting, we assessed spontaneous and GBE-treated HCC for abnormalities in protein localization and expression of Ctnnb1 and other Wnt mediators, E-cadherin (CDH1) and Glutamine synthetase, (GLUL) by immunohistochemistry. In GBE-treated HCC, there was cytoplasmic accumulation of CTNNB1 compared to spontaneous HCC (Figure 2A). There was loss of normal CDH1 membrane immunoreactivity, with accumulation of the protein in the cytoplasm, which may suggest disruption of CTNNB1/CDH1 complexes within adherens junctions, which is associated with a more malignant phenotype (Figure 2B). Finally, there was marked overexpression of GLUL protein, a downstream target of CTNNB1 activation and a commonly used marker for Ctnnb1 mutation, in GBE-treated HCC; while 10 to 50% of neoplastic cells in spontaneous HCC were immunoreactive for GLUL, essentially 100% of the neoplastic population expressed GLUL in GBE-treated HCC (Figure 2C).
Immunohistochemistry of WNT mediators in spontaneous and GBE-treated hepatocellular carcinomas. In GBE-treated HCC, there was overexpression and cytoplasmic accumulation of CTNNB1 (A) and overexpression, cytoplasmic accumulation, and loss of membrane immunoreactivity for CDH1 (B) (20×). GBE-treated tumors overexpressed GLUL (C), a downstream transcriptional target of CTNNB1 (10×).
Differential Gene Expression Reveals Marked Differences in Global Gene Expression between Spontaneous and GBE-treated HCC
To elucidate other mechanisms that may be involved in hepatocarcinogenesis in GBE-exposed animals, global gene expression profiling was performed using age-matched vehicle control liver, spontaneous HCC, and GBE-treated HCC. From analysis of 34,000 genes on the array, a set of 2,864 significantly differentially changed (up- or downregulated) genes (p < .05) were identified in spontaneous HCC, and 2,424 genes were identified in GBE-treated HCC, compared to normal liver. Results of PCA illustrated clear clustering of samples within groups, indicating significant concordance (similarities) in global gene expression within groups. Furthermore, and more importantly, PCA indicated significant separation of experimental groups from one another, indicating significant differences (discordance) in global gene expression between groups (Figure 3A). Next, the significantly differentially expressed genes in each experimental group were visualized using hierarchical cluster analysis (HCA) in order to recognize significant differences in gene expression patterns between groups. HCA showed that there were marked differences between spontaneous HCC and GBE-treated HCC in terms of global gene expression, and that while these tumors are often indistinguishable histologically, they are very different in terms of the differential expression of many genes (Figure 3B).
Differential gene expression profiling of spontaneous and GBE-treated HCC. Principal component analysis (PCA) (A) demonstrated significant clustering of normal liver (red), spontaneous HCC (blue), and GBE-treated HCC (green), based upon global gene expression. Hierarchical cluster analysis (HCA) (B) illustrated significant differences in global gene expression between normal liver, spontaneous HCC, and GBE-treated HCC (red = upregulated genes, green = downregulated genes).
Comparison Analysis of Differentially Expressed Genes Identifies Overrepresentation of Genes Associated with Cancer Signaling, HCC Development, and Chronic Oxidative and Xenobiotic Stress in GBE-treated HCC
Since global gene expression profiling indicated significant differential gene expression between spontaneous and GBE-treated HCC, we performed a comparison analysis between tumor types (relative to vehicle control normal liver) using Ingenuity Pathway Analysis (IPA) software. Results of comparison analysis indicated overrepresentation of genes associated with pathways involved in (1) cancer signaling, (2) HCC development, and (3) chronic xenobiotic and oxidative stress (Figure 4). Gene categories associated with cancer signaling included “cell cycle,” “cell proliferation,” “hepatic disease,” “cellular movement,” “inflammatory disease,” “immunologic disease,” and “cell death” in GBE-treated HCC compared to spontaneous tumors (Figure 4A). Gene categories associated with human HCC development (Figure 4B) included “liver inflammation,” “liver hyperplasia,” “liver cholestasis,” “liver damage,” “liver steatosis,” “liver necrosis,” “liver degeneration,” and “liver fibrosis.” Finally, overrepresented gene categories associated with chronic xenobiotic and oxidative stress included “aryl hydrocarbon receptor signaling,” NRF2-mediated oxidative stress,” “PPAR signaling,” “xenobiotic signaling,” “glutathione signaling,” and “production of nitric oxide and reactive oxygen species” (Figure 4C).

Ingenuity pathway analysis (IPA) comparison analysis of spontaneous and GBE-treated HCC. In GBE-treated tumors, there was significant overrepresentation of genes associated with biologic functions of human cancer (A), toxicologic functions associated with human hepatocellular carcinoma development (B), and pathways related to chronic xenobiotic and oxidative stress (C).
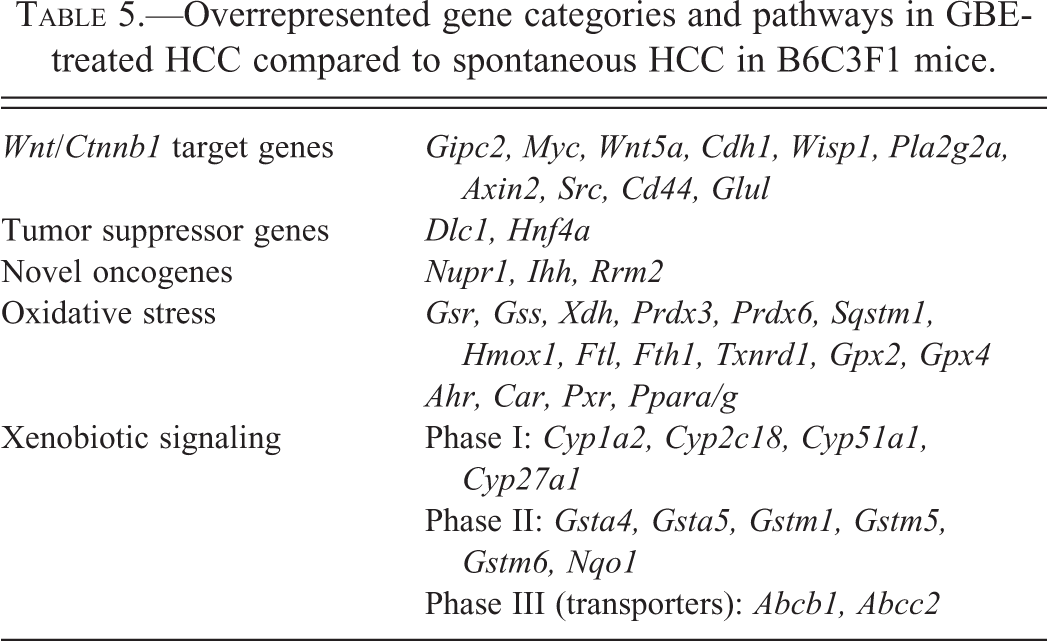
Within overrepresented pathways of cancer signaling and HCC development, there was overexpression of several Wnt/Ctnnb1 target genes involved in the development of HCC and other human cancers, downregulation of critical tumor suppressor genes associated with HCC development in humans, overexpression of several oncogenes not previously shown to play a role in HCC development, upregulation of nuclear receptor genes, phase I and II xenobiotic metabolizing enzymes, phase III transporters, and genes associated with increased oxidative stress in GBE-treated HCC compared to spontaneous tumors (Table 5). To quantify the relative expression of genes differentially expressed between GBE-treated and spontaneous HCC, we validated selected target genes in these categories by QRT-PCR (Figure 5A) and Western blot (Figure 5B).
Validation of differential gene expression changes between GBE-treated and spontaneous HCC, including QRT-PCR quantification illustrating (A) upregulation of Wnt/Ctnnb1 mediators (Gipc2, Myc, Wnt5a, Wisp1, Pla2g2a, Axin2, Src, Cd44, Glul), downregulation of tumor suppressor genes (Hnf4a, Dlc-1), oncogene overexpression (Myc, Src, Ihh, Rrm2, Nupr1), overexpression of nuclear receptors (Ahr, Car, Pxr, Pparα/γ) and mediators of xenobiotic and oxidative stress (Cyp1a2, Nqo1, Gpx2, Gstm3, Cbr1). (B) Western blot validation illustrating upregulation of CYP2B protein in GBE-treated HCC.
Overrepresented gene categories and pathways in GBE-treated HCC compared to spontaneous HCC in B6C3F1 mice.
Discussion
While spontaneous and GBE-treated HCC in this study were morphologically very similar, in terms of their gene expression and mutation spectra, these tumors are actually quite different. HCCs in mice exposed to GBE were characterized by dose-dependent Ctnnb1 mutations, with an increased incidence of deletions and multiple mutations per tumor in some high-dose animals. These features are markedly different from spontaneous HCC in this strain, which does not typically harbor deletion mutations or multiple mutations, and has a relatively low concurrent (0%) and historical control (2%) incidence rate of Ctnnb1 mutation (Hayashi et al. 2003). Conversely, H-ras mutations are relatively common in historical (55%; Maronpot et al. 1995; Sills et al. 1999) and concurrent spontaneous HCC (35%); however, in this study, there was a decreasing incidence of mutation with increasing GBE dose, suggesting that unlike spontaneous tumors, H-ras-dependent mechanisms are not driving tumorigenesis in GBE-exposed animals. In addition, Ctnnb1 and H-ras mutations were mutually exclusive in GBE exposed animals except for one female mid-dose animal. The increasing trend in Ctnnb1 mutation, coupled with the decreasing trend in H-ras mutation, observed in GBE-treated HCC in this study, suggest that GBE exposure is associated with Ctnnb1 mutation as an early event, preceding background H-ras mutation, a common occurrence in spontaneous HCC in B6C3F1 mice. Therefore, these data show that GBE-treated HCC are distinguishable from spontaneous HCC in terms of their mutation spectra and suggest that exposure to the extract plays a role in the pathogenesis of this tumor in this model. Further, since CTNNB1 mutation plays a role in human HCC, this implication may be important in the human disease. As observed by microarray, GBE-treated HCC was associated with upregulation of Wnt mediators, consistent with alterations in Ctnnb1 expression. Indeed, Wnt activation resulting from Ctnnb1 mutation or overexpression is implicated in the pathogenesis of HCC in humans and mice (de La Coste et al. 1998; Devereux et al. 1999; Nhieu et al. 1999).
In addition to the genetic alterations in Ctnnb1 in GBE-treated HCC, approximately 50% of examined tumors had a unique posttranslational modification suggestive of protein truncation, not observed in spontaneous tumors. A similar novel 75-kDa fragment of CTNNB1 has been reported in breast and prostate cancer (Rios-Doria et al. 2004). This fragment was reportedly caused by proteolytic cleavage by the Calpain enzyme system, resulting in a fragment that retained transcriptional activity and was associated with metastatic behavior (Rios-Doria et al. 2004). While mutation of the GSK3β-binding site prevents degradation of CTNNB1 and promotes growth signaling and carcinogenesis, Calpain-mediated cleavage removes the GSK3β-binding site from the N-terminus region of CTNNB1, leaving an activated 75-kDa protein fragment. Although expression of CAPN1 and 2 proteins was not appreciably increased in GBE-treated HCC in this study, alterations in other Calpain family members (CAPN3-13) may potentially play a role in proteolysis of CTNNB1. It is also interesting to note that Calpain is involved in the degradation of cytoskeletal proteins including CDH1 (Weber et al. 2009), which showed loss of membrane localization in the current study, and that CDH1 stability and association with CTNNB1 at junctional complexes is influenced by Calpain-mediated degradation (Rios-Doria et al. 2003). Further study of the role of Calpain family members or other proteolytic enzymes that may play a role in alteration of CTNNB1 and CDH1 function independent of mutation is warranted in GBE-treated HCC.
We have shown that the extract was genotoxic at high doses in vitro, and this activity was enhanced by the addition of rat liver microsome mix (S9), suggesting a possible genotoxic mechanism. However, GBE is a known inducer of xenobiotic metabolizing enzymes through activation of CAR, PXR, and AHR nuclear receptors in human HepG2 cells (Li et al. 2008) and mice (Umegaki et al. 2007), and hepatocarcinogenesis in GBE-exposed animals may undoubtedly have been significantly influenced by nongenotoxic mechanisms as well. Nongenotoxic carcinogens do not directly alter DNA, but rather influence cellular transformation, or promote initiated cells (Ellinger-Ziegelbauer et al. 2008; Ellinger-Ziegelbauer et al. 2005). Exposure to nongenotoxic compounds can result in carcinogenesis secondary to induction of cellular responses to toxicity, including enhancement of regeneration and proliferation, inhibition of apoptosis, and increased oxidative stress from excessive production of reactive oxygen and nitrogen species that damage DNA and other cellular constituents, both of which we observed on global gene expression analysis of GBE-treated tumors, and which are known promoters of neoplastic transformation (Butterworth 1990; Cohen 1995; Cunningham 1996; Ellinger-Ziegelbauer et al. 2008; Waters, Jackson, and Lea 2010; Williams 2001). It has been shown that activation of nuclear receptors may select for and promote the proliferation of cells harboring Ctnnb1 mutations and that Ctnnb1-mutated HCC have increased expression of these nuclear receptors (Stahl et al. 2005) and activation of xenobiotic enzymes (Loeppen et al. 2005). In addition to overexpression of various oncogenes and downregulation of tumor suppressor genes associated with HCC development, global gene expression analysis revealed significant upregulation of nuclear receptors and their respective xenobiotic enzymes in GBE-treated HCC. Activation of these pathways may result in promotion of preneoplastic hepatocytes toward tumorigenesis partly through suppression of hepatocellular apoptosis, and consequent expansion of an initiated cell population.
In order to extrapolate the doses of GBE used in the NTP bioassay to exposure in humans, we calculated potential human exposure based on simple comparisons to mass (mg/kg) and surface area (mg/m2; Reagan-Shaw, Nihal, and Ahmad 2008). Based on administered mass dose alone, the low dose (200 mg/kg) in mice is 50 times the normal recommended human dose of 240 mg/d. According to the Food and Drug Administration (FDA)’s guidelines on surface area adjustment (mg/m2), the low dose is 4 times higher. Given the unregulated nature of this compound, exposure to increased concentrations of this extract in the human population over long periods of time is possible.
In conclusion, while spontaneous and GBE-treated HCC in B6C3F1 mice are very similar at the morphologic level, we have shown that the molecular alterations in GBE-treated tumors are very different from those seen in spontaneous tumors. These include unique alterations in Ctnnb1 gene and protein expression, structure, and function; to our knowledge, the unique posttranslational modification we discovered in the CTNNB1 protein, which has been associated with increased malignant behavior in some human cancers, has not been reported in HCC in humans or rodents. Additionally, marked differences in global gene expression profiling, including overrepresentation of cancer signaling pathways, xenobiotic metabolism, and oxidative stress, shows that while spontaneous and GBE-treated HCC are morphologically indistinguishable, they may be distinguished based upon their transcriptomic profiles. This is of considerable importance when distinguishing between a background tumor incidence and chemically induced neoplasms, particularly in strains with moderate background tumor rates. We have shown that the process of hepatocarcinogenesis in GBE-exposed mice is very complex, underscoring the complex nature of the extract and its constituents, and that GBE-treated tumors exhibit molecular alterations that are known to influence HCC development in mice and humans. Further study of the molecular alterations in GBE-exposed animals is warranted, including assessment of molecular endpoints at earlier exposures to define initiating oncogenic events, as well as functional validation of gene targets to address relevance of molecular alterations to humans, in order to better understand the mechanisms involved in HCC development in GBE-treated animals, and whether these pathways could extrapolate to an understanding of human HCC development. Although a significant amount of data are present in the scientific literature pertaining to the reported significant health benefits of GBE use, our findings in mice suggest that with long-term use of high doses ofGBE there may be potential health risks, and it is therefore important that the health status of individuals on chronic GBE therapy is monitored.
Footnotes
The authors declared no potential conflicts of interest with respect to the research, authorship, and/or publication of this article.
The authors received no financial support for the research, authorship, and/or publication of this article.
Abbreviations:
Acknowledgments
We would like to thank Kevin Gerrish and Laura Wharey in the NIEHS Microarray Core and Pierre Bushel in the Biostatistics Branch for their assistance with global gene expression experiments. We would like to thank the NIEHS Histology and Immunohistochemistry Laboratories, Protein Microcharacterization Core, and DNA Sequencing Core for their technical expertise, and the NTP Toxicogenomics Faculty for thoughtful discussions.
This work was supported by the National Institutes of Environmental Health Sciences (NIEHS), National Institutes of Health, and The Division of the National Toxicology Program. This article may be the work product of an employee or group of employees of the National Institute of Environmental Health Sciences (NIEHS), National Institutes of Health (NIH); however, the statements, opinions, or conclusions contained therein do not necessarily represent the statements, opinions or conclusions of NIEHS, NIH, or the United States government.