
Abstract
Metabonomic characterization of the effects caused by ozone and other stressors on normal human blood was performed. Samples of blood obtained from healthy subjects were treated ex vivo with increasing concentrations of ozone and/or with UV radiation and heat. 1H-NMR analysis of plasma samples after treatments showed the quantitative variation of some metabolites and the formation of new metabolites normally absent. Both the increment of some metabolites like formate, acetoacetate, and acetate and the decrement of pyruvate were of particular interest. Moreover, the oxidation of ascorbic acid and the transformation of uric acid into allantoin after ozonation within the therapeutic concentration range were observed. In the ozonated spectra, 2 unidentified peaks appeared at 2.82 ppm and 8.08 ppm. They are related to the direct antioxidant activity of albumin in the presence of ozone and they could be considered as specific markers of the blood ozonation.
Reactive oxygen species (ROS) represent an area of intensive research and include both free radicals and nonradical species, among which ozone plays an important role (Table 1 ). 1 In the stratosphere, ozone constitutes the protective layer around the planet, whereas at ground level ozone is a pollutant. Previous results 2-5 show that ozone causes lipid peroxidation and can generate a variety of compounds, as summarized in Figure 1. At the same time, because of its fungicidal, virucidal, and bactericidal properties, ozone is used to purify the drinking water in many municipalities. 6
Nomenclature of Reactive Oxygen Species
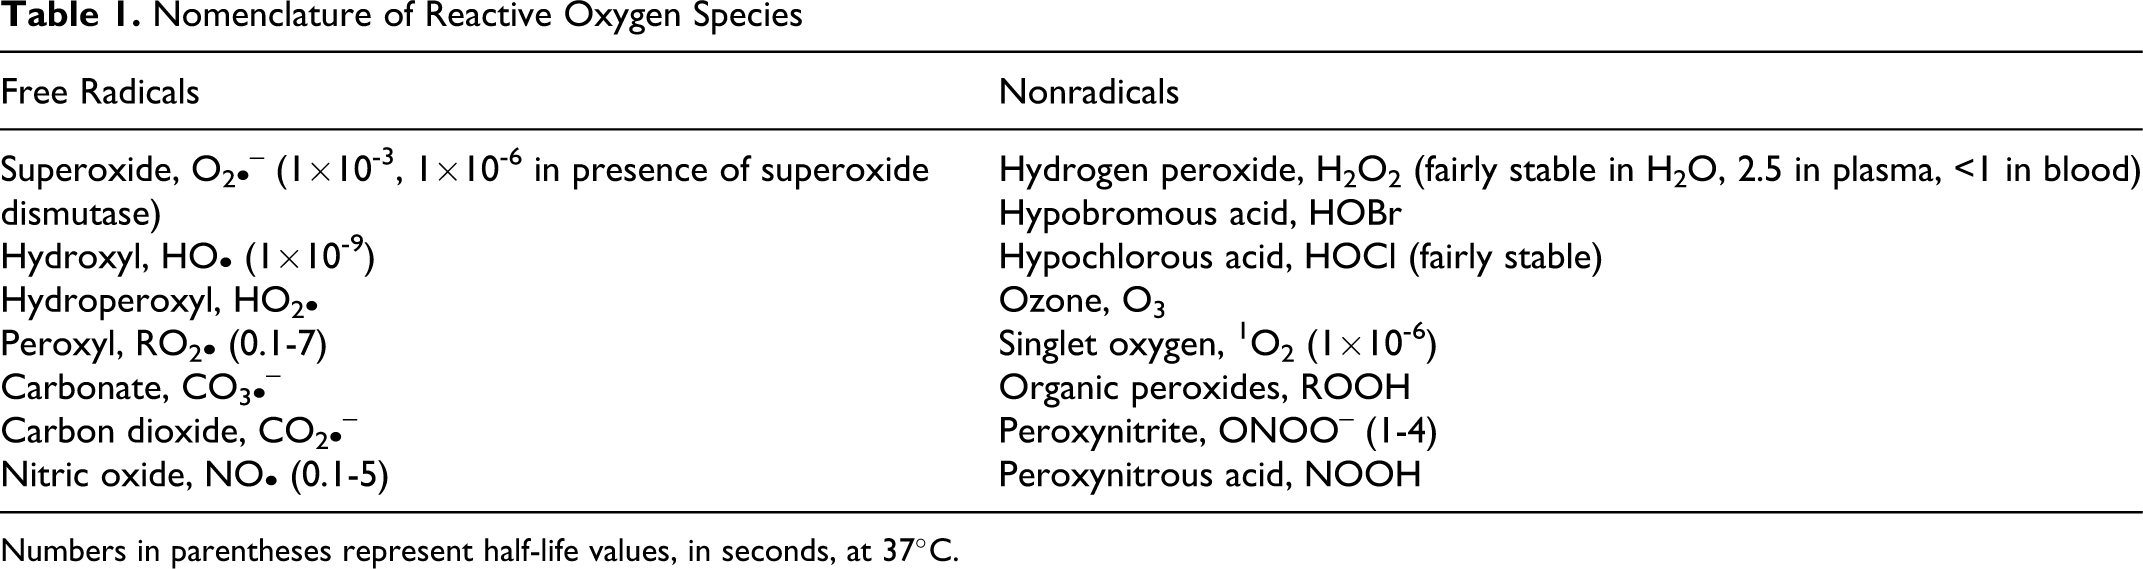
Numbers in parentheses represent half-life values, in seconds, at 37°C.
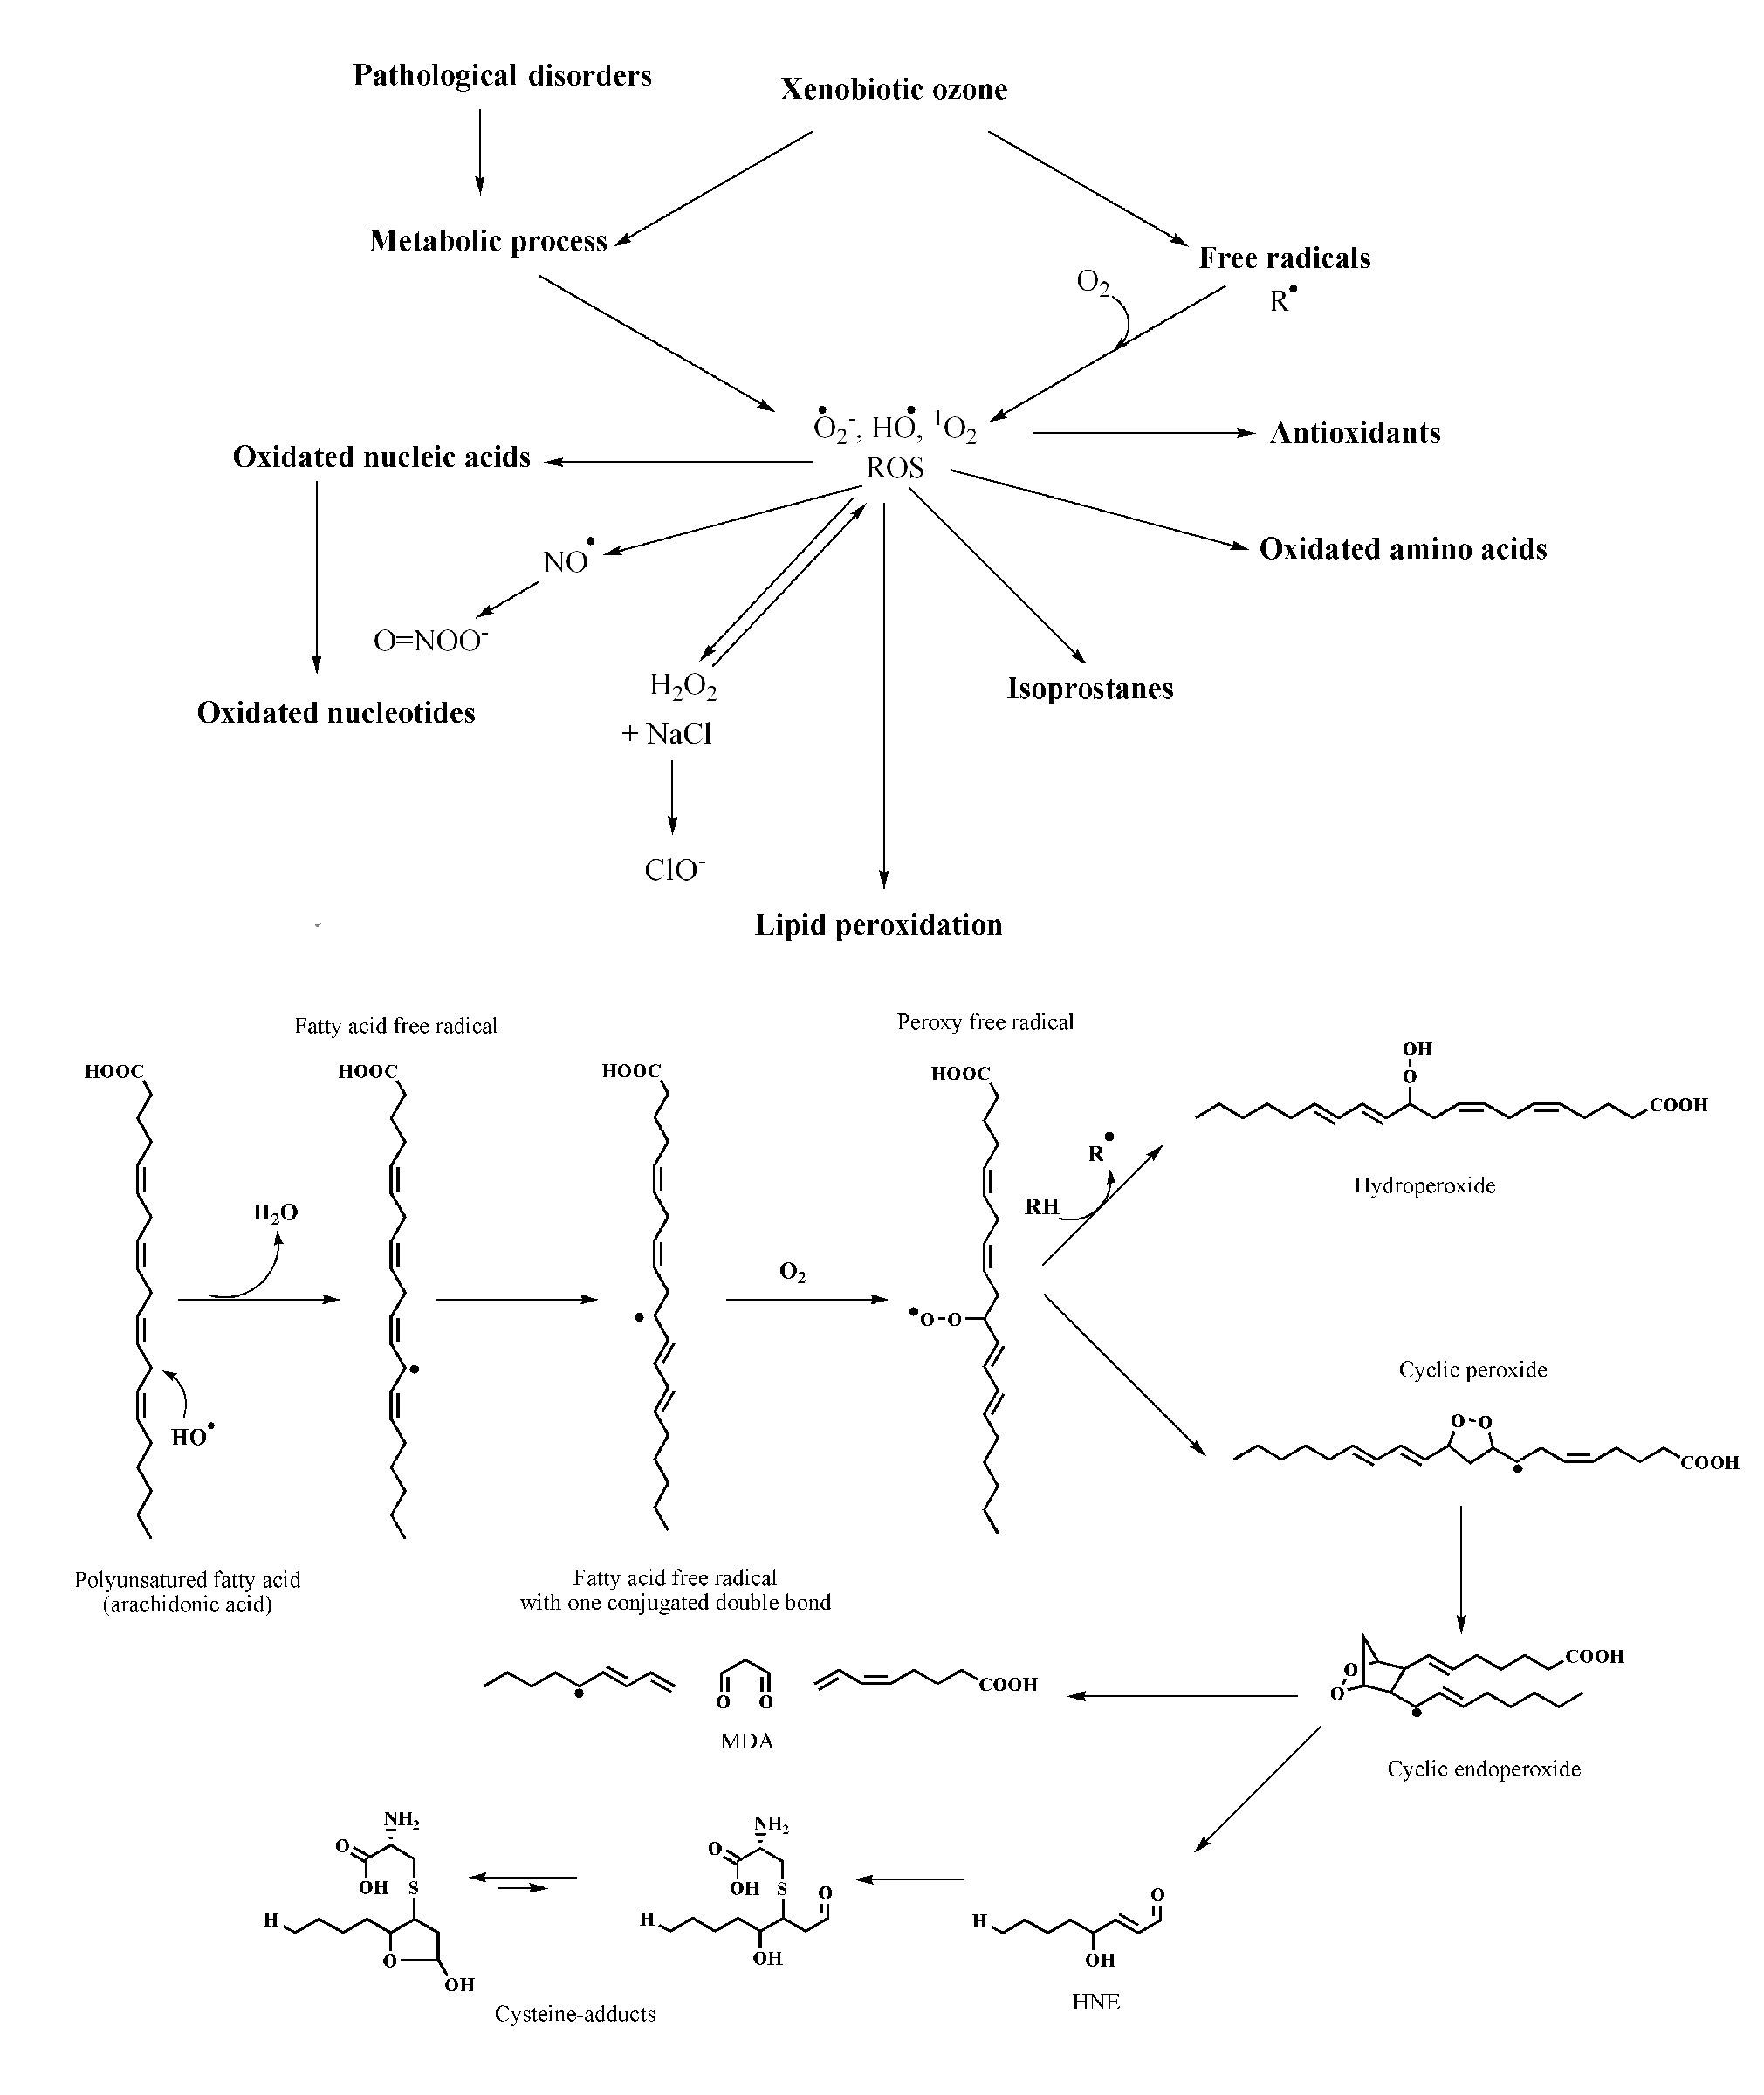
The cascade of compounds generated during ozone interaction in a biological environment. In particular, the sequence of reactions occurring during lipid peroxidation with production of malondialdehyde (MDA) and 4-hydroxy-2,3 trans-nonenal (HNE) is shown.
Ozone for therapeutic purposes has been used on a rather empirical basis by many practitioners in the world. There are specific applications of ozone therapy in a number of pathologies, such as vascular diseases, ulcers, and acute and chronic viral diseases. On the basis of some biochemical studies 7-10 performed during the last 15 years, a framework for understanding the basic mechanisms of action of ozone when it comes in contact with human blood at appropriate doses is now available. These data have been critically reviewed, 11,12 and the following biological responses can be summarized: (a) improvement of blood circulation and oxygen delivery to ischemic tissue, owing to the concerted effect of nitric oxide and CO and a variable increase of intraerythrocytic (2,3-diphosphoglycerate) 2,3-DPG level 13,14 ; (b) enhancement of the general metabolism 13 ; (c) upregulation of the cellular antioxidant enzymes and induction of heme oxygenase 1 (HO-1) and heat shock protein-70 (HSP-70) 14,15 ; (d) induction of a mild activation of the immune system 7,8 and enhancement of the release of growth factors from platelets 16 ; and (e) excellent disinfectant activity when topically used in water and oils, 17,18 although this is negligible in the circulation owing to the potent blood antioxidant capacity. 19 Moreover, adequate ozone treatments do not induce acute or chronic side effects, and often patients report a feeling of wellness. 13 However, an in-depth evaluation of ozone impact on blood by studying the formation of metabolites appears to be valuable.
In this specific case, metabonomics has been often used to describe multiple metabolic changes caused by a biological perturbation. Metabonomics has been defined as “the dynamic multiparametric metabolic response of living systems to pathophysiological stimuli or genetic modification.” 20
Nuclear magnetic resonance (NMR)–based metabonomics offers evident advantages in contrast with knowledge-guided search of metabolites in biofluid samples. NMR-based metabonomics makes no assumptions about the identity of the metabolites that are relevant for the investigated aspects. Information on the metabolite pattern alterations is directly obtained through statistical analysis of the NMR profiles. Usually, metabonomics does not rely on the measurement of a single metabolite-associated peak but analyzes spectra as a whole: metabonomic profiles essentially are the superposition of the 1 H-NMR spectra of tens to thousands of different small molecules (up to 2500 in the case of urine and up to 200 in the case of blood) present in the sample at greater than 1 µM concentration. 21 In principle, an NMR profile contains qualitative and quantitative information on all of them. Small changes in enzyme concentrations can cause considerable alterations in intermediate products, and owing to the fact that metabolic networks are interconnected, NMR-based metabonomic analysis of biological fluids such as serum, plasma, and urine can be very useful.
NMR-based metabonomic studies have provided significant information on a wide range of pathologies, such as cancer, 22 as well as a variety of gastrointestinal pathologies. 23 Not surprisingly, the latter are more likely to be associated with metabolic alterations, among them Helicobacter pylori infection. 24 Recently, therapeutic ozone application in clinical dentistry by high-resolution 1 H-NMR has been studied. 25
The purpose of the present study was to investigate ex vivo the effect on the plasma metabonomic profile as obtained by (1) blood ozonation within the therapeutic concentration, (2) blood ozonation at high concentrations, and (3) blood ozonation at abnormally high concentration associated with other stressors, as performed by Torre-Amione et al. 26 The present investigation appears to be significant in that it defines definite alterations and toxicity regarding the amount of metabolites and suggests specific markers of oxidative stress induced by ozone blood treatment. In a future work, after reinfusing ozonated blood in the donor, we will investigate whether these metabolites appears in the circulation or in excreta.
Methods
Ozone Generation
Ozone was generated from medical-grade oxygen using electrical corona arc discharge, by 2 generators: Ozonline ECO3 (Torino, Italy), which delivers ozone concentrations between 0.1 and 3.0 µg/mL of gas, with a gas flow ranging from 100 mL/min (15 L/h) up to 1 L/min (60 L/h). Ozonosan PM 100K (Hansler GmbH, Iffezheim, Germany), which can deliver to either blood, plasma, or other samples ozone concentrations up to 80 µg/mL with a gas flow ranging between 1 and 8 L/min.
In all cases, the ozone concentration is monitored continuously by photometry at 600 nm (Chappuis band), periodically checked by iodometric titration, as recommended by the Standardization Committee of the International Ozone Association. The photometer was periodically checked by using the iodometric titration in observance of the rules established by International Ozone Association. Blood ozonation must be carried out only using medical oxygen and not filtered air because it contains 78% of nitrogen with the inherent formation of nitrogen oxides.
Single-use silicon treated polypropylene syringes (ozone-resistant) and tygon polymer tubing were used throughout the reaction procedure to ensure containment of ozone and consistency in concentrations.
Collection of Human Blood
Several blood samples of 60 mL were taken from 2 healthy, nonsmoking, male blood donors in the morning. Either sodium citrate 3.8% (1 mL/9 mL of blood) or EDTA (final concentration, 1.35 mg/mL) was used as the anticoagulant, and blood samples were immediately subdivided and introduced in ozone-resistant syringes (5 mL) or in a quartz vessel (10 mL) with a thermostat. The experimental program was allowed by the Ethical Committee on the basis of informed consent signed by 2 (VT and IZ) of the experimenters.
Sample Treatments
In experiment A, blood was treated with a single dose of ozone (concentration per volume) ex vivo as follows: A predetermined volume of a gas mixture composed of oxygen (95%-99%) and ozone (1%-5%), at ozone concentrations 20, 40, 80, 160, 240, 320, and 800 µg/mL (from 0.42 to 16.8 µmol/mL), was collected with a syringe and immediately introduced via a multidirectional stopcock into another syringe containing the blood sample. When possible, a blood sample/gas volume at a 1:1 ratio was used. The final gas pressure remained at normal atmospheric pressure. Controls were represented by both untreated blood samples and as treated with medical-grade oxygen. All control samples were normal.
In experiment B, samples of human albumin (4%, Kedrion, Barga, Italy) alone or in the presence of physiological concentrations of uric acid (300 µM) and/or ascorbic acid (50 µM) were treated with ozone. Gas delivery was performed as experiment A, at ozone concentrations of 5, 10, 20, 40, 80, and 160 µg/mL (from 0.105 to 3.6 µmol/mL). Control samples were treated with medical-grade oxygen. Samples containing albumin (4%) together with scalar concentrations of 4-hydroxynonenal (4-HNE) (from 0.08 to 3.2 µM) were also studied by NMR analysis.
In experiment C, treatments were performed in a thermostatted quartz vessel equipped with a gas inlet, a baffle plate at about half-height to limit blood foaming, and a silicon stopper. For each experiment, the device was loaded with 10 mL of blood, and 3 stressful agents were continuously (20 minutes) supplied, alone or in combination: (1) ozone, (2) ozone + UV rays, (3) ozone + heat, (4) ozone + UV rays + heat, (5) UV rays, (6) heat, and (7) UV rays + heat. The gas outlet was connected to an ozone destructor. Specifically, the temperature was set at 42.5°C, the total amount of ozone insufflated was 60 mg, and the source of UV rays (Multirays, Helios Italquartz, Milan, Italy) consisted of 10 lamps (254 nm) of 15 W each (length 43 cm, diameter 2.6 cm). These lamps were fixed in a special lamp-holder at a distance of about 10 cm from the sample.
NMR Analysis
Blood was immediately centrifuged at 2000g for 5 minutes at room temperature to sediment erythrocytes and to collect the plasma as supernatant. Plasma samples as well as samples of experiment B were stored frozen (–80°C) until NMR examination.
Frozen plasma samples were thawed at room temperature and vortexed before use. Next 300 µL of a phosphate sodium buffer (70 mM Na2HPO4; 20% vol/vol 2 H2O; 0.025% vol/vol NaN3; 0.8% wt/vol sodium trimethylsilyl [2,2,3,3-2H4]propionate [TSP]; pH 7.4) was added to 300 µL of each plasma sample, and the mixture was homogenized by vortexing for 30 seconds. Then 450 µL of this mixture were transferred into a 4.25-mm NMR tube (Bruker BioSpin GmbH, Rheinstetten, Germany) 23
1H-NMR spectra for all samples were acquired using a Bruker 600 MHz spectrometer (Bruker BioSpin) operating at 600.13 MHz proton Larmor frequency and equipped with a 5-mm CPTCI 1H-13C/31P-2H probe including a z-axis gradient coil, automatic tuning matching (ATM), and an automatic sample changer. A Pt100 thermoresistance served for temperature stabilization at the level of approximately 0.01 K at the sample. Before measurement, samples were kept for at least 3 minutes inside the NMR probe head for temperature equilibration (300 Kelvin). One-dimensional spectra were acquired using a standard pulse sequence (nuclear Overhauser enhancement spectroscopy; NOESYpresat; Bruker), using 64 free induction decays (FIDs), 64k data points, a spectral width of 12 019 Hz, an acquisition time of 2.7 seconds, a relaxation delay of 4 seconds, a mixing time of 100 milliseconds, and a Carr-Purcell-Meiboom-Gill (CPMG; Bruker) spin-echo sequence to suppress signals arising from high-molecular-weight molecules with the same acquisition parameter of NOESYpresat.
Spectral Processing
Free induction decays were multiplied by an exponential function equivalent to a 1.0-Hz line-broadening factor before applying Fourier transform. Transformed spectra were manually phased and corrected using cubic spin lines with TopSpin 2.1 (Bruker BioSpin srl), taking the CH3-doublet of lactate as reference (centered at 1.330 ppm). 23 All resonances of interest were assigned on template 1-dimensional NMR profiles by using matching routines of AMIX 3.8.4 (Bruker BioSpin) in combination with the BBIOREFCODE (version 2-0-0; Bruker BioSpin) reference database and published literature when available.
All spectra were normalized using the area of the doublet of CH3-alanine peak (between 1.50 and 1.47 ppm), which after scaling to the total area results fixed in intensity and shift for all samples analyzed, except the albumin spectra that are normalized to the area of a doublet of albumin (between 2.76 and 2.73 ppm). Peak area measurements of the metabolites are obtained using R 2.8.1 27 with house-made script for the calculation of the integrals of interest.
Spectroscopic Determination
Blood was immediately centrifuged at 2000g for 5 minutes at room temperature to sediment erythrocytes and to collect the plasma as supernatant. Plasma samples were stored frozen (–80°C) until determination.
The absorbance was determined with a Perkin Elmer Lambda (Waltham, Massachussetts, USA) 2B UV-VIS spectrophotometer equipped with 10-mm quartz cells. The absorption spectra were obtained over the range 700 to 400 nm. A data interval of 1 nm was selected, with a signal averaging time of 0.5 seconds for each data point (resulting in a scan time of 150 seconds). All data were acquired with UV WINLAB software. Precisely, the adopted wavelengths for the determination of hemoglobin concentration were 414, 541, and 576 nm, whereas methemoglobin was evaluated at 630 nm. 10 Before any determinations, samples were centrifuged at 3000g for 20 minutes in order to read the clear supernatants, and, when necessary, the samples were appropriately diluted. All scans were performed by the same operator and carried out at 21°C ± 0.5°C.
Viscosity Evaluation
Viscomate VM10AL (CBC Europe Ltd, Milan, Italy) is an innovative torsional oscillating viscometer characterized by constant shear stress systems driven by a piezoelectric ceramic source. This instrument measures viscosity by sensing a change in oscillation amplitude of a liquid-immersed detector, based on constant input voltage. An original phase-locked loop circuit maintains instrument resonant frequency of 1 kHz; the detector oscillation amplitude with no resistance is 1 µm. Angular acceleration of the detector is measured and reported as dynamic viscosity with the range 0.400 to 1000 mPa/s. The probe dimension was 9 mm with respect to the diameter. 28
The viscosity of treated blood (experiments A and C) was immediately evaluated. All the determinations were conducted into polystyrene Technicon sample cups (Kartell, Milan, Italy; nominal capacity 2 mL). Temperature was accurately monitored during the experiments (37.0°C ± 0.1°C). Viscosity values were recorded for 6 minutes (data collection every 5 seconds) by PC connection through an RS-232 port.
Statistical Analysis
Results were expressed as the mean (percentage coefficient of variation [CV%] <2) of at least 3 independent measurements. Statistical evaluations were performed by a 1-way analysis of variance (ANOVA) using a statistics software (Instat software, version 3.0 GraphPAD Software, San Diego, Calif). Bonferroni test was used after ANOVA to evaluate statistical difference between individual means. Significance was defined as a P value less than .05. The correlation graphs are obtained using OriginPro 8, the correlation factors are expressed with the r 2 parameter.
Results
A preliminary overview of the changes caused by blood ozonation is shown in Figure 2. Both CPMG and NOESY1D spectra were analyzed. The examination of spectra of the control samples treated with pure oxygen did not yield particular differences with respect to basal samples, except a small increment of pyruvate peak at 2.35 ppm. However, samples treated with increasing amounts of ozone (from 0 to 16.8 µmol/mL) showed variations in the concentration of several metabolites (Figure 2).
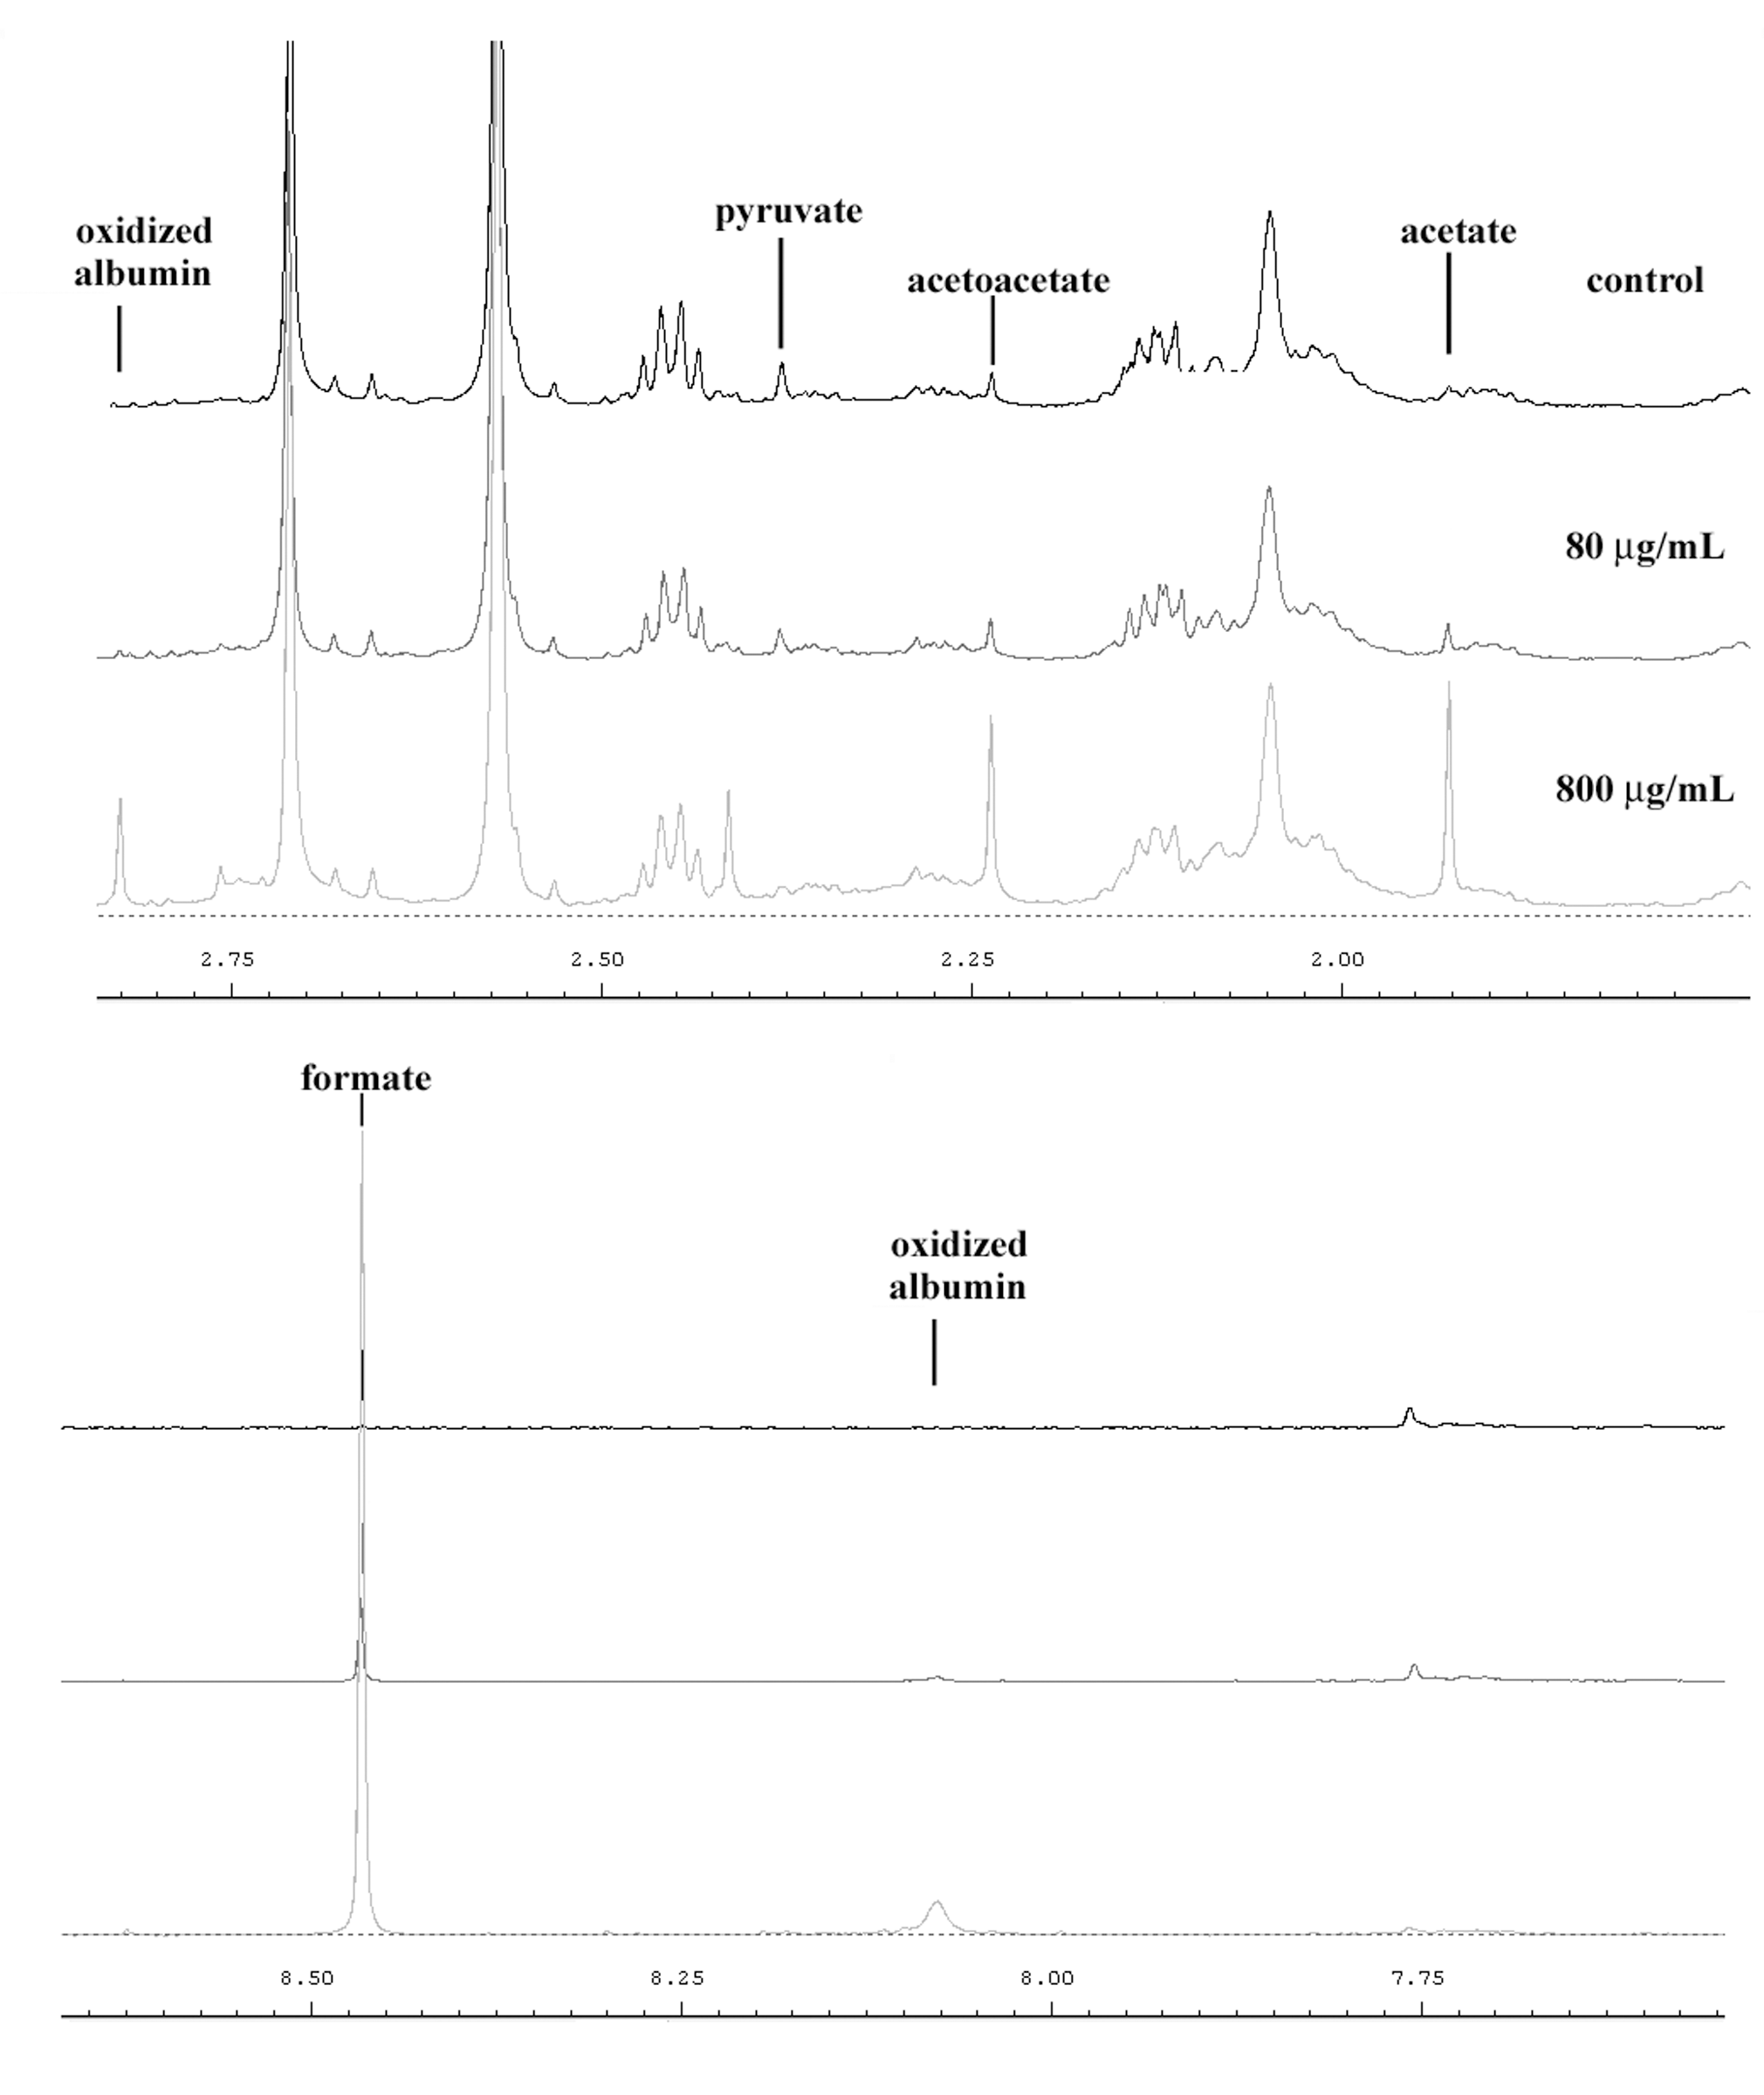
Snapshot of Carr-Purcell-Meiboom-Gill spectra containing some principal variable metabolites in human serum treated with ozone (control, 80 µg/mL, 800 µg/mL).
In particular, a strong increase of the peaks at 8.45 ppm (CH-formate), 5.40 ppm (CH-allantoin), 2.29 ppm (CH3-acetoacetate), and 1.93 ppm (CH3-acetate) were observed as well as a drastic decrease of the 2.35 ppm peak (CH3-pyruvate), which disappeared at an ozone concentration of 320 µg/mL. All the variations of these metabolites are strongly correlated with the concentration of insufflated ozone (Figure 3 and Table 2 ).
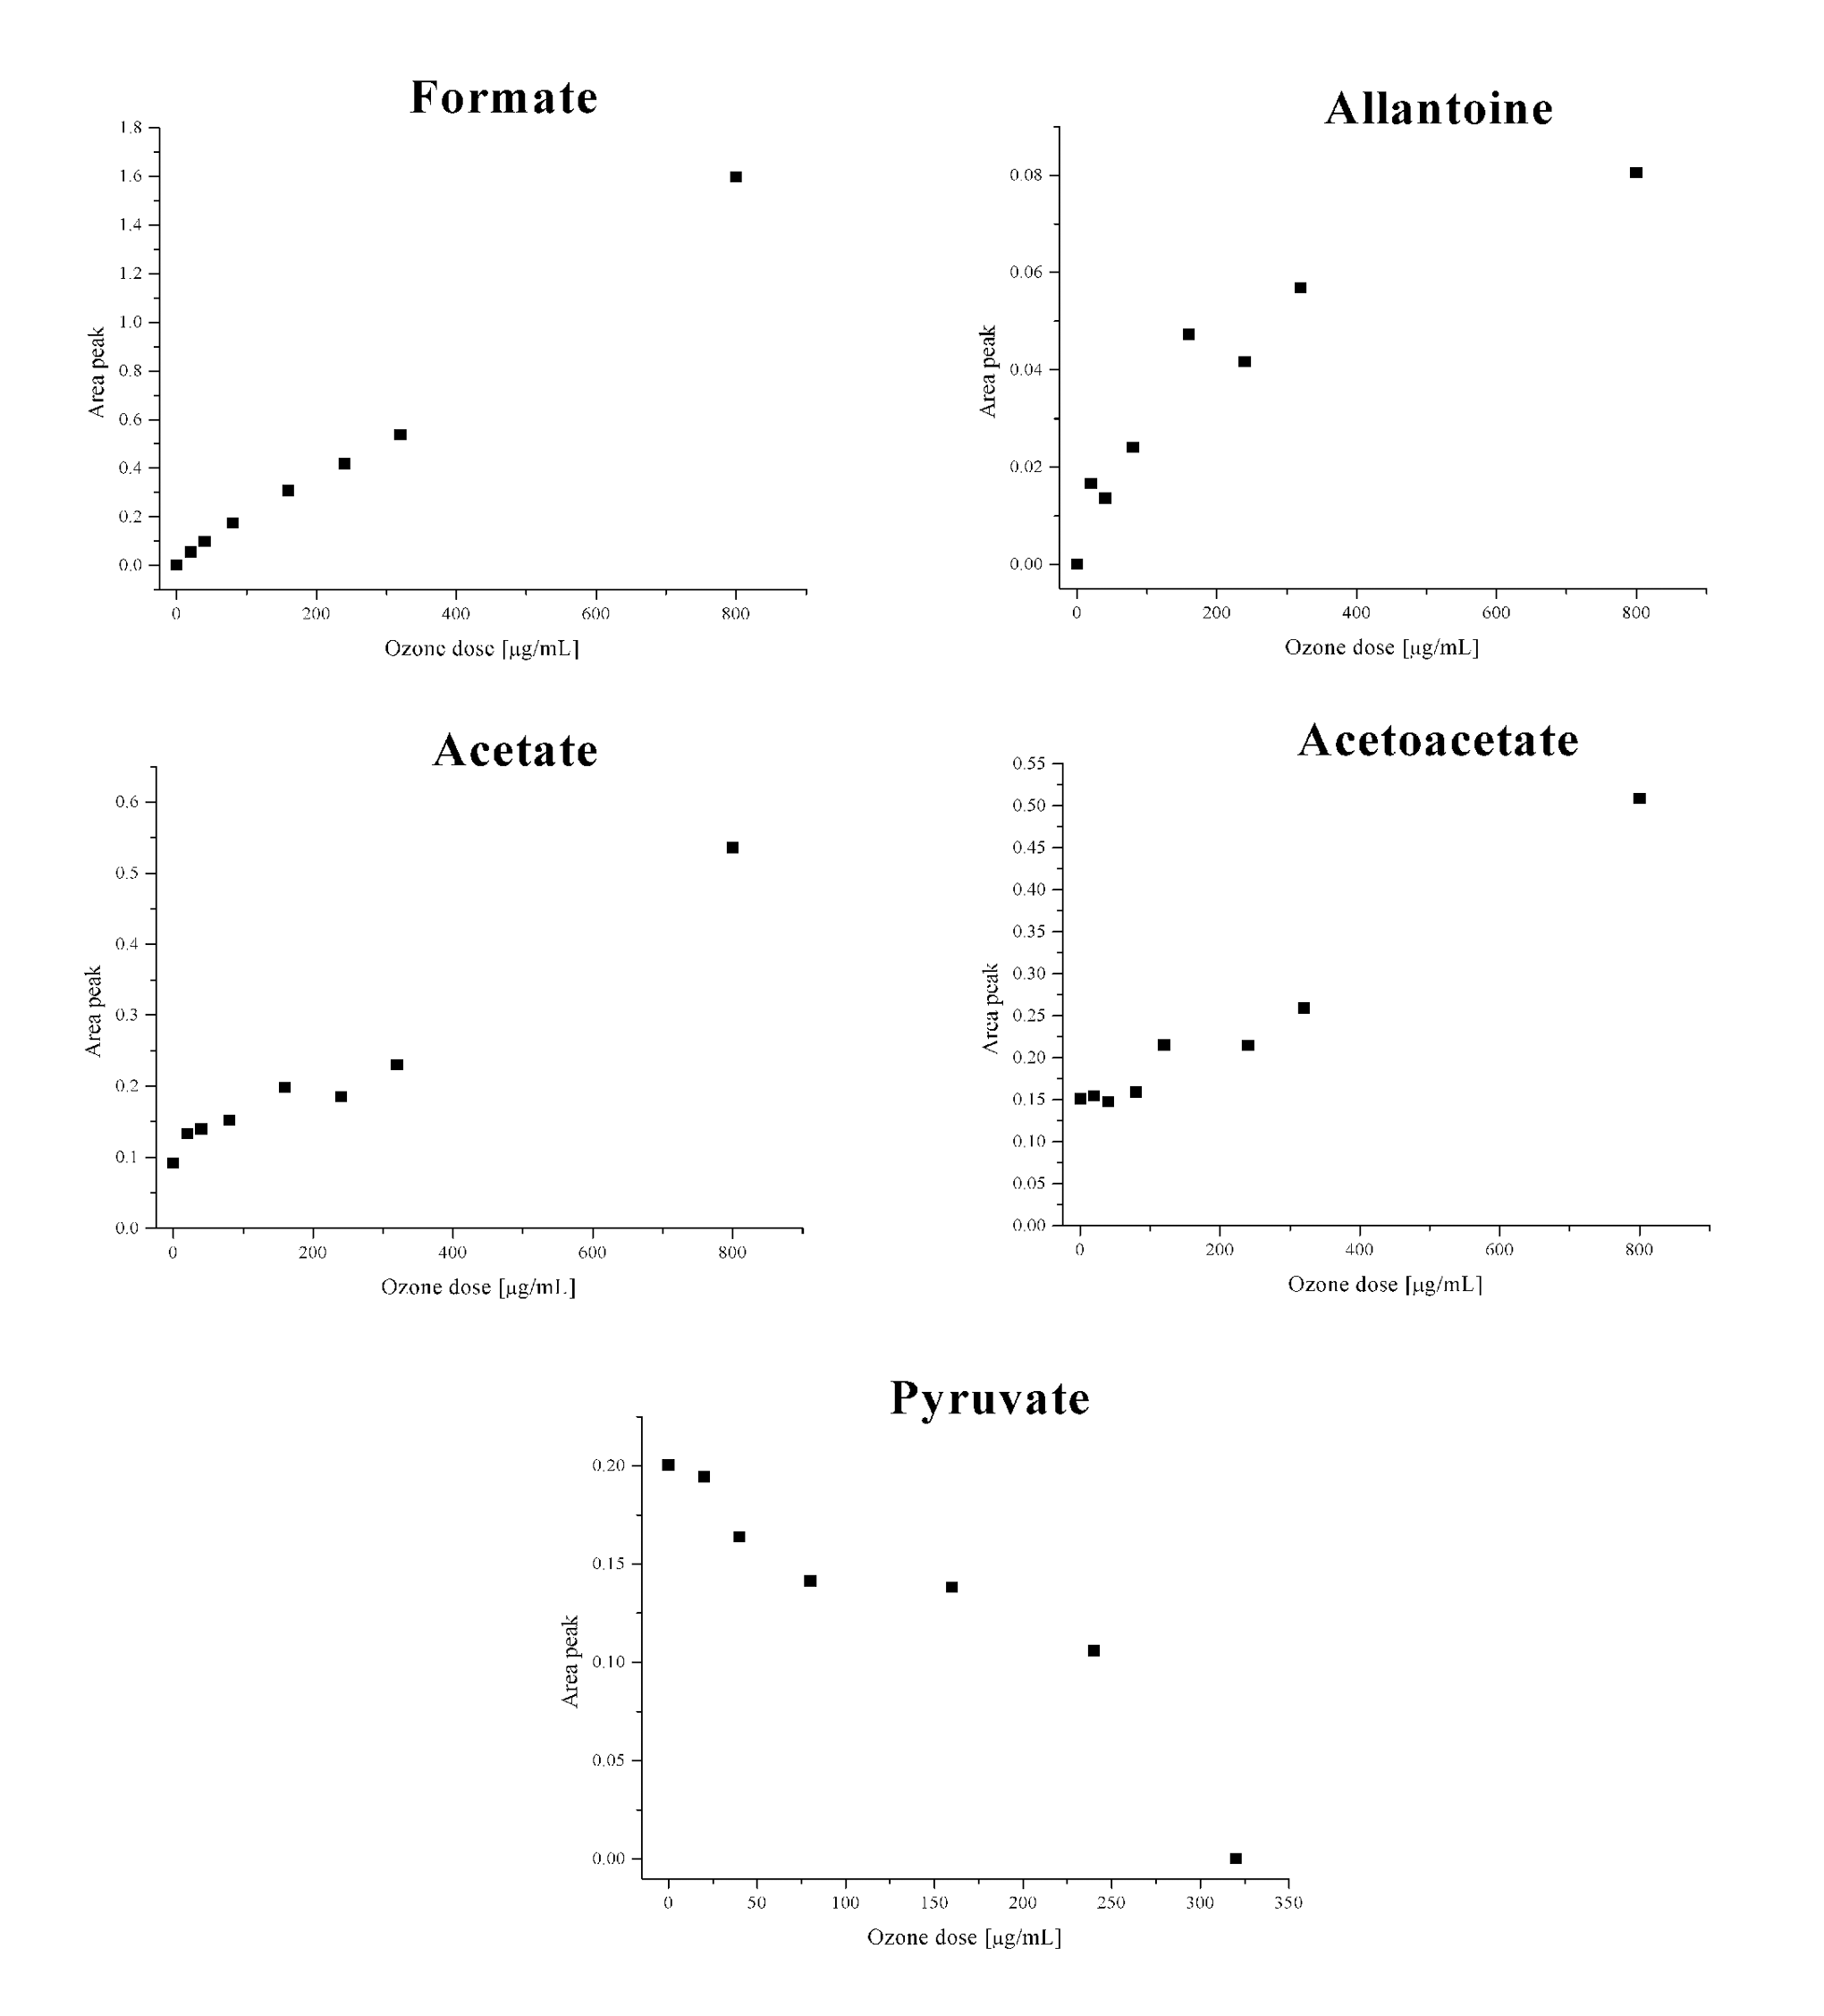
Variations of several metabolites in relation to increasing ozone dosages (n = 3; CV% <2).
Correlation Factor (Expressed as r 2 Parameter) for the Variable Metabolites
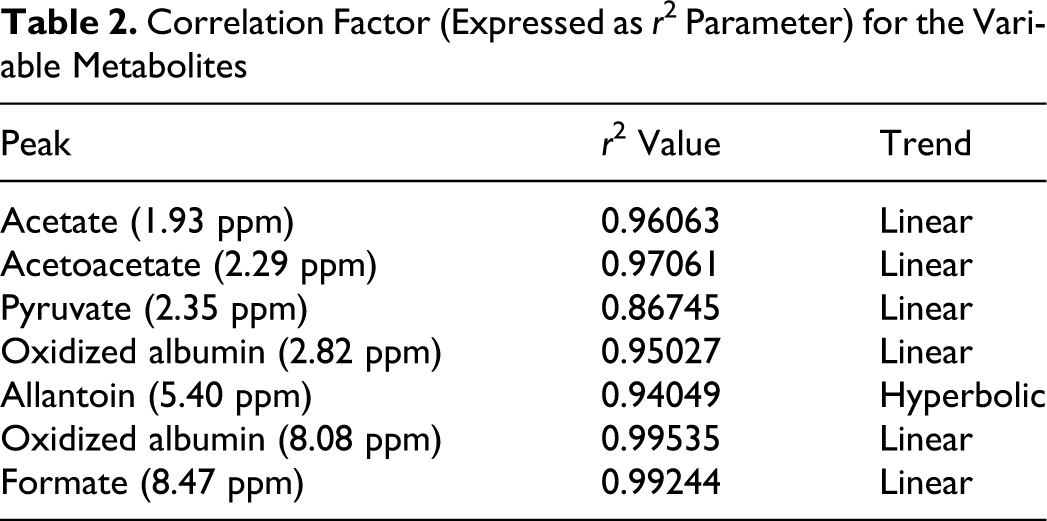
The variations of pyruvate and acetate are chemically correlated, in fact, acetate is formed by a direct ozone oxidation of pyruvate; formate is the last product of the oxidative process of carbohydrates, and allantoin comes from oxidation of uric acid, 25,29 which behaves as a “sacrificial” molecule in the presence of a strong oxidant such as ozone. 14,30 Acetoacetate is often formed in plasma by oxidation of γ-hydroxybutyrate. 25,31
Additional tests were performed to (1) confirm the trends of variations of each metabolites at higher concentrations of ozone and (2) confirm the specificity of the obtained results for the ozone treatment in comparison to other kinds of oxidative stress (treatment C).
The increase of the ozone concentration up to 800 µg/mL of gas per 1 mL of blood confirmed our findings for all the previous metabolites. For the nontherapeutic, high ozone concentrations (240, 320, and 800 µg/mL), the disappearance of the pyruvate signal from the spectrum was caused by the excessive oxidative process.
A further analysis of the spectra highlighted the presence of unidentified new peaks. These peaks occurred at 2.82 and 8.08 ppm and were not present in untreated plasma. Thus, these peaks were due to specific products directly linked to the ozone activity and indeed their amounts in the plasma are related to different ozone concentration (Figures 2 and 4 ).
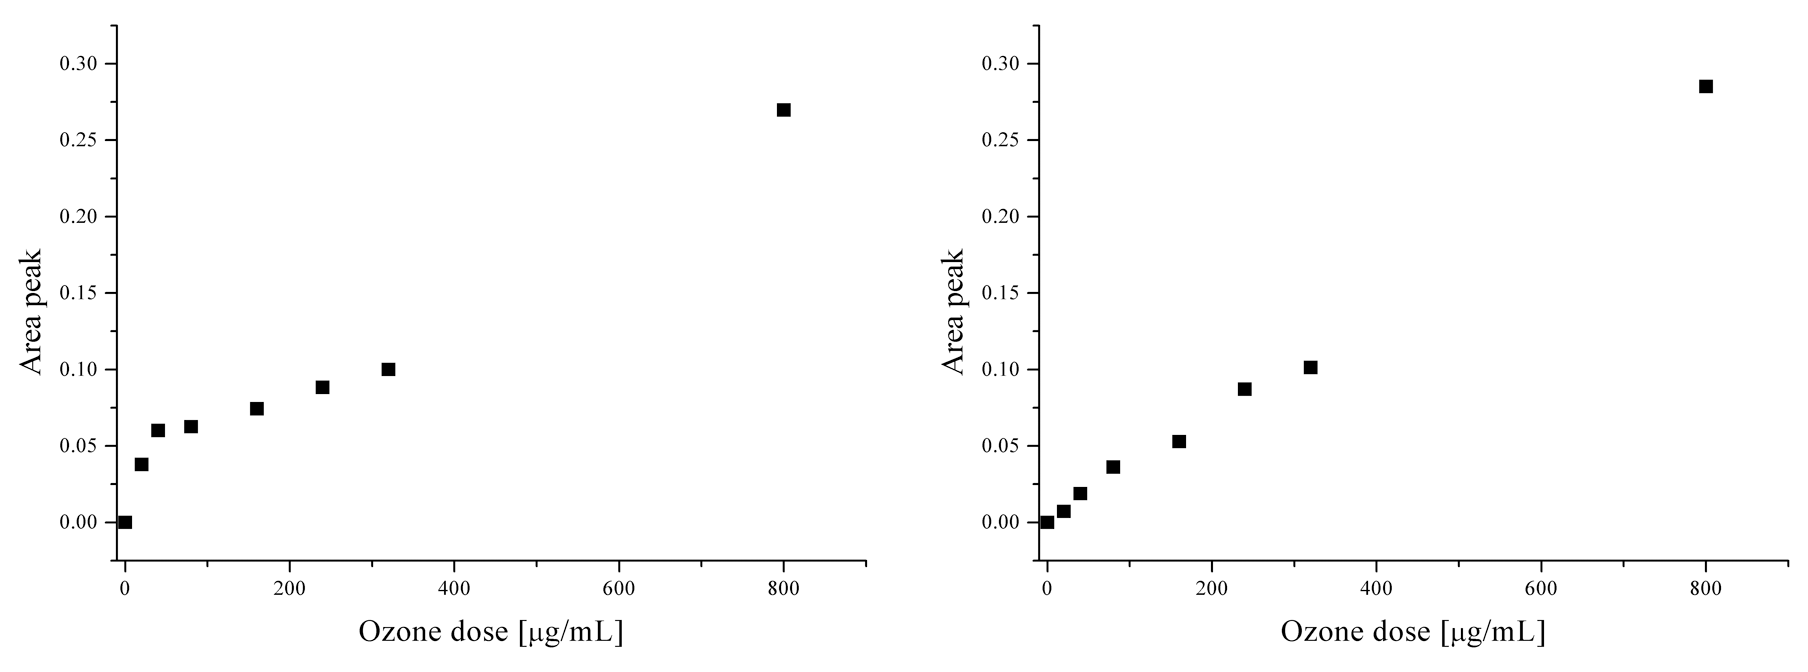
Linear trends of appearance of 2 unidentified peaks in relation to ozone dosages: signal areas at 2.82 ppm (left) and at 8.08 ppm (right) (n = 3; CV% <2).
The correlations between the areas of each peak and the concentration of insufflated ozone were very high. These data suggest that these peaks may represent markers of oxidative stress.
To express a hypothesis about the origin of these 2 peaks, other tests were performed (experiment B). It is well known that ozone causes lipid peroxidation, yielding several aldehydes among which HNE is quantitatively relevant. 32 This aldehyde has a double bond in β and it is not stable. It reacts easily with free thiol groups of cysteine, glutathione, and other metabolites normally present in plasma to form adducts easily eliminable from the organism with the urine. 32,33 A recent study indicated an interaction of HNE with Cys34 present in albumin. 34 Starting from these data, some samples obtained with the addition of scalar concentration of HNE (from 0.08 µM up to 3.2 µM) to a solution of 4% human albumin in saline were analyzed. After the addition of HNE to albumin, the 2 peaks at 2.82 ppm and 8.08 normally present after blood ozonation were absent, as well as the aldehydic signals of HNE. On the other hand, direct ozonation of a 4% albumin solution in saline allowed the detection of these 2 peaks, which increased in intensity in relation to the amount of ozone concentrations, indicating that these 2 signals are due to the direct oxidant activity of ozone on the albumin. Indeed, albumin has been called a sacrificial molecule. Whether albumin undergoes dimerization 35 or allows the formation of sulfenic acid 36 has not been clarified.
As for the experiments with albumin plus uric acid (300 µM) and/or ascorbic acid (50 µM), an increased formation of allantoin was obtained. The peak at 4.5 to 4.6 (ascorbic acid), although present when in the control sample, disappeared as soon as ozone (20 µg/mL) was added. These results suggest that uric acid is oxidized to allantoin and ascorbic acid is oxidized to dehydroascorbate. Additionally, the presence of formate and the appearance of both 2.82 and 8.08 ppm peaks were evidenced.
On the basis of the very harsh ozonation of blood (about 6 mg/mL of blood) plus UV radiation and heat (42.5°C) recently reported, 26 it was of interest to evaluate the spectra after blood treatment with (1) O3, (2) O3 + UV rays, (3) O3 + heat, (4) O3 + UV rays + heat, (5) UV rays, (6) heat, and (7) UV rays + heat. No appreciable influence of heat and/or UV treatments on the metabolites present in the blood was detected, except that at 4.43 and 8.19 ppm in the case of heat. These signals were not present in ozone-treated samples. The remaining other types of treatments (1-4) showed the typical fingerprint alterations already seen in previous tests (formate, acetoacetate, acetate, and allantoin increase; pyruvate decreases; peaks occur at 2.82 ppm and 8.08 ppm) to indicate that the principal stressor is due to ozone. Considering the different areas of the previous defined marker peaks at 2.82 ppm, a classification of samples based on the insufflated quantity of ozone is possible.
To confirm metabonomic results on the effects of blood oxidative stress on the erythrocytic membrane and the possible cell damage with intraerythrocytic material release according to both treatments A and C, physicochemical investigations based on hemolysis as well as viscosity were performed. In the first set of experiments, only increasing amounts of 1 single dose of ozone, according to treatment A protocol, were evaluated. A statistically significant increase of hemolysis (>5%) was observed at 800 µg/mL, whereas viscosity variations started at 160 µg/mL (Figure 5, a and b, respectively). In the second set of experiments, variable results were obtained, depending on the type and number of stressors applied. The combination of ozone + UV (condition 2) as well as ozone + UV + heat (condition 4) yielded the highest values of hemolysis (Figure 5c, samples ii and iv). The viscosity markedly increased only in the ozone + UV combination (Figure 5d, sample ii).
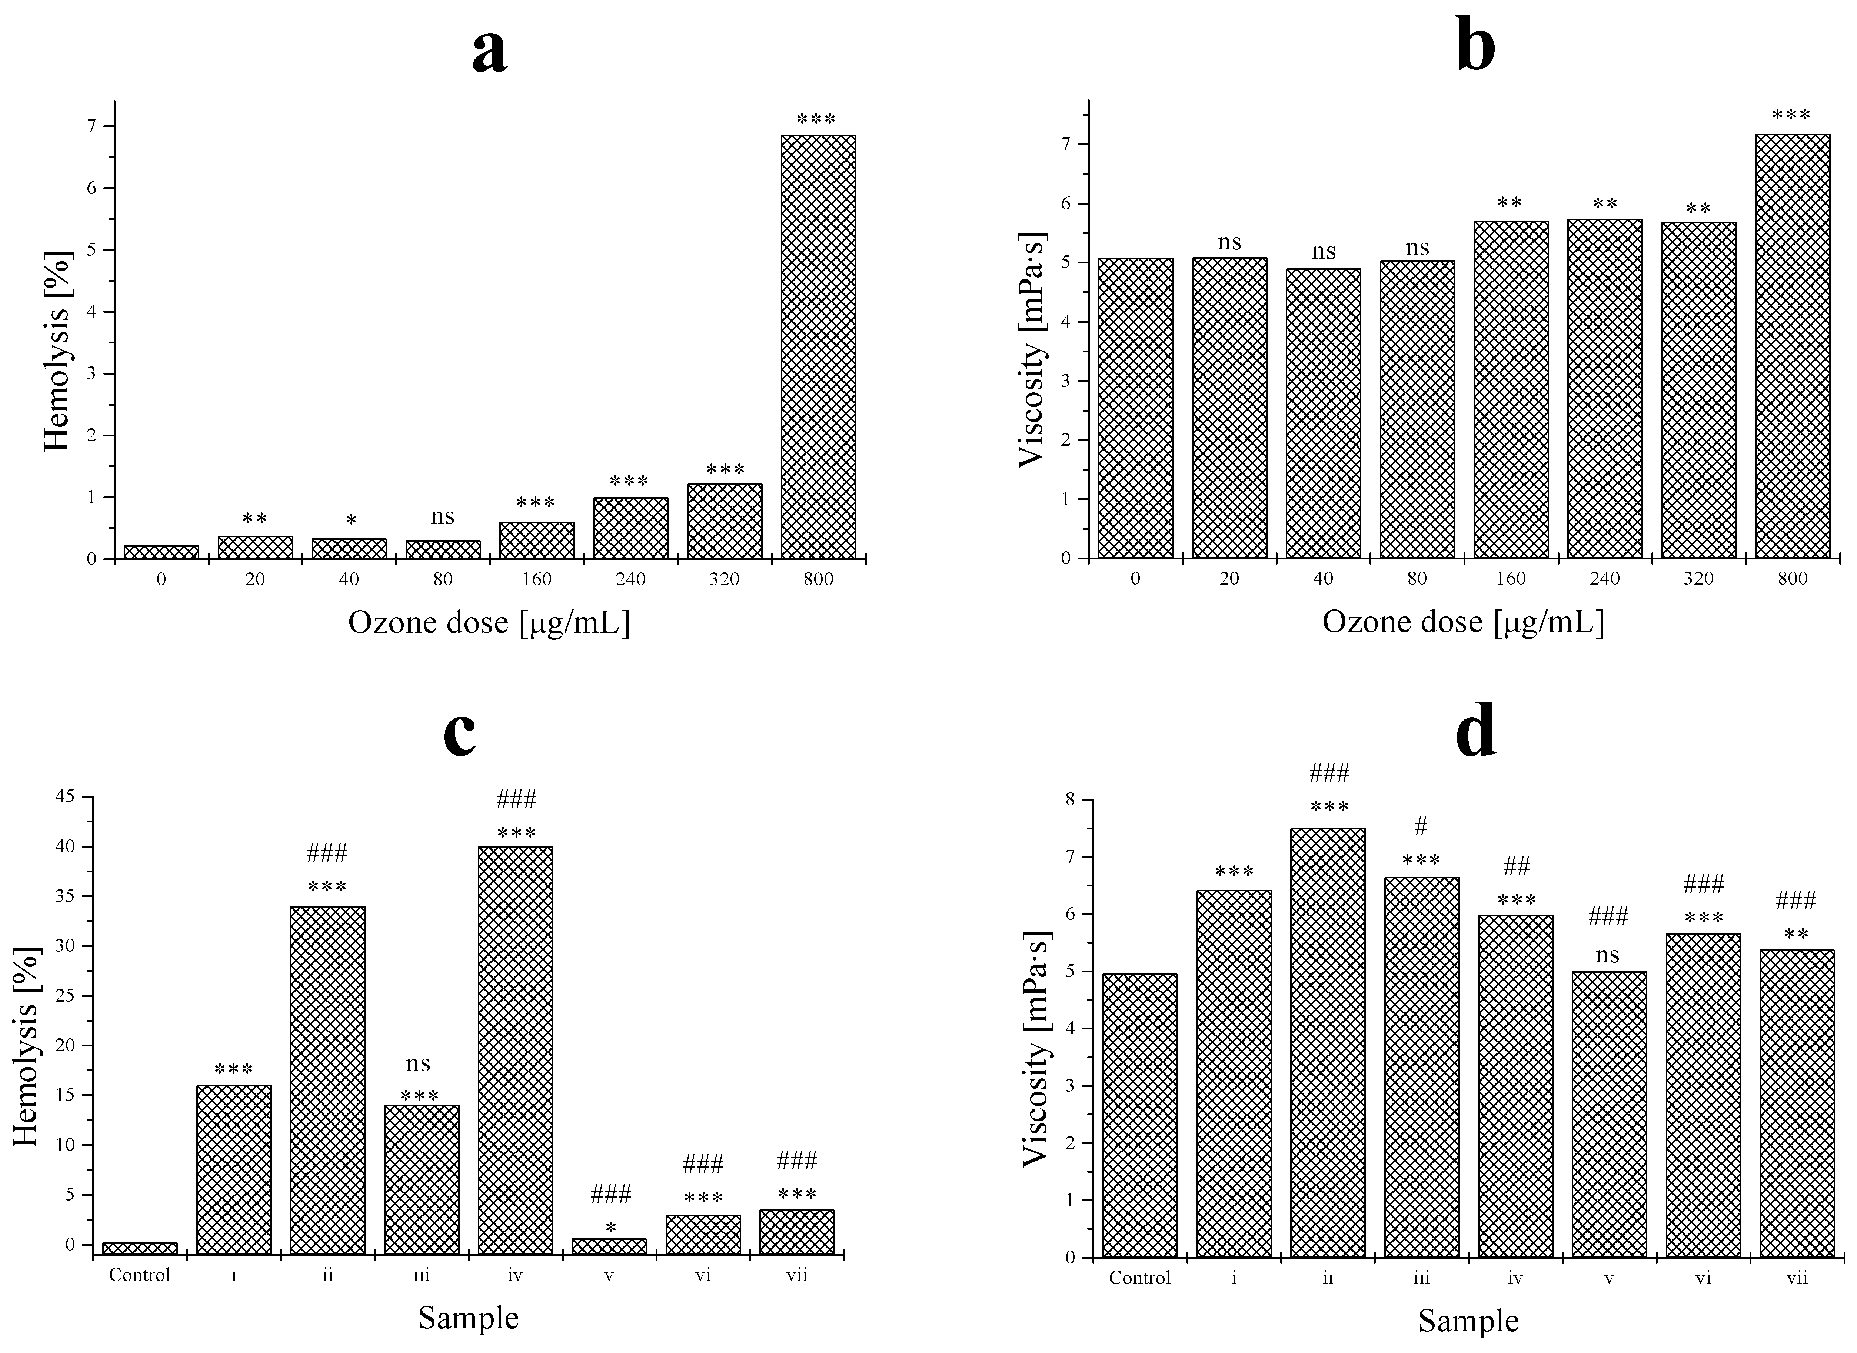
Hemolysis (left) and viscosity (right) variations in treatments a (top) and c (bottom). Statistical analysis: 3 symbols, P < .001, 2 symbols P < .01, 1 symbol P < .05, not significant P > .05; star symbol (*) vs control; sharp symbol (#) vs sample 1 (n = 5).
Discussion
Metabonomics is very useful to evaluate large and small differences in metabolic profiles, as demonstrated in urine for oxidative kidney damage. 24 The present work demonstrates that the metabonomic approach is a valid instrument to detect alterations in plasma profile due by oxidative stress induced by ozone and other stressors. Information on the oxidative stress was obtained from the CPMG spectra, in which signals arising from large macromolecules such as lipids are suppressed. This observation suggests that although ozone causes lipid peroxidation, ozone treatment causes neither visible alteration in lipid composition of blood nor hemolysis in the range of the well-documented therapeutic concentrations of ozone, namely between 10 µg/mL blood, or 0.21 µmol/mL and 80 µg/mL blood, or 1.68 µmol/mL. 14 It is unlikely that changes in metabolites are caused by hemoglobin degradation. Moreover Shinriki et al 30 excluded any erythrocytic membrane peroxidation with ozone concentration up to 100 µg/mL per mL of blood. 30 The first changes in the lipidic component appear only with high ozone concentrations (240 µg/mL upward) not normally used for therapeutic purposes. Moreover, after treatment with an ozone concentration of 800 µg/mL, changes in several peaks, both NOESY1D and in CPMG spectra, were observed, leading us to hypothesize damage to cell membranes caused by lipid oxidation with possible cytolysis. This supposition would explain both changes in the lipid component in the spectrum, well visible in NOESY1D spectrum at the highest concentrations of ozone and in the component given by small metabolites, better visible in CPMG spectrum.
The principal product of lipid peroxidation (HNE) it doesn’t alter the metabonomic profile of serum. The present alterations are only due to direct oxidation of some molecules (as pyruvate and carbohydrates) and antioxidants such as uric acids and ascorbic acid as well as to the so-called sacrificial behavior of albumin.
In this study, the metabolic profile of blood samples treated with ozone has been defined: the principal metabolic variation with the possible markers of oxidative stress due to ozone treatment has been indicated; and blood alterations due to ozone have been demonstrated to be strictly correlated to the concentration of insufflated ozone. When ozone concentrations were within the therapeutic range, only a few alterations were detected and were not associated to significant damages. However, several stresses, such as the association of ozone with heat and/or UV, appear deleterious, as exemplified in Figure 5. It appears that the denominated Celacade procedure, consisting of a harsh treatment of blood with an enormous ozone dose plus UV rays and heat stress 26 , causes extensive blood cell destruction with no beneficial effect on patients with chronic heart disease. This meaningless procedure must be proscribed. 37 If ozone therapy is to be safely used, it requires precise and well-calibrated ozone concentrations and the avoidance of ozone bubbling as well as additional stressor.
Footnotes
Acknowledgments
We are very grateful to Professor C. Luchinat for allowing us to perform these experiments and for useful and critical comments. We thank Professor F. Ponticelli for the use of the Multirays device. We gratefully acknowledge the linguistic revision by Mrs. H. Carter.