
Abstract
Matrix-assisted laser desorption/ionization–mass spectrometry (MALDI-MS) offers a label-free alternative for the screening of biochemical targets in both 1536- and 6144-assay formats, as well as potentially providing increased sensitivity, reproducibility, and the simultaneous detection of multiple assay components within a specified m/z range. Ion suppression effects are one of the principal limitations reported for MS analysis. Within MALDI-MS screening, it has been identified that certain biochemical components incorporated into the assay (e.g., the buffers used to preserve the physiological conditions of the enzyme, salts, and other additives) induce suppression of the analyte ion signals monitored. This poorly understood phenomenon of ion suppression is a key reason the screening community has been reluctant to shift their investigations toward MS methods with reduced sample cleanup. Using acetylcholine as an assay substrate mimic, we have generated robust data to quantify the degree to which the most highly used components (base buffers, additional components, detergents, cell culture media, and other additives) within current screening assays are compatible with MALDI-MS. Here, the most suitable buffers and components, along with their identified optimal concentrations in terms of limiting ion suppression effects, are proposed for use in screening assays measured by MALDI-MS.
Introduction
Within assay development, buffers and supplementary components, including cofactors, are required to aid structural integrity and enzymatic activity, as well as detergents to prevent the enzyme from irreversible binding to tubing/surfaces and decreasing the final enzyme concentration within the assay. 1
With a growing desire to use matrix-assisted laser desorption/ionization–mass spectrometry (MALDI-MS) successfully for screening techniques ( Suppl. Data 1 ), consideration of the assay development process, particularly the choice of buffer and other components, is a crucial step. In recent reports, it has been identified that certain conditions within the assay (e.g., buffers, salts, and other additives) decrease the ionization efficiency of the analyte to be detected.2–4 It is largely for this reason that the use of MALDI-MS within the screening field has been limited, and consequently there is an urgent need to identify which, and under what conditions, the most widely used assay components are compatible with MALDI-MS. In turn, this will require screening scientists to reevaluate their assay construction and consequently implement the use of “MS-friendly” assay components while maintaining their biochemical activity.
Here, using acetylcholine as the ion of interest to mimic a typical assay substrate, we demonstrate the degree to which the most highly used assay buffers, salts, and other components within screening assays are compatible with MALDI-MS, including identifying the components that afford completely detrimental effects on analyte signal intensity within the MALDI-MS assay. Consequently, we present the optimal conditions and concentrations in which suitable components can be used, without suppressing the ion signal of the analyte of interest, within MALDI-MS screening.
Materials and Methods
In this article, the term buffer will refer to any of the following components potentially used within a screening assay: base buffers, additional components, detergents, cell culture media, and additives.
Materials
All materials, unless otherwise stated, were purchased from Sigma-Aldrich (St. Louis, MO).
RPMI1640 culture medium, fetal bovine serum, glutamine (GlutaMAX I), sodium pyruvate, Optimem (Opti-MEM I), MEM nonessential amino acids, and cell culture CD-CHO medium were purchased, as Gibco Life Technologies products, from Thermo Fisher Scientific (Waltham, MA).
α-Cyano-4-hydroxycinnamic acid matrix (CHCA), Peptide Calibration Standard II, 3 × MTP target insert polished plain 1.0, and an MTP sheet metal adaptor 1.0 mm were purchased from Bruker Daltonics (Bremen, Germany).
Stock Buffer Concentration Preparation
Solid reagents were dissolved in high-performance liquid chromatography (HPLC)–grade water. All buffer solutions (dissolved solids and liquids) were diluted to an appropriate stock concentration, relating to the highest concentration used in current screening assays, using HPLC-grade water. For all relevant buffers, dilution to a top concentration of 1× has been described in this report as 100%. Solutions were then stored at 4 °C.
384-Well Plate Construction
A total of three identical 384-well conical (V) bottom microtiter plates (Greiner, Stonehouse, UK) were prepared using the following methods. For each 384-well plate, 100 µL of each buffer stock solution was pipetted into either row A or I, with specific buffer location and stock concentrations, as described in
An Agilent Bravo Automated Liquid Handling Platform (Agilent Technologies, Santa Clara, CA) was used to perform an eight-step, 1-in-2, fully automated serial dilution of all buffers using HPLC-grade water from rows A to H and from rows I to P, to a final concentration of 1/128th of the stock solutions. Dilutions were set to make up all wells to give a final volume of 50 µL. Finally, 50 µL 1% formic acid (MALDI quench solution) containing 50 µM acetylcholine (m/z 146.1), to give a final assay concentration of 25 µM, was added to all wells via manual pipetting. MALDI quench solution was added in agreement to the protocol used in high-throughput screening (HTS) assays to quench the enzymatic reaction of interest. Acetylcholine was added to represent the assay substrate (MS signal responses were linear to 30 µM, and the lower limit of detection was ~250 nM; see Suppl. Data 2 ) and as a determinant of ion suppression by the buffer. Plates were stored at 4 °C until use.
1536 MALDI Target Preparation
Prior to spotting each MALDI target insert polished plain 1.0 (Bruker Daltronics), the 384-well buffer plate was shaken on a Mini Orbital Shaker (Bibby Scientific Limited, Stone, UK) at 125 rpm for 5 min.
A triplicate set of targets per each of the three identical 384-well plates was prepared, resulting in a total of nine MTP targets for analysis. Targets were cleaned prior to spotting and reused for each 384-well plate using washing steps involving 100% ethanol and 100% water and allowed to dry at room temperature. CHCA matrix solution was made up at 7 mg/mL in 70% methanol and prepared in HPLC-grade water containing 0.2% [v/v] TFA and internal standards (ISs) sulphamethazine (m/z 279.1) and terbinafine hydrochloride (m/z 292.2), at final concentrations of 25 µg/mL and 1 µg/mL, respectively; fresh matrix solution was prepared per 384-well buffer plate spotting. Automated spotting onto the MTP target was performed using the Mosquito nanoliter dispenser (TTP Labtech, Melbourn, UK). CHCA matrix solution was dispensed from a V-bottomed 384-well plate (Greiner). Sample deposition was carried out using an optimized multiaspirate protocol (384 to 1536 multiaspirate to metal target protocol) involving successive aspirations of 25 nL matrix, 25 nL buffer, and 25 nL matrix and deposition of a 75-nL spot onto a cleaned target. The method used consisted of four cycles of spotting the 384-well buffer plate onto the target to result in a 1536-format with four equivalent sample spots per buffer. After each dispense, the tips were washed (three cycles of 100 nL) with HPLC-grade methanol from a V-bottomed 384-well plate (Greiner). Spotted targets were air-dried and the completed targets scanned to generate an optical image using a Ziath Fi-60F plate scanner (Ziath Ltd., Cambridge, UK), prior to MALDI-MS analysis.
MALDI-MS Analysis
A Bruker UltrafleXtreme MALDI-TOF/TOF instrument (Bruker Daltonics) was used to acquire the MALDI-MS data using an optimized method. This method covered the mass range of m/z 80 to 600 in Reflectron positive mode, with laser power 31% on target. Data from a sum of 1000 laser shots were acquired in 100-shot steps, spiral_small measuring raster movement, at every sample spot within the 48-by-32 spot target. The instrument was calibrated using Bruker Peptide Calibration Standard II and well-known peaks associated with the CHCA matrix (m/z 190.0 and m/z 379.1) to ensure calibration across the entire range. FlexControl software v3.4 (Bruker Daltonics) and FlexImaging software v4.0 (Bruker Daltonics) were used to control data acquisition and to generate the geometric spectra configuration for each target, respectively. Within the FlexImaging software, the spot microarray preparation mode was chosen to enable the Teach sample option; three Teach points (top left, top right, and bottom right sample spots) were set up to map the optical image coordinates to related positions on the sample carrier (MALDI MTP target), resulting in a rectangular shape. The number of spots was then specified in both the horizontal and vertical directions (e.g., x = 48 and y = 32).
Data Analysis
Using FlexImaging software v4.0 (Bruker Daltonics), mass window inclusion normalization was applied to all nine target plate data sets individually using a range of m/z 277.5 to 295.0 to include peaks relating to both the internal standards only. The mass window inclusion normalization method, which is a total ion count (TIC) normalization of a selected portion of the spectra, where the TIC normalization method divides all spectra by the mean of all data points, was calculated using equations (1) to (3).
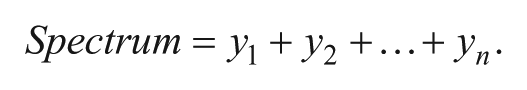
(1) A mass spectrum is considered as a vector of intensity values.

(2) Normalization is performed by dividing each mass spectrum in the data set by its individual normalization factor f.
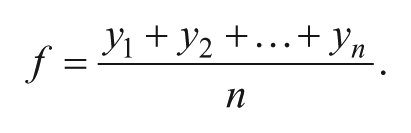
(3) Overall equation for mass window inclusion TIC normalization. The normalization factor, f, divides all spectra by the mean of all data points, y = spectra from each individual sample spot, n = mean of all data points within the mass window m/z 277.5 to 295.0 (data points for ISs).
A mass filter of 146.1 ± 0.2 Da, set to an absolute intensity scale of 1 to 200 a.u. (arbitrary units), was applied (any intensity value recorded as <1.0 a.u. was therefore allocated a value of absolute zero) and relating filter data exported to a text file to be opened in Microsoft Excel (Microsoft Corporation, Redmond, WA).
Average mean intensity for each spot across all nine targets was calculated. Any spot with an intensity value of 0 a.u., arising due to missed spotting or missed MALDI laser firing, was excluded from the calculations by formatting cells equaling 0 to be replaced with n/a; 1.1% of the total spots for all nine targets were found to contain an intensity of 0 a.u. and thus were removed. Resultant average intensities for each of the 1536 spots/laser firing positions were thus imported back onto the optical image for one of the original plate images (see Suppl. Data 3 ) and an intensity scaling of 0 to 1 a.u. applied.
In addition, the averaged 1536 intensity values were further restricted to reform the original 384-well plate construction by averaging the four sample spot intensities per buffer. Standard deviation of these values was also calculated. The 2D clustered column charts of each buffer were generated, including linear trend lines (plus the equation and R2 values) and custom error bars of 1 standard deviation using the calculated values (see Suppl. Data 4 ).
Results and Discussion
All “intensity values” discussed within this section of the report, unless otherwise stated, relate to the values calculated for the mass filter for acetylcholine (146.1 ± 0.2 Da, absolute intensity scale 1–200 a.u.) having undergone mass window inclusion normalization on each of the nine target plate data sets using a range of m/z 277.5 to 295.0 (covering signals from the internal standards). Following this, mean average intensity was calculated across all nine plates for each 1536 sample spots and resultant restriction to the initial 384-format by averaging the four sample spot intensities per buffer, as described previously in the Methods section.
Within MALDI-TOF analysis, normalization is critically important for the accurate interpretation of a data set. Artifacts within the data often result due to heterogeneous matrix crystal distribution across the sample spot or contamination of the ion source, altering the TIC of the spectra. Chemical variations within the sample conditions such as salts or pH gradients are also known to modulate the abundance of signals within MALDI spectra. In general, TIC is the most widely used normalization technique in which the individual mass spectra are each divided by their TIC so that all spectra in a data set have the same integrated area under the spectrum. However, this method is built on the assumption that similar numbers of signals are identified within each spectrum. 5 In our data sets, therefore, where the hypothesis was ion suppression effects would be present, it would not be applicable to use the entire spectrum for this normalization method. Recent reports have suggested that using reference standards to monitor molecule-specific ion suppression produces the best results for quantitation6,7; thus by the addition of internal standards sulphamethazine (m/z 279.1) and terbinafine hydrochloride (m/z 292.2) to the matrix, TIC to the ISs was applied.
It was decided to initially interrogate the acetylcholine intensity values for HPLC-grade water, across the five buffer columns (20–24) within the 384-well plate format, as this should not display any suppression of the substrate ion signal. In the 2D clustered column charts in Supplemental Data 5 , all dilution concentrations are noted as 100% and individual column data preserved to allow full examination of the data. Due to the data set demonstrating a minimum average intensity of 1.0 a.u., an intensity value >1.0 a.u. was set as the threshold for optimal acetylcholine ionization. In this manner, any intensity value <1.0 a.u. acquired across the other buffers analyzed, as well as their corresponding 1-in-2 serial dilutions, was therefore determined as limiting the acetylcholine signal within the normalized spectra, thus displaying ion suppression effects.
FlexImaging software was used to generate a MALDI image of the 1536 average intensity data set, superimposed onto an optical image of one of the spotted MTP target inserts (see
Fig. 1
). Having established the threshold value for adequate ionization and consequently setting the absolute intensity scale (0–1 a.u.),
Figure 1
shows an image representation of the signal intensity of acetylcholine (m/z 146.1 ± 0.2 Da, with white denoting the highest signal intensity) in the wells of the 1536 plate in the presence of various “buffer” components at different concentrations.
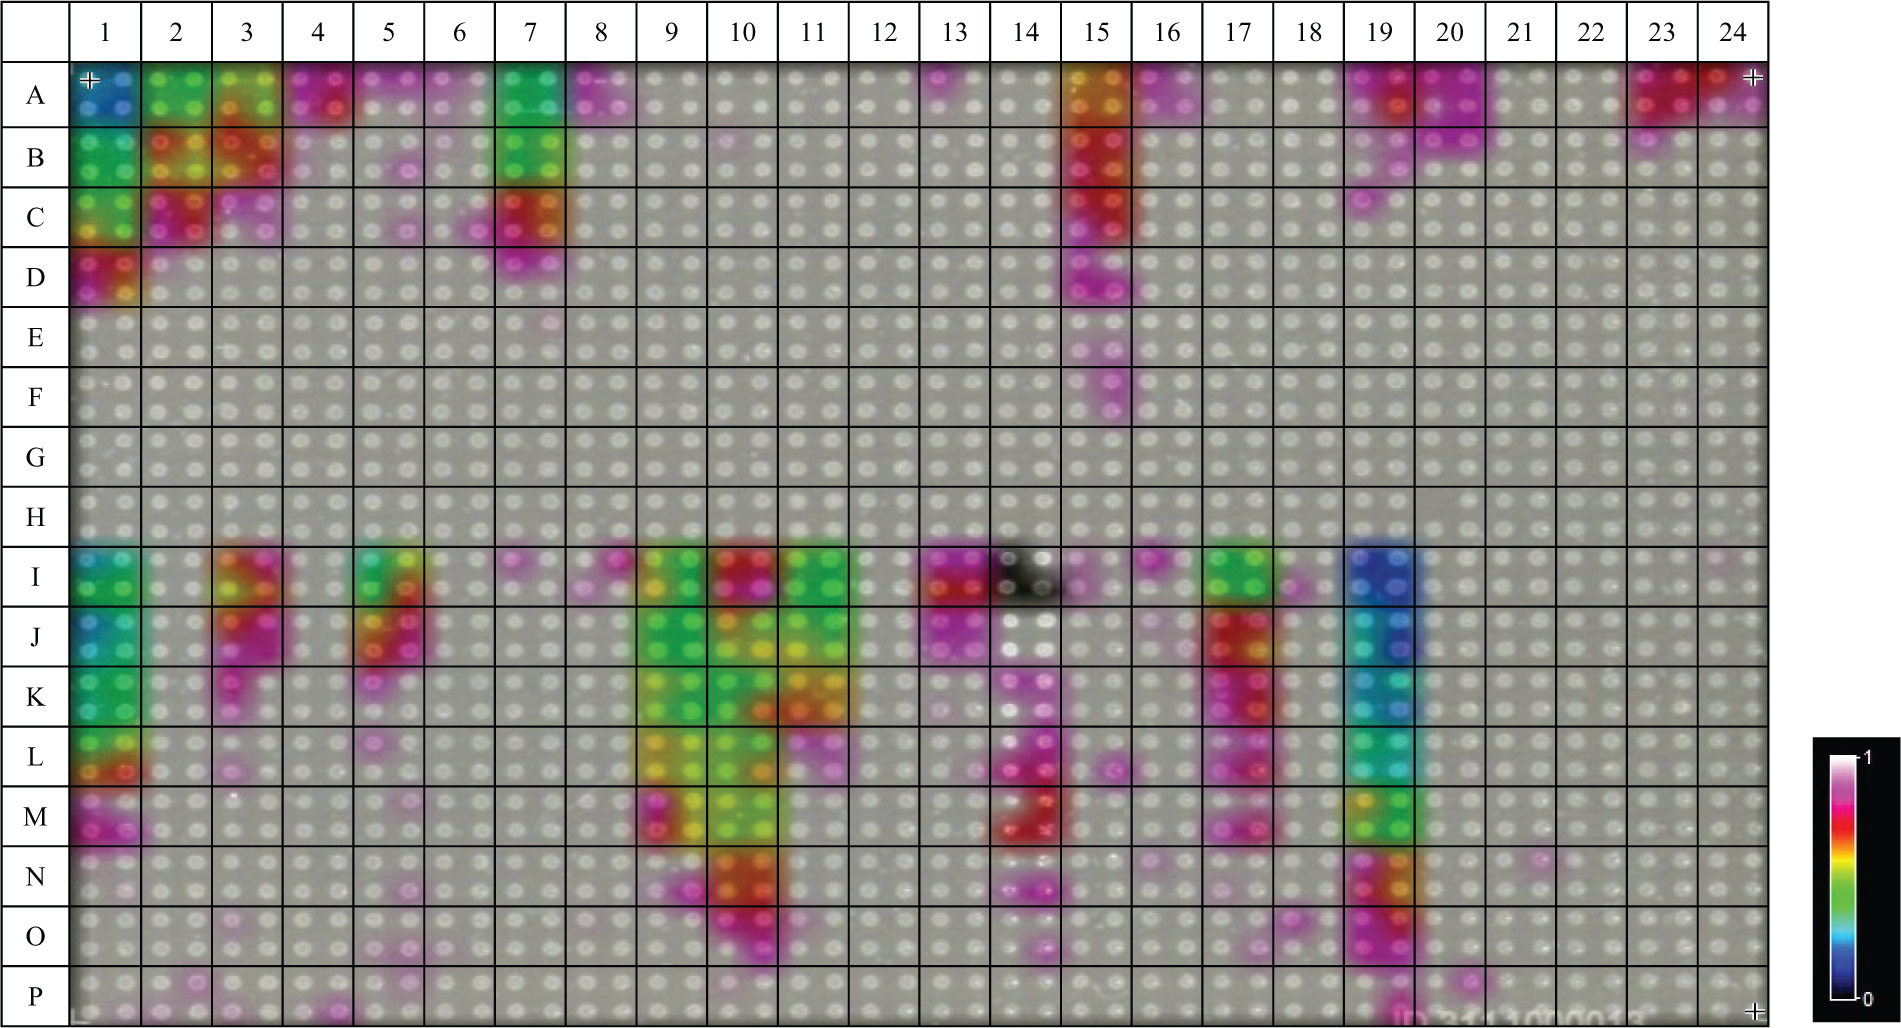
Image representation of the signal intensity of acetylcholine (m/z 146.1 ± 0.2 Da, with white denoting the highest signal intensity) in the wells of a 1536 plate in the presence of various “buffer” components at different concentrations.
For all buffers analyzed, an individual 2D clustered column chart was generated to display the degree of correlation between the concentration of buffer and acetylcholine ion signal intensity (see Suppl. Data 4 ), as described in the Methods section. Data sets of particular note are discussed further.
From the acetylcholine intensity values acquired for the following assay buffers, it was determined that the highest concentrations investigated for current screening assays were well suited for use by MALDI-MS due to all dilution values displaying an intensity value >1.0 a.u., and thus no alteration in the use of these assay components would be required to apply them to MALDI-MS screening: ammonium acetate, adenosine triphosphate (ATP), β (2-) mercaptoethanol, bovine serum albumin, dithiothreitol (DTT), formic acid, glycerol, NADPH, nonessential amino acids (MEM NEAAs), polyethylene glycol (PEG), potassium chloride, sodium chloride, sodium pyruvate, sodium orthovandate, Tris(2-carboxyethyl)phosphine hydrochloride (TCEP), and trifluoroacetic acid. For these buffer components, almost no correlation (i.e., no significant change) was observed (r2 < 0.2) between the 1-in-2 serial dilution solutions and the acetylcholine ion signal observed, as shown in the example cluster plot for the assay component, NEAA ( Fig. 2 ). This reinforces the statement that, for these buffers, the optimal concentration used within traditional screening techniques can simply be transferred to MALDI-MS screening without any cause for concern over ion suppression effects.
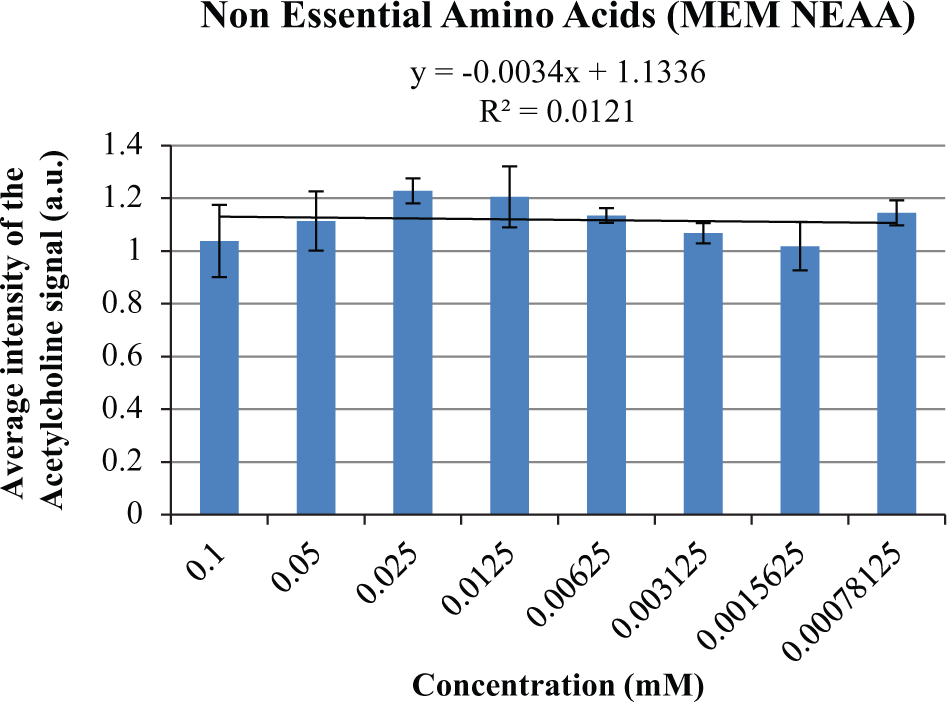
A 2D clustered column chart generated for the average intensity values for acetylcholine (25 µM, peak [146.1 ± 0.2 Da] after normalization) within nonessential amino acid (NEAA) solutions of differing concentrations demonstrating that the optimal concentration used within traditional screening techniques can simply be transferred to matrix-assisted laser desorption/ionization–mass spectrometry (MALDI-MS) screening without any cause for concern over ion suppression effects.
In comparison, a number of buffers displayed major concerns in terms of their ability to be applied to MALDI-MS ( Fig. 3A–E ). Employing sodium bicarbonate, the detergents Pluronic F127 and Triton X100, Optimem (Opti-MEM I), and cell culture CD-CHO medium as the buffer solution, at least a 1-in-32 dilution from the stock was necessary to achieve the threshold acetylcholine intensity value of >1.0 a.u. Cell culture CD-CHO medium ( Fig. 3E ) showed complete incompatibility with MALDI-MS with all the dilutions analyzed; even the 1-in-128 dilution of the stock still displayed an intensity value <1.0 a.u. (0.97 a.u.).
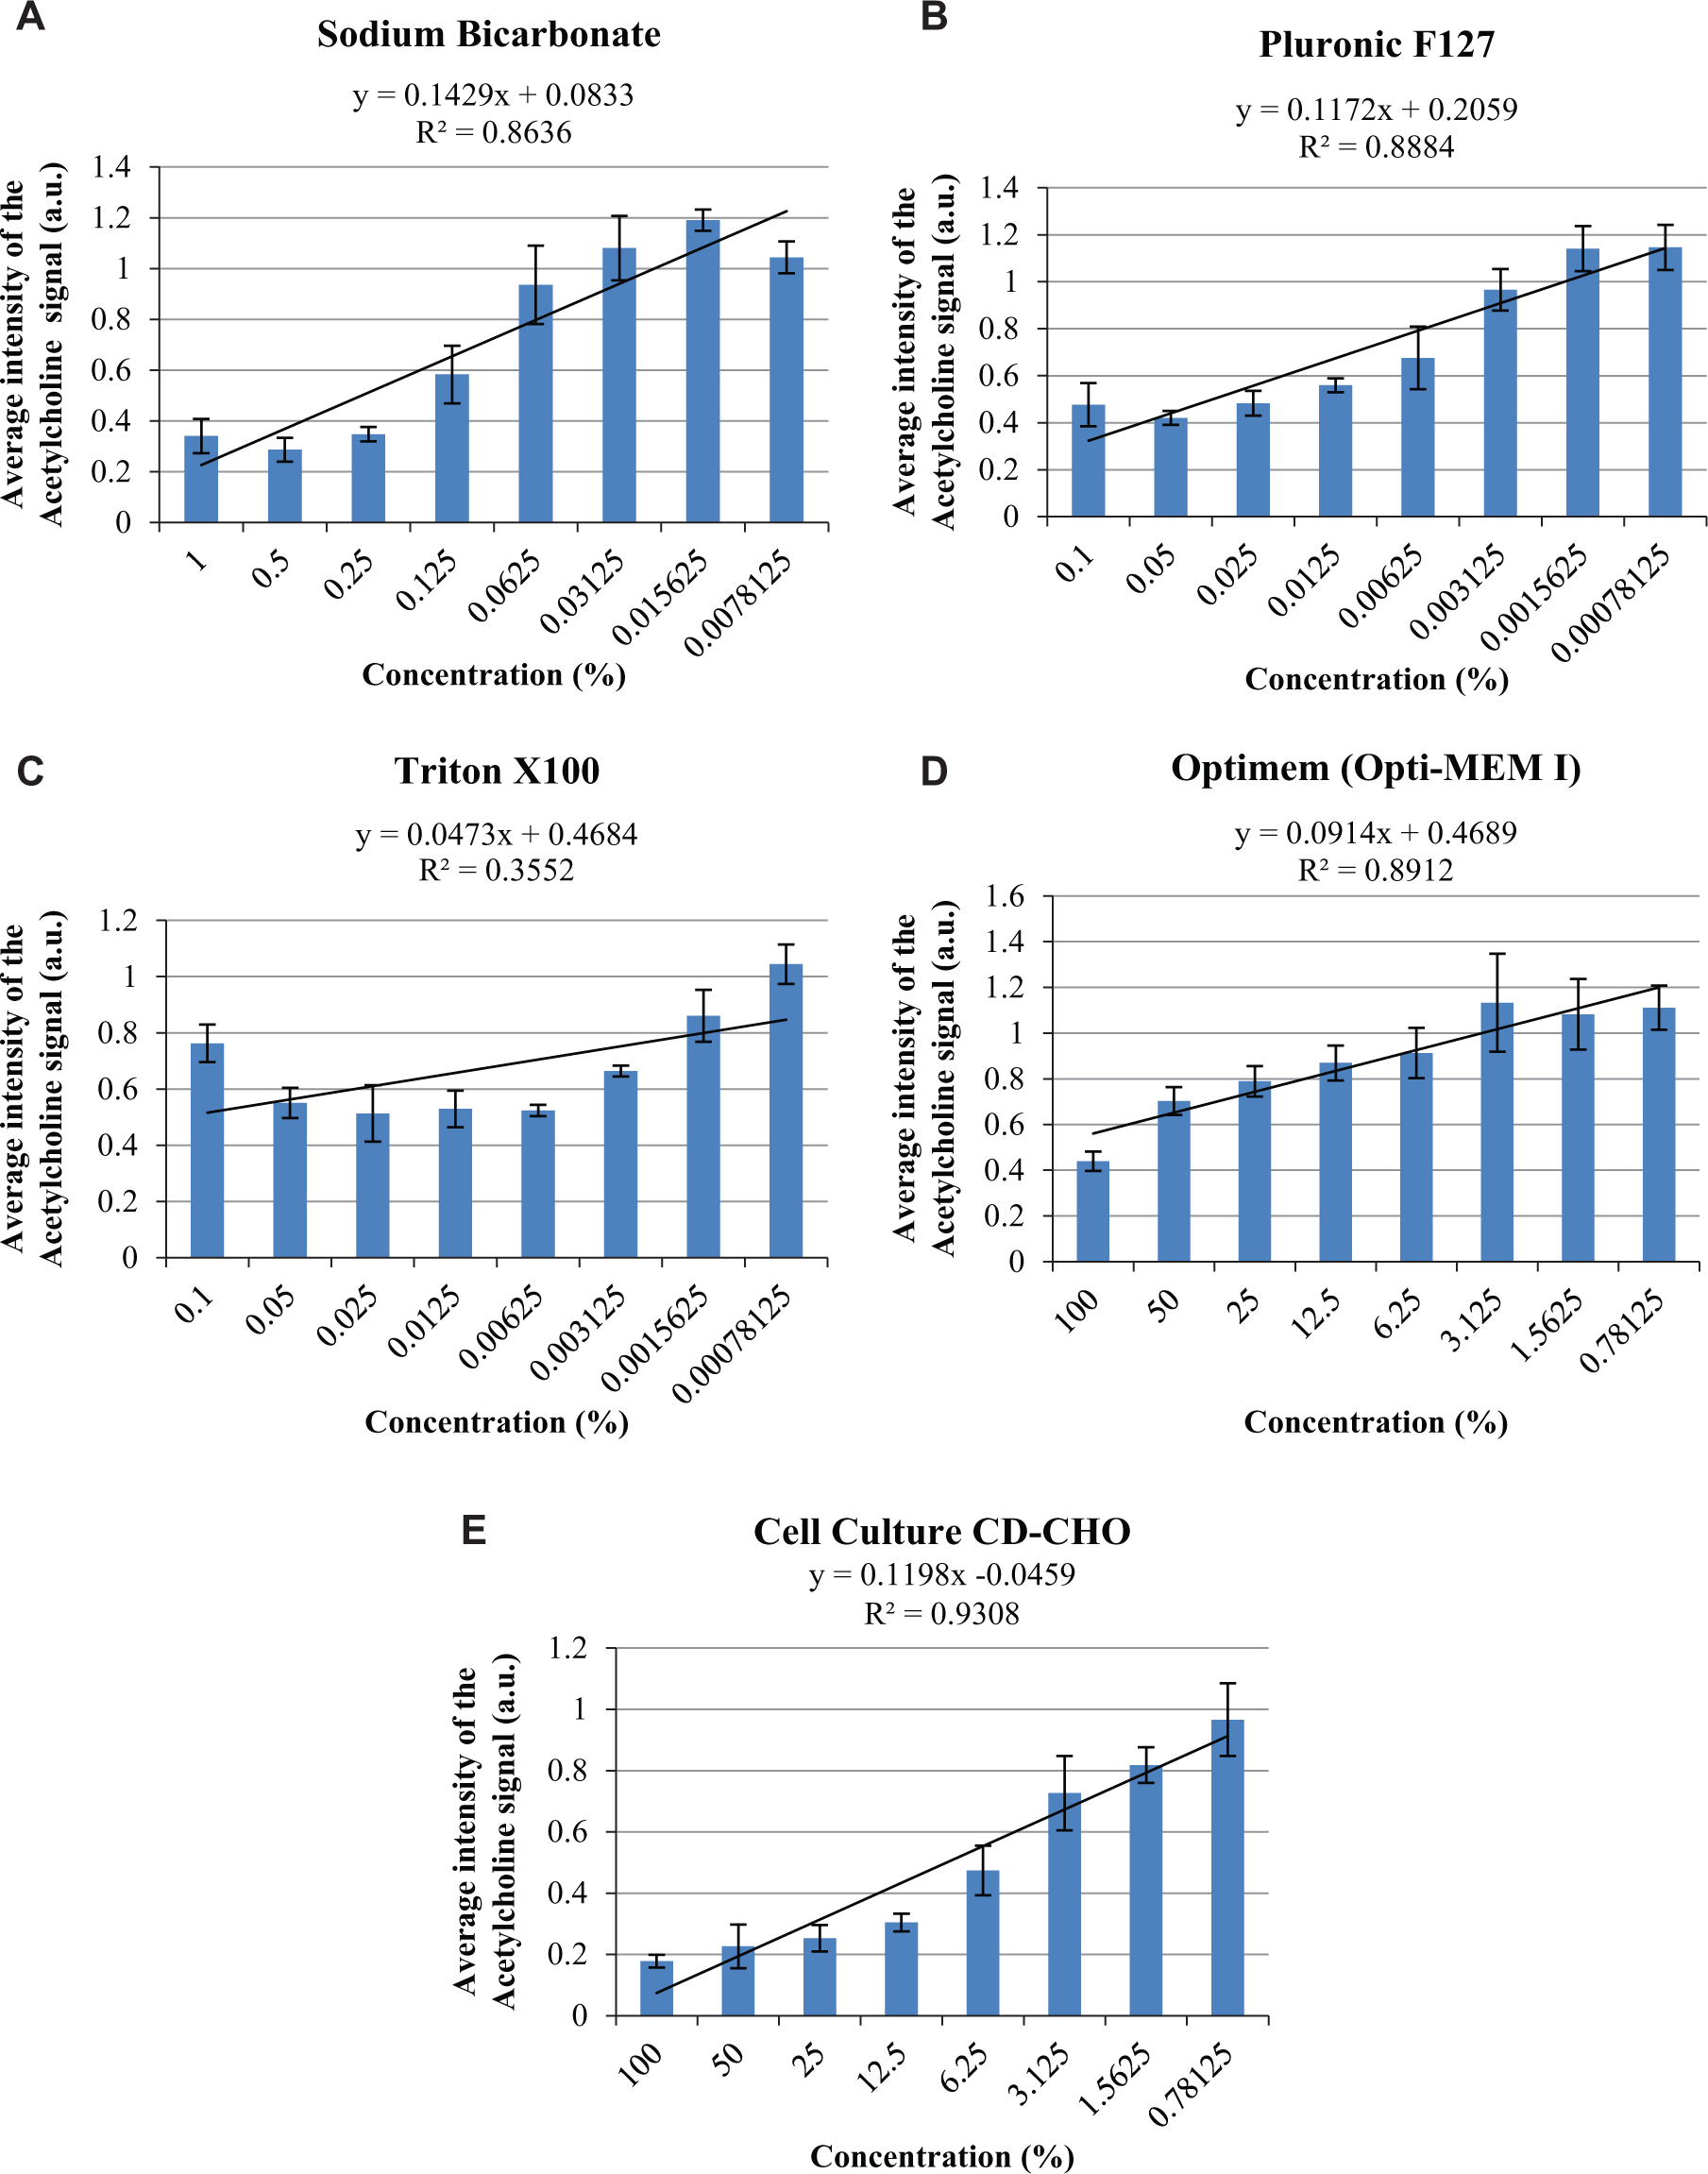
The 2D clustered column charts generated for the average intensity values for acetylcholine (25 µM, peak [146.1 ± 0.2 Da] after normalization) within buffer solutions of (
On a similar note, fetal bovine serum also presented incompatibility with the MALDI-MS workflow. Three sample spots ( Fig. 1 , position I-14) for this buffer stock concentration (10%) within all nine MTP target plates displayed a consistent intensity value of 0 a.u. (values of <1.0 a.u. in the original absolute intensity scaling of 1–200 a.u. were recorded as 0 a.u.). As described in the Methods section, it was previously thought that this intensity level would arise only due to missed spotting or missed MALDI laser firing. Investigating the MTP target, these spots showed a consistently visible difference in crystallization with the CHCA matrix in comparison to all other sample spots on the MTP target (see Suppl. Data 3 ). Upon manual inspection of the acquired data for these positions, spectra of extremely low intensity were recorded and thus reasoned to be due to inadequate co-crystallization, a phenomenon also reported in previous literature. 5 From the data presented for fetal bovine serum ( Fig. 4A ), extreme variations in acetylcholine intensity are presented with respect to the highest concentrations used (i.e., 10% and 5%). Due to visible disparity in the matrix crystallization for these sample spots and the consequent spectra of significantly low ion count, it has been reasoned that, in this case, variation arises as an artifact of the TIC mass window inclusion normalization algorithm applied. At low signal intensity, minor changes in ionization efficiency give rise to much larger variation patterns within the data; therefore, these sample spots were excluded. Below a concentration of 2.5% (1-in-4 dilution), fetal bovine serum sample spots showed improved crystallization, improved overall spectra ion count, and reduced standard deviation within the averaged samples; thus, data obtained for concentrations below a 1-in-4 dilution remain valid ( Fig. 4B ).
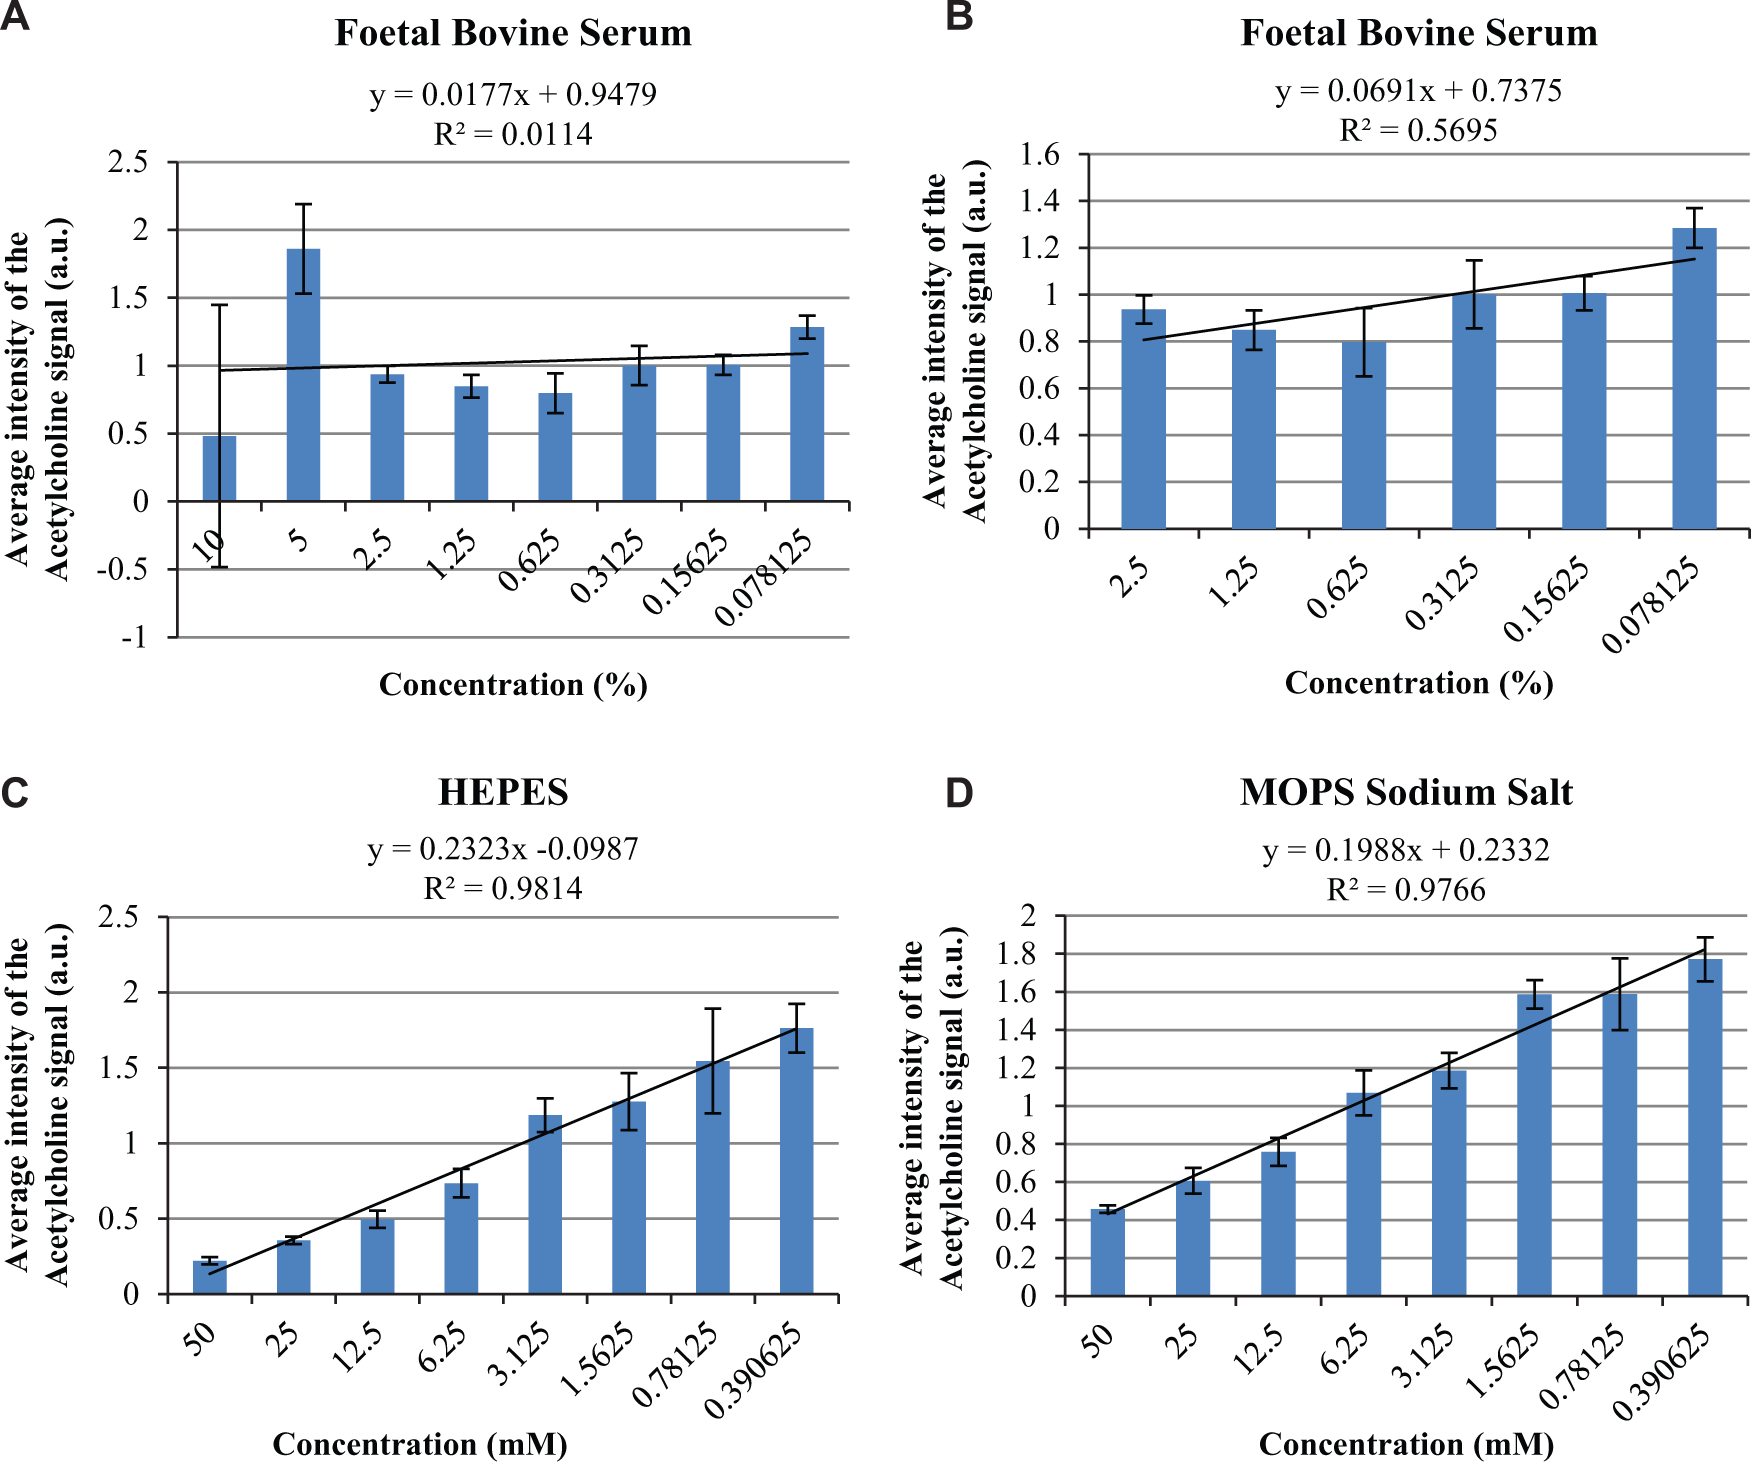
The 2D clustered column charts generated for the average intensity values for acetylcholine (25 µM, peak [146.1 ± 0.2 Da] after normalization] within fetal bovine serum solutions at various concentrations. (
Examining other buffer data sets, for both the base buffers HEPES and MOPS sodium salt (see Fig. 4C , D ), high correlation (r2 > 0.95) was observed between the dilutions (eight-step, 1-in-2 dilution from the highest concentration) analyzed and the average intensity of the acetylcholine signal recorded. This demonstrates, in agreement with previously reported literature,8,9 that upon solvent dilution, ion suppression effects are diminished. Although this relationship suggests additional buffer solution dilutions may aid signal detection, further investigations using dilutions greater than 1 in 128 have not been performed as the dilution levels would render the assay components inadequate for use within biochemical screening assays.
Similar correlations were seen across the remaining screening buffers trialed that have not been discussed previously in this report; dilution of the buffer solvent resulted in an increased acetylcholine signal intensity. It is recommended that the highest concentration of buffer providing an intensity value of >1.0 a.u. in the data presented should be employed as a suitable “MS-friendly” component for use in biochemical assays. Suggested concentrations for all of the reagents/buffers investigated are reported in
In conclusion, to successfully shift screening investigations toward MALDI-MS, the use of the current screening buffers (base buffers, additional components, detergents, cell culture media, and other additives) needs considerable reevaluation when developing assays, in terms of the constituents and their associated concentrations required, to successfully ensure MS-friendly components are employed within screening investigations.
Reported here, by the use of acetylcholine as an assay substrate, considering the ion suppression effects within MALDI-MS screening, concerns were observed for a number of the most widely used buffers and other assay components applied to previous screening techniques: of particular note, sodium bicarbonate, the detergents Pluronic F127 and Triton X100, Optimem (Opti-MEM I), and cell culture CD-CHO medium. A move away from the use of these components in assay construction is essential in order for MALDI-MS approaches to be successfully exploited in the screening field. For assays where this is not possible, then alternative capabilities involving a cleanup step will be required. Other factors, including poor co-crystallization with the matrix (in the case of fetal bovine serum), were also observed to limit the intensity of the signal detected for acetylcholine and thus should be taken into account when constructing an assay plate.
In contrast, 16 of the 43 buffers analyzed were deemed MS friendly at current assay concentrations and consequently require no alteration in their use within screening assays to be applied to MALDI-MS. Furthermore, for many of the buffers examined, a significant correlation was observed between the concentration used and suppression of the acetylcholine signal. For these components, reassessment of the concentrations at which they are incorporated into an assay would provide sufficient adjustment to a screening assay for MALDI-MS to be successful. The levels of dilution required to reach the suitable concentrations, where no ion suppression of the substrate can be observed, are reported in this article (
It should be noted that, in this investigation, all suppression effects observed were reported evaluating the ion signal for acetylcholine as the analyte only. Analyte-dependent variations in the TIC of the signal detected are to be expected. Consequently, individual investigations for a specific analyte of interest, in its deconstructed assay conditions, should be performed prior to full screening assay development to determine the highest buffer concentrations that deliver an optimal intensity for the analyte in question. In addition, the accumulative effect of all the selected assay components and the reaction kinetics should in all instances be evaluated under the MS-friendly buffer conditions to determine if the biology/pharmacology is affected.
By adopting this reevaluation of the buffers and other assay components incorporated into screening assays, to eliminate the concerns involving ion suppression effects, screening by MALDI-MS has the potential to provide a label-free, direct-detection alternative to the fluorescence and chemiluminescence approaches traditionally used. This report goes some way into defining the optimal conditions for compatibility of the most widely used screening assay base buffers, additional components, detergents, cell culture media, and other additives within screening by MALDI-MS. As a result, a balance between limiting the ion suppression effects on the analyte ion signal intensity and the degree of requirement for a particular assay component condition needs to be assessed prior to all MALDI-MS assay constructions. Furthermore, continued evaluation and the addition of other assay components need to be encouraged to generate a complete catalogue of favorable buffers and their suitable concentrations for use in MALDI-MS screening to ensure full success of the technique.
Footnotes
Acknowledgements
We thank Meike Hamester, Jens Fuchser, Arne Fuetterer, Arndt Asperger, Volker Sauerland, Dagmar Niemeyer, Rainer Paape, Anja Resemann, Markus Kayser, Matthias Koethe, Sergei Dikler, Jens Hoehndorf, and Juergen Srega from Bruker Daltonics (Bremen, Germany) for their input and valuable discussions. We also thank Robert Hughes from GSK, Stevenage, for his technical advice in setting up the Agilent Bravo Automated Liquid Handling Platform 384-well plate dilutions.
Declaration of Conflicting Interests
The authors declared no potential conflicts of interest with respect to the research, authorship, and/or publication of this article.
Funding
The authors received no funding for this work. All research was completed as work-for-hire for the employer GSK.
References
Supplementary Material
Please find the following supplemental material available below.
For Open Access articles published under a Creative Commons License, all supplemental material carries the same license as the article it is associated with.
For non-Open Access articles published, all supplemental material carries a non-exclusive license, and permission requests for re-use of supplemental material or any part of supplemental material shall be sent directly to the copyright owner as specified in the copyright notice associated with the article.