
Abstract
Monoclonal antibodies (mAbs) have become a central class of therapeutic agents in particular as antiproliferative compounds. Their often complex modes of action require sensitive assays during early, functional characterization. Current cell-based proliferation assays often detect metabolites that are indicative of metabolic activity but do not directly account for cell proliferation. Measuring DNA replication by incorporation of base analogues such as 5-bromo-2′-deoxyuridine (BrdU) fills this analytical gap but was previously restricted to bulk effect characterization in enzyme-linked immunosorbent assay formats. Here, we describe a cell-based assay format for the characterization of antiproliferative mAbs regarding potency and mode of action in a single experiment. The assay makes use of single cell–based high-content-analysis (HCA) for the reliable quantification of replicating cells and DNA content via 5-ethynyl-2′-deoxyuridine (EdU) and 4′,6-diamidino-2-phenylindole (DAPI), respectively, as sensitive measures of antiproliferative mAb activity. We used trastuzumab, an antiproliferative therapeutic antibody interfering with HER2 cell surface receptor-mediated growth signal transduction, and HER2-overexpressing cell lines BT474 and SKBR3 to demonstrate up to 10-fold signal-to-background (S/B) ratios for treated versus untreated cells and a shift in cell cycle profiles indicating antibody-induced cell cycle arrest. The assay is simple, cost-effective, and sensitive, providing a cell-based format for preclinical characterization of therapeutic mAbs.
Introduction
Biological drugs such as therapeutic antibodies are in the process of replacing chemical compounds as the major class of future medicines. Therapeutic antibodies are often characterized by complex modes of action, such as inhibition of cell proliferation, induction of apoptosis, and targeted immune recruitment. Moreover, antibody drug conjugates (ADCs) that combine chemotherapeutic cytotoxicity with antibody-mediated tumor specificity even increase the diversity of potential modes of action. 1 Thus, the functional characterization during early drug development requires sensitive cell-based high-throughput assays that address this complexity and measure multiple cellular parameters. 2 One of the major modes of action of therapeutic antibodies is based on inhibition of target cell growth by, for example, blocking growth signaling pathways in cancer cells. 3 For assessing the antiproliferative potency of such candidates, several methods have been described. 4 A simple approach to quantify the number of cells that survive treatment consists of automated cell counting. 5 However, a significant proportion of remaining cells is likely to have entered apoptosis or cell cycle arrest, leading to an overestimation of the proliferating cell population. A more precise approximation of proliferation can be achieved by detecting metabolic activity in viable cells and thus excluding apoptotic cells. Compounds such as 3-(4,5-dimethylthiazol-2-yl)-2,5-diphenyltetrazolium bromide (MTT) are converted to a colored product by NAD(P)H- dependent cellular oxidoreductases, providing a quantifiable measure for metabolic activity. 6 An alternative approach to assess viability is the detection of intracellular adenosine triphosphate (ATP), which is maintained only at high levels in metabolically active cells and declines rapidly upon cell death or apoptosis. The release of intracellular ATP and its detection via ATP-dependent luciferase activity is widely used in proliferation assays. 7
However, cells that have undergone cell cycle arrest are still metabolically active and consequently not distinguishable from proliferating cells by above-described assays. A major characteristic of proliferating cells is the replication of DNA during S phase. Thus, the incorporation of nucleotide analogues such as 5-bromo-2′-deoxyuridine (BrdU) into chromosomal DNA during replication allows for the distinction between proliferating and arrested cells. BrdU can be detected by antibodies and thus may be implemented with highly sensitive enzyme-linked immunosorbent assay (ELISA)–based multiwell assays. 8 It has been shown that a wider separation between signals from treated and untreated samples (signal-to-background [S/B] ratio) can be achieved with BrdU incorporation compared with assays detecting metabolic activity. 9 5-Ethynyl-2′-deoxyuridine (EdU), an alternative nucleotide analogue, enables a simpler, milder, and more efficient detection via copper-catalyzed azide alkyne cycloaddition (CuAAC) of fluorescent dyes, such as 6-FAM–azide. The use of EdU coupled to fluorescent dyes simplifies the assay procedure and in addition improves compatibility with other nuclear stains such as 4′,6-diamidino-2-phenylindole (DAPI), thus representing the method of choice for sensitive microscopy-based detection of proliferation.
Accurate distinction between proliferating and nonproliferating cells improves the sensitivity of an antiproliferative potency assay ( Fig. 1 ). Changing the mode of signal detection, on one hand, can further improve sensitivity but also provide additional information about the antiproliferative effect. Plate reader–based readouts are commonly used in screening experiments to validate lead candidates and produce statistically relevant data. Commonly used colorimetric multiwell proliferation assays are restricted to single-course parameters such as mean metabolic activity per well. To better understand the mode of action underlying an antiproliferative effect, cellular or subcellular information on signal localization and intensity may prove useful, which is usually not accessible with plate reader systems. Fluorescence microscopy is the method of choice to gain information about single cells with a variety of microscopic high-content screening (HCS) platforms developed in recent years that allow for automated image acquisition and analysis in a high-throughput manner. 10
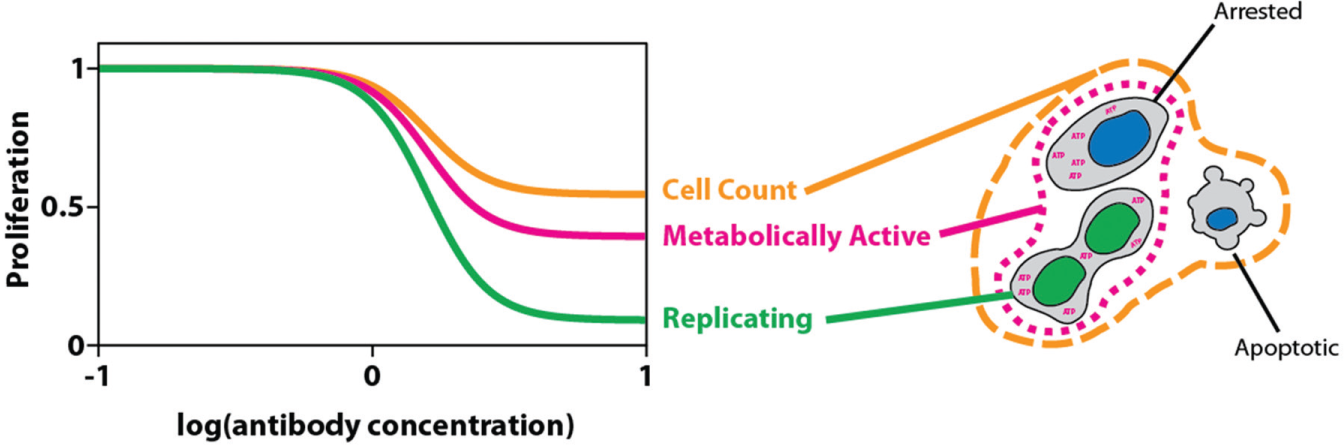
Addressing proliferation at different layers. Antiproliferative antibodies interfere with a cell’s ability to replicate. Directly, detecting replicating cells (green) allows for the largest separation between maximal and minimal number of affected cells. Indirectly, restrained DNA replication also reduces the amount of metabolically active cells and the total number of cells remaining after treatment. However, the detection of metabolically active cells (magenta) includes arrested cells, resulting in an overestimation of proliferating cells. This effect is even more drastic when further generalizing the detection to all remaining cells (orange), which also includes apoptotic cells.
In the present study, we describe a simple and sensitive microscopic high-content assay for the quantification and characterization of the antiproliferative potency of therapeutic antibodies. The quantification of replicating cells, via EdU incorporation, as a measure for proliferation allows for most sensitive distinction between proliferating and nonproliferating cells. In addition to quantifying the antiproliferative potency of a monoclonal antibody (mAb), the mode of action can be investigated in the course of the same experiment. For example, potential induction of cell cycle arrest can be studied by cell cycle profiling based on nuclear DNA content quantification.
Materials and Methods
Cell Lines and Cell Culture
Antibodies were produced in FreeStyle HEK 293-F cells (Thermo Fisher Scientific, Waltham, MA, USA) cultured in FreeStyle 293 Expression Medium and maintained at cell densities from 3 × 10⁵ to 3 × 10⁶ cells/mL in a shaker flask at 37 °C, 5% CO2, shaking at 120 rpm.
HER2 overexpression cell lines BT474 (ATCC HTB20) and SKBR3 (ATCC HTB30) and a control cell line with neglectable HER2 expression levels (1000-fold less than SKBR3), MDA-MB-468 (ATCC HTB-132), were cultured in Dulbecco’s modified Eagle’s medium (DMEM)/F12 + Gibco Glutamax-I (Thermo Fisher Scientific, Waltham, MA, USA) supplemented with 10% fetal calf serum (FCS) at 37 °C, 5% CO2.
Protein Expression and Purification
Trastuzumab was expressed in FreeStyle HEK 293-F cells as described previously from the pVITRO1-trastuzumab-IgG1/κ vector (Addgene plasmid 61883; Addgene, Cambridge, MA, USA). 11
Antibody purification from cleared and sterile filtered cell culture supernatants was performed with an Äkta purifier system equipped with a 1-mL HiTrap Protein A HP column (GE Healthcare, Piscataway, NJ). The system was operated with a constant flow rate of 1 mL/min. After sample application, the column was washed with 10 column volumes (CVs) of wash buffer (20 mM phosphate buffer, 150 mM NaCl, pH 7.3). Bound antibody was eluted with a one-step pH decrease to 3.0 (10 mM Na-citrate buffer, pH 3.0). Eluted fractions of size 0.2 mL or 0.5 mL were collected followed by immediate neutralization of the pH with one-third volume 1 M Tris HCl, pH 8.0. Peak fractions were pooled and concentrated using an Amicon Ultra 4-mL Centrifugal Filter NMWL 10 kDa (Merck Millipore, Billerica, MA, USA) and stored at 4 °C or snap frozen in liquid nitrogen and transferred to −80 °C for long-term storage.
Antibody Treatment, EdU Incorporation, and Nuclear Staining
In total, 1 × 10⁴ cells were seeded in each well of a 96-well optical cell culture plate supplemented with 100 µL culture media. To ensure proper attachment, cells were incubated for 4 h prior to addition of antibody. The 1:3 serial dilutions of trastuzumab in culture media were performed at threefold the desired final concentration, ranging from 50 nM to 0 nM. Then, 50 µL of each dilution was added in triplicates to individual wells. Cells were incubated with antibody for 4 days followed by the addition of EdU to a final concentration of 10 µM. To guarantee labeling of all proliferating cells, EdU treatment was done for 20 h followed by fixation of cells in phosphate-buffered saline (PBS) + 4% paraformaldehyde (PFA), permeabilization in PBS + 0.5% Triton X-100, and blocking of the well surface with PBT (PBS, 2% BSA, and 0.02% Tween 20). EdU was labeled via CuAAC by the addition of 30 µL of staining reagent (4 mM CuSO4, 20 µM 6-FAM–azide, 50 µM Na-ascorbate in 100 mM Tris/HCl, pH 7.0) per well and incubated for 30 min at room temperature. Remaining unconjugated dye was removed by washing three times with 100 µL PBST (PBS + 0.02% Tween 20). Then, 100 ng/mL DAPI in PBST was added for 10 min at room temperature to counterstain nuclear DNA, followed by three washing steps with PBST and one additional wash with ddH2O.
Image Acquisition and Data Analysis
Images were acquired with an Operetta High-Content Imaging system (PerkinElmer, Waltham, MA, USA) equipped with a 40× high NA objective. The 380/40-nm excitation and 410- to 480-nm emission filters were used to image DAPI, and the 475/30-nm excitation and 500- to 550-nm emission filters were used to image 6-FAM–EdU.
DAPI images were used to segment and count the total number of nuclei for each well, representing the total cell count. Each antibody concentration was tested in technical triplicates. Total cell counts of triplicates were averaged and normalized to the cell count of an untreated control (c(trastuzumab) = 0). Averaged and normalized cell counts were plotted against log10-transformed antibody concentrations. Fitting a nonlinear four-parametric model equation
Relative nucleic DNA quantities were obtained by calculating total DAPI intensities of segmented nuclei. Absolute DAPI intensities per nucleus were subgrouped by binning and plotted as a probability histogram to analyze probability distributions. A 10-parameter model function
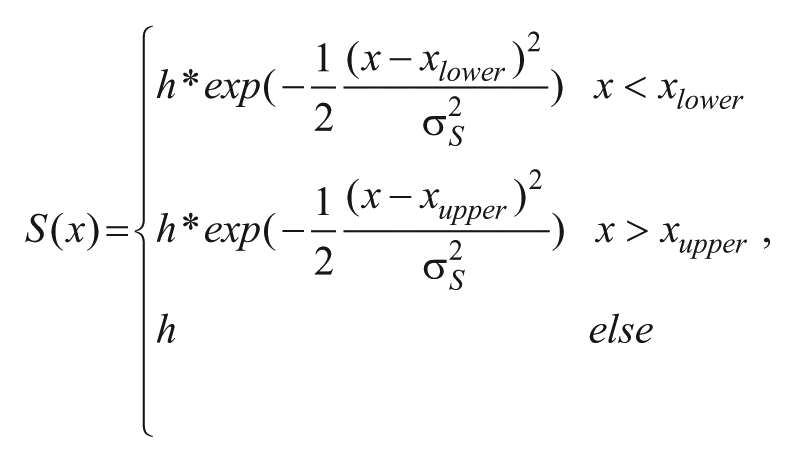
modeling S phase, were fitted to the DAPI intensity probability densities px and histogram bin centers x to model the DNA content distribution throughout the cell cycle. The function was fitted by globally minimizing the squared error via simulated annealing using the GenSA package in R. By integrating over the respective term of the derived fit equation representing the G1, S, or G2/M phase, the relative proportion of each phase of the whole cell population was calculated—for example,

Based on 6-FAM–EdU signal, nuclei were classified as proliferating or nonproliferating. Data averaging, normalization, and curve fitting were done in a similar manner as described above for total cell counts.
All image processing was performed with the Harmony software (PerkinElmer); data analysis and curve fitting were done in MATLAB and R (2016, https://www.R-project.org). The R script used for the estimation of cell cycle distributions from DAPI intensity distributions is available at https://github.com/hoerldavid/CellCycleFit.
Results and Discussion
In the field of biologics, therapeutic antibodies have emerged as an especially promising drug format over the past years. 2 A role model for this class of drugs is trastuzumab, which binds the extracellular domain of the HER2 cell surface receptor. In a subset of breast cancers, the growth factor receptor HER2 is overexpressed and mediates increased proliferation. 12 Trastuzumab counteracts this accelerated growth by reducing HER2-mediated signaling and therefore acting as an antiproliferative drug on HER2-overexpressing cells. 13 To assess the antiproliferative potency of a therapeutic antibody, cells are subjected to a range of antibody concentrations. Higher antibody concentrations are expected to lead to lower numbers of viable cells and an even more pronounced decrease in proliferating cells ( Fig. 1 ).
In the described assay, HER2-overexpressing cells (BT474 and SKBR3) and control cells (MDA-MB-468) were supplemented with EdU after 4 days of trastuzumab treatment. The proliferating fraction of the cell population incorporates EdU molecules into newly synthesized DNA during S phase. Surviving cells are stained with DAPI, whereas the incorporated EdU is labeled by CuAAC-mediated coupling of the fluorescent dye 6-FAM–azide. Imaging of stained cells on an Operetta system facilitates the detection and segmentation of nuclei, DNA content analysis using the DAPI signal, and definition of the proliferation status according to the EdU signal. Testing multiple antibodies over a range of concentrations is conveniently done in a multiwell tissue culture plate, which is compatible with the Operetta HCS imaging system. With this setup, an inhibition curve with 10 data points as technical triplicates can easily be generated for two individual antibodies in a 96-well format. Quantification of counted nuclei and detected proliferating cells can readily be done with the built-in software package of the Operetta system (Harmony), whereas statistical analysis and curve fitting are conveniently handled with respective MATLAB toolboxes. Besides the quantification of total cell counts and proliferating cells, the relative intensities of the DAPI and/or EdU signal per nucleus provide additional information with regard to cell cycle phase distributions.
Cell Survival and Cell Cycle Progression
Treatment of HER2-overexpressing cell lines with trastuzumab leads to a reduction in cell growth, but BT474 cells have been reported to be more susceptible than SKBR3 cells. 14 After 4 days of treatment, fluorescence microscopy of DAPI-stained nuclei indicates a clear reduction in cells with increasing concentrations of trastuzumab for BT474 ( Fig. 2A ) as well as SKBR3 cells. Next, we performed high-content image analysis by nuclei segmentation and subsequent quantification of surviving cells as a function of antibody concentration. By fitting a four-parametric nonlinear model to the obtained data points, we calculated inhibition curves. These fits revealed a decrease in total cell number with increasing antibody concentration and S/B ratios lower than 3 for BT474 ( Fig. 2B ) and SKBR3 ( Fig. 2C ). The maximal induction of cell death is 64% with a concentration of half maximal inhibition (IC50) of 1.8 nM for BT474 cells and 65% with an IC50 value of 1.9 nM for SKBR3 cells. The low S/B values can be explained by the specific mode of action mediated by trastuzumab, decelerating cell proliferation rather than actively promoting cell death. 14 Therefore, cells that have already passed G1 phase will further progress in cell cycle. With BT474 and SKBR3 cells exhibiting long doubling times (2–3 days), S/B ratios greater than 4 (two doublings) are not to be expected in the time course of the assay, which holds also true for other assays merely detecting survival or viability. 9 Moreover, a very low Hill slope could be observed for SKBR3 cells compared with BT474, which is linked to the lower susceptibility of SKBR3 to trastuzumab.9,14 Consistently, an unsusceptible cell line (MDA-MB-468) showed no difference in the number of viable cells between treated and untreated conditions ( Fig. 2B , C ). These results indicate that exclusively measuring cell survival is limiting the S/B ratio of proliferation assays, since arrested cells, which are still metabolically active, cannot be distinguished from proliferating cells.
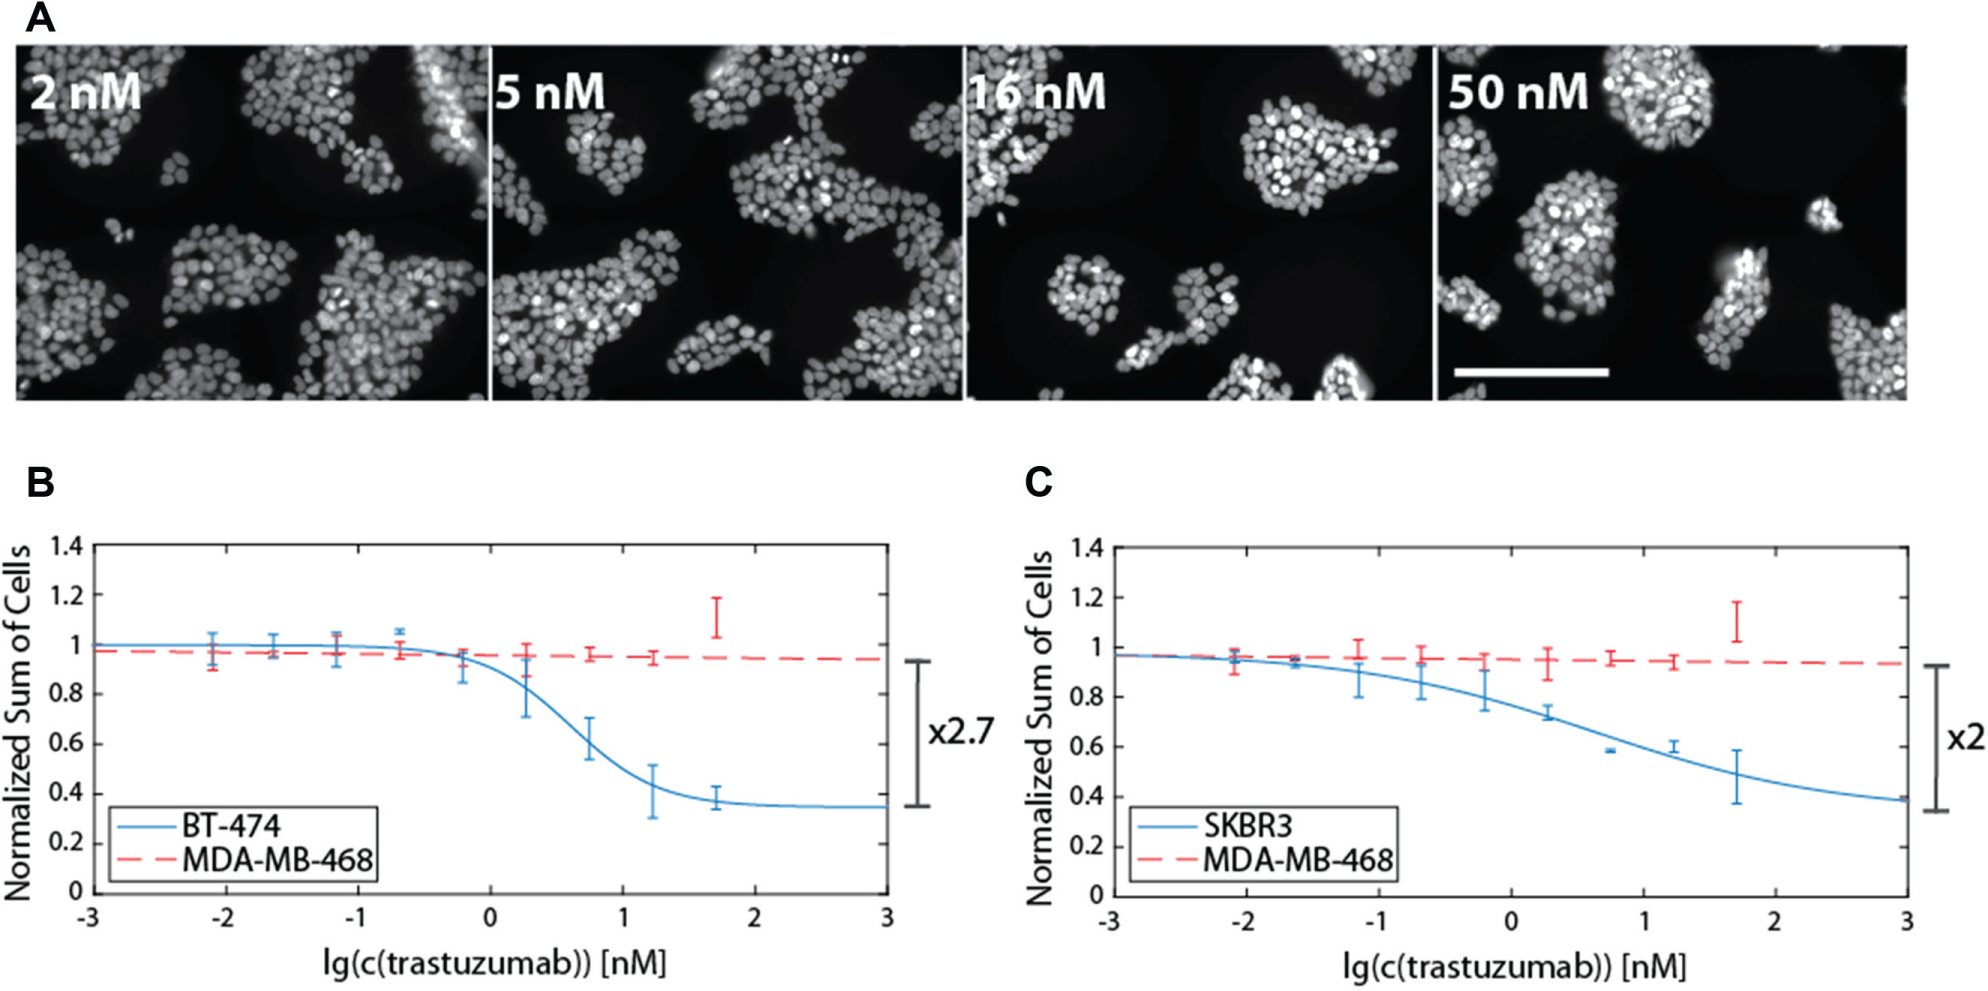
Quantification of antiproliferative potency by counting nuclei of surviving cells. 4′,6-Diamidino-2-phenylindole (DAPI)–stained nuclei were imaged with an Operetta high-content screening (HCS) system. Representative images of BT474 cells for four different antibody concentrations are shown in (
High-content image analysis of DAPI-stained nuclei allows not only segmentation and quantification of nuclei but also the measurement of relative nuclear DNA contents. Since the amount of chromosomal DNA doubles through S phase from G1 to G2 phase, the absolute DAPI signal per nucleus can be used to analyze changes in cell cycle distributions. In this line, we generated frequency histograms of the absolute DAPI intensity per nucleus (
Fig. 3A
and
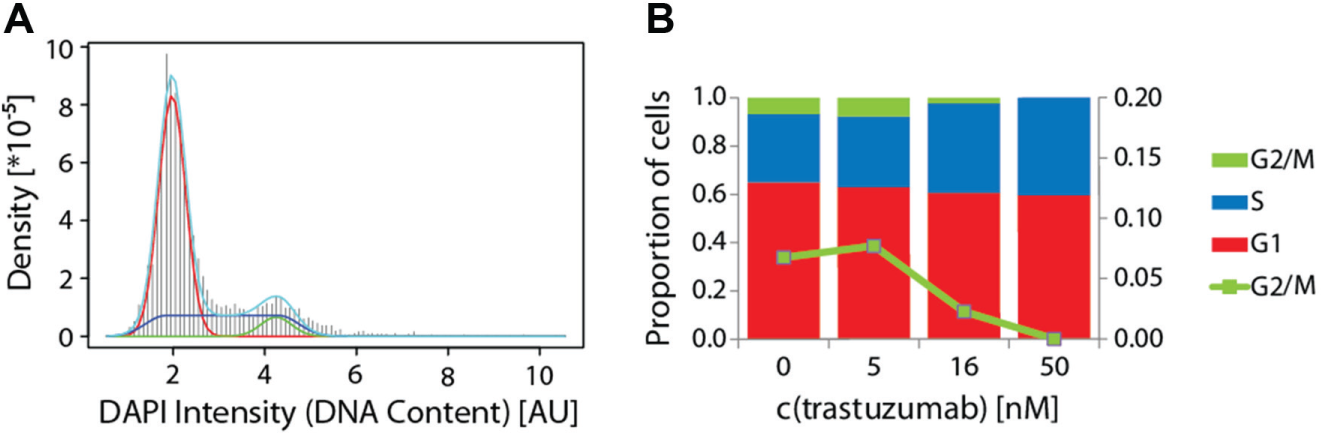
Shift in cell cycle distribution of trastuzumab-treated SKBR3 cells. Nuclear 4′,6-diamidino-2-phenylindole (DAPI) intensities were analyzed to categorize cells into cell cycle phases according to their relative DNA content. Probability density histograms of DAPI intensities were used to fit a model equation to the observed distribution. An exemplary histogram for c(trastuzumab) = 16 nM is given in (
Cell cycle profiles are an additional readout of the described assay and provide supplementary information about the mode of action of an antiproliferative antibody. Investigation of potency and mode of action in a single experiment was facilitated by increasing resolution to the single-cell level combined with high-throughput sample and data handling implemented in HCS systems. Cell cycle analysis of the less susceptible SKBR3 cell line showed that we are able to analyze an antibody’s mode of action even if the overall antiproliferative effect is weak. Nevertheless, it is also desirable to detect this weak proliferation inhibition with greater resolution. To address this need, we chose EdU incorporation for sensitive detection of proliferating cells.
Increased Assay Sensitivity via Quantification of EdU Incorporating Cells
Since DNA replication is a major characteristic of proliferation, we decided to use EdU incorporation as a marker for proliferating cells. Labeling EdU with a fluorescent dye allowed the distinction between proliferating and nonproliferating cells by fluorescence microscopy. Automated quantification of EdU-positive cells increased the S/B ratio to 10 for treated versus untreated BT474 cells ( Fig. 4B ). A concentration of half maximal inhibition (IC50) of 4.9 nM was obtained from the fitted inhibition curve, whereas the maximal induction of proliferation inhibition was 90%. For SKBR3 cells, we observed a maximal induction of proliferation inhibition of 64% and IC50 of 3.9 nM. To ensure that the detected inhibition of proliferation was due to trastuzumab-mediated effects, we subjected a control cell line, MDA-MB-468, to the same treatment. As expected, we could not observe any difference in the proliferating fraction upon addition of trastuzumab ( Fig. 4B , C ). We could show that EdU incorporation-based detection of proliferating cells by microscopy greatly increases the S/B ratio compared with detecting surviving cells and improves the inhibition curve parameters such as Hill slope in the case of SKBR3 ( Fig. 4C ). A 10-fold change in proliferation has recently also been demonstrated with a DELFIA-BrdU–based assay. 9 However, the assay described in the present article uses the more sensitive and mild EdU staining method, provides the possibility for multiplexed readout of various parameters, and increases the assay resolution by the detection of single cells instead of averaging over a bulk population.
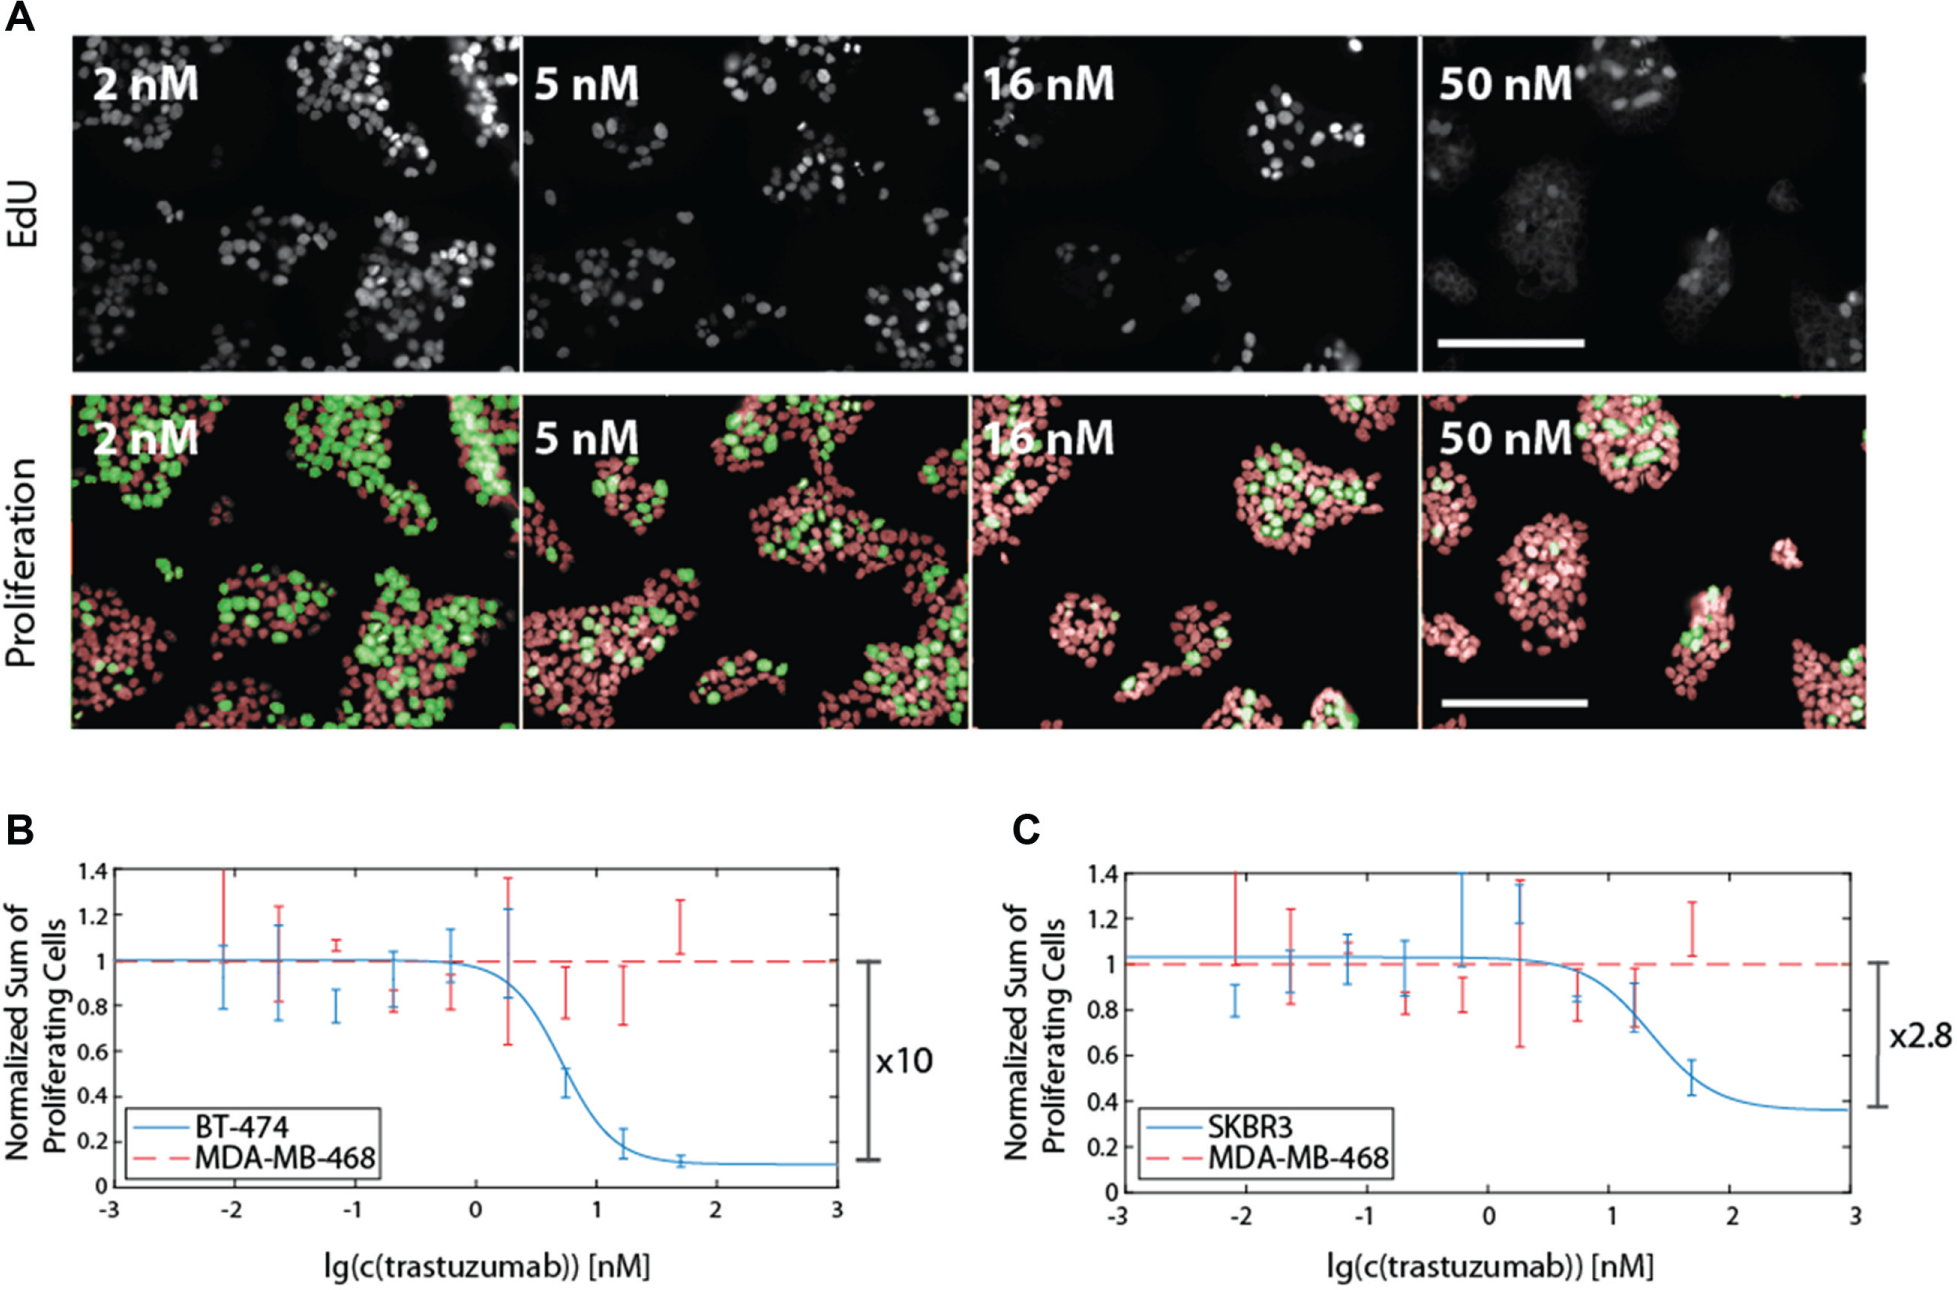
Improving assay sensitivity by detecting proliferating cells via 5-ethynyl-2′-deoxyuridine (EdU) incorporation. EdU, incorporated into chromosomal DNA during replication, was labeled by copper-catalyzed azide alkyne cycloaddition (CuAAC) with 6-FAM and imaged with an Operetta high-content screening (HCS) system. Representative images of BT474 cells are shown in (
In summary, we could show that EdU-based labeling of proliferating cells with subsequent automated imaging and analysis combined with DAPI-based cell cycle profiling is a simple and sensitive way for parallel investigation of antiproliferative potency and mode of action of therapeutic antibodies.
Footnotes
Acknowledgements
We thank Dr. Shane Miersch for providing cell lines and advice on assay setup.
Supplementary material is available online with this article.
Declaration of Conflicting Interests
The authors declared no potential conflicts of interest with respect to the research, authorship, and/or publication of this article.
Funding
The authors disclosed receipt of the following financial support for the research, authorship, and/or publication of this article: This work was supported by a grant from the Priority Program SPP1623 of the Deutsche Forschungsgemeinschaft by H. L. A. S. was trained and supported by the graduate school GRK1721 of the Deutsche Forschungsgemeinschaft as an associate member.
References
Supplementary Material
Please find the following supplemental material available below.
For Open Access articles published under a Creative Commons License, all supplemental material carries the same license as the article it is associated with.
For non-Open Access articles published, all supplemental material carries a non-exclusive license, and permission requests for re-use of supplemental material or any part of supplemental material shall be sent directly to the copyright owner as specified in the copyright notice associated with the article.