
Abstract
3D tissue cultures provide a more physiologically relevant context for the screening of compounds, compared with 2D cell cultures. Cells cultured in 3D hydrogels also show complex phenotypes, increasing the scope for phenotypic profiling. Here we describe a high-content screening platform that uses invasive human prostate cancer cells cultured in 3D in standard 384-well assay plates to study the activity of potential therapeutic small molecules and antibody biologics. Image analysis tools were developed to process 3D image data to measure over 800 phenotypic parameters. Multiparametric analysis was used to evaluate the effect of compounds on tissue morphology. We applied this screening platform to measure the activity and selectivity of inhibitors of the c-Met and epidermal growth factor (EGF) receptor (EGFR) tyrosine kinases in 3D cultured prostate carcinoma cells. c-Met and EGFR activity was quantified based on the phenotypic profiles induced by their respective ligands, hepatocyte growth factor and EGF. The screening method was applied to a novel collection of 80 putative inhibitors of c-Met and EGFR. Compounds were identified that induced phenotypic profiles indicative of selective inhibition of c-Met, EGFR, or bispecific inhibition of both targets. In conclusion, we describe a fully scalable high-content screening platform that uses phenotypic profiling to discriminate selective and nonselective (off-target) inhibitors in a physiologically relevant 3D cell culture setting.
Introduction
While offering many practical advantages for cell-based screening, cells grown on tissue culture plastic lack normal cell-cell and cell-matrix interactions, resulting in deregulated growth, dedifferentiation, disruption of other processes, and a poor simulation of the in vivo (patho)physiology. 1 3D cell culture methods have been developed that enable a more in vivo like tissue architecture and are therefore expected to represent a more physiologically relevant context for the evaluation of bioactive molecules.2–4 Although gaining in popularity for small-scale analyses, 3D cultures have yet to be widely adopted for screening. A number of factors account for this, although high-throughput 3D imaging and the analysis of large and complex image data sets can represent the most significant barrier to the implementation of high-content 3D culture-based screening. 5 As a result, where 3D assays are used for screening, the most common end-point measurements tend to be biochemical determinations of cell viability, with the loss of potentially valuable phenotypic information.
Cells cultured in extracellular matrix (ECM)–containing hydrogels can generate complex multicellular tissues, supporting a higher level of tissue organization, such as formation of ductal structures by epithelial cells and complex networks of invasive tumor cells.6–10 These features may be relevant to the pathology of the disease being studied and offer a context for screening for therapeutic molecules. Complex phenotypes can also be exploited for compound profiling, allowing compounds that affect different targets and therefore induce different phenotypes to be discriminated, potentially providing additional information on the biological effects of compounds that cannot be obtained from single end-point measurements.
In many cultured cells, activation of receptor tyrosine kinases results in increased proliferation and motility. 11 Cell motility has previously been used as a readout for high-throughput small-molecule and small interfering RNA (siRNA) screens for inhibitors of c-Met signaling.12–14 In 3D culture, activation of c-Met can result in invasion of tumor cells into the surrounding microenvironment, 15 a process that closely resembles the in vivo pathophysiology. Similarly, activation of the epidermal growth factor (EGF) receptor is known to induce epithelial- to mesenchymal transition (EMT) and invasion in various cancer types.16,17 As expected, selective inhibition of the receptor tyrosine kinases inhibits the ligand-induced effects. However, compounds that inhibit multiple targets or are toxic may also inhibit ligand-induced effects. Here, we describe a 384-well screening assay that uses automated high-content analysis and profiling of 3D cultures of invasive prostate cancer tumor cells to identify selective inhibitors of the c-Met and EGF receptor (EGFR) tyrosine kinases.
Materials and Methods
Cell Lines
The human prostate adenocarcinoma cell line PC-3 was cultured in Dulbecco’s modified Eagle’s medium (DMEM)–F12 (Ham’s) growth medium (Gibco Fisher Scientific, Landsmeer, Netherlands), supplemented with 10% fetal bovine serum (FBS) (Gibco Fisher Scientific), 1 mM sodium pyruvate (Gibco Fisher Scientific), 1.5 g/L NaHCO3 (Merck, Schiphol-Rijk, Netherlands), 0.1 mM nonessential amino acids (Gibco Fisher Scientific), and 50 µg/mL gentamycin (Sigma Aldrich, Zwijndrecht, Netherlands). PC-3 cells were grown in 175-cm2 tissue culture flasks (Corning, Amsterdam, Netherlands) in culture medium as described above. Before reaching maximal density, cells were washed with 1× phosphate-buffered saline (PBS) (Sigma Aldrich) and trypsinized with 1× Trypsin (Gibco Fisher Scientific). Subsequently, medium was added and cells were pelleted by centrifugation and resuspended in FBS with 10% DMSO (Biosolve B.V., Valkenswaard, Netherlands) and stored in aliquots at −150 °C.
3D Invasion Assay
PC-3 cells were cultured in 384-well plates (Greiner Bio-One B.V., Alphen aan den Rijn, Netherlands) in 60% v/v growth factor–reduced Matrigel (>9 mg/mL) (Corning), which supported spheroid formation of the highly transformed PC-3 cells and invasion upon addition of motogenic cytokines. To generate gels, thawed cells were mixed with culture medium and growth factor–reduced Matrigel. Then, 14.5 µL of cell-gel mix was added to each well of a 384-well plate using a CyBi Selma 96/60 robotic liquid handler (Analytik Jena AG, Jena, Germany), at a final cell density of 2000 cells per well. After polymerization at 37 °C for 30 min, DMEM-F12 (Ham’s) growth medium containing growth factors (hepatocyte growth factor [HGF] or EGF) and compounds were added to the gel. The plate(s) were subsequently covered with a gas-permeable adhesive membrane (Thermo Scientific, Zwijndrecht, Netherlands). Compound exposures were performed for 96 h, after which gels were fixed with 3% formaldehyde (Sigma Aldrich), permeabilized with 0.2% Triton-X100 (Sigma Aldrich), and stained with 0.25 µM rhodamine-phalloidin (Sigma Aldrich) and 0.1% Hoechst 33258 (Sigma Aldrich) in PBS at 4 °C for 16 h. After staining, plates were washed in PBS and covered with a Greiner SilverSeal (Greiner Bio-One B.V., Alphen aan den Rijn, Netherlands).
Compounds
Anti c-Met and nontargeting control Fab antibodies were generously provided by Merus Biopharmaceuticals B.V. (Utrecht, Netherlands). c-Met inhibitor ArQ-197 (Tivantinib) was synthesized by Janssen Pharmaceutica NV (Beerse, Belgium), following the synthesis method published from ArQule, and subsequently sent to the authors as a gift from Souichi Ogata (Janssen Oncology R&D). Results were confirmed using a second source of ArQ-197 (SelleckChem/Bio-Connect B.V. Huissen, Huissen, Netherlands). EGFR inhibitor AG1478 was obtained from Santa Cruz (SC-200613; Bio-Connect B.V. Huissen). PHA-665752 was a gift from Pfizer, Inc. (La Jolla, CA, USA). A collection of 80 compounds selected to inhibit both EGFR and/or c-Met was generated by Vichem Chemie (Budapest, Hungary) (
Imaging
A BD Pathway 855 automated inverted fluorescence microscope (BD Biosciences, Breda, Netherlands) was used for automated imaging of 384-well plates (wide-field epifluorescence). This microscope was used to image both Hoechst 33258 and rhodamine-phalloidin staining, using a 4× Olympus objective, at focal planes spaced at intervals of 50 µm throughout the gel using Attovision software (BD Biosciences, Breda, Netherlands) accompanying the microscope. The gel was imaged through its entire depth (z-axis), requiring 25 images per well. Each image captured approximately 75% of the area of the well.
Data Analysis
Ominer image analysis software (OcellO, Leiden, Netherlands) and KNIME (https://www.knime.org) were used to extract in-focus information from the Z-stacks generated by the BD Pathway 855 (BD Biosciences) for both Hoechst 33258 (nuclei) and rhodamine-phalloidin (F-actin) using maximum-intensity projections. 18 For image processing, a monochrome mask was created for both channels to define the regions of interest (ROIs). The in-focus images were used to quantify staining intensities and a set of Hu moments and Gabor wavelet-based features describing image intensity and texture. The Hoechst 33258–derived monochrome mask was used to determine number and area of nuclei and tumoroids. In addition, a detailed set of parameters was calculated to describe the shape of the rhodamine-phalloidin (F-actin) stained objects. 18 First, for principal components analysis, data were Z score normalized to the negative control treatment median to account for plate-to-plate differences. The features derived from the image analysis and quantification steps were ranked based on their ability to distinguish positive and negative controls (Z′), and the features that showed greatest separation between control groups were retained (Z′ > –1.0). The median of treatment quadruplicates was used for a principal component analysis (PCA) that combined correlated features into (uncorrelated) principal components. This model was applied to all wells and summarized ~95% of all variation into principal components. The distance between treatment and control groups was quantified as a Z score in principal component 0 (PC0), which retained 60% of the variation of the data set. 2D density estimations and linear discriminant analysis (LDA) were performed using the MASS package (http://www.stats.ox.ac.uk/pub/MASS4/) 19 for R-Studio 0.99.878 (https://www.rstudio.com/products/rstudio2/) with R 3.2.3 (https://www.r-project.org/). PCA was calculated in KNIME, and principal component plots were generated using ggplot2 (http://ggplot2.org/) 20 with the scatterplot3D package for R-Studio 0.99878 (https://cran.r-project.org/web/packages/scatterplot3d/index.html). 21 Other charts were generated using GraphPad Prism 6 software (GraphPad Software, La Jolla, CA). Results are displayed as mean ± standard deviation unless otherwise stated.
Western Blot Detection of Receptor Activation
Phosphorylation status of c-Met and EGFR in response to 20 ng/mL HGF or 20 ng/mL EGF was evaluated by Western blot. Briefly, 105 PC-3 cells were grown per well in 12-well plates. After 24 h, growth medium was replaced with starvation medium (without serum and antibiotics) containing test compounds. After 24 h of compound exposure, growth factors (20 ng/mL HGF/EGF) were added for 10 min. Protein was isolated using RIPA lysis buffer (1% w/w deoxycholate, 50 mM Tris [pH 7.5], 0.15 M NaCl, 0.1% sodium dodecyl sulfate [SDS], 1% NP-40, 2 mM EDTA, 1% protease inhibitor cocktail [Sigma Aldrich]) and quantified using the standard bicinchoninic acid (BCA) method according to the manufacturer’s instructions (Thermo Scientific). Western blot analysis was performed according to a standard protocol using phospho-c-Met (Tyr1234/1235) antibody (3077P; Cell Signaling) diluted 1:1000 in 5% BSA in TBS-T or phospho-EGFR (Tyr1173) (4407; Cell Signaling Technology B.V., Leiden, Netherlands) 1:1000 in 5% BSA in Tris-Buffered Saline with 0.05% Tween-20 (TBS-T). Phospho-c-Met and phospho-EGFR antibodies were detected using horseradish peroxidase (HRP)–conjugated anti–rabbit IgG secondary antibody (111-035-003; JacksonImmunoResearch, Suffolk, UK) and ECL Plus reagent (RPN2132; GE Healthcare Life Sciences, Eindhoven, Netherlands). Detection of antibody was performed using a LAS4000 scanner (GE Healthcare Life Sciences). Tubulin loading control was detected using an anti-Tubulin antibody (T-9026; Sigma-Aldrich) diluted 1:1000 in 5% BSA in TBS-T and an anti-mouse Alexa 647–linked IgG (115-605-006; JacksonImmunoResearch). The Alexa 647 signal was detected directly using the LAS4000.
In Vitro Kinase Activity Measurement
EGFR enzyme activity was assayed in 384 microtiter plates (Corning 3676) at three compound concentrations, in a total volume of 10 µL by the Transcreener ADP2 FP method (BellBrook Labs, Madison, WI). Assay buffer contained 20 mM HEPES (pH 7.5), 1 mM dithiothreitol (DTT), 10 mM MgCl2, 2 mM MnCl2, and 0.01% v/v NP40. The final EGFR concentration was 7 nM. Poly Glu-Tyr (4:1)/poly Glu-Tyr (4:1) was used as substrate at a final concentration of 0.01 mg/mL. The final adenosine triphosphate (ATP) concentration was at 7.52 µM. The enzyme reaction was incubated for 60 min and stopped by addition of 10 µL adenosine diphosphate (ADP) detection mixture (1×). Measurements were performed on a Tecan (Männedorf, Switzerland). Infinite M1000Pro reader. c-Met enzyme activity was assayed in 384 microtiter plates (Corning 3676) at three compound concentrations, in a total volume of 10 µL by the Transcreener ADP2 FP method (BellBrook Labs). Assay buffer contained 20 mM HEPES (pH 7.5), 1 mM DTT, 3 mM MgCl2, 3 mM MnCl2, and 0.01% v/v Tween-20. The final c-Met concentration was 8 nM. Poly Ala-Glu-Lys-Tyr (6:2:5:1) was used as substrate at a final concentration of 0.25 mg/mL. The final ATP concentration was at 9.6 µM. The enzyme reaction was incubated for 60 min and stopped by addition of 10 µL ADP detection mixture (1×). Measurements were performed using a Tecan Infinite M1000Pro reader.
Results
Quantification of Complex Phenotypic Changes of Prostate Cancer Cells Cultured in 3D in 384-Well Microplates
We developed a 3D cell culture screening method for tumor cell invasion driven by c-Met and EGFR. PC-3 cells were cultured in ECM protein-rich hydrogels in 384-well plates in the presence or absence of c-Met/EGFR agonists and antagonists. After fixation and staining with rhodamine-phalloidin to reveal the structure of prostate cancer tumoroids and Hoechst 33258 to label nuclei, gels were imaged in two fluorescence channels using a BD Pathway 855 (BD Biosciences), collecting paired stacks of xy images throughout the z-plane for each well. In-focus information from each image was extracted and a single xy image projection was generated (
In the absence of added c-Met or EGFR agonists, PC-3 cells developed into spheroids over a period of 4 days ( Fig. 1A , upper panel). Treatment with the c-Met ligand (HGF) or the EGFR ligand (EGF) induced a highly invasive phenotype ( Fig. 1A , middle and lower panels). To quantify these phenotypic changes in detail, Ominer and KNIME software were used to identify and quantify different morphological features from the 2D projections of the cytoskeleton and nuclei-derived image stacks. To do this, a collection of different image analysis algorithms was applied to derive measurements of the shape and fluorescence intensity of individual tumoroids, wavelets, and Hu and Zernike moments as previously described. 22 Supervised PCA was used to reduce measurements from approximately 800 phenotypic parameters to principal components (PCs). EGF-treated and untreated PC-3 cells were used to train a profile to represent active and inactive EGFR inhibitors, respectively, which was subsequently scaled to percent stimulation. Similarly, a separate supervised analysis was performed that was trained with HGF-treated and untreated cells to separate phenotypes representing active c-Met from unstimulated control phenotypes. The primary principal component (PC0) was plotted for both EGF- and HGF-induced phenotypic changes to visualize the responses ( Fig. 1B ). Both HGF- and EGF-induced phenotypes of PC-3–derived tumoroids could be clearly discriminated from untreated tissues. Many of the phenotypic features separating HGF- and EGF- induced changes in phenotype from unstimulated controls describe shape, circularity, and intensity. The distance in phenotypic space along PC0 to the unstimulated controls was presented graphically as a function of EGF or HGF concentration ( Fig. 1C ).
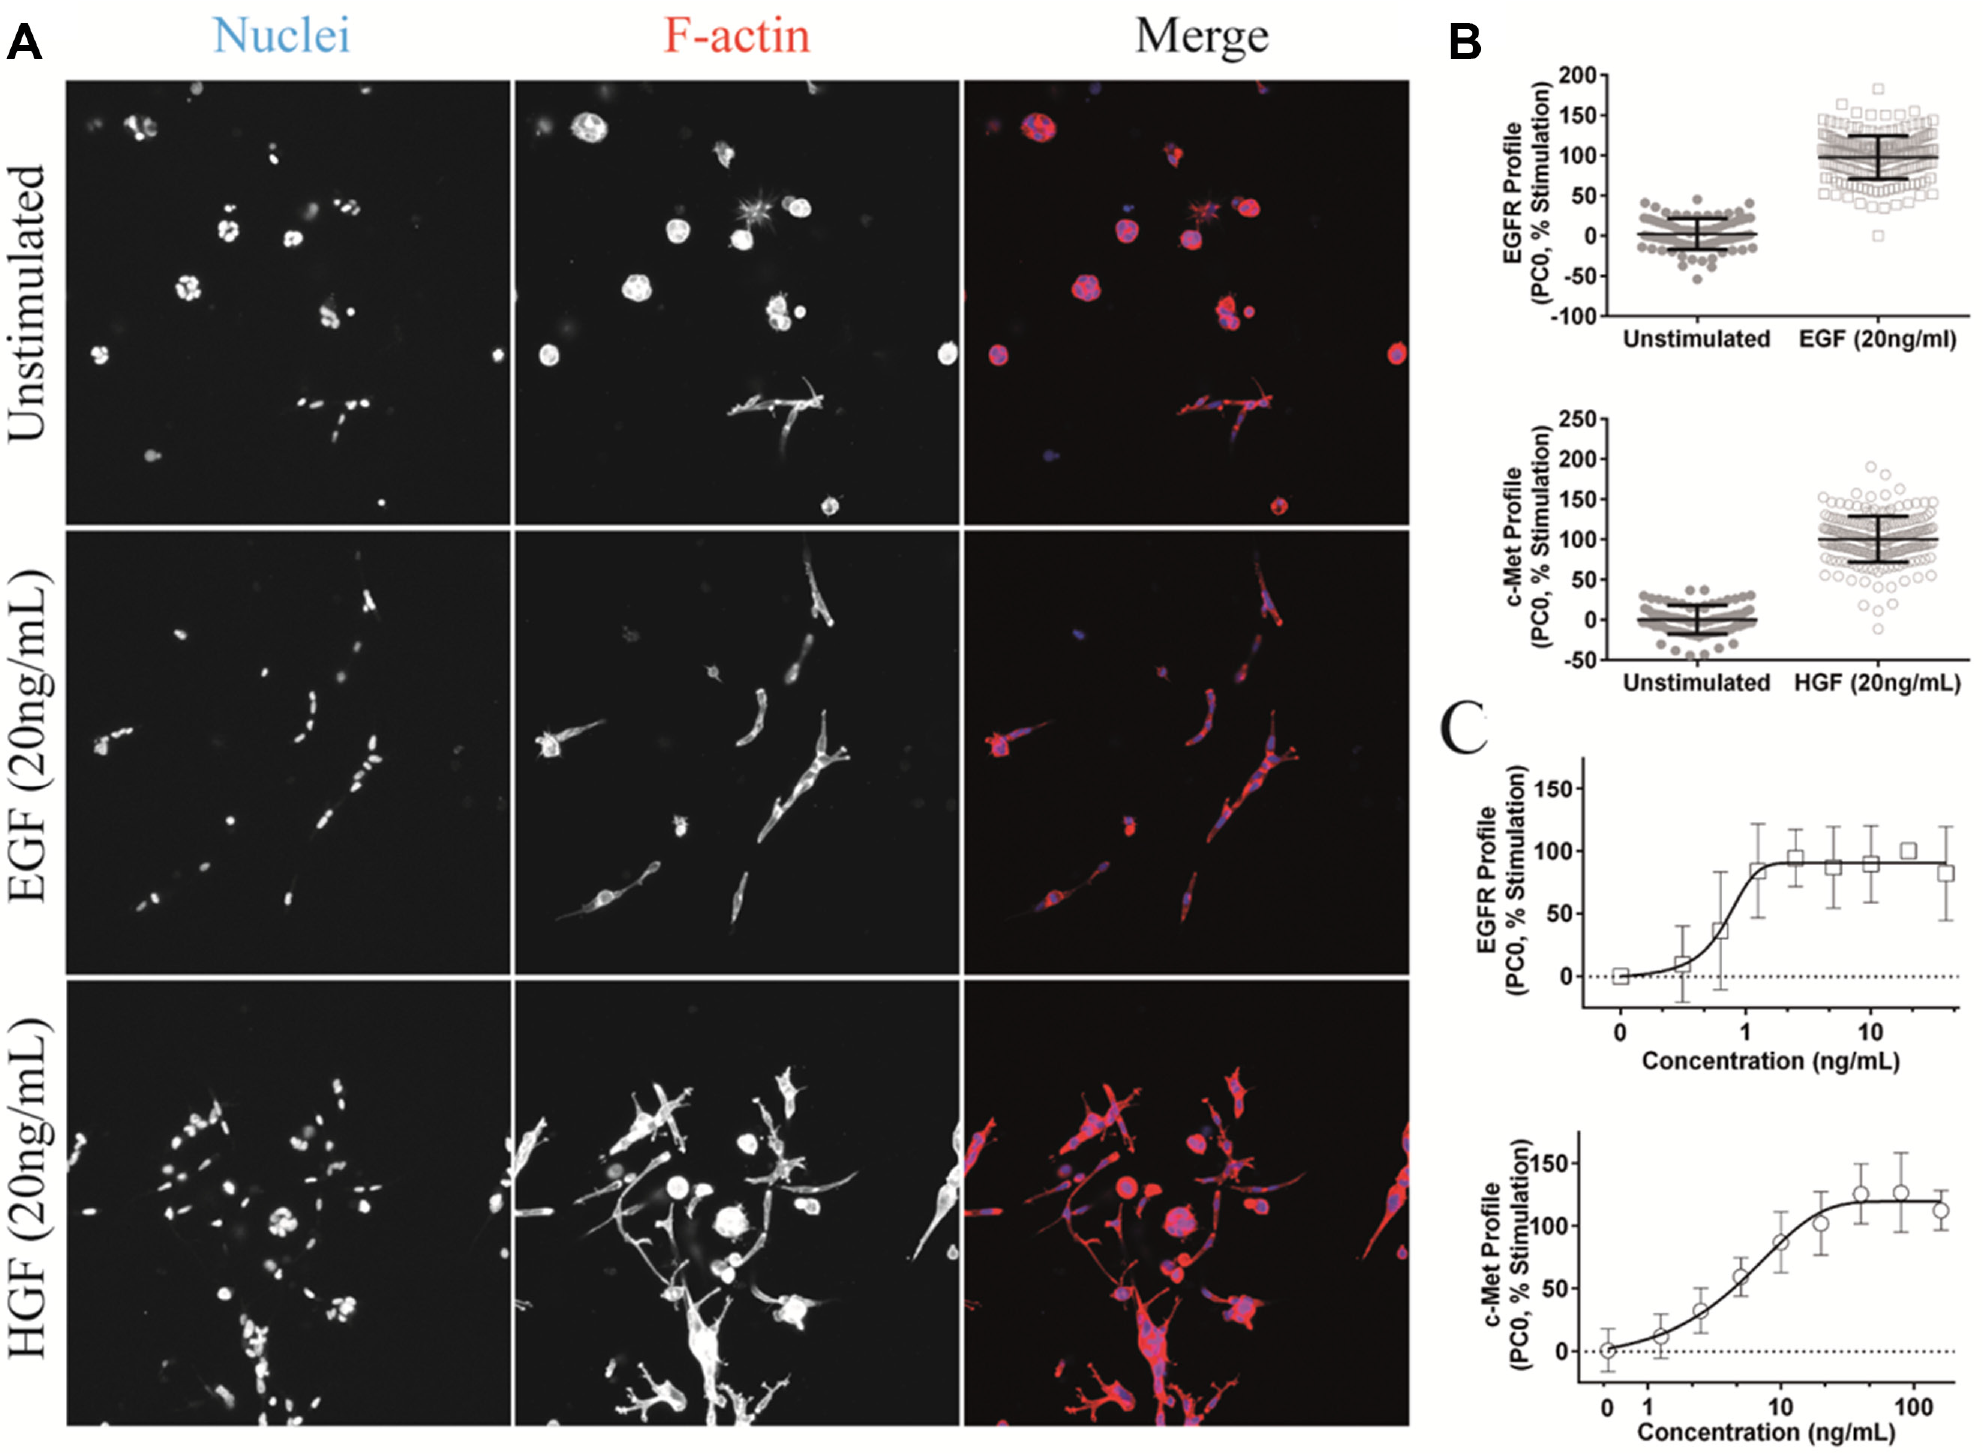
Receptor activation induces a quantifiable change in phenotype. (
Phenotypic Profiling Can Be Used to Quantify c-Met Activation and Inactivation
To test whether HGF-induced phenotypes could report c-Met activation, HGF was added in the presence of the c-Met function blocking Fab antibody, Genentech 5D5 Fab (Genentech, South San Francisco, CA). 5D5 antibody effectively inhibited the HGF-induced response (PC0, Fig. 2A ), resulting in phenotypes that projected in a similar location to unstimulated controls in phenotypic space (represented by three principal components), with an inhibition that was dose dependent ( Fig. 2A , B ). The c-Met inhibitory antibody had no quantifiable effect on the PC-3 phenotype in the absence of HGF ( Fig. 2A ). In contrast, treatment of PC-3 cells with a c-Met activating antibody, the bivalent IgG form of 5D5, which crosslinks c-Met, induced a phenotype that was indistinguishable from that induced by HGF. Together these results confirm the c-Met dependency of the HGF-induced phenotype and demonstrate that principal components can be used to quantify HGF-induced phenotypic changes correlating with c-Met activation and inhibition.
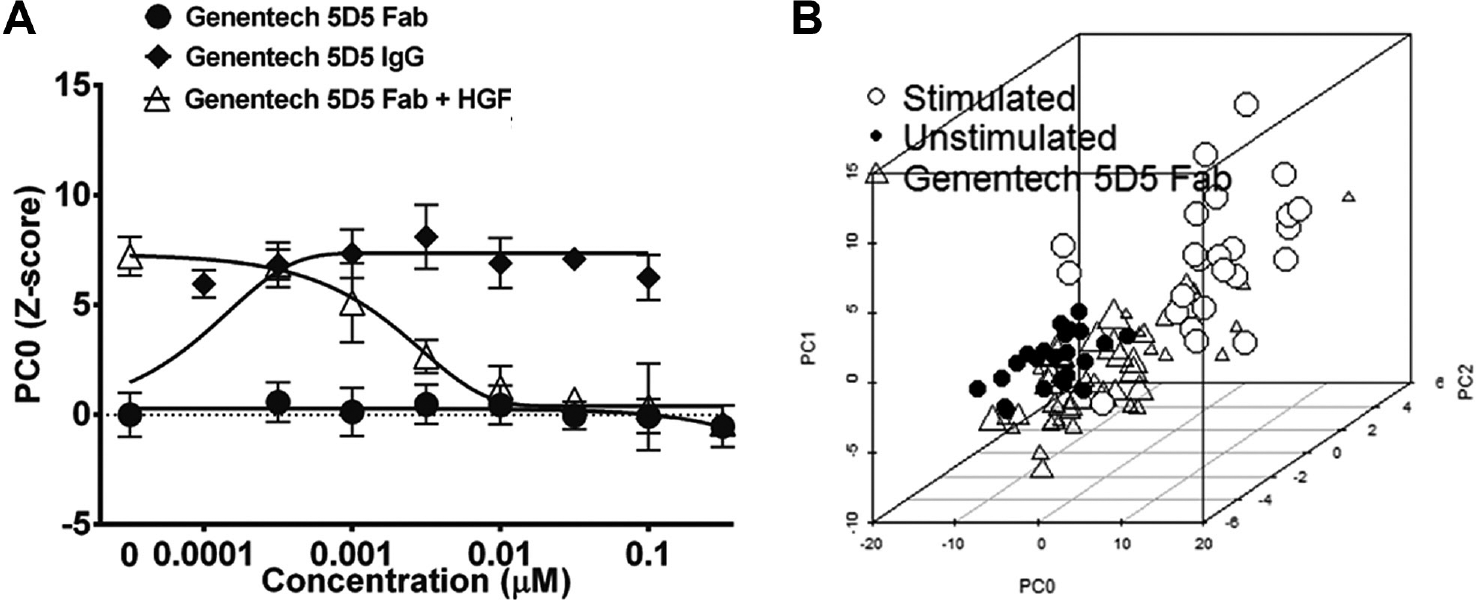
c-Met–dependent phenotypic changes. (
Using Phenotype to Discriminate Compounds Based on Target Selectivity
To determine whether the phenotypic assay can discriminate between selective c-Met and EGF inhibitors, PC-3 cells were cultured in the presence of either HGF or EGF, together with established small-molecule and antibody inhibitors of their cognate receptors. As expected, the small-molecule c-Met inhibitor PHA-66575223,24 selectively inhibited the phenotype induced by HGF. In contrast, the EGFR inhibitor AG1478 25 had no significant effect on the HGF-induced phenotype up to a concentration of 1 µM ( Fig. 3A , C , right panel). Conversely, AG1478 but not PHA-665752 inhibited the EGF-induced phenotype ( Fig. 3A , C , left panel). These findings suggest that residual c-Met and EGFR activity does not contribute to the 3D phenotype under the conditions used and that c-Met does not require EGFR for the ligand-induced response and vice versa. Interestingly, ArQ-197, which is reported to be a selective inhibitor of c-Met,22,26 inhibited both the HGF- and EGF-induced responses with a similar IC50, suggesting a more complex mechanism of action. At higher concentrations (>1 µΜ), this compound introduced a novel phenotype, shown by a shift away from the controls in a representation of phenotypic space ( Fig. 3B ).
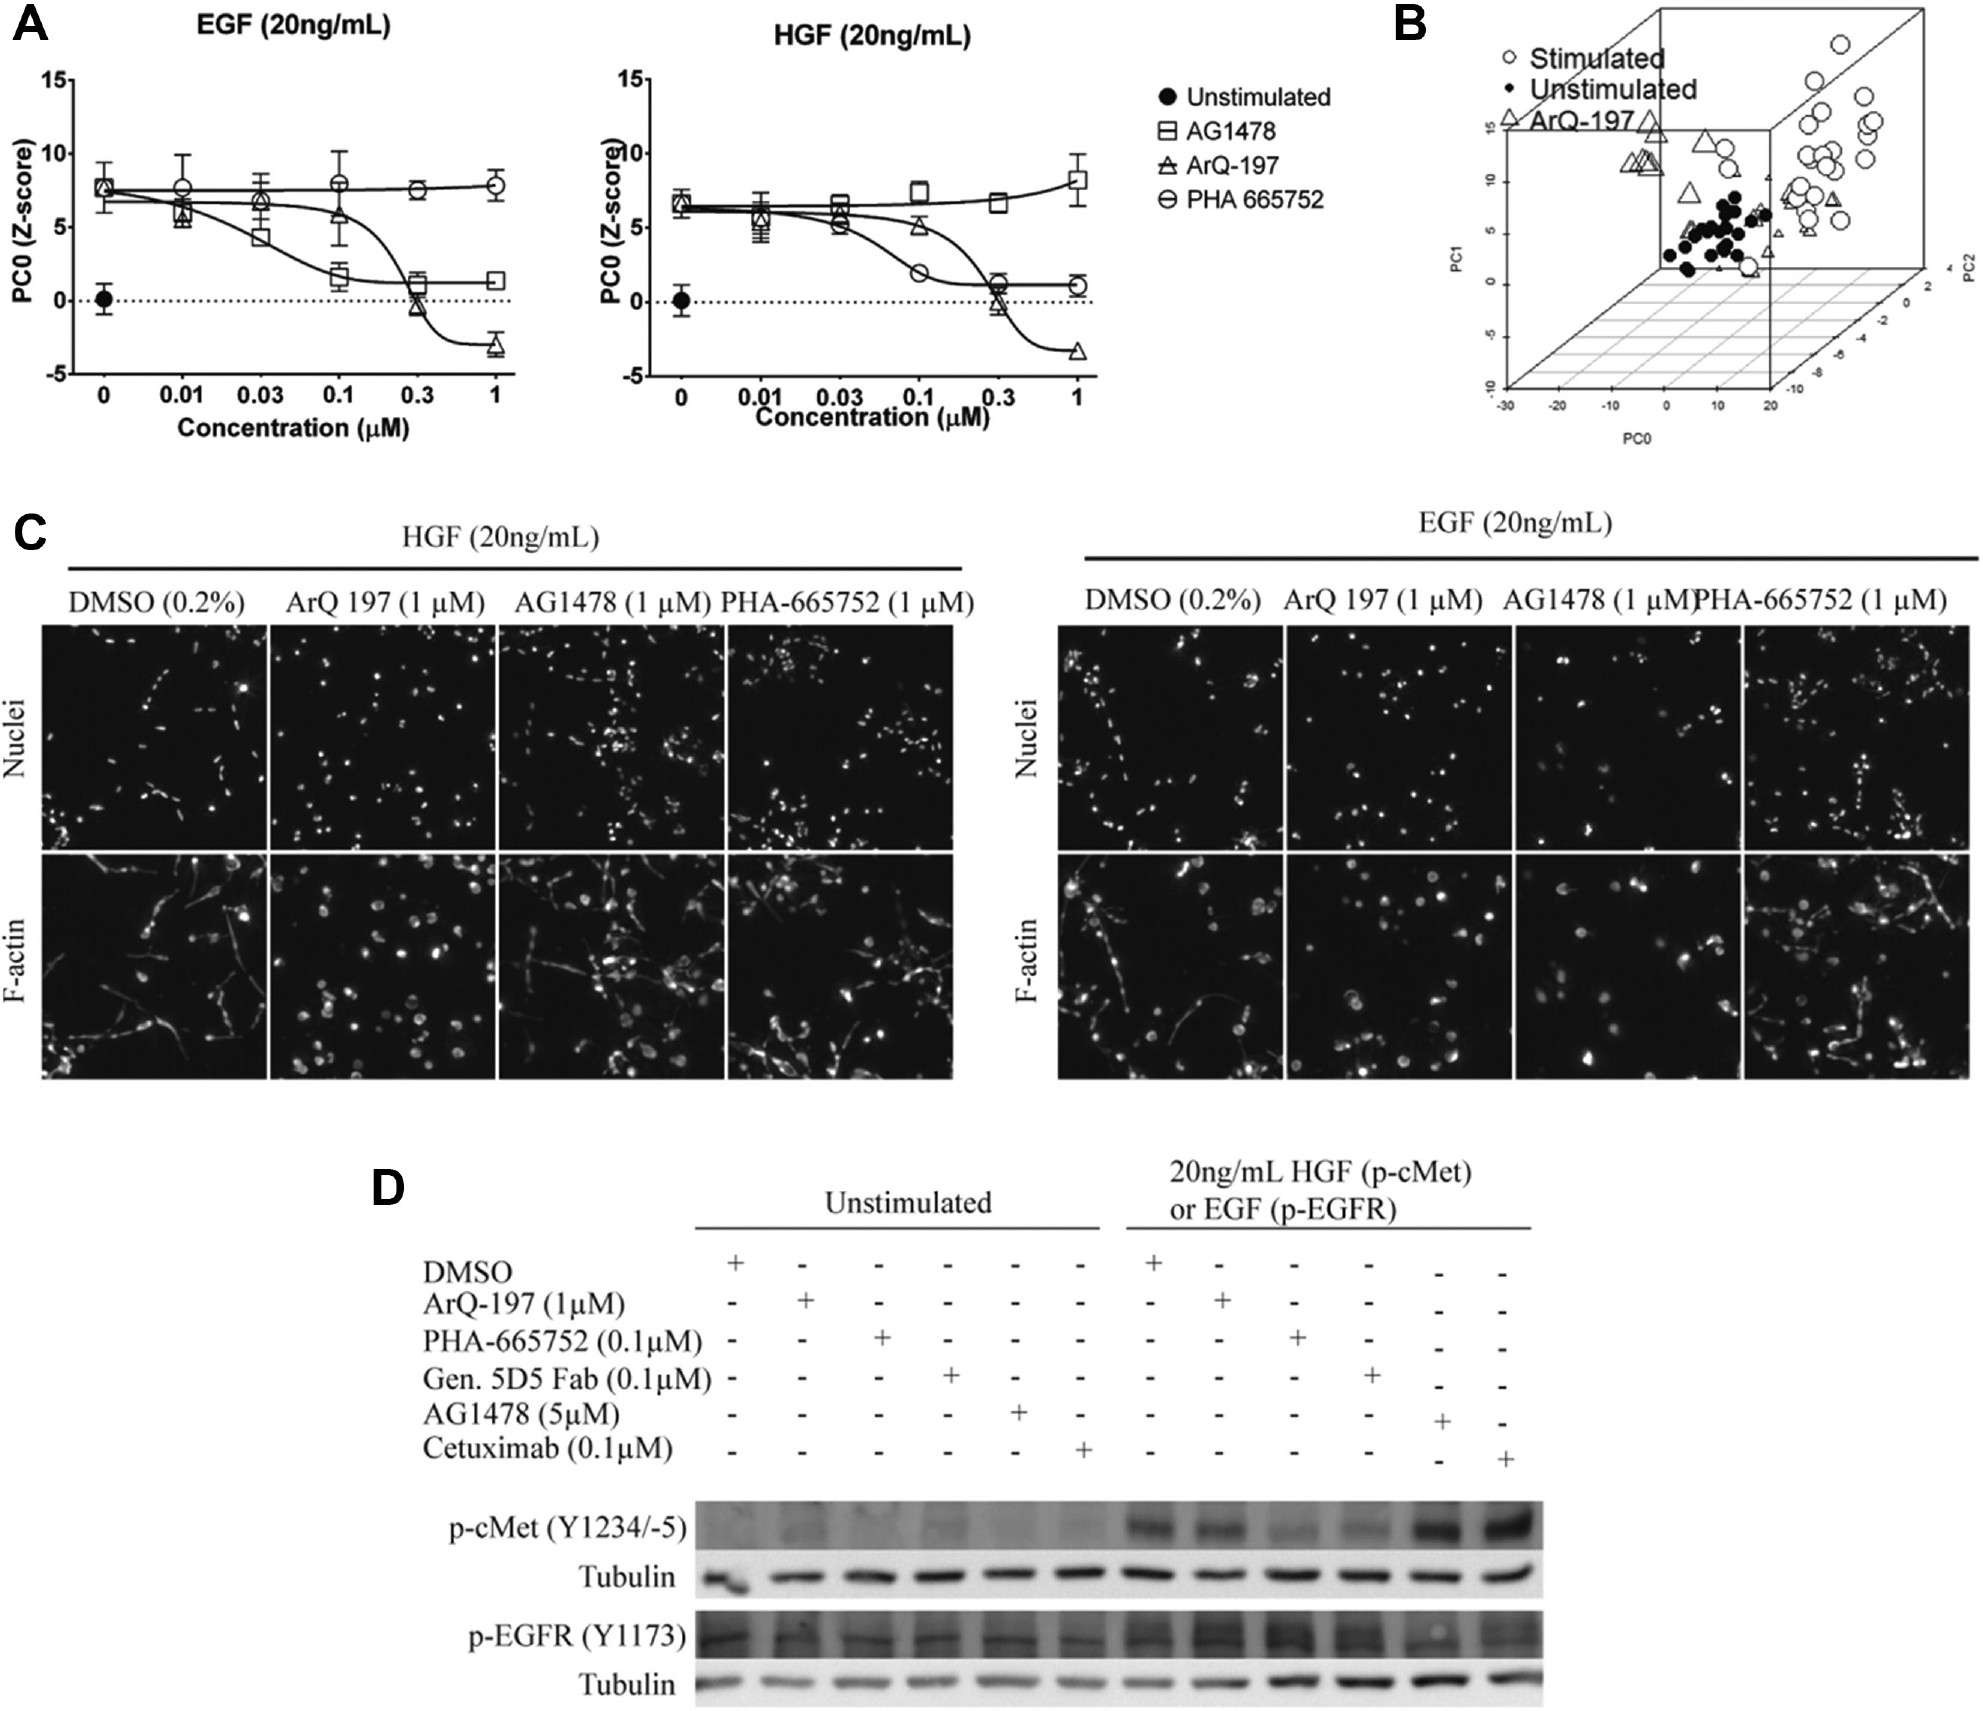
Discriminating on-target effects from off-target effects. (
To confirm that the interpretations based on phenotypic changes correlated with inhibition of receptor kinase activity, we performed Western blot analysis for phosphorylated c-Met (Y1234/-5) and phosphorylated EGFR (Y1173) ( Fig. 3D ). Results showed that PHA-665752 and the Genentech 5D5 Fab potently inhibited phosphorylation of c-Met but not EGFR phosphorylation. Conversely, AG1478 and cetuximab treatment inhibited phosphorylation of EGFR but not of c-Met. ArQ-197 did not show detectable inhibition of EGFR (Y1173) or c-Met (Y1234/-5) phosphorylation under these conditions ( Fig. 3D ). Therefore, inhibition of phenotypes in 3D culture by c-Met and EGFR inhibitors correlates with inhibition of the respective kinases.
Taken together, these results show that measurement of ligand-induced phenotypic changes can be used to discriminate and measure inhibition of c-Met and EGFR.
Using Phenotypic Profiles to Identify Novel Selective c-Met and EGFR Inhibitors
Using data obtained from c-Met and EGFR in vitro kinase assays, a collection of 80 putative single- and dual-specificity EGFR and c-Met inhibitors was compiled (
Figure 4A
depicts the screening results combining the first principal component, PC0, for both EGF- and HGF-induced phenotypic changes in a single plot. Inhibition of c-Met is therefore represented by a decrease in the c-Met PC0 value, from the growth factor–treated to growth factor–untreated controls. Compounds that induced such a shift in the c-Met PC0 included various established c-Met reference inhibitors that were included in the screen, including the Genentech 5D5 Fab antibody, foretinib, and lower doses of PHA-665752. This confirmed that the phenotypic training using HGF-treated and untreated samples discriminated c-Met active and inactive conditions and was able to select compounds that induced a c-Met inhibitory phenotypic profile. Selective inhibition of the EGFR could be characterized by a horizontal shift to the left, from a profile associated with an EGF-stimulated phenotype to one associated with an unstimulated phenotype. This region contained several EGFR reference inhibitors, including erlotinib, gefitinib, and AG1478 (at 1 and 3.16 µM), which were included in the screen alongside test compounds. Compounds that clustered together with the unstimulated controls (
Fig. 4A
, bottom left quadrant) were predicted to have a dual-inhibitory activity for both c-Met and EGFR. The compounds clustering in this area included afatinib and also a number of previously untested compounds of the Vichem library. The class to which each compound was attributed using this approach is shown in
Table 1
and
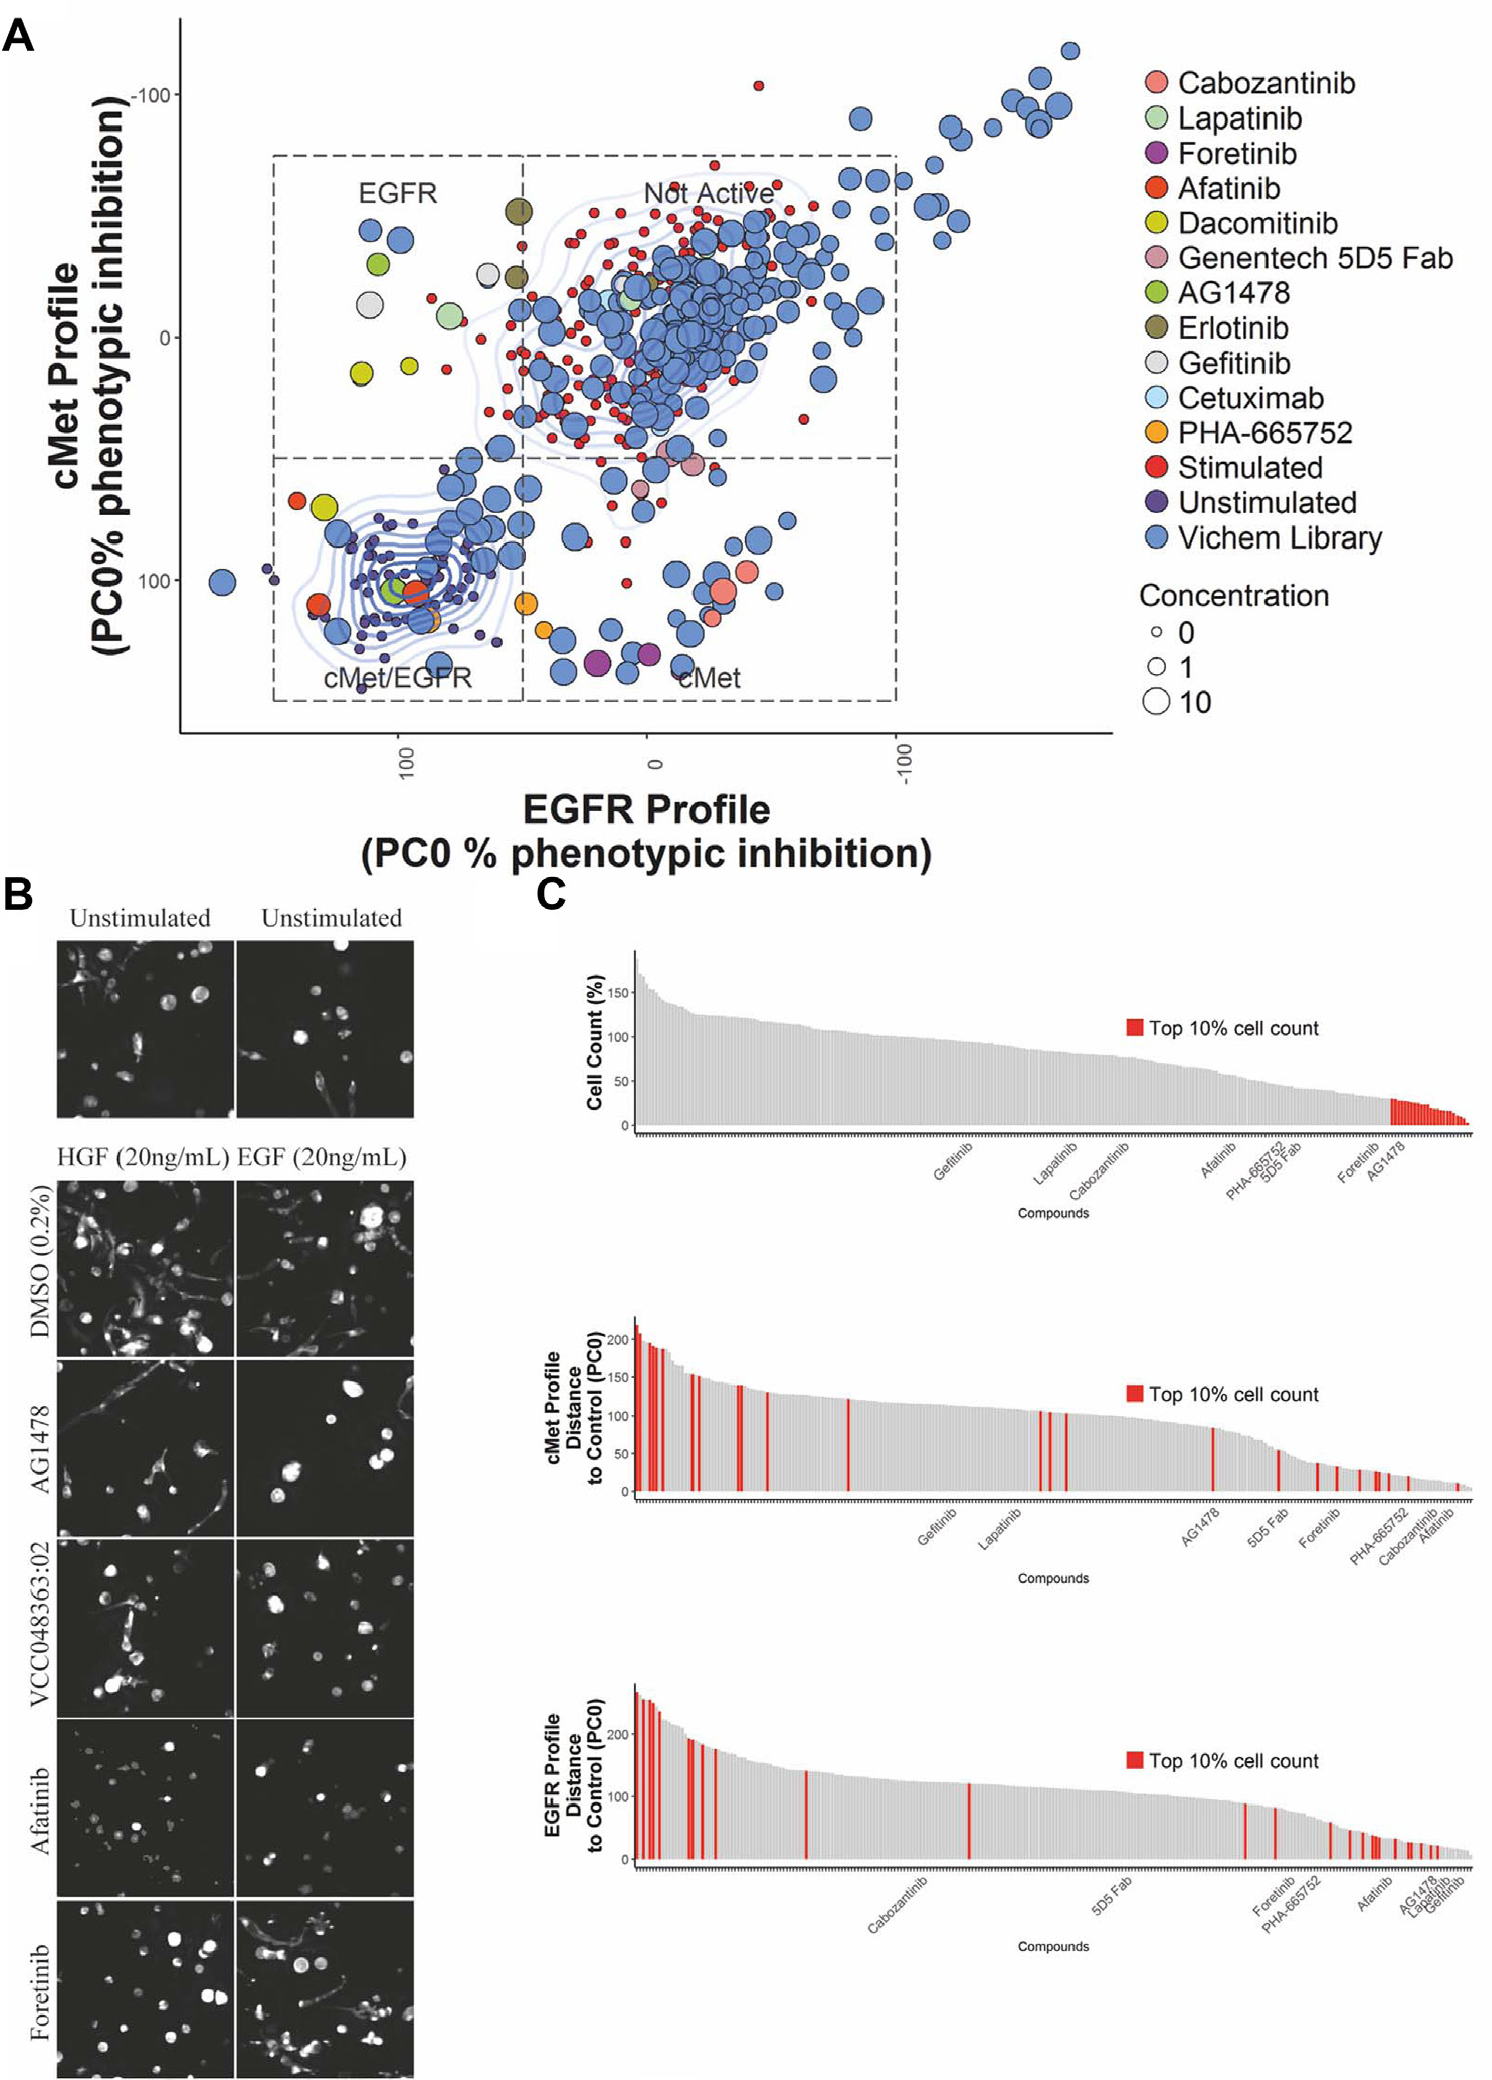
Identification of selective c-Met/EGFR inhibitors in a Vichem epidermal growth factor (EGF) receptor (EGFR)/c-Met inhibiting compound library. (
Hit Selection Phenotypic Screen.
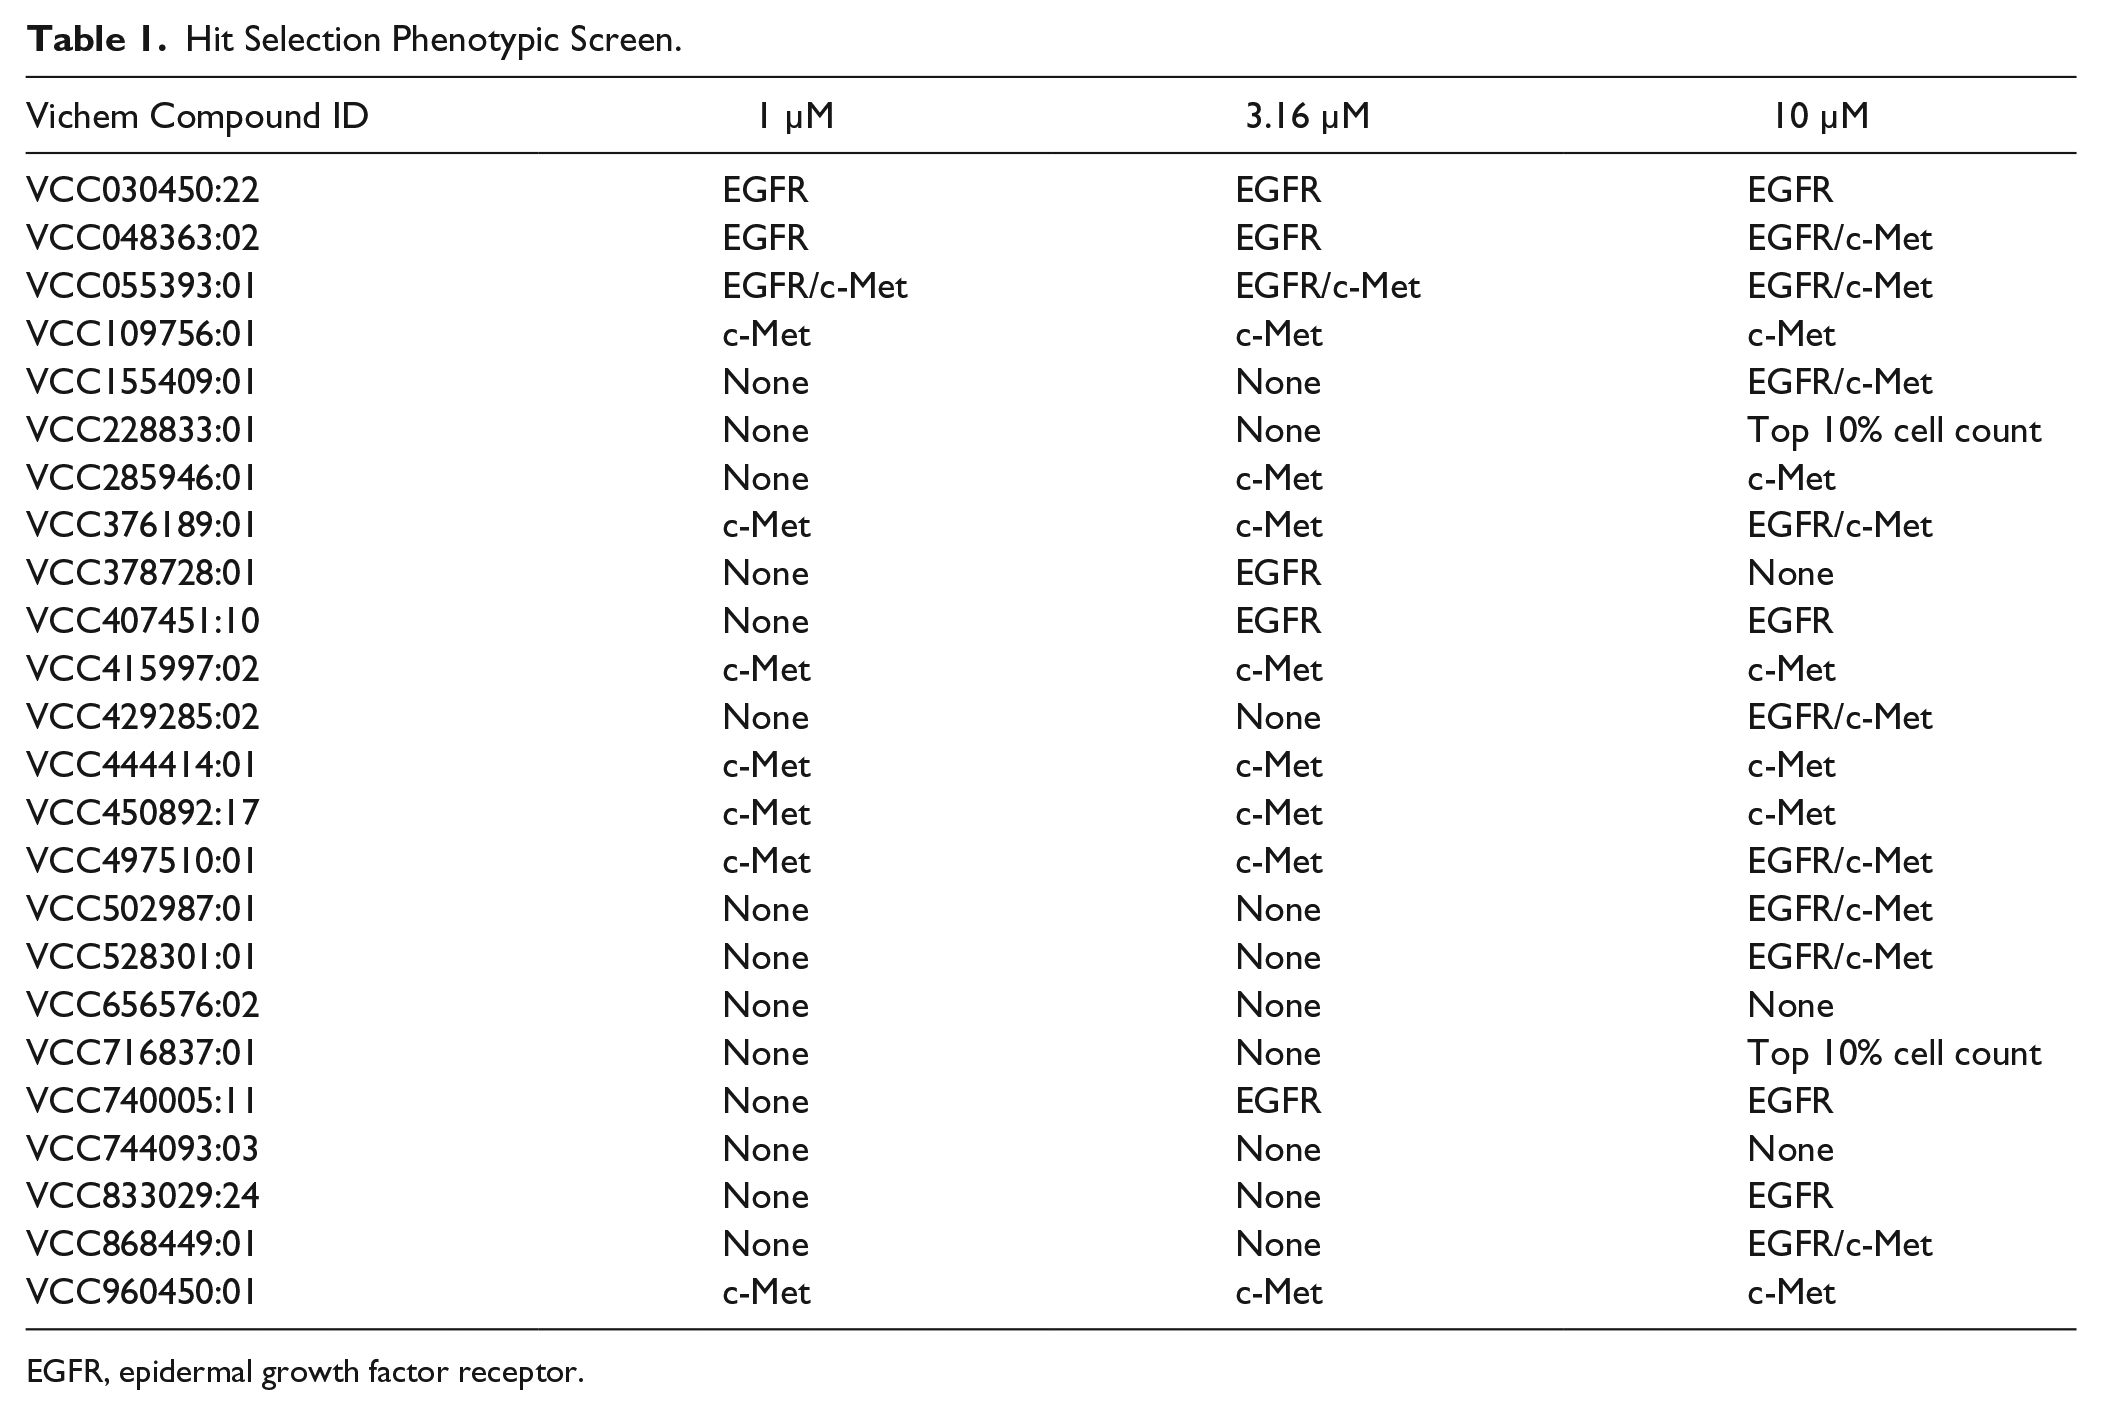
EGFR, epidermal growth factor receptor.
Representative images of 3D-cultured PC-3 cells treated with EGFR and c-Met inhibitors are presented in
Figure 4B
and show a consistency between the automated classification of compounds to a specific inhibitory class and the phenotype that is induced in the presence of a specific growth factor. We compared the phenotypic classification of compounds with measurements of EGFR or c-Met enzyme inhibitory activity (
Table 2
and
Enzyme Activity Measurement (Percent Inhibition).
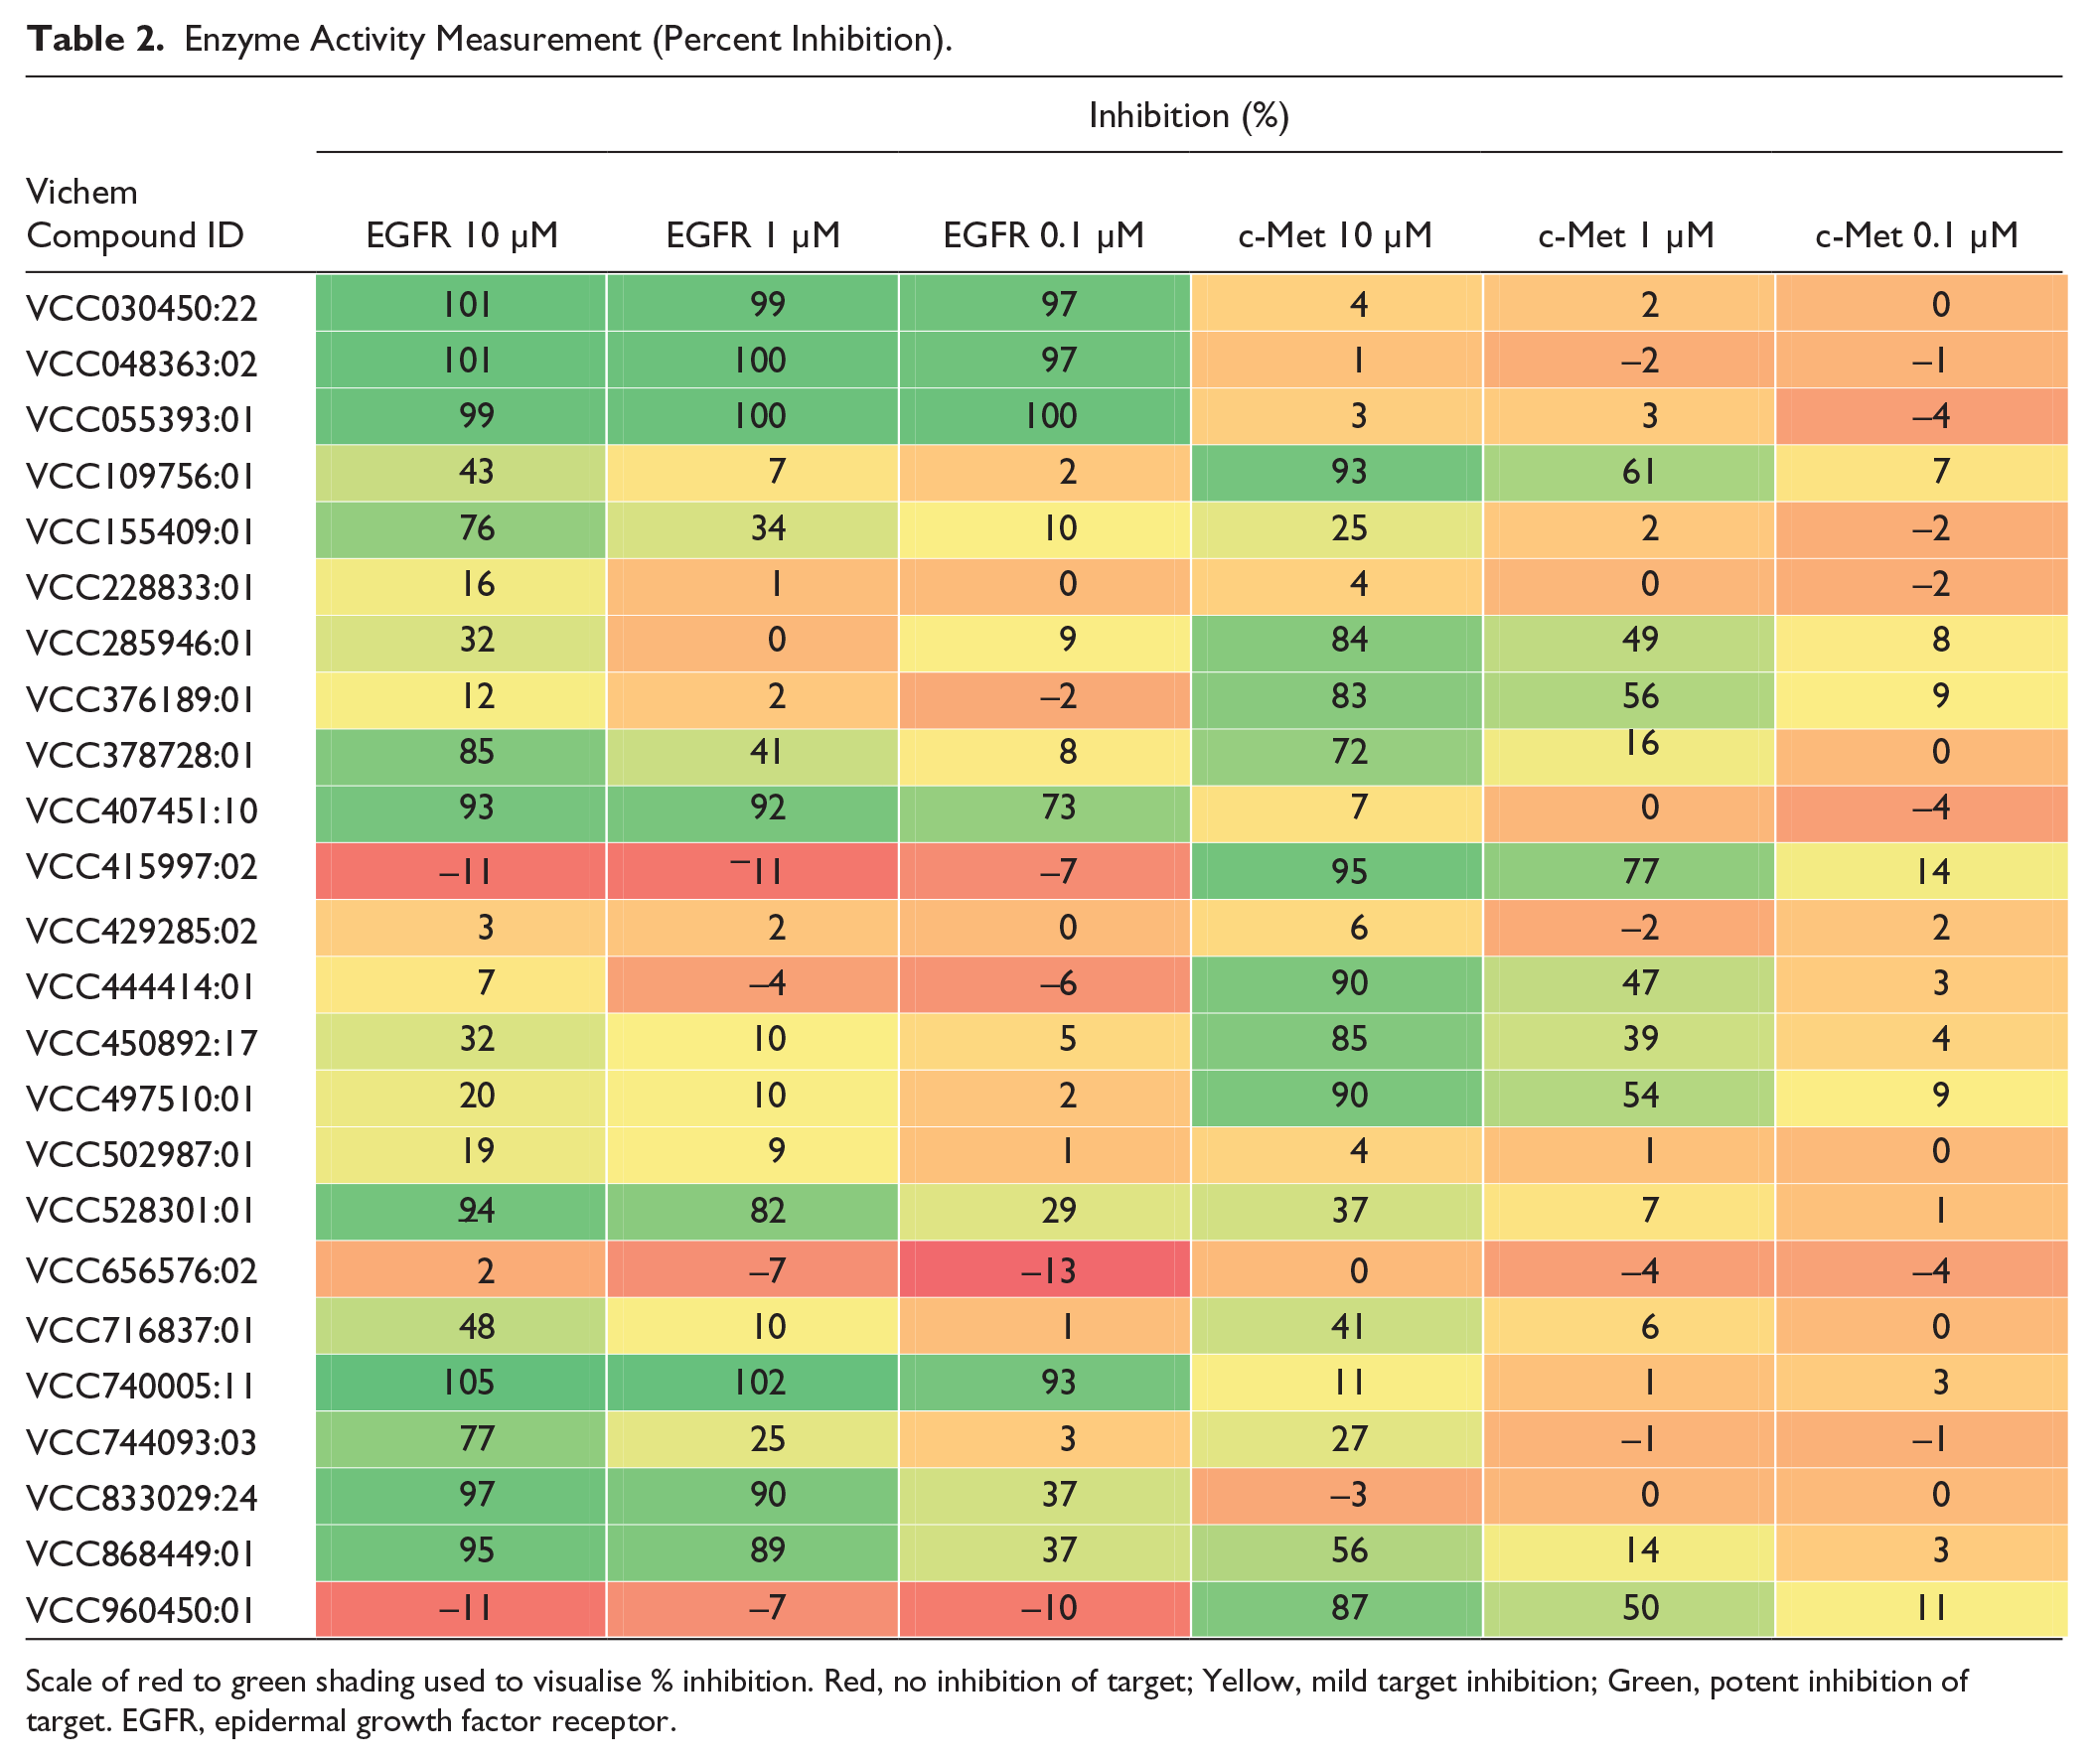
Scale of red to green shading used to visualise % inhibition. Red, no inhibition of target; Yellow, mild target inhibition; Green, potent inhibition of target. EGFR, epidermal growth factor receptor.
We then compared ranking of compounds based on phenotypic profiling with ranking based on cell count. Cell count was determined by the number of nuclei counted per well (one of the many features scored by the multiparametric analysis) and is a feature that correlates closely with biochemical measurements of cell proliferation (not shown). Using a ranking based on cell proliferation, inhibitors that were shown to potently inhibit the c-Met phenotype, including Genentech 5D5 Fab, did not score in the top 10% inhibitors of proliferation (
Fig. 4C
and
Discussion
Because tumor cells exist in a 3D ECM-rich environment, 3D matrix-embedded cell cultures provide a more physiologically relevant context in which to perform compound screening.2–4 The increased complexity of 3D cultures also offers increased potential for phenotypic profiling.27–29 We developed a fully scalable 3D tissue culture–based high-content screening platform that uses phenotypic profiling of cultured tumoroids derived from a prostate cancer cell line. This screening platform was used to identify several selective inhibitors for c-Met and EGFR, which represent important targets in many cancers and are known to be able to stimulate survival and invasive growth of tumours.15–17 We show that activation of c-Met with its ligand, HGF, induced a dose-dependent reorganization of PC-3 spheroids characterized by invasion of cells into the surrounding matrix. A similar change in phenotype was induced by the addition of EGF to the PC-3 cells. These phenotypic changes were not observed in 2D monolayers. Ultra-high-content multiparametric analysis allowed a clear discrimination of the phenotypes associated with active and inactive c-Met and EGFR, which could be quantified using a single PCA measurement. This approach allowed us to discriminate inhibitors of c-Met and EGFR and also putative biselective inhibitors of these receptor tyrosine kinases. The method also enabled nonselective compounds to be discriminated since they induced phenotypes that failed to match those induced by selective inhibition of c-Met or EGFR. The screening results were cross-validated with an in vitro measurement of enzyme activity and were found to largely correlate. Some compounds that inhibited EGFR or c-Met in the biochemical measurement were not identified by our phenotypic screen as inhibitors for these pathways, indicating that inhibition of purified enzyme does not always correlate with inhibition of the target enzyme in cells. These differences may be explained by poor compound stability over multiple days in aqueous solution (medium) or poor membrane permeability, resulting in lower cytoplasmic concentrations. It is also possible that these compounds induce mild phenotypic changes that are below the threshold of the phenotypic assay. A number of compounds were found to induce phenotypic changes in the EGFR and/or c-Met profiles, even though these failed to induce inhibition of either EGFR or c-Met activity. A possible explanation for this finding is that these molecules induced off-target phenotypic effects that could not be discriminated from inhibition of c-Met and EGFR.
Improvements in 3D cell culture reagents, methods, and automated microscopes that can capture 3D image data are making screening in 3D more accessible, including more complex models such as co-cultures.5,30 Here we describe how high-content analysis can maximize the information that can be extracted from the more complex phenotypes obtained in 3D cell culture. These include disease-relevant features, such as tumor cell invasion, but also a multitude of other features that can be exploited for profiling purposes. Thus, in addition to screening for inhibition of a disease phenotype, target-based screening can be performed. Traditionally, receptor activation has been measured using biochemical methods. While sensitive, these methods do not discriminate nonselective inhibition of the target. An advantage of the multiparametric profiling approach described here is that in addition to detecting inhibition of the c-Met and EGFR, off-target effects can also be detected if the off-targets have an impact on tissue phenotype.
Our method was used to determine inhibitory activity of both small molecules and antibodies. We applied the method to both c-Met and EGFR, but in principle, it can be applied to any target if a cell line can be identified in which the activity of the target influences cell phenotype. Combining the advantages of physiological relevance and phenotypic complexity, phenotypic screening and profiling with 3D cell cultures has the potential to improve the quality of hits from screens and make previously challenging targets more accessible, potentially leading to a higher success rate of molecules in clinical trials.
Footnotes
Acknowledgements
We thank Souichi Ogata (Janssen Oncology R&D) for kindly providing ArQ-197 and Rob Roovers (Merus) for providing the Genentech 5D5 Fab and IgG. Furthermore, we thank Dr. Marc Bickle, Max Planck, Dresden, for introducing us to the KNIME software.
Declaration of Conflicting Interests
L. S. Price is a founder and major share holder of OcellO B.V. The other authors declared no potential conflicts of interest with respect to the research, authorship, and/or publication of this article.
Funding
T. H. Booij is supported by the Dutch Technology Foundation STW (Project 11823), which is part of The Netherlands Organization for Scientific Research (NWO). The other authors received no financial support for the research, authorship, and/or publication of this article. The authors received no financial support for the research, authorship, and/or publication of this article.
References
Supplementary Material
Please find the following supplemental material available below.
For Open Access articles published under a Creative Commons License, all supplemental material carries the same license as the article it is associated with.
For non-Open Access articles published, all supplemental material carries a non-exclusive license, and permission requests for re-use of supplemental material or any part of supplemental material shall be sent directly to the copyright owner as specified in the copyright notice associated with the article.