
Abstract
Macrophage migration inhibitory factor (MIF) is a proinflammatory cytokine associated with multiple diseases, including neurodegenerative disorders. With the ultimate goal of providing novel chemotypes as starting points for development of disease-modifying therapeutics for neurodegeneration, we endeavored to screen the GSK compound collection for MIF inhibitors using a miniaturized, activity-based kinetic assay. The assay monitors the increase in absorbance at 320 nm resulting from keto-to-enol tautomerization of 4-hydroxyphenylpyruvate, a reaction catalyzed by MIF. We ran a full-diversity screen evaluating the inhibitory activity of 1.6 million compounds. Primary hits were confirmed and retested in an orthogonal assay measuring tautomerization of
Keywords
Introduction
Macrophage migration inhibitory factor (MIF) is a proinflammatory cytokine originally detected in 1966 as a nondyalizable substance inhibiting the migration of peritoneal macrophages. Its name has since become obsolete given the enzymatic activities described for it later1,2 and the numerous functions described for it in subsequent decades. In 1999, an interesting review by Swope and Lolis 3 was titled “MIF: Cytokine, Hormone or Enzyme?” It was not until 2002 that the first report on its cognate cell surface receptor CD74 was published. 4 Currently, it is considered a pleitropic mediator of immunity and inflammation expressed by a variety of cell types and effecting numerous pathways. For this reason, many drug discovery programs have targeted MIF in therapeutic areas, including immunoinflammation, anti-infectives, and cancer. 5 More recently, it has been found that MIF is constitutively expressed in neurons, and that its expression levels are inversely correlated with neuronal survival after injury, oxygen-glucose deprivation, or neurotoxic insult.6,7 It is upregulated in neuroinflammatory and neurodegenerative diseases such as multiple sclerosis, 8 stroke, 9 spinal chord injury, 6 and Alzheimer’s disease. 10
In amyotrophic lateral sclerosis (ALS), there are two ways in which MIF might contribute to disease progression. First, an increase in M1 versus M2 microglia/macrophage is consistent with elevated levels of proinflammatory cytokines and decreased concentrations of anti-inflammatory ones 11 seen in ALS patients during the disease progression phase. Inhibition of MIF might prevent the neurotoxic M1 microglial phenotype and favor the M2 neuroprotective one. 12 Second, susceptibility to neurotoxins is correlated with MIF expression in neurons, so inhibition of MIF is expected to protect motoneurons and delay disease progression. 13
MIF is a homotrimeric protein with each 12.5 kDa monomer consisting of 115 residues and containing two α-helices packed against four β-strands that are arranged forming a central barrel in the active homotrimer. The three N-terminal catalytic proline residues lie in the interface between monomers, and in addition to the tautomerase activity (see below), they appear to be essential for the interaction with the CD74 receptor, a key event in many of the downstream functions of MIF. MIF exhibits two distinct enzymatic activities: tautomerase and thio-protein oxidoreductase. While the biological functions of these two activities are largely unknown, there is increasing evidence of the relevance of the tautomerase activity in disease. 14 Mutation of proline 1 to serine leads to a tautomerase-dead protein unable to stimulate superoxide generation in activated neutrophils but still fully functional with respect to glucocorticoid counterregulation and inhibition of monocyte chemotaxis. 15 Inactivation of the N-terminal proline with irreversible inhibitors can lead to the loss of most of the pro-inflammatory effects of MIF, and this has been explained by a conformational change in the catalytic domain. 16
Several efforts have been undertaken in the past to identify MIF inhibitors as potential starting points for development of drugs to treat diseases characterized by elevated MIF levels. Most of these were knowledge-based,17,18 or limited-diversity, serendipity-based 19 screens. Through these efforts, MIF has been shown to be a chemically tractable target. Several chemotypes, including irreversible covalent modifiers, have been identified, and there is mounting evidence that compounds binding at or near the tautomerase active site are known to affect MIF biological functions. To date, (S,R)-3-(4-hydroxyphenyl)-4,5-dihydro-5-isoxazole acetic acid methyl ester (ISO-1) is the best characterized inhibitor. ISO-1 has been the most widely used MIF inhibitor in preclinical studies, and it has allowed confirmation of the relevance of MIF tautomerase activity in multiple disease states.
The first substrate identified for the tautomerase activity of MIF was the nonphysiological
In order to screen our compound collection searching for MIF inhibitors with diverse mechanisms of inhibition, we endeavored to optimize previously described assays to enable miniaturization to the 1536-well plate format, enhance substrate stability, and extend the linear range of the reaction with time. Herein we describe these efforts and report on the outcome, including exemplars of the most interesting chemotypes.
Materials and Methods
Materials
4-Hydroxyphenylpyruvic acid (pHPP), boric acid (BioUltra), sodium acetate,
Cloning, Expression, and Purification of Human MIF
Human N-Signal-MIF-C-6H is cloned into pTT5-WPRE vector between EcoRI and HindIII sites to express protein. Full-length hMIF was PCR amplified from genomic DNA into pET24a (Merck Millipore Corp.) using NdeI/HindIII restriction sites. pET24a-hu MIF construction was amplified into competent Escherichia coli BL21(DE3) cells (Tiangen Biotech Ltd., Beijing, China) using a heat shock procedure and positives screened for by colony PCR; positive clones were verified by DNA sequencing and then scaled up. Then the protein was expressed in a strain of BL21(DE3)-competent cells using 0.06 mM IPTG (Takara Bio, Inc., Mountain View, CA) at 30 °C for 4 h. Following protein expression, cells from 2 L of culture LB medium (Merck Millipore) were harvested at 10,000g for 20 min and broken in 300 mL lysis buffer at 4 °C, and cell debris was removed by centrifugation at 10,000g at 4 °C for 20 min. Expression of soluble protein was seen by Novex 4–12% BIS-TRIS Protein Gels (Thermo Fisher Scientific) in reducing running conditions and visualized by SeeBlue Plus2 staining (Thermo Fisher Scientific). The supernatant was adjusted to 10 mM imidazole before it was applied to a 5 mL His Trap FF column (GE Healthcare Bio-Sciences Corp., Pittsburgh, PA) previously equilibrated in DPBS, 10% glycerol, and 10 mM imidazole, pH 6.8 (binding buffer); the protein was then eluted in three steps using an ÄKTA Explore 100 (GE Healthcare Bio-Sciences). The first step uses five volumes of the binding buffer, a second step to remove the endotoxin was performed with 200 mL of binding buffer containing 0.1% Trition 114, and finally, the column was eluted with DPBS, 10% glycerol, and 1 M imidazole, pH 6.8 (elution buffer). The large peak obtained was pooled together (≈30% elution buffer) and dialyzed and concentrated using 3 kDa Amicon filters (Merck Millipore) to remove imidazole, yielding 30 mg of wt His-hMIF with good purity (>95%) by gel densitometry (Synoptics Ltd., Cambridge, UK). Protein concentration was determined by UV absorbance with a NanoDrop (Thermo Fisher Scientific) and aliquoted for storage at −80 °C. The molecular weight obtained by liquid chromatography–mass spectrometry (LC-MS) analysis (13,167.9 Da) has an acceptable variation range with respect to the expected mass and indicated the loss of the N-term methionine (129.5 Da). These results have also been confirmed by peptide mass fingerprinting (PMF) analysis. PMF analysis gave a 21% coverage, which confirms the identity of the protein.
Compound Library
The screening library consisted of more than 1.6 million unique compounds with a minimum of 80% purity. Single-concentration screening was performed by dispensing 40 nL of 1 mM compound solutions in DMSO into black 1536-well flat clear-bottom polystyrene plates (Greiner Bio-One Ltd., Monroe, NC) using an Echo 555 acoustic dispenser (Labcyte, Inc., Sunnyvale, CA). This gave a final compound concentration of 10 μM in a 4 μL final assay volume. A total of 40 nL DMSO (1% v/v final concentration) was dispensed onto wells in columns 11 and 12 and 35 and 36 for negative and positive controls, respectively. For the 11-point concentration–response curves, a threefold serial dilution in neat DMSO from a 10 mM compound solution was made using an EVO Freedom liquid handling instrument (Tecan Group Ltd., Zürich, Switzerland), and the resulting solutions were transferred (40 or 80 nL) onto sample wells in assay plates. Thereby the highest concentration in the assay was 100 μM.
Primary and Secondary Assays’ Design
The primary assay is based on the determination of initial rates of the MIF-catalyzed conversion of the ketonic into the enolic tautomer of pHPP. This is achieved by spectrophotometric quantification of the complex between borate and the product of the reaction (enolic pHPP).
The substrate was prepared by conversion of the enolic pHPP into its ketonic form. 22 To achieve this, 0.5 M pHPP in methanol was diluted 10-fold with 50 mM sodium acetate buffer at pH 6.0, and then the suspension was shaken for 24 h at room temperature in darkness, and finally stored at 4 °C for not more than 1 week, with 5 min sonication being recommended before use.
Short reaction times are not HTS-friendly, more so for assays employing a kinetic read mode. With this in mind, we selected the enzyme concentration producing an adequate signal-to-background ratio in a convenient timescale (ideally 30–60 min) while ensuring linearity of product generation with time and moderate extent of substrate conversion. Progress curves were monitored for eight different concentrations of MIF (from 390 pM to 50 nM) in the presence of the 1.5 mM ketonic form of pHPP.
Buffer content plays a critical role in assay robustness. We sought optimal values for pH (in the 5.5–8.9 range) and ionic strength, compared several sources of buffer, and also performed an additives screen that included divalent cations, reducing agents, carrier proteins, detergents, and polyols. Important improvements in enzyme activity (threefold) and in reaction linearity (fivefold up to 60 min) were achieved when 300 µM CHAPS and 0.025% w/v BSA were added. The reaction was followed by absorbance increase in an EnVision multilabel plate reader (PerkinElmer, Inc., Waltham, MA) for 1 h at room temperature (approximately 23 °C). Assays were performed in small-volume clear-bottom black 384-well polystyrene plates (Greiner Bio-One) as 20 μL reaction mixtures containing 1.5 mM pHPP, 3 nM MIF, 100 mM boric acid, 0.025% w/v BSA, and 300 µM CHAPS. These were prepared by initially dispensing 10 μL of a 2× enzyme solution (in DPBS, 0.025% w/v BSA, and 300 µM CHAPS). Reactions were initiated by addition of 10 μL of 2× substrate solution (in Na3PO4 at pH 6.0 with 200 mM boric acid, 0.025% w/v BSA, and 300 µM CHAPS), and were monitored by recording the increase in absorbance at 320 nm in an EnVision for 1 h. Since compounds used in HTS are dissolved in DMSO, we next determined assay sensitivity to DMSO and found that DMSO up to 5% v/v did not inhibit the reaction.
Further MIF tautomerase activity determinations were performed exploiting its ability to catalyze the conversion of
The apparent KM values for both substrates were determined by spectrophotometric determination of the initial reaction rates at room temperature for 1 h using the SpectraMaX M5 multilabel plate reader (Molecular Devices Ltd., Sunnyvale, CA). The value of the apparent KM was generated by nonlinear fit to the Michaelis–Menten equation. Thus, KM for the ketonic form of pHPP was determined at 300 nm by the rate of formation of a complex between boric acid and the enol tautomer of pHPP as a function of substrate concentration ranging from 140 µM to 8 mM using 10 nM MIF. In the same way, KM for
Primary Assay for HTS Campaign
Plate maps consisting of 1536 wells contained 64 wells for negative controls (uninhibited reaction reference), 64 wells for positive controls (in the absence of MIF), and 1408 wells for samples (test compounds). First, 2 µL of the enzyme solution containing 6 nM of MIF in DPBS, 0.025% w/v BSA, and 300 µM CHAPS was dispensed onto sample and negative control wells using Multidrop Combi with metalic tip cassettes (Thermo Fisher Scientific) previously treated with Sigmacote. Then, 2 µL of the same buffer without MIF was dispensed onto positive control wells. The reaction was started by addition of the following to all wells: 2 µL of substrate solution containing 3 mM ketonic pHPP in 200 mM boric acid, 25 mM sodium phosphate, 0.025% w/v BSA, and 300 µM CHAPS at pH 6.0. In order to remove bubbles, the plate was centrifuged in an Allegra 25R centrifuge (Beckman Coulter, Inc., Brea, CA) at 1000 rpm for 2 min at room temperature. Then, the plate was read in an EnVision. Final concentrations of enzyme and substrate were 3 nM and 1.5 mM, respectively. Initial rates were calculated for each well as the slope of the absorbance progress curve.
Secondary Assay for Hit Validation
Confirmed hits were progressed to dose–response studies, including determination of their potencies in both the primary assay and a suitable orthogonal assay using LDME as substrate. For the latter, assay-ready, 1536-well plates carrying 80 nL per well from serial dilutions of hits in DMSO were prepared as described in Compound Library and screened by addition of 4 µL of 20 nM MIF in BIS-TRIS, 0.025% w/v BSA, 300 µM CHAPS, and 1 mM EDTA at pH 6.2 to negative control and sample wells, and 4 µL of the same buffer without enzyme to positive control wells. Compounds were preincubated with the enzyme for 30 min before starting the reaction by addition of 4 µL of 0.4 mM LDME in the same buffer to all wells. Final concentrations of enzyme and substrate were 10 nM and 0.2 mM (≈0.6 KM) 24 ( Fig. 1D ), respectively. Plates were centrifuged at 1000 rpm for 2 min at room temperature and read in an EnVision four times, once every 6 min. The slopes of the corresponding progress curves were further determined by linear regression as final assay output yielding a signal-to-background ratio of 8 for the uninhibited reaction.
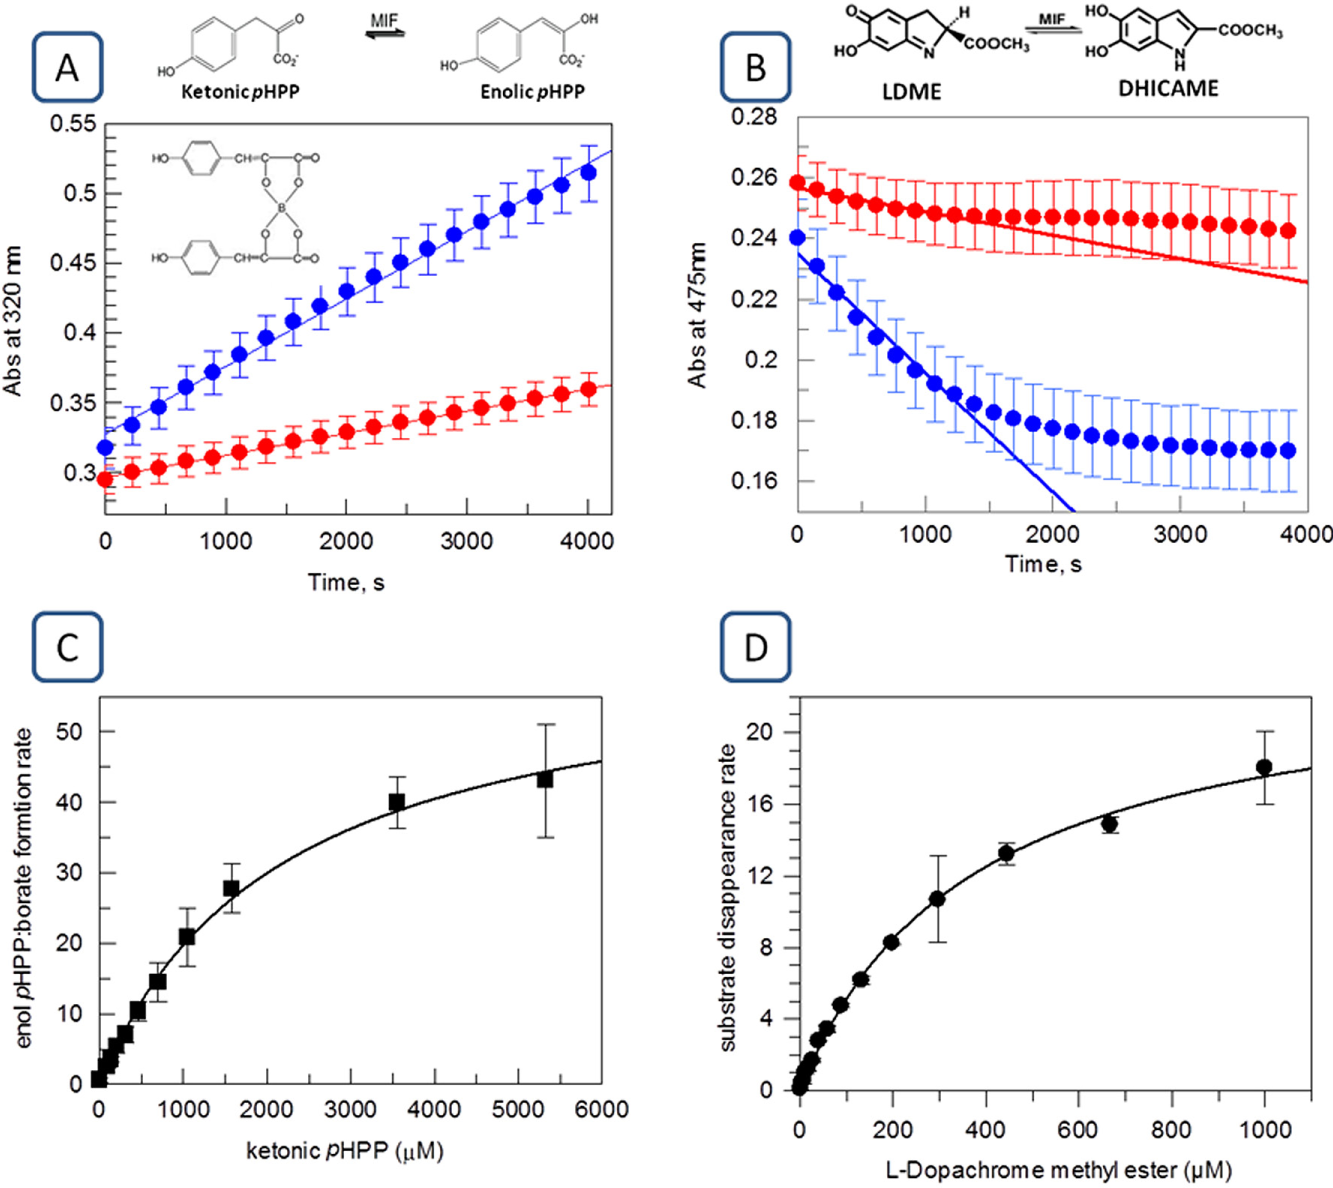
Assay choice and determination of KM. Time courses of MIF-catalyzed (blue) and spontaneous (red) tautomerization of ketonic to enolic pHPP at 320 nm (
Data Management
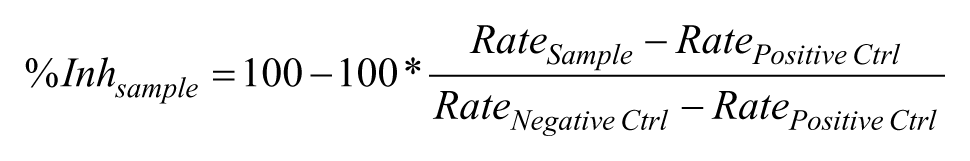
Data were automatically acquired, refined, and posted by ActivityBase XE (IDBS Ltd.) into the corporate databases. The response in each sample well was normalized as percentage of inhibition (%Inh) using the robust means of in-plate control well populations based on the following equation:
The quality of the assay was evaluated for each screening plate using the Z′ parameter. Acceptable values were between 0.4 and 1.0. Additionally, a collection of tool compounds was tested each screening day as a control of the sensitivity and reproducibility of the assay.
Dose–response curves were fitted using a four-parameter logistic equation describing a sigmoidal curve with adjustable Hill coefficient and high and low asymptotes using ActivityBase WE Runner software (IDBS). The curve-fit model was
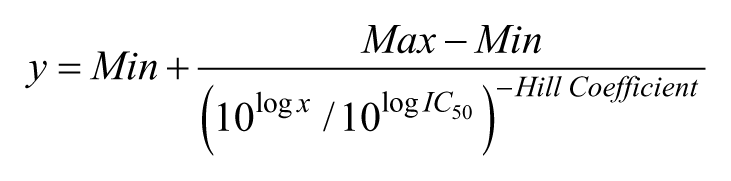
where y is the inhibition observed for a given concentration (x) of the compound, Max and Min are, respectively, the high and low asymptotes of the curve in a semilogarithmic representation, IC50 is the concentration of compound that half-inhibits the reaction, and Hill Coefficient is the slope of the inverse curve (remaining activity) at its midpoint.
The inhibitory potencies of compounds were expressed as pIC50, where pIC50 = –log (IC50), and IC50 is the concentration of inhibitor required to half-reaction rate, expressed in molar units.
In order to mark the hits, a statistical approach was used. For each screening day, both the mean (µ) and standard deviation (SD) were calculated with a robust algorithm 25 for determination of the hit threshold. Additionally, in order to minimize the loss of valuable hits as a consequence of regional heterogeinity in plates due to plate handling, liquid handling, or reading effects, a pattern recognition and correction algorithm was applied. 26 The list of hits resulting from this new analysis was combined with the one generated before pattern correction to generate the final selection of hits for confirmation studies.
Primary hits were subjected to single-shot confirmation studies. These were done in triplicate with the same compound concentration as in primary screening (10 µM) and identical experimental conditions. However, given the higher abundance of positives expected during this phase, for calculation of hit thresholds, the mean and standard deviation of the population of negative controls were used instead of those estimated from the population of samples. In order to select compounds to progress further, a combination of criteria was used, including observed inhibition, chemical diversity, and physicochemical properties.
Finally, 4,000 confirmed hits were selected for IC50 determinations to evaluate potency. An 11-point concentration–response curve was generated to determine the IC50 value of each compound in the pHPP assay, as well as in the
FT-MoI Studies
Fast-track mode-of-inhibition (FT-MoI) studies were performed for selected hits with the aim of identifying slow-binding, promiscuous, and tight-binding or irreversible inhibitors. The experiments consisted of comparative determinations of pIC50 values obtained from triplicates for each compound under paired conditions. To do this, 11-concentration serial (1/3) dilutions of compounds in neat DMSO from a 10 mM stock were stamped onto assay plates as described for the dose–response hit confirmation studies using the pHPP assay.
For identification of slow-binding inhibitors, that is, compounds establishing a complex with the enzyme that equilibrates on a timescale of minutes, we performed dose–response studies in the presence and absence of a 1 h preincubation with enzyme prior to addition of substrate.
Promiscuity is defined as the property of a drug to act with multiple molecular targets and exhibit distinct pharmacological effects. A promiscuous inhibitor would bind nonspecifically at different sites of a target in a nonstoichiometric fashion. Promiscuous inhibitors were unmasked by comparison of their observed potencies at two different concentrations of enzyme. We used 2 and 15 nM with 1 h and 5 min of reaction time, respectively, to ensure linear conversion.
Reversibility of inhibition is easily determined by measuring the recovery of enzymatic activity after a rapid and large (“jump”) dilution of the enzyme–inhibitor complex. In order to identify potentially irreversible or tight-binding inhibitors in our list of confirmed hits, we compared their potencies with and without a jump dilution step before initiating reactions by addition of substrate. MIF was incubated with the inhibitors in 1 μL volume at eightfold concentration with respect to standard conditions. After 1 h of equilibration, the mixture was diluted eightfold into reaction buffer containing the substrate to initiate the reaction. This dilution renders the same enzyme concentration as in the primary assay. We compared the pIC50 values obtained from this jump-diluted experiment with those observed with identical preincubation time and final enzyme concentration in the absence of jump dilution.
Results
Assay Development
Traditionally, MIF tautomerase activity tests have been conducted using LDME, following its conversion to DHICAME by monitoring the rate of decline in absorbance at 475 nm.
15
For that reason, we optimized an assay for MIF tautomerase activity based on the measurement of the rate of formation of a complex between boric acid and the enol tautomer of pHPP. 20 This assay format is easier to miniaturize and adapt to high-density plate formats. The main disadvantage of pHPP with respect to LDME is the lower wavelength of its absorption maximum. In fact, most plastics used for clear-bottom plates are opaque to light at 300 nm, and many compounds in screening collections absorb light significantly at this wavelength. We explored the feasibility of employing light at 320 nm instead to mitigate these issues. Detection was optimized for clear-bottom polystyrene plates using the EnVision equipped with a 320 ± 17 nm filter. In spite of 40% dynamic range reduction with respect to 300 nm detection, this optical setup allowed monitoring up to 400 µM of product in the presence of 300 µM CHAPS. In these conditions, the detection system also becomes insensitive to the contribution of up to 1.5 mM of substrate. With this assay, the IC50 value for the well-known competitive inhibitor ISO-1 was 25 µM, a value in the same range as the one reported in the literature, 7 µM. 14
Assay buffer composition was optimized to maximize enzyme activity and minimize assay variability. Key additives were a carrier protein (0.025% w/v BSA) and a detergent (300 µM CHAPS). Regarding buffers, DPBS at pH 7.4 was chosen for the enzyme and 25 mM sodium phosphate at pH 6.0 with 200 mM boric acid was selected for the substrate. Borate chelates the enolic product, thereby stabilizing it.
The effect of enzyme concentration was analyzed using 1.5 mM pHPP, and we found that for MIF concentrations up to 5 nM, reactions were linear for 1 h, as illustrated by Figure 1A . In the case of LDME, enzyme titrations indicated that the reaction is linear for 800 s using up to 25 nM MIF ( Fig. 1B ).
During development of an enzymatic assay for screening, after fixing the adequate reaction time and enzyme concentration to measure initial rates in the steady state, it is crucial to decide the optimal substrate concentration to work with. Concentrations at the KM value allow the identification of inhibitors that interact with every possible state of the enzyme. In general, concentrations near the KM value are optimal to achieve the widest range of enzyme inhibitor types, including competitive, noncompetitive, and uncompetitive. 27 Apparent KM for pHPP was determined by measuring the initial rate as a function of substrate concentrations using 10 nM MIF, and the data were fitted to the Michaelis–Menten equation. The calculated apparent KM value was 1.76 ± 0.35 mM for pHPP ( Fig. 1C ), in agreement with the data reported in the literature. 20 Also in line with previously reported results, 24 the value of the apparent KM for LDME was 366 ± 21 µM ( Fig. 1D ).
We successfully adapted the assay to use it for massive screening by increasing the linear range of the reaction to 1 h and miniaturizing it for higher-density (1536-well) plate formats. It comprised two 2 µL addition steps for dispensing enzyme and substrate onto 40 nL of prestamped 1 mM solutions of compounds in DMSO, rendering a 10 µM final assay concentration and 1% v/v DMSO. Plates were kinetically read every 14 min in an EnVision at room temperature for 1 h, and slopes of the corresponding progress curves were further determined by linear regression as final assay output. These final concentrations of enzyme and substrate (3 nM MIF and 1.5 mM pHPP) allowed a signal-to-background ratio of 6 for the uninhibited reaction.
HTS Analysis and Hit Selection
Primary screening of the GSK collection was performed using three EnVision plate readers in parallel, which allowed a maximum throughput of ninety 1536-well plates per day. Each plate was read every 14 min for 1 h to enable accurate determinations of initial rates. This readout mode imposed a limitation on the size of batches to 15 plates. Despite this limitation, the throughput achieved (126,720 compounds tested in a day) was adequate for screening our full-diversity compound collection.
The quality of the screen was closely monitored through the Z′ values and by testing a set of tool compounds each day ( Fig. 2 ).
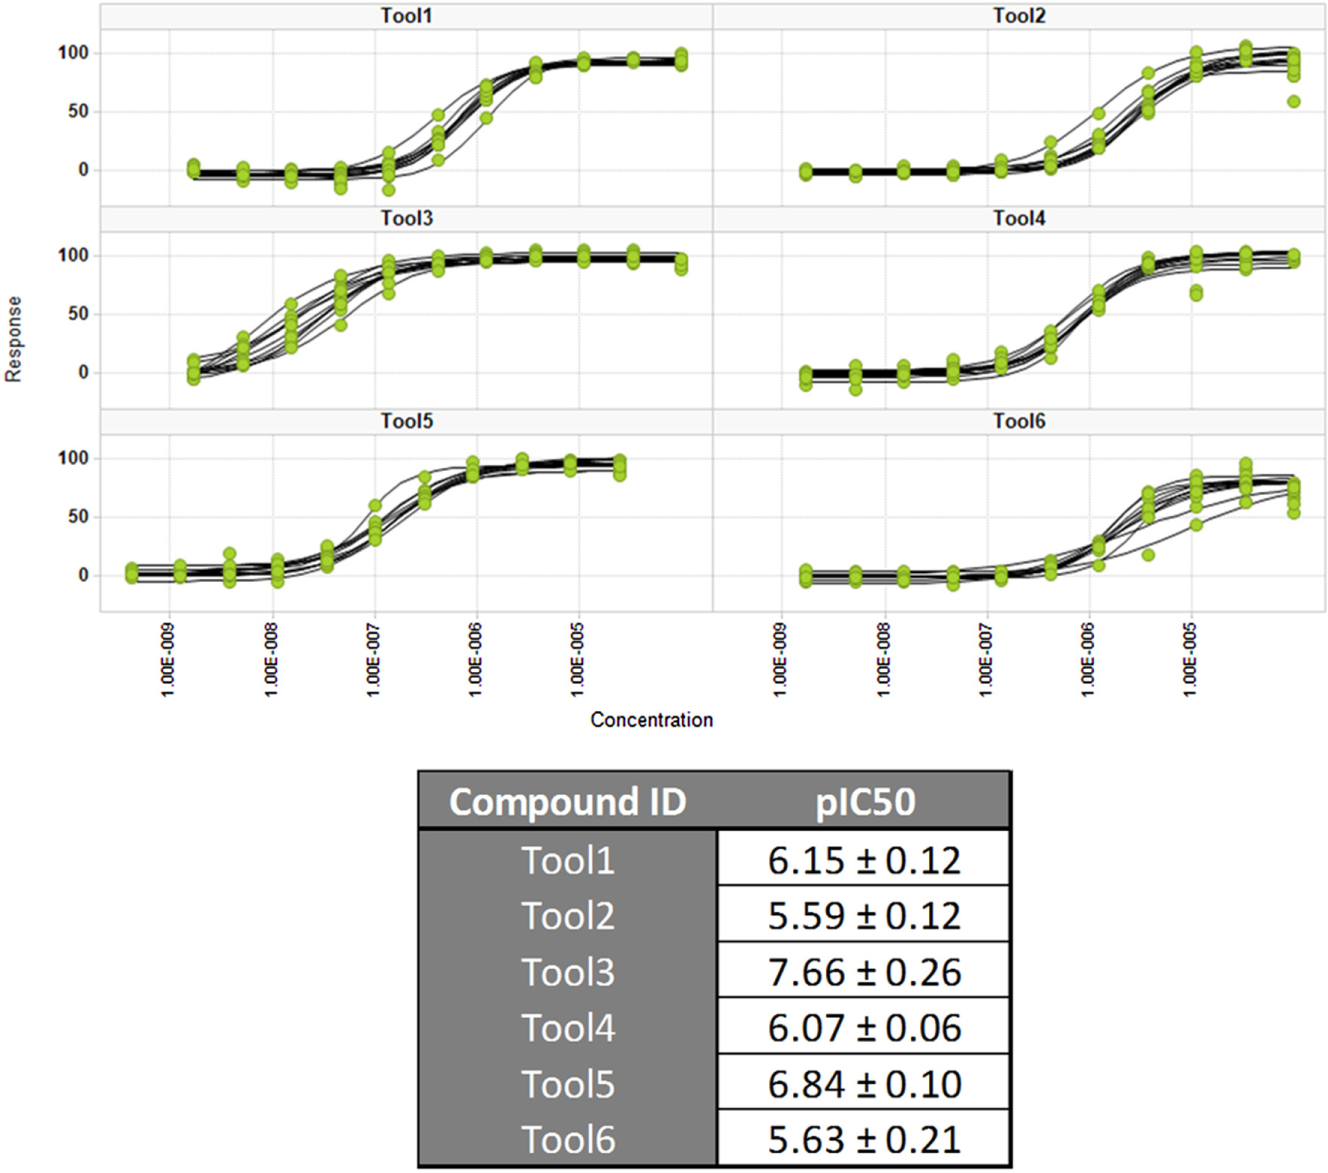
Sensitivity and reproducibility of the HTS assay throughout the screening campaign. The dose–response curves were obtained for each compound on every screening day by fitting results to a four-parameter logistic equation. The table shows the observed inhibitory potencies and their variation.
Figure 3 displays a frequency histogram of the responses observed from sample and control wells in the screen ( Fig. 3B ), together with the distribution of Z′ values ( Fig. 3A ). It can be observed that there was a very good separation of high and low controls across the campaign, with an average Z′ value of 0.80.
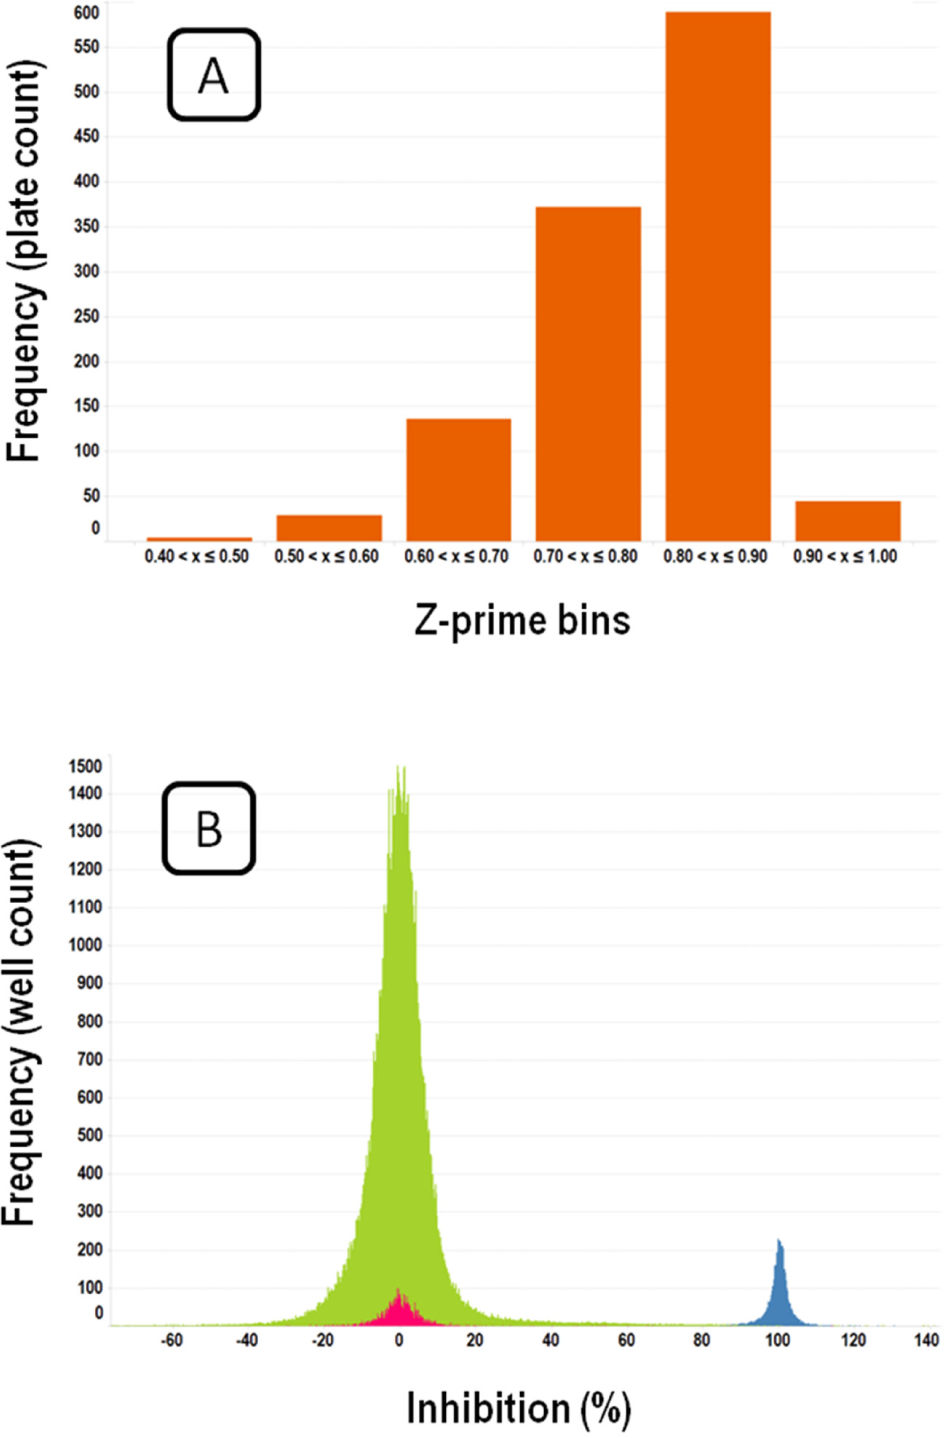
Screen performance and distribution of results. (
Compounds were progressed to confirmation studies if they had a response higher than µ + 4 SD for the corresponding batch; on average, this was 25% response for the whole campaign. A total of 23,409 compounds were thus identified. In addition, a pattern recognition algorithm 26 was applied to detect plates with significant gradients in their spatial distribution of responses; in ~60% of the plates, a significant pattern was observed that was fixed by applying a smoothed two-dimensional (2D) running medians algorithm 26 to the plates. In order to rescue possible false negatives due to the patterns, after this correction, all the compounds with a response of >25% were also added to the previous set, resulting in a total number of 26,537 hits to run in the confirmation screen.
The single-shot confirmation screen was run in triplicate. By using the low controls to define statistically the hits as described above, approximately 13,000 compounds resulted, corresponding to a confirmation rate of approximately 50%. This exceeded the capacity to test compounds in dose–response mode (about 4000 compounds), and therefore a more stringent approach was used to select the hits. All the compounds with a response of >50% in the three copies were directly selected (2224 compounds); 1776 more compounds (up to 4k) were then added by using a chemical diversity sampling algorithm applied to the compounds (1) not in the previous set, (2) with a response of >30% in the three replicas, and (3) with a solubility forecast index (SFI) of <8. 28
After running the dose–response experiments, in the both primary and secondary assays (see Materials and Methods), curves were fitted by using the ActivityBase curve-fitting algorithm in batch mode. A wide range of potencies and maximum responses were observed in the curves for both assays. A selection was performed (430 compounds) of the compounds with pIC50 > 4.5 in the two assays, with a maximum response of >80% too. This set was tested in the FT-MoI experiments. Figure 4 shows an overall scheme of the triaging tactics used to select the hits to subject to medium-throughput mode-of-inhibition studies.
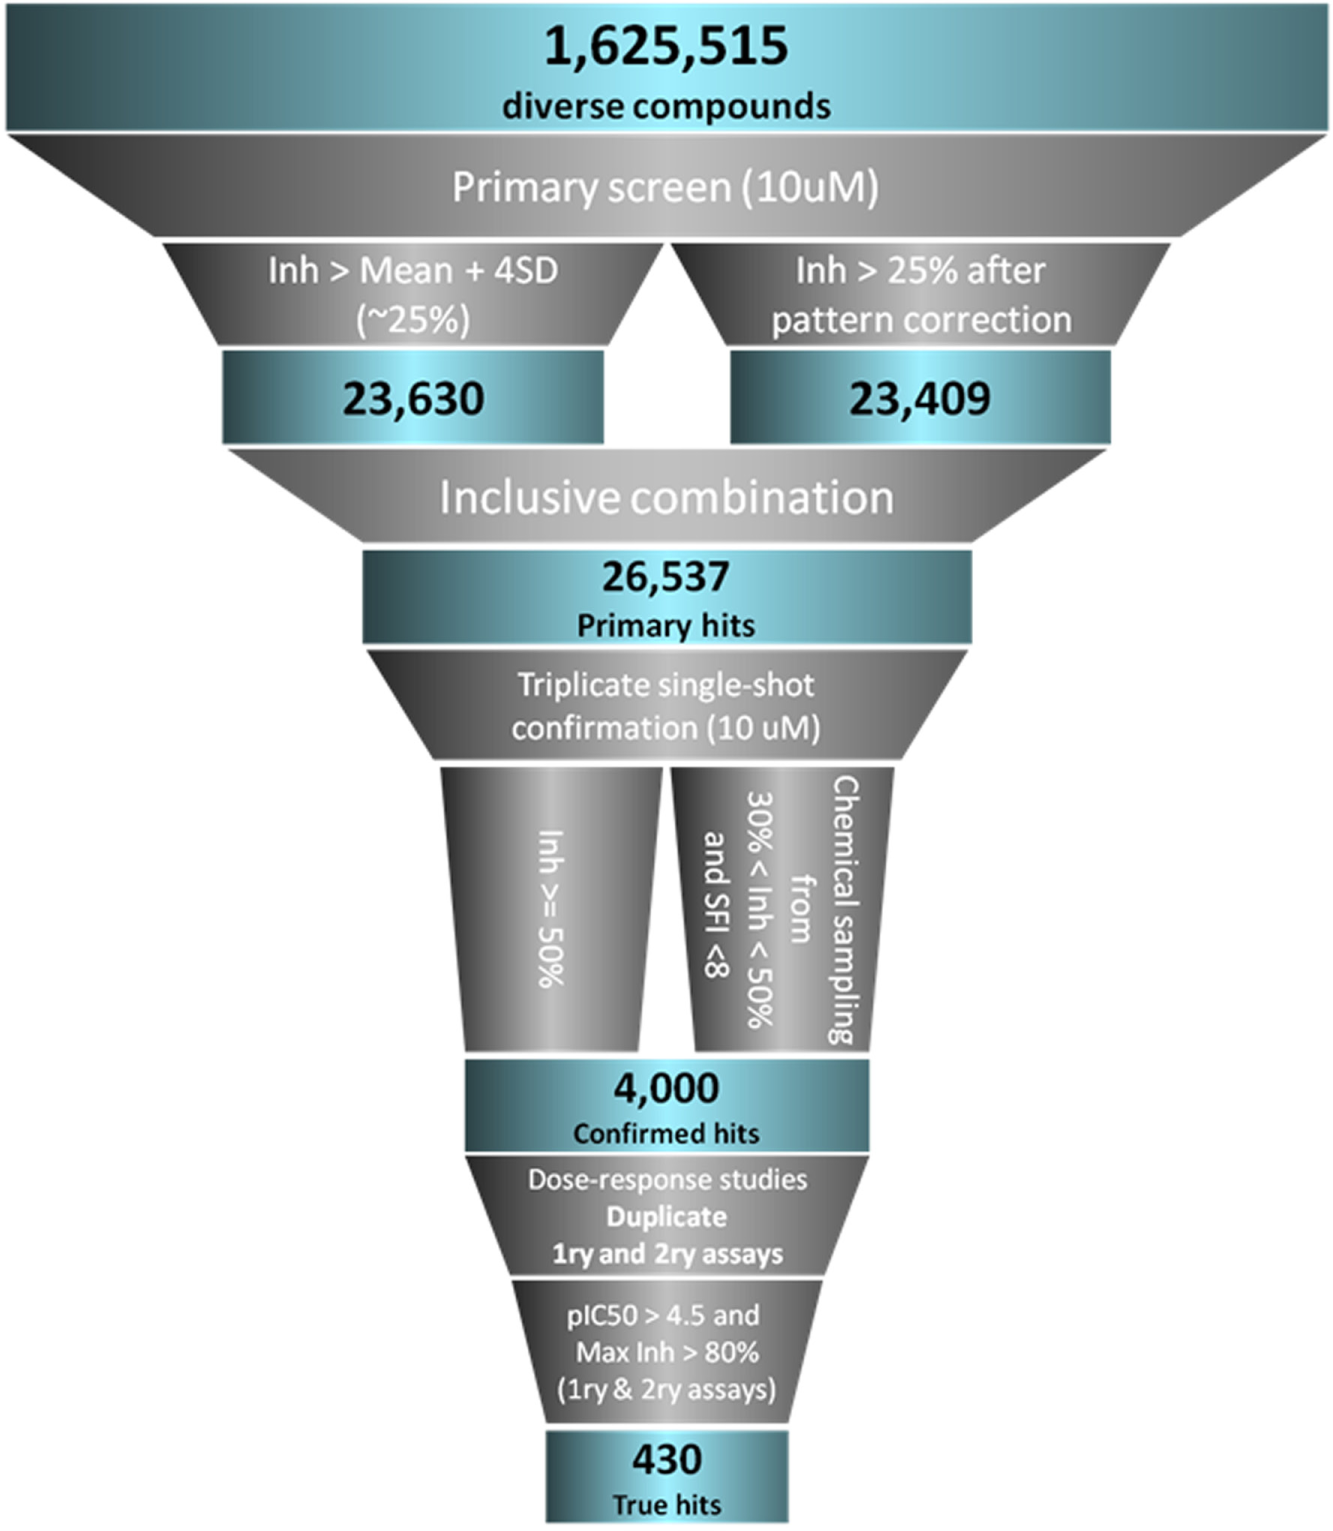
Schematic view of the HTS triaging tactics. Blue boxes show the size of the population of compounds at each stage, and gray funnels show assays or analyses used to select them.
FT-MoI Studies
The main goal of FT-MoI is a quick prioritization of compounds after HTS. These experiments are a compromise between the information-rich but low-throughput detailed mechanistic studies and the quick but limited HTS results, which only convey information about apparent potencies under specific experimental conditions. We applied this methodology to the 430 selected hits in order to identify and flag putative slow-binding, promiscuous, and irreversible/tight-binding inhibitors ( Fig. 5 ).
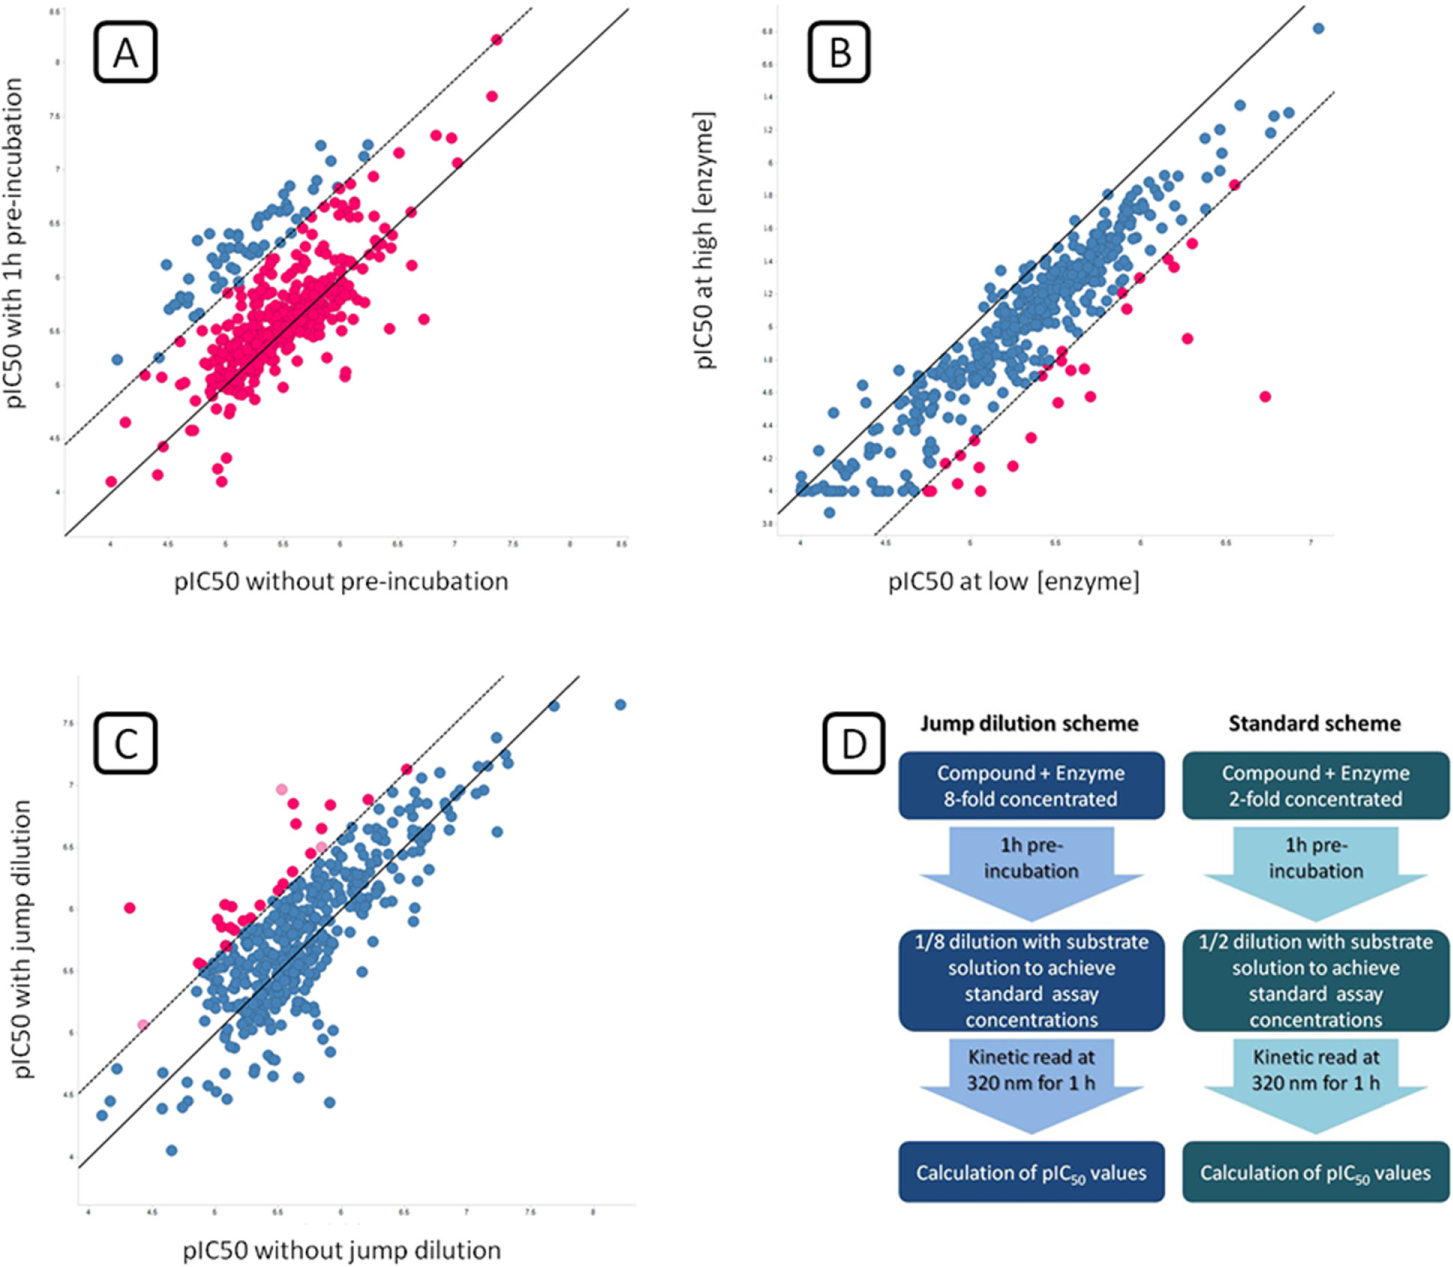
Fast-track mode-of-inhibition studies. 2D plots showing inhibitory potencies of selected hits under different conditions for identification of slow-binding (
A total of 59 compounds were classified as potentially slow-binding inhibitors (blue in Fig. 5A ). Only 35 compounds showed significantly decreased pIC50 when tested against a higher enzyme concentration and were flagged as potentially promiscuous inhibitors (magenta in Fig. 5B ). In the case of irreversibility studies by jump dilution, 29 compounds would appear to be potentially irreversible or tight-binding inhibitors (magenta in Fig. 5C ), but uncertainty exists for 3 of them (light magenta), as they had also been identified as enzyme concentration dependent, and this is a clear confusion factor for jump dilution experiments.
Compound Clustering
Compounds were clustered by using a complete linkage hierarchical algorithm, 29 which resulted in 178 clusters (including 102 singletons). By focusing on the clusters containing members with pIC50 > 6, ligand efficiency (LE) > 0.3, and not showing irreversible or promiscuous binding, there remain 17 clusters/singletons. Exemplars from these clusters are shown in Table 1 , together with the pIC50 in the primary and secondary assays, the mode-of-inhibition (slow/fast binders) flag, and the physicochemical parameters clogP and molecular weight.
Exemplars of the Final Selection of Hits.
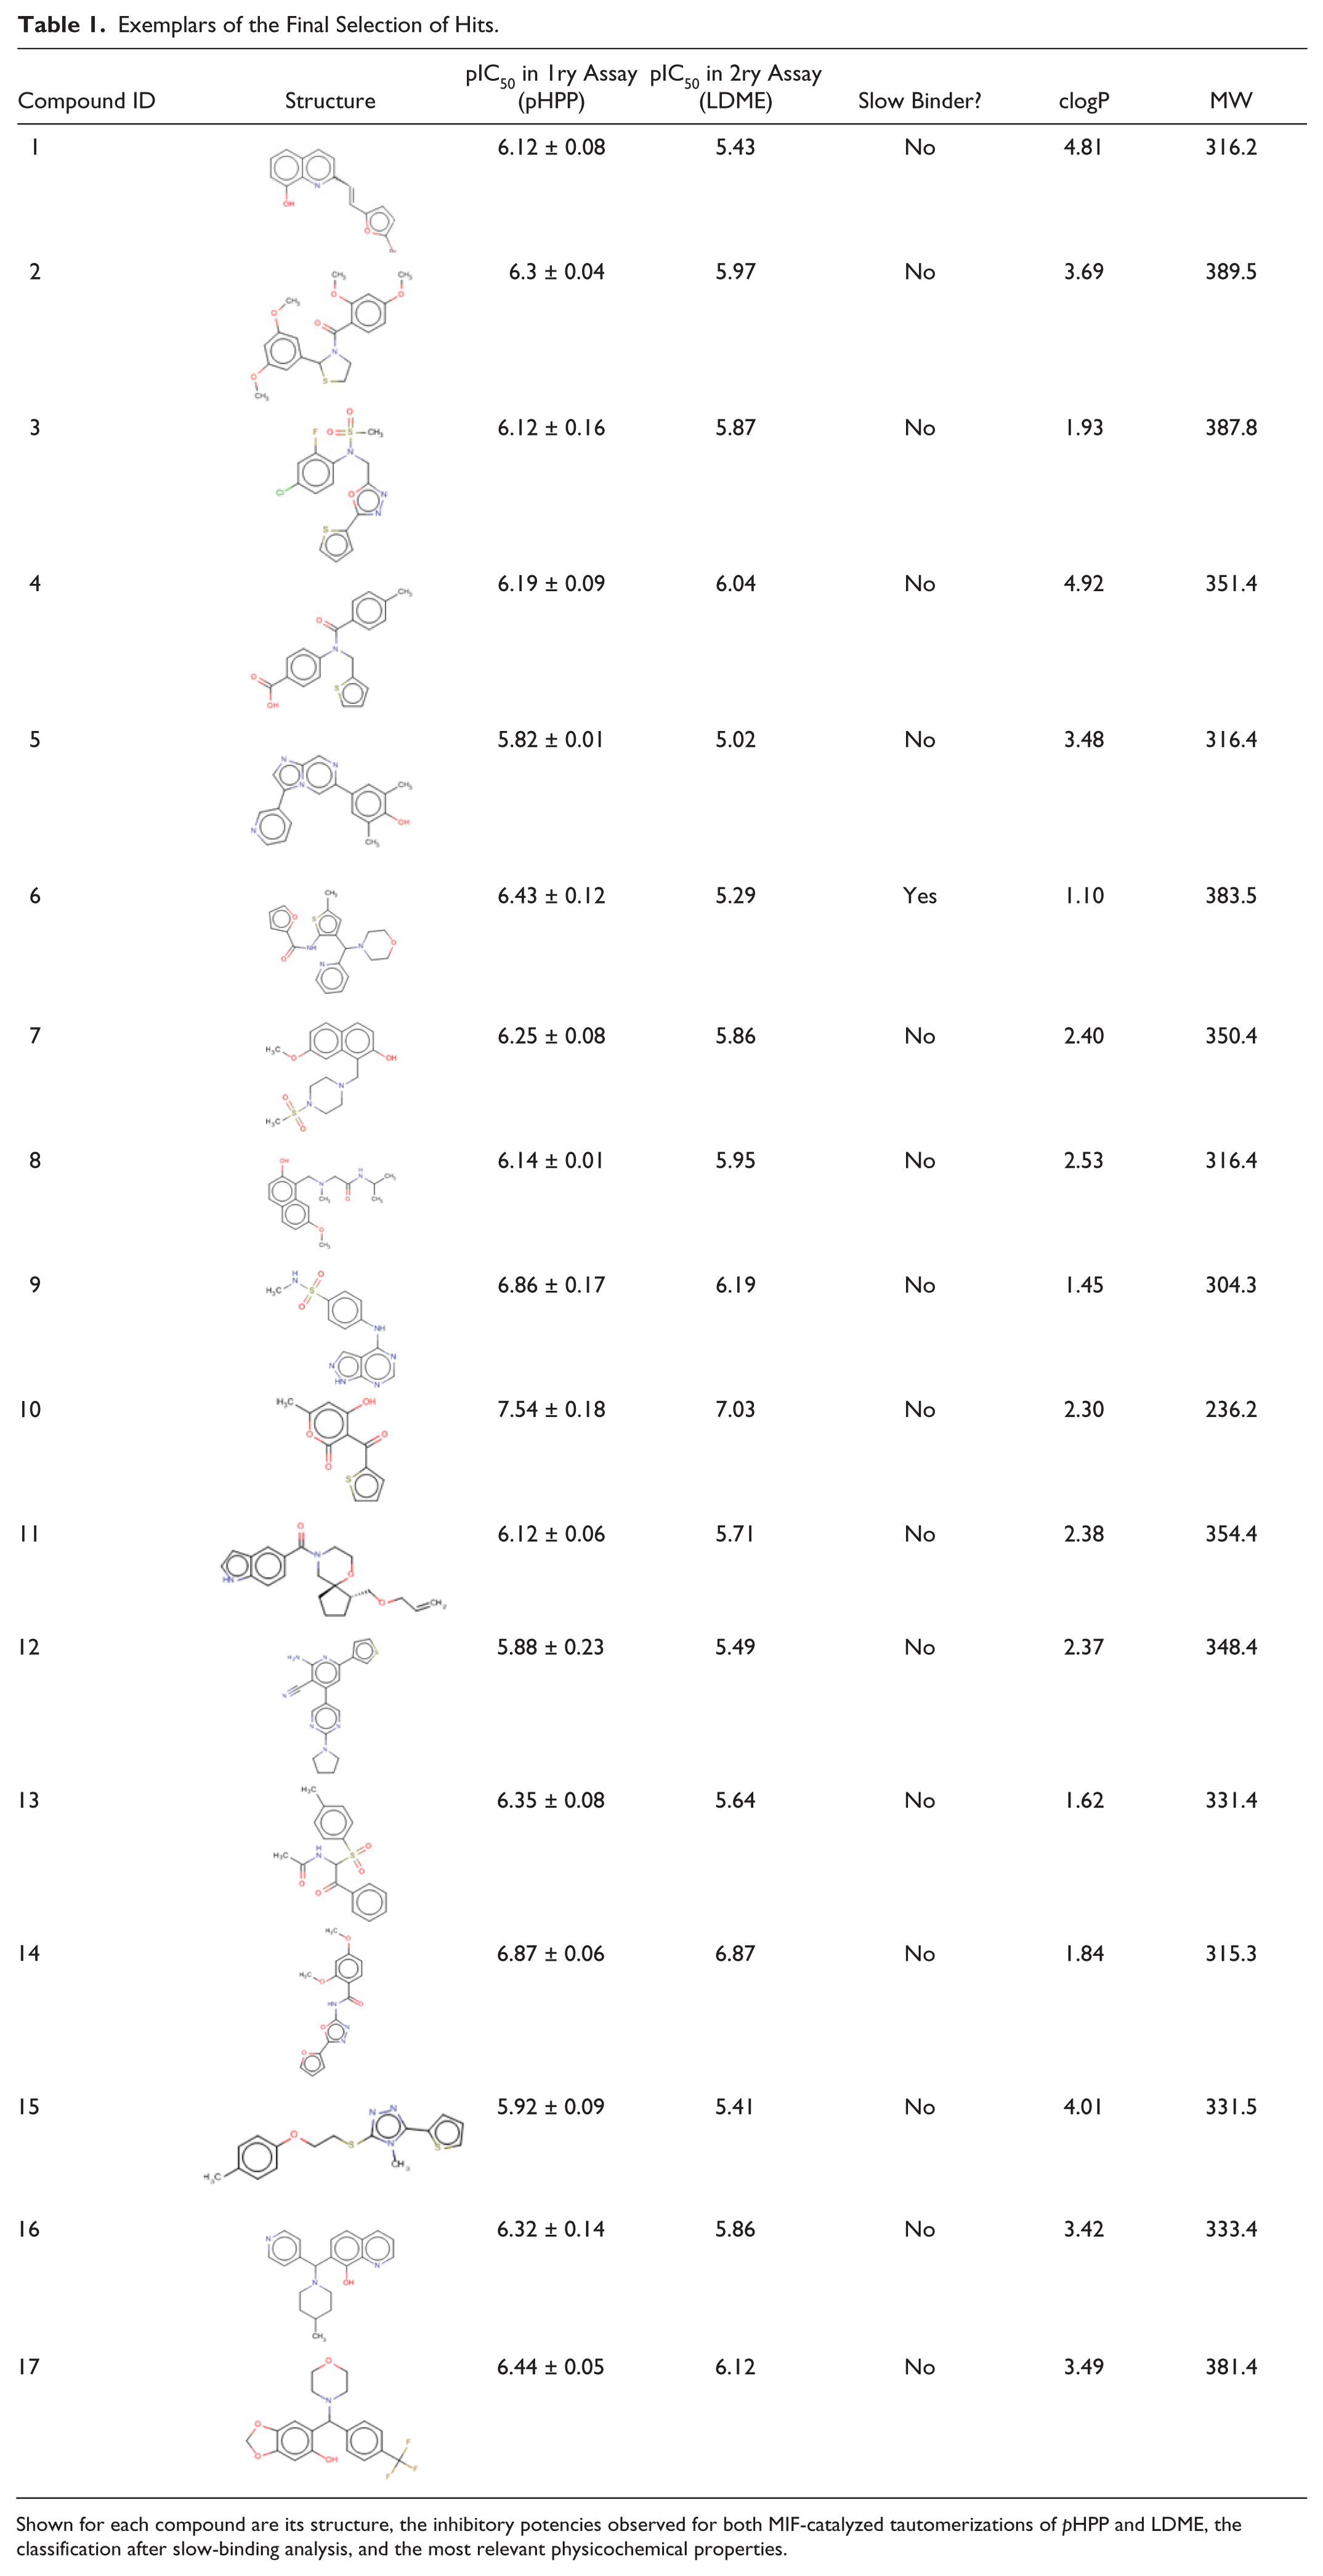
Shown for each compound are its structure, the inhibitory potencies observed for both MIF-catalyzed tautomerizations of pHPP and LDME, the classification after slow-binding analysis, and the most relevant physicochemical properties.
Discussion
The pleiotropic nature and wide distribution of MIF have triggered numerous therapeutic hypotheses based on its inhibition for the treatment of proliferative, immunoinflammatory, metabolic, infectious, and neurological diseases. This target owes its name to the first effect observed, namely, inhibition of macrophage migration, but it has subsequently been shown to be involved in many other biological processes. Its cell surface receptor was reported to be CD74, and this would explain some of its effects, such as B-cell survival. Additionally, MIF is known to penetrate into cells and exert some of its effects there. MIF displays two enzymatic activities: oxidoreductase and tautomerase. Little is known about the differential relevance of these two activities for its biological roles, as most in vivo work has been carried out using gene knockout. The tautomerase activity has been reported to be associated with most of its effects. 30
Screening the full-diversity compound collection required development of a miniaturized and robust assay, a significant hurdle that has hampered screening of large collections in the past. The most relevant challenges are nonenzymatic tautomerization of the substrate and short ranges of linearity of the progress curve with time. For known nonphysiological substrates of MIF tautomerase, spontaneous tautomerization is not negligible and contributes significantly to the observed reaction rates. Although this source of error can be compensated for by including no-enzyme controls and using kinetic readouts, it is highly desirable to minimize it in order to expand the assay window and avoid deviations in the kinetics of the reaction due to nonenzymatic disappearance of substrate. For this reason, we decided to explore alternative substrates for MIF tautomerase with improved stability. In parallel, we devoted effort to improving the protocol for preparation of pHPP and optimized the assay to extend the linear phase of the reaction while maintaining the signal window and sensitivity toward competitive and noncompetitive inhibitors. As potential alternative substrates, we tested 25 different ones, but none of them was selected as a better option than pHPP, so we gave up that line of work. In contrast, we succeeded in optimizing the assay using pHPP to the point of being able to miniaturize it down to a 1536-well plate format and extending the linearity up to 60 min, so we selected this substrate for our full-diversity HTS campaign. The HTS assay protocol we developed was further validated with a representative subset of the screening collection and was deemed fit for purpose after checking its robustness, reproducibility, false positives, false negatives, and hit rates.
During the primary screening campaign, we observed the expected behavior based on estimations from screen validation. One of the risks in using spectrophotometric assays with low wavelengths for screening is that many organic compounds absorb light in that region of the spectrum (below 350 nm). In this respect, using kinetic mode readouts is one of the best approaches to minimizing the interference. An inactive colored compound will generate a progress curve with a higher initial absorbance, but will not affect its slope, so it will not be marked as a hit.
Because the substrate tautomerizes spontaneously to a detectable extent, it is crucial to subtract the slope of spontaneous product generation from the total observed slope of signal increase, allowing a more accurate calculation of the initial rate of the enzyme-catalyzed reaction. Our screening tactics achieve this goal by normalizing data with respect to a set of controls (positive controls) in each plate with no enzyme.
The compounds in
Table 1
represent a wide diversity of chemotypes. An exact search in ChEMBL for these structures did not show any annotation for MIF activity, except for compound
From the point of view of mode of inhibition, only one of the compounds in
Table 1
(compound
Footnotes
Acknowledgements
The authors thank Han Xu and Warren Rocque for provision and quality control of the enzyme, and Carmen Magan and Francisco de Dios for their valuable contributions to screening operations.