
Abstract
Background:
Previous studies have suggested the involvement of an activated inflammatory process in major depressive disorder (MDD), as altered expression of inflammatory cytokines is observed in depression. This alteration can be the cause or a consequence of MDD. However, acknowledging inflammatory cytokines as prospective biomarkers would aid in diagnosing or guiding better therapeutic options. Therefore, we designed this study to assess the macrophage migration inhibitory factor (MIF) in depression.
Method:
We collected blood samples from 115 MDD patients and 113 healthy controls (HCs) matched by age and sex. MDD patients were diagnosed by a qualified psychiatrist based on the symptoms mentioned in the diagnostic and statistical manual of mental disorders (DSM-5). We applied the Hamilton depression (Ham-D) rating scale to assess the severity of depression. We assessed serum levels of MIF using ELISA kit (Boster Bio, USA).
Result:
We detected increased serum MIF levels in MDD patients compared to HCs (6.15 ± 0.23 ng/mL vs 3.95 ± 0.21 ng/mL, P < 0.001). Moreover, this increase is more among female patients than female controls. Also, we noticed a positive correlation between altered MIF levels and the Ham-D scores (r = 0.233; P = 0.012), where we found that patients who scored higher on the Ham-D scale had higher MIF levels in serum. Moreover, the area under the curve (AUC) of receiver operating characteristic (ROC) curve represented the good diagnostic performance of altered serum MIF.
Conclusion:
Our study findings indicate the association of pro-inflammatory cytokine MIF in the pathophysiology of depression as we identified elevated serum MIF levels in depressive patients compared to HCs. However, more researches are required to confirm whether this alteration of cytokine is the causative factor or a consequence of depression. We recommend conducting further studies to understand the pattern of this alteration of MIF levels in MDD patients.
Introduction
Major depressive disorder (MDD) has become alarming among all neuropsychiatric conditions due to being declared the prime cause of disability and its contribution to the global disease burden. According to WHO, globally, depression affects about 280 million people, which represent 3.8% of the global population. 1 Prevalence of MDD is more common in younger (18-25 years) and older (more than 65 years) people and women appear to be more prone to it than men for multiple reasons like hormonal issues, psychosocial stress, and the behavioral norm of emotional exhaustion.2,3 MDD is an intricate and inhomogeneous disorder, as the symptoms and diagnostic criteria for MDD are similar to other mood disorders, like bipolar depression.4,5 So, there is a need to find a determining factor that would help to distinguish between mood disorders other than assessing based on just diagnostic and statistical manual of mental disorders (DSM-5) criteria. 4 Regardless of the availability of several antidepressant medications, around 30% of people diagnosed with MDD fail to respond antidepressant therapy.6,7 It may be because these antidepressants are designed for improved mono-aminergic transmission 8 whereas other biological events, including alteration in cytokine production,9,10 hyperactive hypothalamic-pituitary-adrenal (HPA) axis,11,12 and deregulation of glutamatergic activity, could be the hypotheses of underlying pathophysiology of MDD. 13 Therefore, current concerns are on identifying novel biomarkers that could justify the pathophysiology of depression and help to diagnose MDD more accurately, and contribute to discovering more appropriate treatment choices for MDD patients.
Till now, there have no established biomarkers that could be used in diagnosing or guiding therapy for MDD, although mounting evidence from previous studies has observed alteration in the levels of various biological components, including cytokines, microRNAs, stress hormones, growth factors, malondialdehyde (MDA), and antioxidant enzymes in MDD patients.14-18 Our previous findings have identified alterations in peripheral cytokine levels, growth factors, enzymes, and hormones, postulating the contribution of these markers in developing MDD via various biological pathways.19-24 Among all, inflammatory cytokines show a prominent role in the pathogenesis of depression and thus can be a potential biomarker for depression.25,26
Cytokines are proteins released in response to innate or adaptive immunity. According to reports, the access of peripheral cytokines into the brain is possible through the permeable blood-brain barrier (BBB) and consequently alters the normal functioning of brain activity. 27 Peripheral inflammation can also influence microglia and astrocytes to generate cytokines.28,29 Continuous cytokine increase can lead to depression by causing alteration in neurotransmitters, increasing glutamatergic activity, and promoting neurodegeneration by lowering brain-derived neurotrophic factor (BDNF) activity and hyperactivating the HPA axis.8,28,30-33 According to the cytokine hypothesis, pro-inflammatory cytokines stimulate the enzyme called indoleamine 2,3-dioxygenase (IDO), responsible for tryptophan metabolism, and convert it to kynurenine, a neurotoxic metabolite. It eventually leads to a deficiency in tryptophan required for serotonin synthesis. As a result of the lower availability of serotonin, MDD develops.34,35 In addition, Cytokines induce serotonin reuptake by increasing the expression of reuptake transporters, resulting in serotonin depletion.26,36 According to research, an overactive HPA axis is another pathway that may contribute to MDD. 37
Macrophage migration inhibitory factor (MIF) is released by macrophages and monocytes or secreted by HPA axis cells such as pituitary and endocrine cells. 38 MIF triggers the inflammasome process and is recognized as a contributor to the development of MDD.39-41 MIF modulates innate mechanisms and inflammatory signaling by stimulating the production of pro-inflammatory cytokines such as IL-1 and TNF, activating the IDO pathway, and synthesizing neurotoxic metabolite kynurenine. Therefore, MIF plays vital role in the pathophysiology and development of several diseases.42-44 The IDO pathway and its metabolites might be involved in the pathophysiology of neuropsychiatric diseases such as MDD. 45 MIF, on the other hand, inhibits glucocorticoid activity, resulting in a disturbance of the HPA axis. 46 The suppression of the anti-inflammatory effect of glucocorticoids also triggers the production of pro-inflammatory cytokines, thereby contributing to MDD. Previously, few studies were conducted on identifying the alteration of MIF in MDD patients and discovered variable observations. It stated elevated and reduced MIF levels in serum.47,48 A review report claimed that MIF levels increased during MDD. 35 Individuals having mild to moderate depression showed higher levels of MIF compared to healthy individuals. 37
Previous research showed an intriguing involvement of MIF in the etiology and pathophysiology of MDD, although those findings differed. As a result, it is required to gather more evidence regarding the role of MIF in the pathophysiology of MDD. As there are no recognized determining variables available for the diagnosis of MDD, identifying MIF as a potential biomarker might aid in distinguishing MDD from other psychiatric diseases and provide an alternate strategy for improved therapeutic response. So, we intended to perform this study on the Bangladeshi MDD patients. We evaluated the levels of serum MIF in MDD patients compared to healthy controls (HCs). Furthermore, we attempted to discover the correlation between MIF levels and the severity of the disease.
Methods
Study participants
We calculated sample size for this cross-sectional study based on a confidence level of 95% and an acceptable error of 5%. According to the estimation, we had to recruit 100 MDD patients for better statistical power for this study. So, we collected blood samples from 115 MDD patients from the IPD and OPD section of the Department of Psychiatry of a recognized hospital in Dhaka city and 113 HCs with an age limit of 18 to 60 years. We followed simple random sampling method for the recruitment of study participants. However, we tried our best to avoid selection bias. We attempted to improve the generalizability of this study as we recruitment of MDD patients from a tertiary care teaching hospital. Generally, psychiatric patients from all over the country come to this hospital for better healthcare facilities and specialized care. Therefore, cases from this center ensure the national representativeness of the sample. MDD patients were diagnosed and HCs were assessed by a qualified psychiatrist based on criteria quoted in DSM-5. We applied Hamilton Depression (Ham-D) Rating Scale to evaluate the severity of depression. We assessed HCs by asking questions and evaluating their medical records if available by qualified physicians. We included patients who scored higher than 7 on the Ham-D assessment scale. We did not include MDD patients having other mental disorders or comorbidities like an infectious disease, cardiovascular disease, or endocrine disorder. In addition, we excluded patients who were on medications or any other substance use that could interfere with the serum level of our target component, MIF. Also, we assessed the presence/absence of somatic. We recorded the data of the study participants using a predesigned questionnaire. All study participants were informed about the purpose of our study, and we sought their consent before sample collection.
Blood samples collection and processing
We took written consent from each participant involved in the study and interviewed them according to a structured questionnaire. Then, we collected 5 mL of blood samples from their cephalic vein and stored in a falcon tube. It was then kept for coagulation at room temperature for 30 minutes. After that, we centrifuged it for 15 minutes at 3000 rpm and obtained a transparent serum in an Eppendorf tube. We preserved the samples for analysis at −80°C until further analysis.
Cytokine measurement
We measured the serum MIF levels using the human MIF ELISA kit EZ-Set (Boster Bio, USA). We followed the manufacturer’s instruction to analyze samples. We added 100 µL of the test samples and reference samples to the proper wells designed on the 96-well micro-plates that was prepared earlier, and we placed the plates at room temperature for 120 minutes after sealing the plate with the plate sealer. Then we discarded the liquid. Subsequently, we added 100 µL of Biotinylated goat anti-human MIF polyclonal antibody to each well. After that, we resealed the plates and incubated them at 37°C for 60 minutes. Afterward, we rinsed the plate with 300 µL of phosphate buffer solution (PBS). After the rinsing, we added 100 µL of Avidin-Biotin-Peroxidase Complex (ABC) in each well and placed these plates for incubation at room temperature for 40 minutes. Then we washed these plates 5 times with PBS after aspirating the content. We filled each well with 90 µL of Tetramethyl-benzidine and placed in the dark at room temperature for 30 minutes. Lastly, we ceased the reaction by adding 100 µL of the stop solution and measured the absorbance within 30 minutes of ending the process. The detection of this ELISA kit was 156 to 10 000 pg/mL (Catalog Number: EZ0813). Also, there were no detectable cross-reactivity with other relevant proteins or cytokines. Following this, we calculated the concentration of MIF and expressed the values as ng/ml. We conducted the entire experiment with the same research personnel to avoid variability.
Statistical analysis
Following the data collection, we used Excel version 16 to compile all the data of patients and controls and completed the data processing. We compared the study parameters of the participants using independent sample t-test and Chi-square test of SPSS version 25. Additionally, we identified the correlation between serum MIF levels and Ham-D scores by Pearson correlation test. Our main findings were visually expressed in error bars and scatter plot graphs. In addition, we analyzed the diagnostic performance of altered MIF levels using the ROC curve analysis. We considered the findings significant according to the P-value, set at 0.05 or less.
Results
Sociodemographic profile of study participants
In Table 1, we showed the sociodemographic attributes of our study participants. We witnessed no significant difference for BMI (patients: 23.44 ± 0.36 kg/m2, controls: 24.11 ± 0.33 kg/m2, P = 0.246) between patients diagnosed with MDD and HCs (Table 1). Among all participants, the number of females was higher (patients: 66.09%, controls: 54.87%) than male participants (patients: 33.91%, controls: 45.13%). As mentioned in Table 1, most depressed patients belong to urban areas with lower incomes and are nonsmokers.
Socio-demographic profile of the study population.

Abbreviations: BDT, Bangladeshi taka; BMI, body mass index; CED, chronic energy deficiency; MDD, major depressive disorder; SEM, standard error mean.
Clinical and laboratory findings
In our investigation, we evaluated serum MIF levels in study participants and observed higher serum MIF levels in MDD patients than in controls (patients: 6.15 ± 0.23 ng/mL, controls: 3.95 ± 0.21 ng/mL, P < 0.001), as shown in Table 2 and Figure 1. Moreover, this upregulation of serum MIF levels are more among female MDD patients than female HCs (6.19 ± 0.29 ng/mL vs 3.07 ± 0.24 ng/mL; P < 0.001). These results can be explained by our findings where we observed that prevalence of depression and its severity are higher among females. Our secondary aim was to define the relationship between serum MIF levels and the Ham-D scores of study participants, and we discovered that patients who scored higher on the Ham-D scale showed higher serum MIF levels, as shown in Figure 2 (r = 0.233; P = .012).
Clinical features and laboratory outcomes of the study participants.
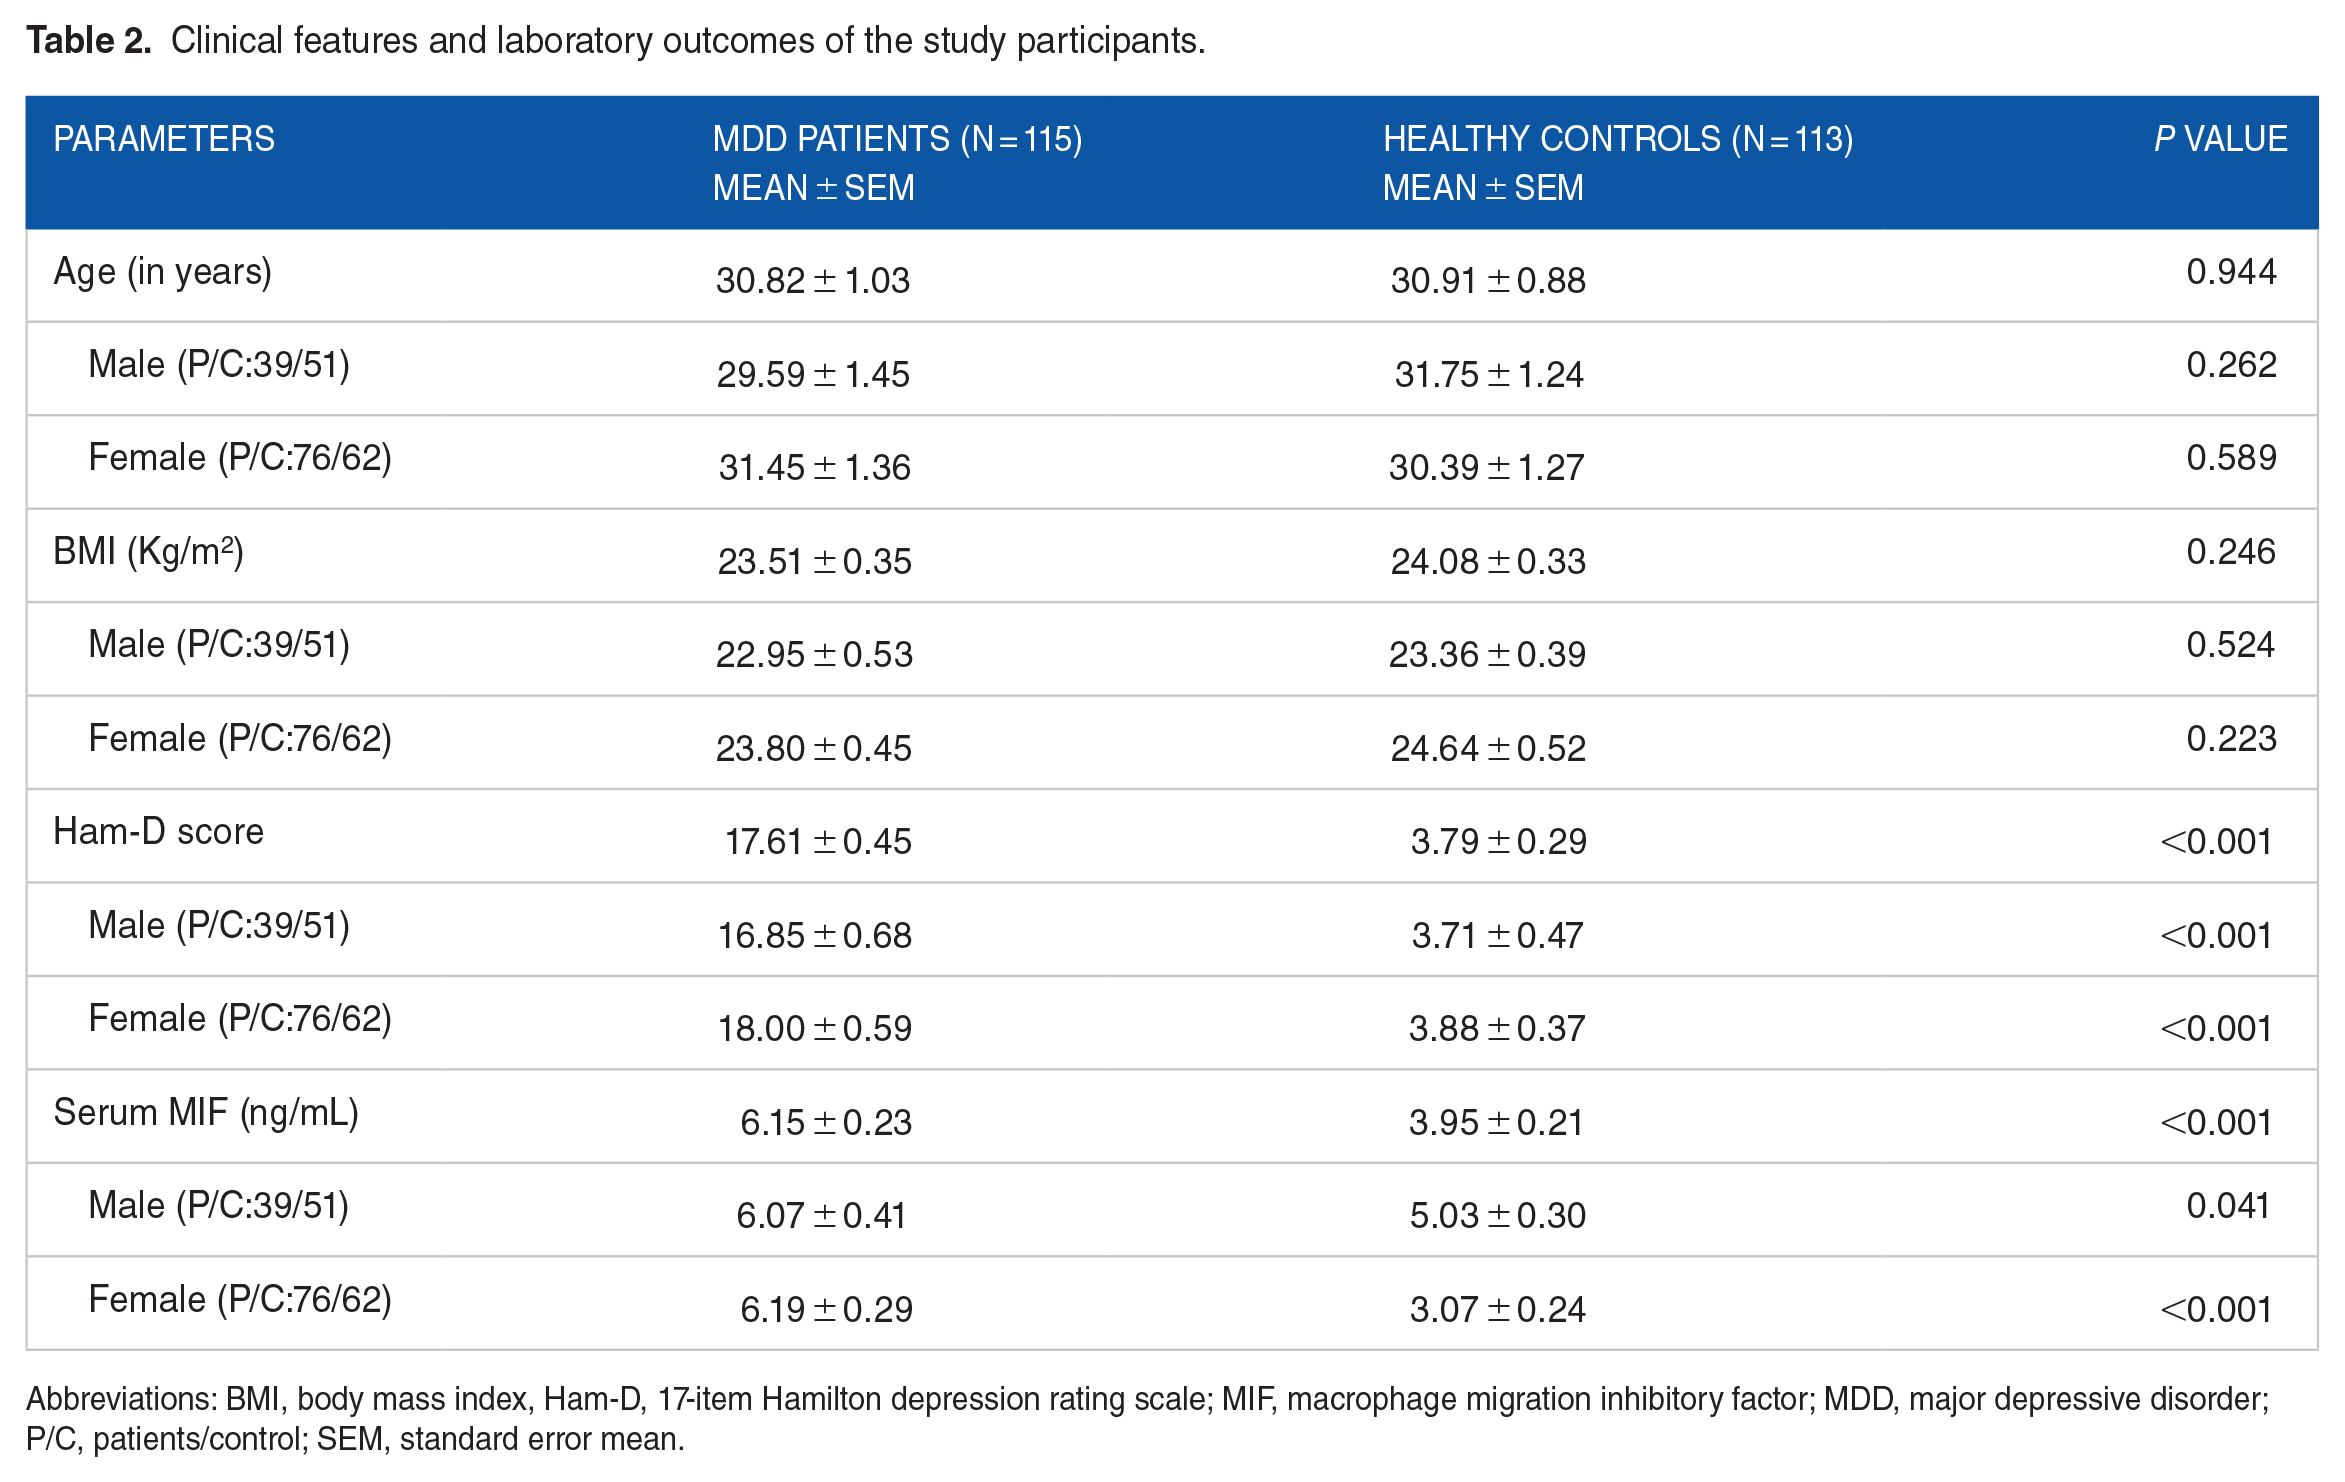
Abbreviations: BMI, body mass index, Ham-D, 17-item Hamilton depression rating scale; MIF, macrophage migration inhibitory factor; MDD, major depressive disorder; P/C, patients/control; SEM, standard error mean.

Error bar graphs showing mean and standard error mean of serum MIF levels among study participants.

Sex-specific scatter plot graph of serum MIF levels and Ham-D scores of study participants.
Diagnostic performance of altered MIF
We did the ROC curve analysis to evaluate the accuracy of the diagnostic performance of altered MIF levels (Figure 3). From this analysis, we observed that area under the curve (AUC) value of serum MIF was 0.839, and the cut-off value was 4.70 ng/mL. Also, the sensitivity, specificity, positive predictive value (PPV), and negative predictive value (NPV) of serum MIF were 77.1%, 70.5%, 83.4%, and 85.7%, respectively (Table 3). According to the ROC analysis, the AUC value was in the range of 0.8 to 0.9, indicating the good predictive performance of MIF.
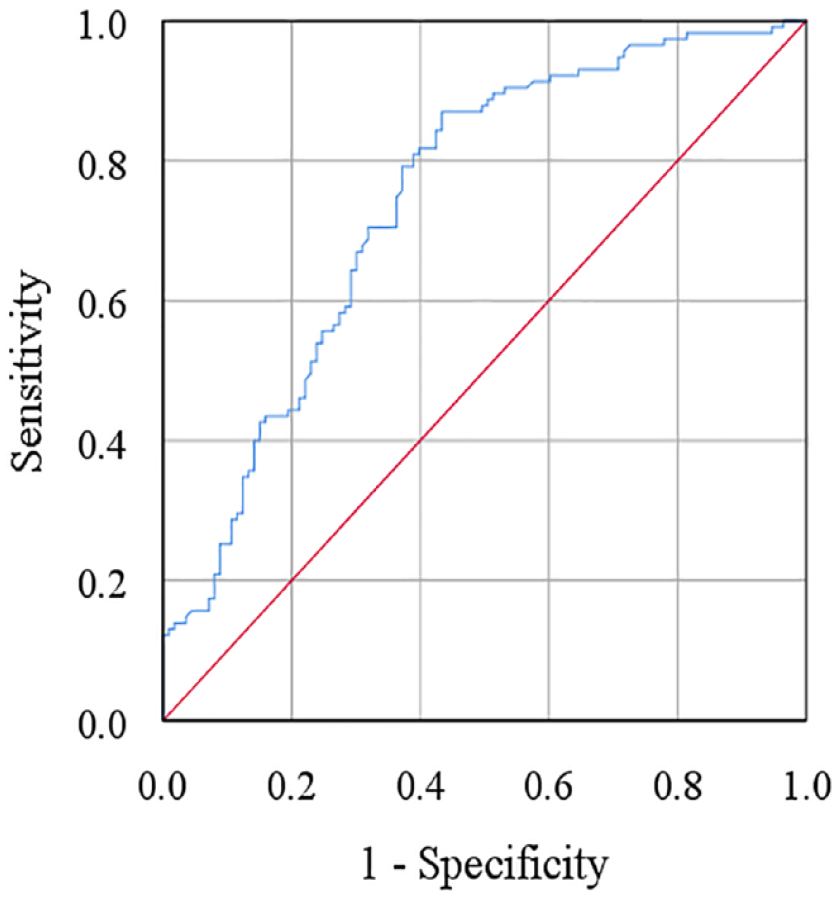
Receiver operating characteristic (ROC) curve for serum macrophage migration inhibitory factor. The cut-off point was detected as 4.70 ng/mL.
Receiver operating characteristic curve analysis of serum macrophage migration inhibitory factor.

Abbreviations: AUC, area under the curve; CI, confidence interval; MIF, macrophage migration inhibitory factor; PPV, positive predictive value; NPV, negative predictive value.
Discussion
There are no confirmed biomarkers available that could help to diagnose or in providing therapeutic alternatives for MDD patients. According to our findings, we observed elevated levels of MIF in MDD patients compared to HCs. Our finding supports the cytokine hypothesis stating an alteration in the serum cytokine levels in depressive patients. Simultaneously, we detected a positive correlation between the Ham-D scores and the altered MIF levels in serum. We observed that the expression of MIF levels was higher in MDD patients with higher Ham-D scores.
Few studies on MDD have replicated our findings. Musil et al investigated 32 MDD patients and 20 HCs, where the authors discovered an elevation in the serum MIF levels compared to HCs. 47 Similarly, Edwards et al found a positive association with depressive symptoms in their study of 126 patients. The authors stated that there was a 40% higher level of MIF in participants having depressive symptoms. They pointed to the link between depressive symptoms and dysregulation of biological functions, including inflammatory process and the HPA axis. 37 Petralia et al revealed contrasting evidence between animal and human studies where the increasing tendency in serum MIF levels was observed in human models, while the animal studies showed opposite results. 35 In consistent with some earlier studies, we observed sex-specific differences for serum MIF levels among patients.49-52 A few studies reported decreased and elevated MIF levels in MDD individuals.47,48 According to the present study findings and previous results, serum MIF levels are inconsistent among the studies. These might be due to the complex mechanism and pathophysiology of major depression. Moreover, multiple internal and external factors are involved in the development and progression of depression. Also, these differences in findings can be due to the methodological variations across the studies.
This current study has a few unique findings that make it more significant. In this study, we did the ROC curve analysis to ensure the accuracy of the diagnostic performance of altered MIF levels. For ROC analysis, there are a set of ranges between 0.9 and 1.0, 0.8 and 0.9, 0.7 and 0.8, and 0.6 and 0.7, expressing excellent, good, fair, bad, and not useful performance for this analysis.53-55 We determined the AUC value, the variable of this analysis that determines the accuracy of the MIF as a diagnostic marker for screening depression. 56 The AUC value for our study is 0.839, which fits in the range of 0.8 and 0.9, implying good accuracy of altered MIF levels. Although prior research on MIF found a link between higher MIF levels and depression, they didn’t perform the diagnostic accuracy tests of altered MIF levels for identifying depression, 57 as we performed and shown in Table 3 and Figure 3. We also discovered a link between Ham-D scores and altered serum MIF levels. Our study observed the altered MIF levels are related to the severity of MDD, whereas previous research didn’t find such association of serum MIF levels with the severity of MDD patients. 57
Evidence suggests that remission or partial remission is often observed among MDD patients when treated with currently available therapeutic approaches. 58 Available therapeutics are designed based on the monoamine theory, which focuses only on restoring the neurotransmitters rather than on the cause of the disease. Elevated inflammatory variables are related to insufficient response to antidepressants which can be possible diagnostic and therapeutic targets for MDD.59-64 Anti-inflammatory agents or immunomodulators can be prescribed as monotherapy or with antidepressants to combat MDD, as stated by authors after conducting a randomized clinical trial. These clinically evaluated anti-inflammatory drugs, including minocycline, statins, pioglitazone, and glucocorticoids, cytokine inhibitors, were observed to have a counter-effect on depressive symptoms. 65 Monoclonal antibodies targeting TNF-α and the anti-IL-6 receptor antagonist tocilizumab can reduce depressive symptoms. 66 Cattaneo et al observed an association between the responses of MIF and IL to escitalopram. 59 Shi et al asserted a reduction in MIF levels in depressive patients after treatment with lamotrigine. 67 In addition to pharmacotherapy, a study revealed that psychotherapy could be an approach to minimize symptoms. A study by Wang et al discovered a reduction in MIF levels after intervention with psychotherapy. 68 Apart from pharmacotherapy and psychotherapy, a few supplements exert a beneficial effect on depressed patients. Omega-3 fatty acids, zinc, and vitamin B12 might help with depression by minimizing symptoms.69-71 Previous research has found that an imbalance of antioxidants and macro-minerals may contribute to depression, suggesting that taking these supplements would be beneficial for MDD patients.72,73 Inconsistent with earlier findings, the present study result suggests MIF as a promising biomarker for depression as well as some treatment choices. 74
The size of the sample was one of the strengths of our study. The previous researchers evaluated the serum MIF levels in a small population, whereas we conducted this study in 115 patients, as suggested by our sample design. Secondly, we collected samples from diversified nationally representative participants. Our statistical and ROC curve analysis presented a few new findings, including a correlation of altered MIF levels with the severity of MDD and the accuracy of the diagnostic performance of altered MIF levels for screening depression.
Due to the limited resources and timeframe, we assessed the MIF levels once in MDD patients and HCs. The impact of any dietary supplement or lifestyle habit, like foods or sleep patterns, was not considered while recruiting participants. Therefore, we would recommend analyzing this cytokine at different stages. Moreover, future studies must consider the role of food habits, lifestyle habits, and sleep patterns in the development of MDD.
Conclusion
Our study observed increased serum MIF levels in MDD patients and identified a positive correlation with the severity of MDD. We need more evidence to support the findings of our study so that MIF can be considered a potential biomarker for depression. It would eventually lead to the development of therapeutic alternatives for MDD patients having remission or partial remission. However, this is yet to confirm whether these alterations are the consequence of the disease or the cause. Therefore, we recommend conducting further studies to clarify the role of MIF in leading to the development of depression.
Footnotes
Acknowledgements
We thank to the study participants and their relatives for their participation and cooperation to this study. Also, we would like to thank all physicians and administrative staffs at the department of psychiatry, BSMMU, for their cooperation and administrative support to this study.
Funding:
The author(s) received no financial support for the research, authorship, and/or publication of this article.
Declaration of conflicting interests:
The author(s) declared no potential conflicts of interest with respect to the research, authorship, and/or publication of this article.
Author Contributions
Conceptualization: Kaniz Farzana Supti, Md. Asaduzzaman, and Md. Rabiul Islam. Formal Analysis: Farhana Islam Suhee and Mohammad Shahriar. Writing – original draft: Kaniz Farzana Supti and Farhana Islam Suhee. Writing – review and editing: Sardar Mohammad Ashraful Islam, Mohiuddin Ahmed Bhuiyan, and MMA Shalahuddin Qusar. Supervision: Md. Rabiul Islam. All authors have read and approved the final version of the manuscript. Corresponding author had full access to all of the data in this study and takes complete responsibility for the integrity of the data and the accuracy of the data analysis.
Availability of Data and Materials
The authors confirm that the data supporting the findings of this study are available within the article or its supplementary materials.
Ethics Statement
The study protocol was approved by the Research Ethics Committee, University of Asia Pacific (Ref: UAP/REC/2022/104). The study was performed in accordance with the Declaration of Helsinki. We briefed about the objective and purpose of this study to the participants and obtained a written consent from each participant before participation. The consent was given by their legal guardians in the case where an individual’s thinking capacity was suspected to be impaired.
Transparency Statement
Md. Rabiul Islam affirms that this manuscript is an honest, accurate, and transparent account of the study being reported; that no important aspects of the study have been omitted; and that any discrepancies from the study as planned have been explained