
Abstract
A new class of biosensors, fluorogen activating proteins (FAPs), has been successfully used to track receptor trafficking in live cells. Unlike the traditional fluorescent proteins (FPs), FAPs do not fluoresce unless bound to their specific small-molecule fluorogens, and thus FAP-based assays are highly sensitive. Application of the FAP-based assay for protein trafficking in high-throughput flow cytometry resulted in the discovery of a new class of compounds that interferes with the binding between fluorogens and FAP, thus blocking the fluorescence signal. These compounds are high-affinity, nonfluorescent analogs of fluorogens with little or no toxicity to the tested cells and no apparent interference with the normal function of FAP-tagged receptors. The most potent compound among these, N,4-dimethyl-N-(2-oxo-2-(4-(pyridin-2-yl)piperazin-1-yl)ethyl)benzenesulfonamide (ML342), has been investigated in detail. X-ray crystallographic analysis revealed that ML342 competes with the fluorogen, sulfonated thiazole orange coupled to diethylene glycol diamine (TO1-2p), for the same binding site on a FAP, AM2.2. Kinetic analysis shows that the FAP-fluorogen interaction is more complex than a homogeneous one-site binding process, with multiple conformational states of the fluorogen and/or the FAP, and possible dimerization of the FAP moiety involved in the process.
Introduction
The ability to fluorescently label proteins has greatly advanced the field of cell biology and has allowed detailed analysis of cell physiology.1,2 The discovery and development of green fluorescent protein (GFP) provided a powerful tool to identify protein localization in living cells and to elucidate protein secretory pathways. 3 GFP and other FPs also made it possible for in vivo tracking of cellular proteins. 4 However, it took more than 30 years from the discovery of GFP until its stable expression in cells for live-cell imaging to be developed, 5 and new tools to enable that technique have been evolving ever since. Fluorogen activating protein (FAP) technology was first introduced in 2008 6 and has been successfully used to monitor receptor trafficking in live cells.7–10
FAPs are a new class of biosensors that bind specifically to small-molecule fluorogens. The binding dramatically increases the quantum yield of these fluorogens from ~0 in solution to ~0.5, which corresponds to a fluorescence intensity enhancement of up to 160,000-fold.6,11 The FAPs are human single-chain antibodies (scFvs) that present no cytotoxicity to human cells and that can be genetically fused with target proteins and expressed in living cells in a manner similar to GFP and other FPs.6,12 Maximal excitation and emission spectra for most of these FAP biosensors are similar to those of fluorescein or Cy-7, which makes the signal easily detectable with regular flow cytometers equipped with 488-nm and/or 635-nm lasers. Multiple cell signaling proteins, including G protein–coupled receptors (GPCRs), transporter proteins, and tyrosine kinase receptors, have been successfully fused with FAP tags and introduced into suspension or adherent cell lines to monitor protein trafficking in real time.8,10,11
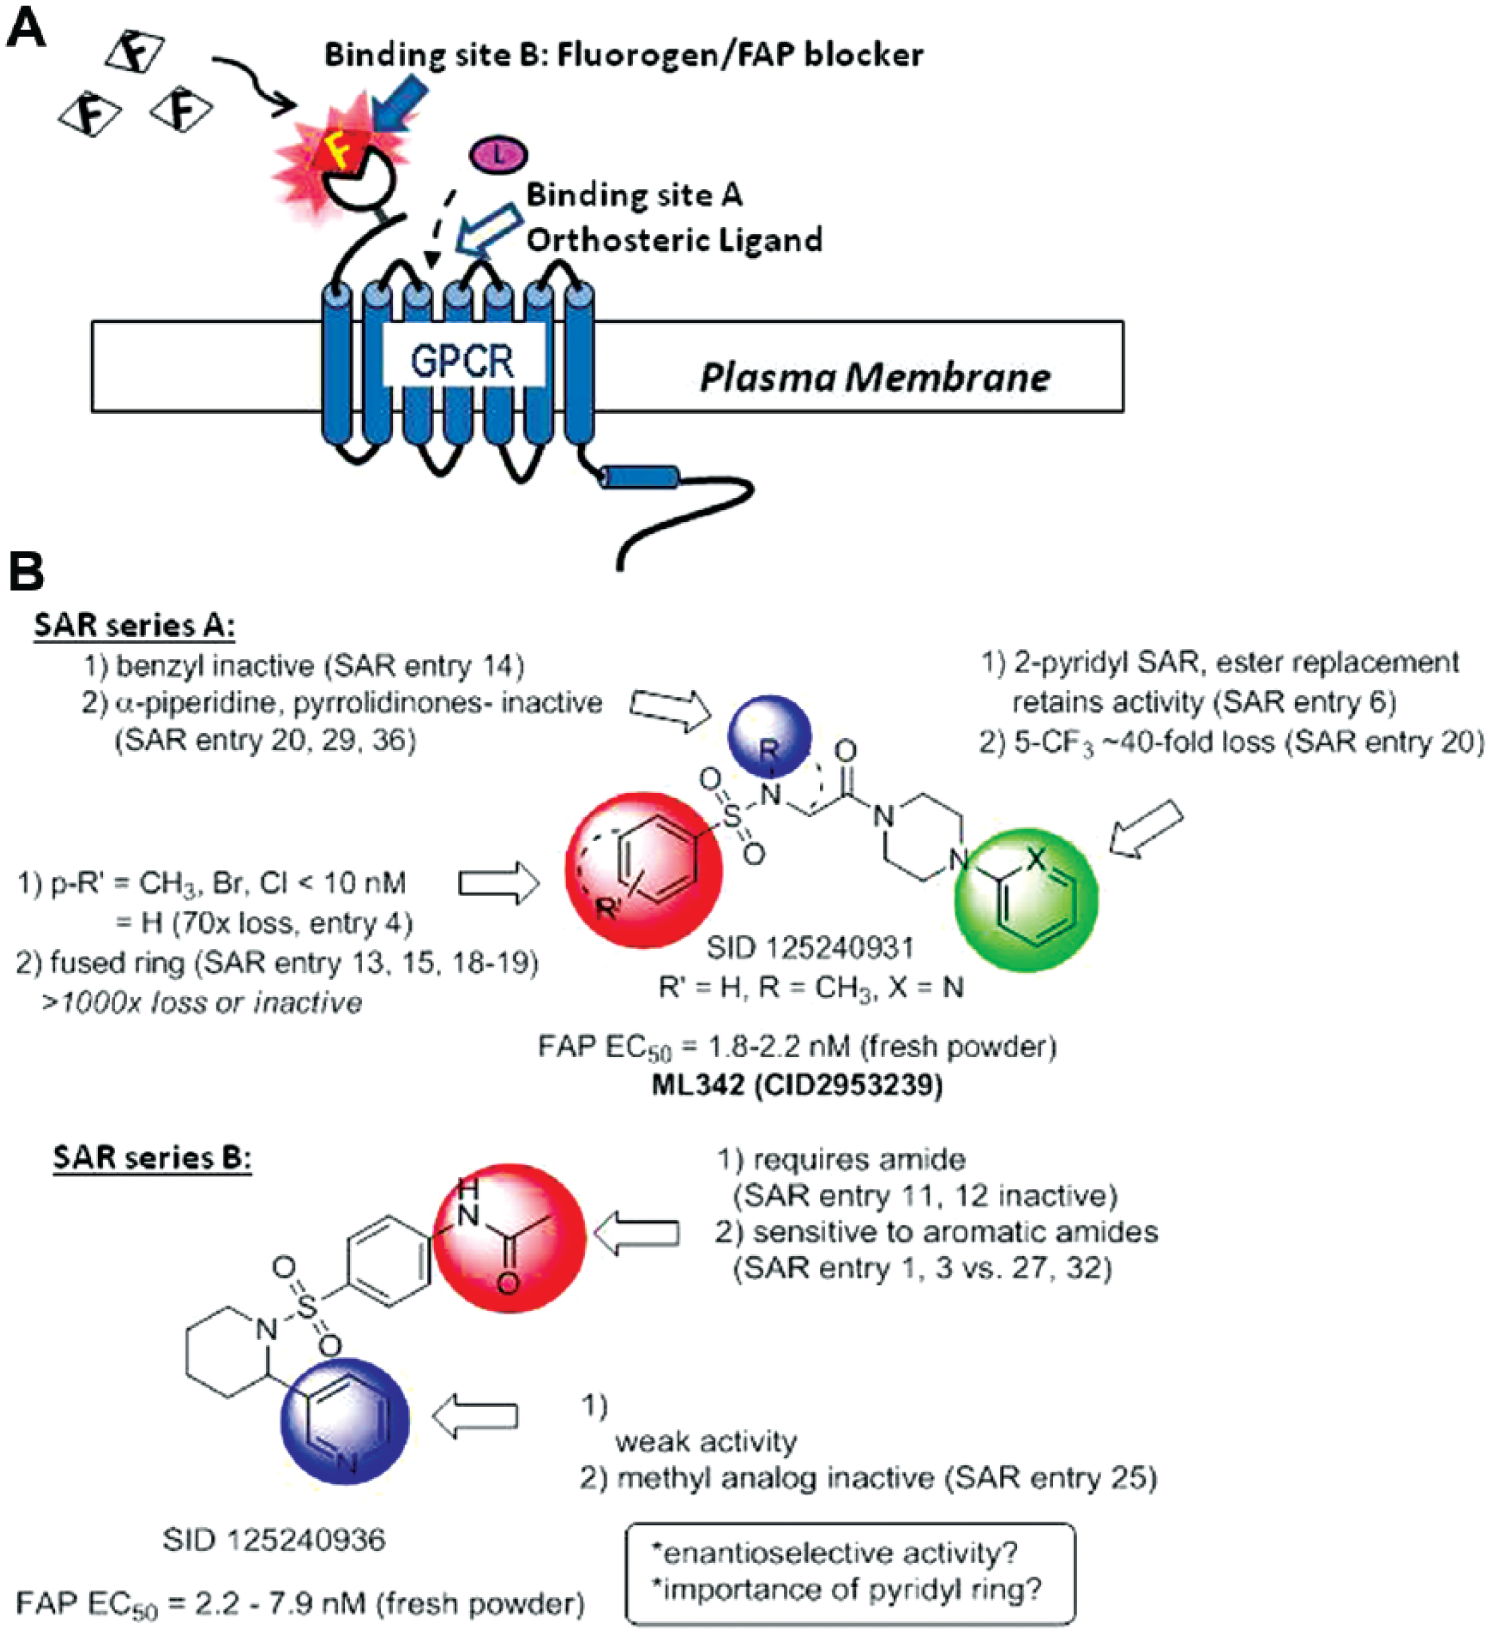
We have described a hybrid platform combining the FAP technology with high-throughput flow cytometry to identify compounds associated with protein trafficking pathways and have validated this platform for a number of GPCRs. 9 Recently, we performed a high-throughput flow cytometry (HTFC) screen against the 340,000-compound National Institutes of Health (NIH) Molecular Library Small Molecule Repository for ligands to the human β2AR. 13 Results revealed a number of false-positive molecules that blocked the binding between the fluorogen (TO1-2p) and the FAP (AM2.2). The relationship between these molecules and traditional receptor ligands is schematically illustrated in Figure 1A . Such blocking compounds, although valuable, are not relevant to β2AR activation and would be eliminated from future GPCR screens. Structure-activity relationship (SAR) analyses were performed to select lead candidates from the top FAP-fluorogen blockers, and a series of experiments were performed to investigate the affinity and cytotoxicity of these molecules.
(
The top two chemical scaffold classes identified in the SAR studies of FAP-fluorogen inhibition, piperazine and racemic piperidine, both contain compounds with excellent binding potency to AM2.2. These molecules also exhibit drug-like physicochemical and molecular properties, making them potential candidates as controls for both in vitro and in vivo assays. We synthesized the most potent FAP tag inhibitor from the piperazine scaffold, N,4-dimethyl-N-(2-oxo-2-(4-(pyridine-2-yl) piperazin-1-yl) ethyl) benzenesulfonamide (ML342). The chemical and biological properties of this compound, including solubility, stability, and affinity, as well as association and dissociation rate constants have been measured. Detailed investigation revealed that this compound selectively interfered with the binding between fluorogen TO1-2p and FAP AM2.2. ML342 has thus been used to determine the real-time dissociation and association of TO1-2p to cell surface AM2.2. The crystal structures of the FAP together with either TO1-2p or ML342 revealed that ML342 (the “blocker”) competes for the same binding pocket as the fluorogen, with the potential to form a stable FAP homodimer.
Materials and Methods
Materials
Fluorogen (Thiazole Orange: TO1-2p) is from Carnegie Mellon University (Pittsburgh, PA); plasticware and chemicals are from Sigma-Aldrich (St. Louis, MO) except where stated otherwise.
Tissue Culture
U937 cells that stably express surface AM2.2-β2AR were maintained in sterile filtered RPMI 1640 media containing 10% heat-inactivated fetal bovine serum, 100 U/mL penicillin, 100 µg/mL streptomycin, 10 mM HEPES (pH 7.4), 20 µg/mL ciprofloxacin, and 2 mM L-glutamine, at 37 °C in a water jacketed incubator with 5% CO2 and 95% air (Forma Scientific, Marietta, OH) in tissue culture flasks (Greiner Bio-One GmbH, Frickenhausen, Germany) at a maximum cell density of 500,000/mL until the day of harvest. FAP-β2AR expression was checked daily. Samples with over 30% of the population without detectable receptor expression were excluded from experiments. Cells were typically counted and concentrated to 1 to 5 × 10⁶/mL before experiments.
High-Throughput Dose-Response Screen
Flow cytometric measurements were performed using the HyperCyt (IntelliCyt, Albuquerque, NM) 14 platform with a peristaltic pump in combination with an autosampler and a cytometer. The system enables measurement of microplate wells at rates in excess of one end-point sample well per second. The sampling probe of the autosampler moves from one well to the next as a peristaltic pump sequentially aspirates sample particle suspensions from each well. Between wells, the continuously running pump draws a bubble of air into the sample line to generate a series of bubble-separated samples for delivery to the flow cytometer. The data were collected at a sampling rate of forty ~1 µL samples per minute.
The detailed experimental protocol is described elsewhere. 9 Briefly, test compounds were serially diluted 1:3 from 10 mM stock to 300 nM in DMSO. Then, 5 µL serum-free RPMI media, 100 nL test compounds, and 3 µL AM2.2-β2AR or AM2.2-GPR32 cells were sequentially added to a 384-well plate. After a 90-min incubation in a 37 °C humidified incubator, the plates were allowed to cool on ice for 15 min before the addition of 3 µL 640 nM TO1-2p. The plates were gently vortexed and analyzed by HyperCyt after 15 min incubation on ice.
Confocal Imaging
Live-cell confocal images were taken with a Zeiss (Oberkochen, Germany) 510 Meta inverse microscope equipped with four lasers (405, 488, 543, and 633 nm) and a 63× water immersion objective. Resting cells or cells that had been prestimulated with the desired compounds for up to 120 min were added to a 37 °C chambered cover glass system (Thermo Fisher, Waltham, MA), after which up to 1 µM TO1-2p was added to the cells in the presence or absence of the compound of interest, and the fluorescent signals were collected using a 530/50-nm band pass filter. Quantitative analysis of line profiles of measured intensity for each cell was made via Zen software (Zeiss, Oberkochen, Germany), and statistical one-way analysis of variance (ANOVA) analysis for comparing average intensities for each treatment was made via GraphPad Prism for Windows (GraphPad Software, La Jolla, CA).
Compound Reversibility Study
To eliminate the effect of inherent cell surface receptor recycling, all experiments were performed at 4 °C. AM2.2-β2AR or AM2.2-GPR32 cells were harvested and resuspended in fresh serum-free RPMI media and kept at 4 °C for at least an hour before the experiment. For equilibrium binding, AM2.2-tagged cells were resuspended at a density of 100,000/mL to prevent fluorogen depletion at lower concentrations. Aliquots of 250 µL cells were allowed to bind with 0.1 nM to 1 µM freshly prepared TO1-2p for 60 min on ice before measuring the cell fluorescence with a BD Accuri C6 (BD Biosciences, Ann Arbor, MI) flow cytometer. The experiment was performed in triplicate.
To measure the association rate of TO1-2p to FAP AM2.2, an aliquot of 500 µL of 250,000/mL AM2.2-tagged cells was placed in a round-bottomed Eppendorf tube with a 2-mm flea stir bar to keep the cells suspended. The tube was maintained at 4 °C in a cuvette holder connected to a LAUDA ECO heating and cooling thermostat (Lauda-Brinkmann LP, Delran, NJ). After recording the baseline for up to 30 s, the desired concentration of TO1-2p was added to the cells by a Hamilton syringe and data were collected for an additional 270 s.
The dissociation rate was measured with three different protocols. (1) The effect of sample dilution was determined by preincubating 50 µL of 2.5 × 10⁶/mL AM2.2-tagged cells with 2.5 µM, 25 nM, or 250 nM TO1-2p at 4 °C for 60 min followed by addition of 450 µL cold serum-free RPMI at time 0. (2) The rate of fluorogen replacement was determined by preincubating 50 µL of 2.5 × 10⁶/mL AM2.2-β2AR cells with up to 2.5 µM TO1-2p at 4 °C for 60 min followed by addition of 450 µL cold 1.1 µM FAP blockers at time 0. (3) The competitive binding of TO1-2p to the cells in the presence of competitors was determined by adding a mixture of the desired concentration of TO1-2p and the FAP blocker to cells at 4 °C and allowing them to bind for 60 min before measuring the cell fluorescence.
For real-time kinetic measurement of the association and dissociation rates of TO1-2p, 500 µL of cells was placed in a round-bottom Eppendorf tube with a flea stir bar and maintained at 4 °C as described previously. After measuring autofluorescence for 15 s, TO1-2p was added to a final concentration of 2.5 nM, 7.5 nM, or 25 nM, followed by the addition of 100 µM FAP blocker. ML342, after 5 or 10 min, and the signal were detected by a BD Accuri C6 flow cytometer. The kinetic data were translated to text format by HyperView software developed by Dr. Bruce Edwards at the University of New Mexico Center for Molecular Discovery (UNMCMD, Albuquerque, NM) and later analyzed with GraphPad Prism.
Synthetic Procedure of Probe Molecule ML342 (CID 2953239, SID 125240931, N,4-dimethyl-N-(2-oxo-2-yridineidin-2-yl)piperazin-1-yl)ethyl)benzenesulfonamide)
To a round-bottom flask equipped with a magnetic stir bar was added bromoacetyl bromide (201 mg, 1 mmol), followed by dichloromethane (10 mL). This mixture was cooled in an ice bath, and 1-(pyridin-2-yl)piperazine (326 mg, 2 mmol) was added dropwise as a solution in 5 mL dichloromethane. The mixture was stirred at 0 °C for 30 min, then warmed to ambient temperature and stirred 60 min. The mixture was diluted with a saturated aqueous ammonium chloride solution and extracted with diethyl ether. The combined organic layers were dried and evaporated under reduced pressure to afford 2-bromo-1-(4-(pyridin-2-yl)piperazin-1-yl)ethanone (IMC 1) as a clear oil, which solidified on standing. Bromide 1 was used in the next step without further purification.
IMC 1 (300 mg, 1 mmol) in dichloromethane (10 mL) was added slowly to a solution of methylamine (1M in tetrahydrofuran [THF] large excess). This mixture was allowed to stir at ambient temperature for 10 min, then diluted with water and extracted with dichloromethane. The combined organic layers were dried and evaporated to give 205 mg 2-(methylamino)-1-(4-(pyridin-2-yl)piperazin-1-yl)ethanone (IMC 2) as an oil used without further purification (89%): liquid chromatography–mass spectrometry (LC-MS) (>99% 215 nm, 254 nm) m/z (M+H)+ = 235.
IMC 2 (246 mg, 1 mmol) was added to a round-bottom flask and dissolved in dichloromethane (20 mL). N,N-Diisopropylethylamine (0.35 mL, 2 mmol) was added, followed by 4-methylbenzene-1-sulfonyl chloride (380 mg, 2 mmol). The mixture was stirred at room temperature for 30 min, then washed with water. Organic layers were collected, dried, evaporated, and purified by high-performance liquid chromatography (HPLC) to afford N,4-dimethyl-N-(2-oxo-2-(4-(pyridin-2-yl)piperazin-1-yl)ethyl)benzenesulfonamide (ML342) as a colorless oil.
The complete process of probe compound ML342 (CID 2953239) preparation and characterization data are summarized in
Crystal Structure of AM2.2 with TO1-2p and ML342
AM2.2 (3 mg/mL) was mixed with TO1-2p (20 mg/mL slurry in water) in a 1:5 molar ratio (protein/ligand). Crystals were grown in sitting drops with precipitant 32% polyethylene glycol (PEG) monomethyl ether 5000, 0.2 Mpotassium dihydrogen phosphate. AM2.2 (4.7 mg/mL) was mixed with ML342 (50 mg/mL in DMSO) in a 1:2 molar ratio. Crystals were grown in sitting drops with precipitant of 20% PEG 3350, 0.2 Msodium nitrate. Both crystal forms were cryoprotected by brief immersion in well solution augmented with 25% glycerol before plunging into liquid nitrogen. Data for both complexes were collected at the Stanford Synchrotron Radiation Light (SSRL) source Beamline 11-1 to 2.7-Å resolution (the TO1-2p complex) and 2.0-Å resolution (the ML342 complex). Both crystal forms contain two scFv/ligand complexes per asymmetric unit. The structure of the AM2.2/TO1-2p complex was determined by molecular replacement using Phaser, 15 with VL-VH coordinates from 2B0S as a model, and the structure of AM2.2/ML342 was determined in a similar manner using the previously determined coordinates of AM2.2 from the TO1 complex. Both structures were refined with Refmac5, 16 and model building was carried out with Coot. 17 Buried surface area was analyzed with MS, 18 and van der Waals contacts were tabulated with Contacsym. 19
Results
The fluorogen activating protein system has demonstrated its utility as a protein reporter system since 20086–11,20 by taking advantage of the significant fluorescent quantum yield increase upon FAP-fluorogen binding to track receptor trafficking in real time. With appropriate fluorogens and experimental design, the system has been used to successfully identify molecules that regulate receptor internalization pathways in both a canonical and a noncanonical fashion.7,9,21 However, potential modulators of FAP-fluorogen binding have not been reported. These modulators directly interfere with the binding between fluorogen and the FAP tag rather than regulating trafficking of the receptor fused to the FAP tag ( Fig. 1A ). The decrease in fluorescent signal after exposure to a compound and a cell membrane–impermeable fluorogen (compared with cells not treated with any compound or at rest) may indicate that the compound is either activating receptor internalization (binding site A) or blocking the binding of the fluorogen to the FAP (binding site B). We reported a FAP-based HTFC screen to identify novel GPCR regulators, 9 resulting in discovery of FAP-fluorogen blockers (false positives), which were distinguished from GPCR regulators by inhibition of TO1-2p binding at 4 °C, where internalization is blocked.
Adapting the HTFC assay described previously,
9
we carried out a screening campaign to identify small-molecule antagonists of TO1-2p/AM2.2 (detailed in
Table 1
summarizes the structures, with EC50 values measured by dose-response assays from cells expressing AM2.2-β2AR and AM2.2-GPR32, as well as results from the live-cell confocal microscopy experiment for the top two compound cluster candidates for FAP-fluorogen blockers. The summary for other lead clusters can be found in
Summary Results of Top Candidates of Fluorogen Activating Protein (FAP)–Fluorogen Binding Modulators.
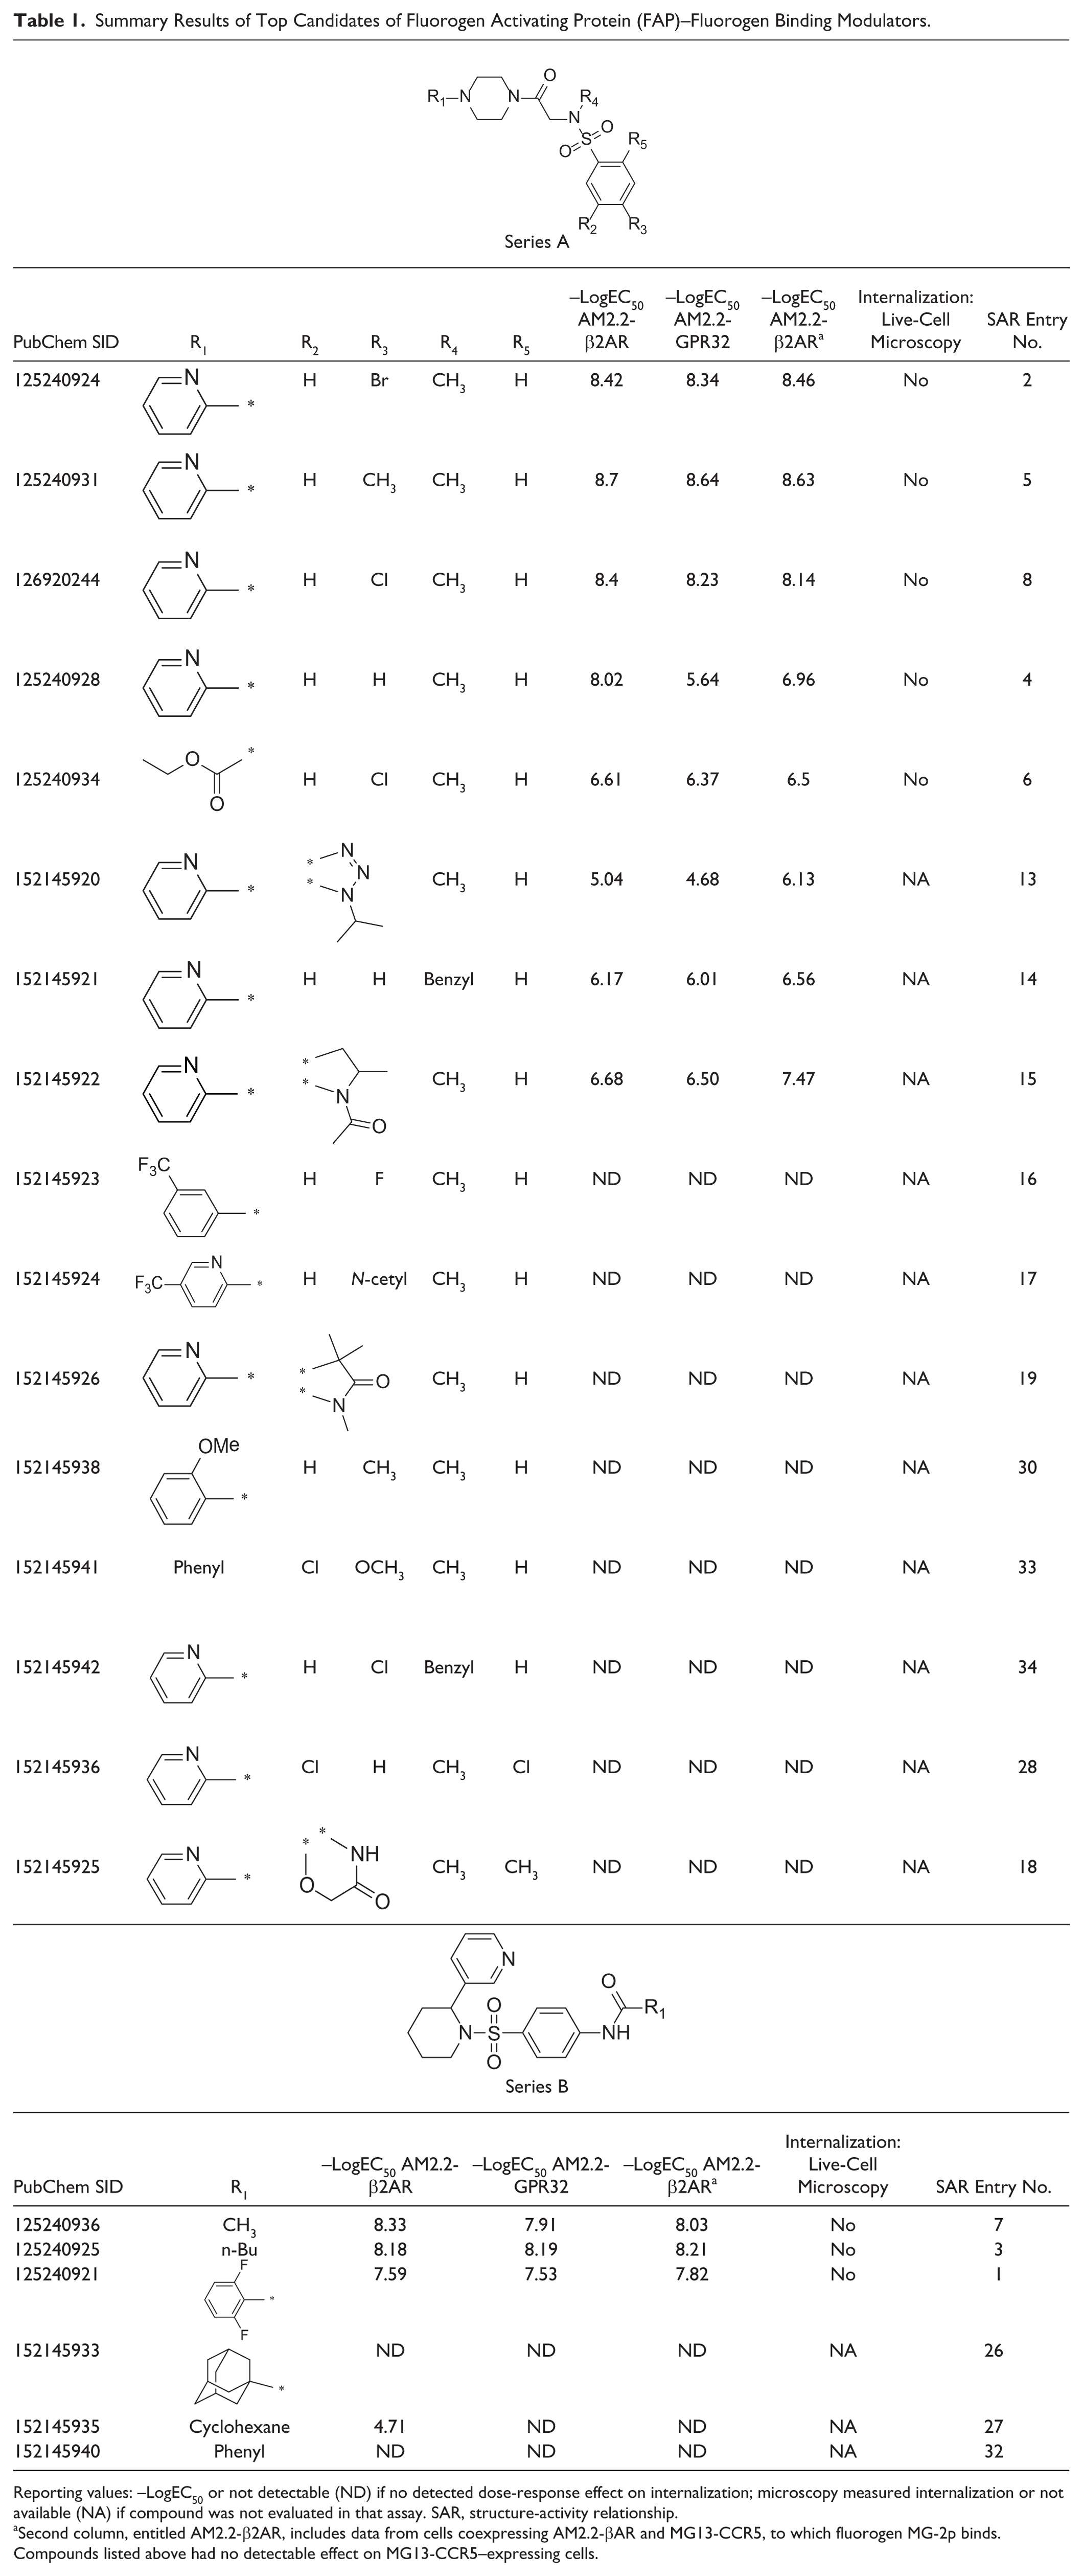
Reporting values: –LogEC50 or not detectable (ND) if no detected dose-response effect on internalization; microscopy measured internalization or not available (NA) if compound was not evaluated in that assay. SAR, structure-activity relationship.
Second column, entitled AM2.2-β2AR, includes data from cells coexpressing AM2.2-βAR and MG13-CCR5, to which fluorogen MG-2p binds. Compounds listed above had no detectable effect on MG13-CCR5–expressing cells.
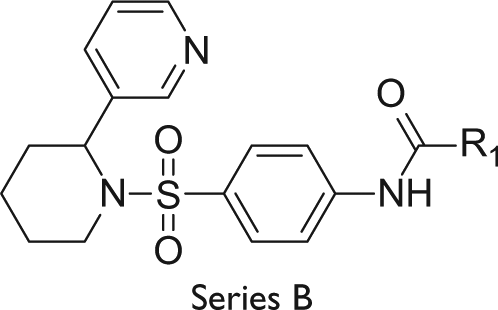
Nine commercially available analogues within the piperidine series B, including duplicate fresh batches of SID 125240936, were examined to outline the SARs for this SAR series B (
Fig. 1B
and
Table 1
). For example, the anilido amide moiety was required for activity since both the phenyl amide SID 152145919 (entry 12) and the pyrazole congener (entry 11) were inactive. The location of the amide was also critical for activity since the meta-congener SID 152145930 (entry 23) was also inactive. SAR at the 2-substituted piperidine examining the 3-pyridyl moiety was more limited, but one example of a benzothiazole replacement SID 152145939 (entry 31) showed very weak inhibition (IC50 = 17 µM), suggesting that the 3-pyridyl is important for interaction within the AM2.2-FAP. Importantly, the initial lead SID 125240936 was confirmed in vitro and retained the best inhibition with an IC50 range of 2.2 to 7.9 nM. SID 125240936 was selective versus the MG13-CCR5 FAP tag and was not cytotoxic up to 100 µM (
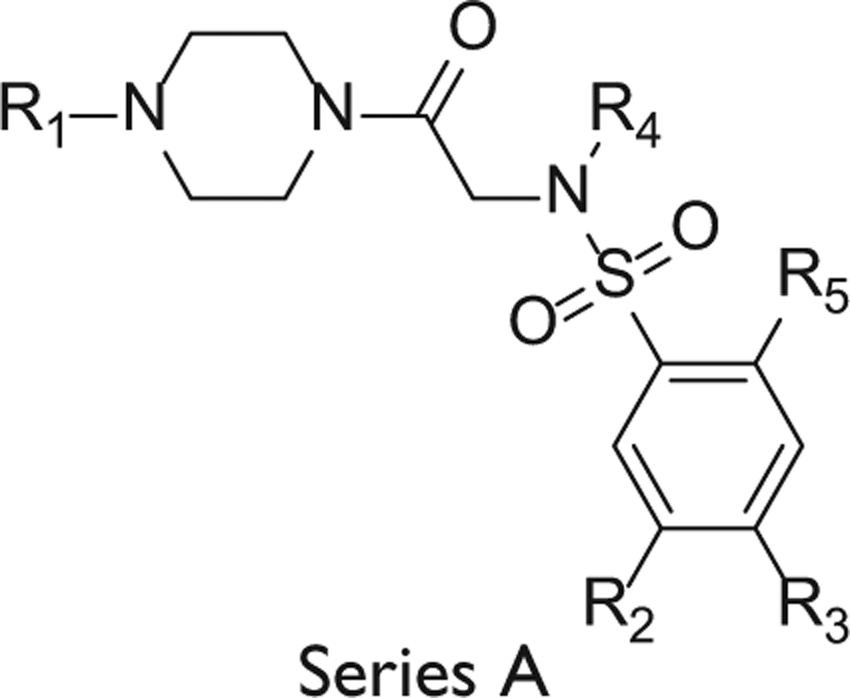
For series A, 23 analogues were obtained as fresh powders, including lead SID 125240931. SAR highlights are summarized in
Table 1
. Modifications of the Western sulfonamide aryl group required some lipophilic substitution (R′ = Br, Cl, or CH3) at the para position to retain good inhibition (R′ = H 70-fold loss of activity). The meta- and ortho-position analogues were not commercially available. Modification of the sulfonamide N-methyl was limited. Benzyl derivative SID 152145921 (entry 14) was found to be inactive, and attempts to constrain the methyl and alpha methylene carbon in the heterocyclic ring were unsuccessful (entries 20, 29, 36). Interestingly, modification of the piperazine aminopyridine suggested some tolerability to modifications. For example, introduction of a 5-trifluoromethyl group to give SID 152145927 (entry 20) resulted in a 40-fold loss in activity with an IC50 of 89 nM. In addition, the pyridyl ring could be replaced altogether with an ethyl carbamate SID 125240934 (entry 6), retaining respectable IC50 activity of 316 nM, suggesting that alternative pendant hydrogen bond acceptors in addition to the 2-pyridyl and carbamate moieties may be tolerated at this position. The initial lead within series A, SID 125240931, was also confirmed from fresh powder with an IC50 range of 1.8 to 2.2 nM. In addition, similar to SID 125240936 from series A, SID 125240931 was selective for interaction with the AM2.2-FAP based on studies using the MG13-CCR5 FAP tag and was not cytotoxic up to 100 µM (
Although ML342 is not intended to serve as an oral drug, all of the molecular properties of ML342 are within range of phase I compounds and fall well below the range of concern with no violations of Lipinski rules of 5. 22 The basic piperazine nitrogen has a calculated pKa of 5.6 and can readily allow for salt formation, which may be beneficial for longer term second-generation probe requirements for potential in vivo studies. The calculated physical properties of ML342 appear in Table 2 together with the averages from the Molecular Detection of Drug Resistance (MDDR) database of compounds either entering phase I or launched drugs.
Calculated Properties via TRIPOS Software Comparison with Molecular Detection of Drug Resistance (MDDR) Compounds.
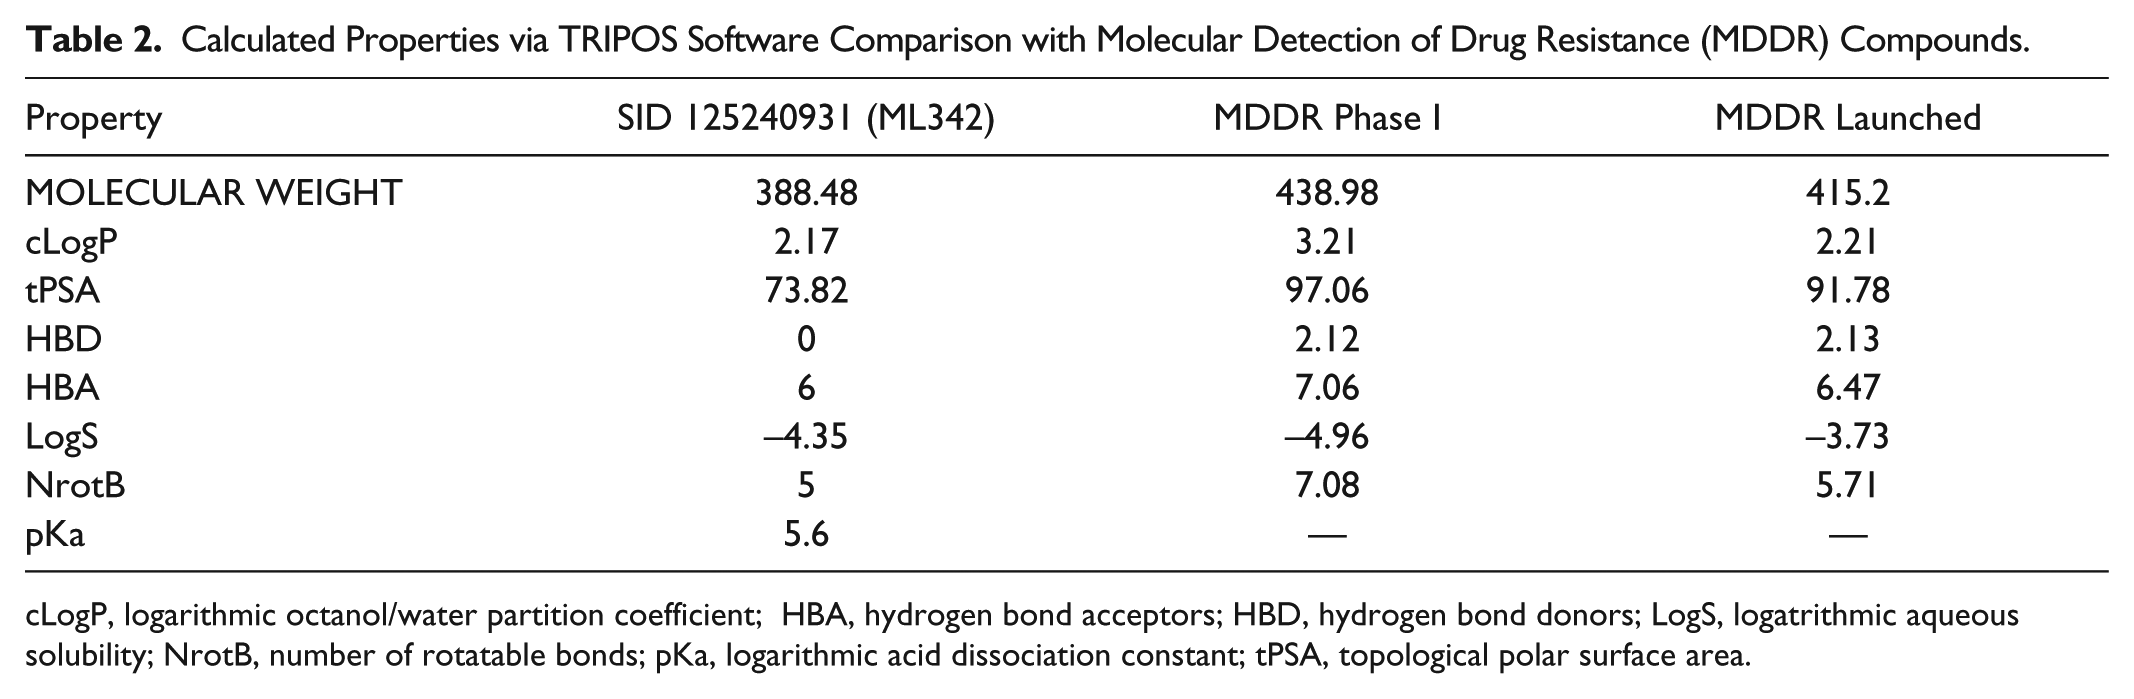
cLogP, logarithmic octanol/water partition coefficient; HBA, hydrogen bond acceptors; HBD, hydrogen bond donors; LogS, logatrithmic aqueous solubility; NrotB, number of rotatable bonds; pKa, logarithmic acid dissociation constant; tPSA, topological polar surface area.
To confirm that ML342 targets the FAP-fluorogen binding site, we performed a set of confocal microscopy experiments with both AM2.2-β2AR– and β2AR-GFP–expressing cells ( Fig. 2 ). AM2.2-β2AR cells exposed to 1 µM TO1-2p at 37 °C and kept in the resting state, treated with isoproterenol (ISO), or treated with 10 µM ML342 for 90 min before being exposed to TO1-2p are shown in Figure 2A , 2B , and 2C , respectively. For comparison, β2AR-GFP cells in the resting state or receiving 90 min of isoproterenol or ML342 treatment are shown in Figure 2D , 2E , and 2F , respectively. Figure 2C,F shows clearly that ML342 did not induce receptor internalization in either cell line while isoproterenol did induce receptor internalization ( Fig. 2B,E ). Quantification by cell profiles of normalized intensity for AM2.2-β2AR ( Fig. 2G ) and β2AR-GFP ( Fig. 2H ) further demonstrates these results. In addition, the presence of ML342 has no effect on the fluorescence intensity or the location of β2AR-GFP ( Fig. 2F ), as determined by no significant differences in average maximum intensities (p < 0.05; Fig. 2I ). However, the fluorescence intensity of ML342-treated AM2.2-β2AR cells is considerably lower compared with resting samples. These data confirmed that the reduction of the fluorescent signal in the presence of ML342 was due to the inhibition of binding of TO1-2p to AM2.2 rather than ligand-activated receptor internalization.
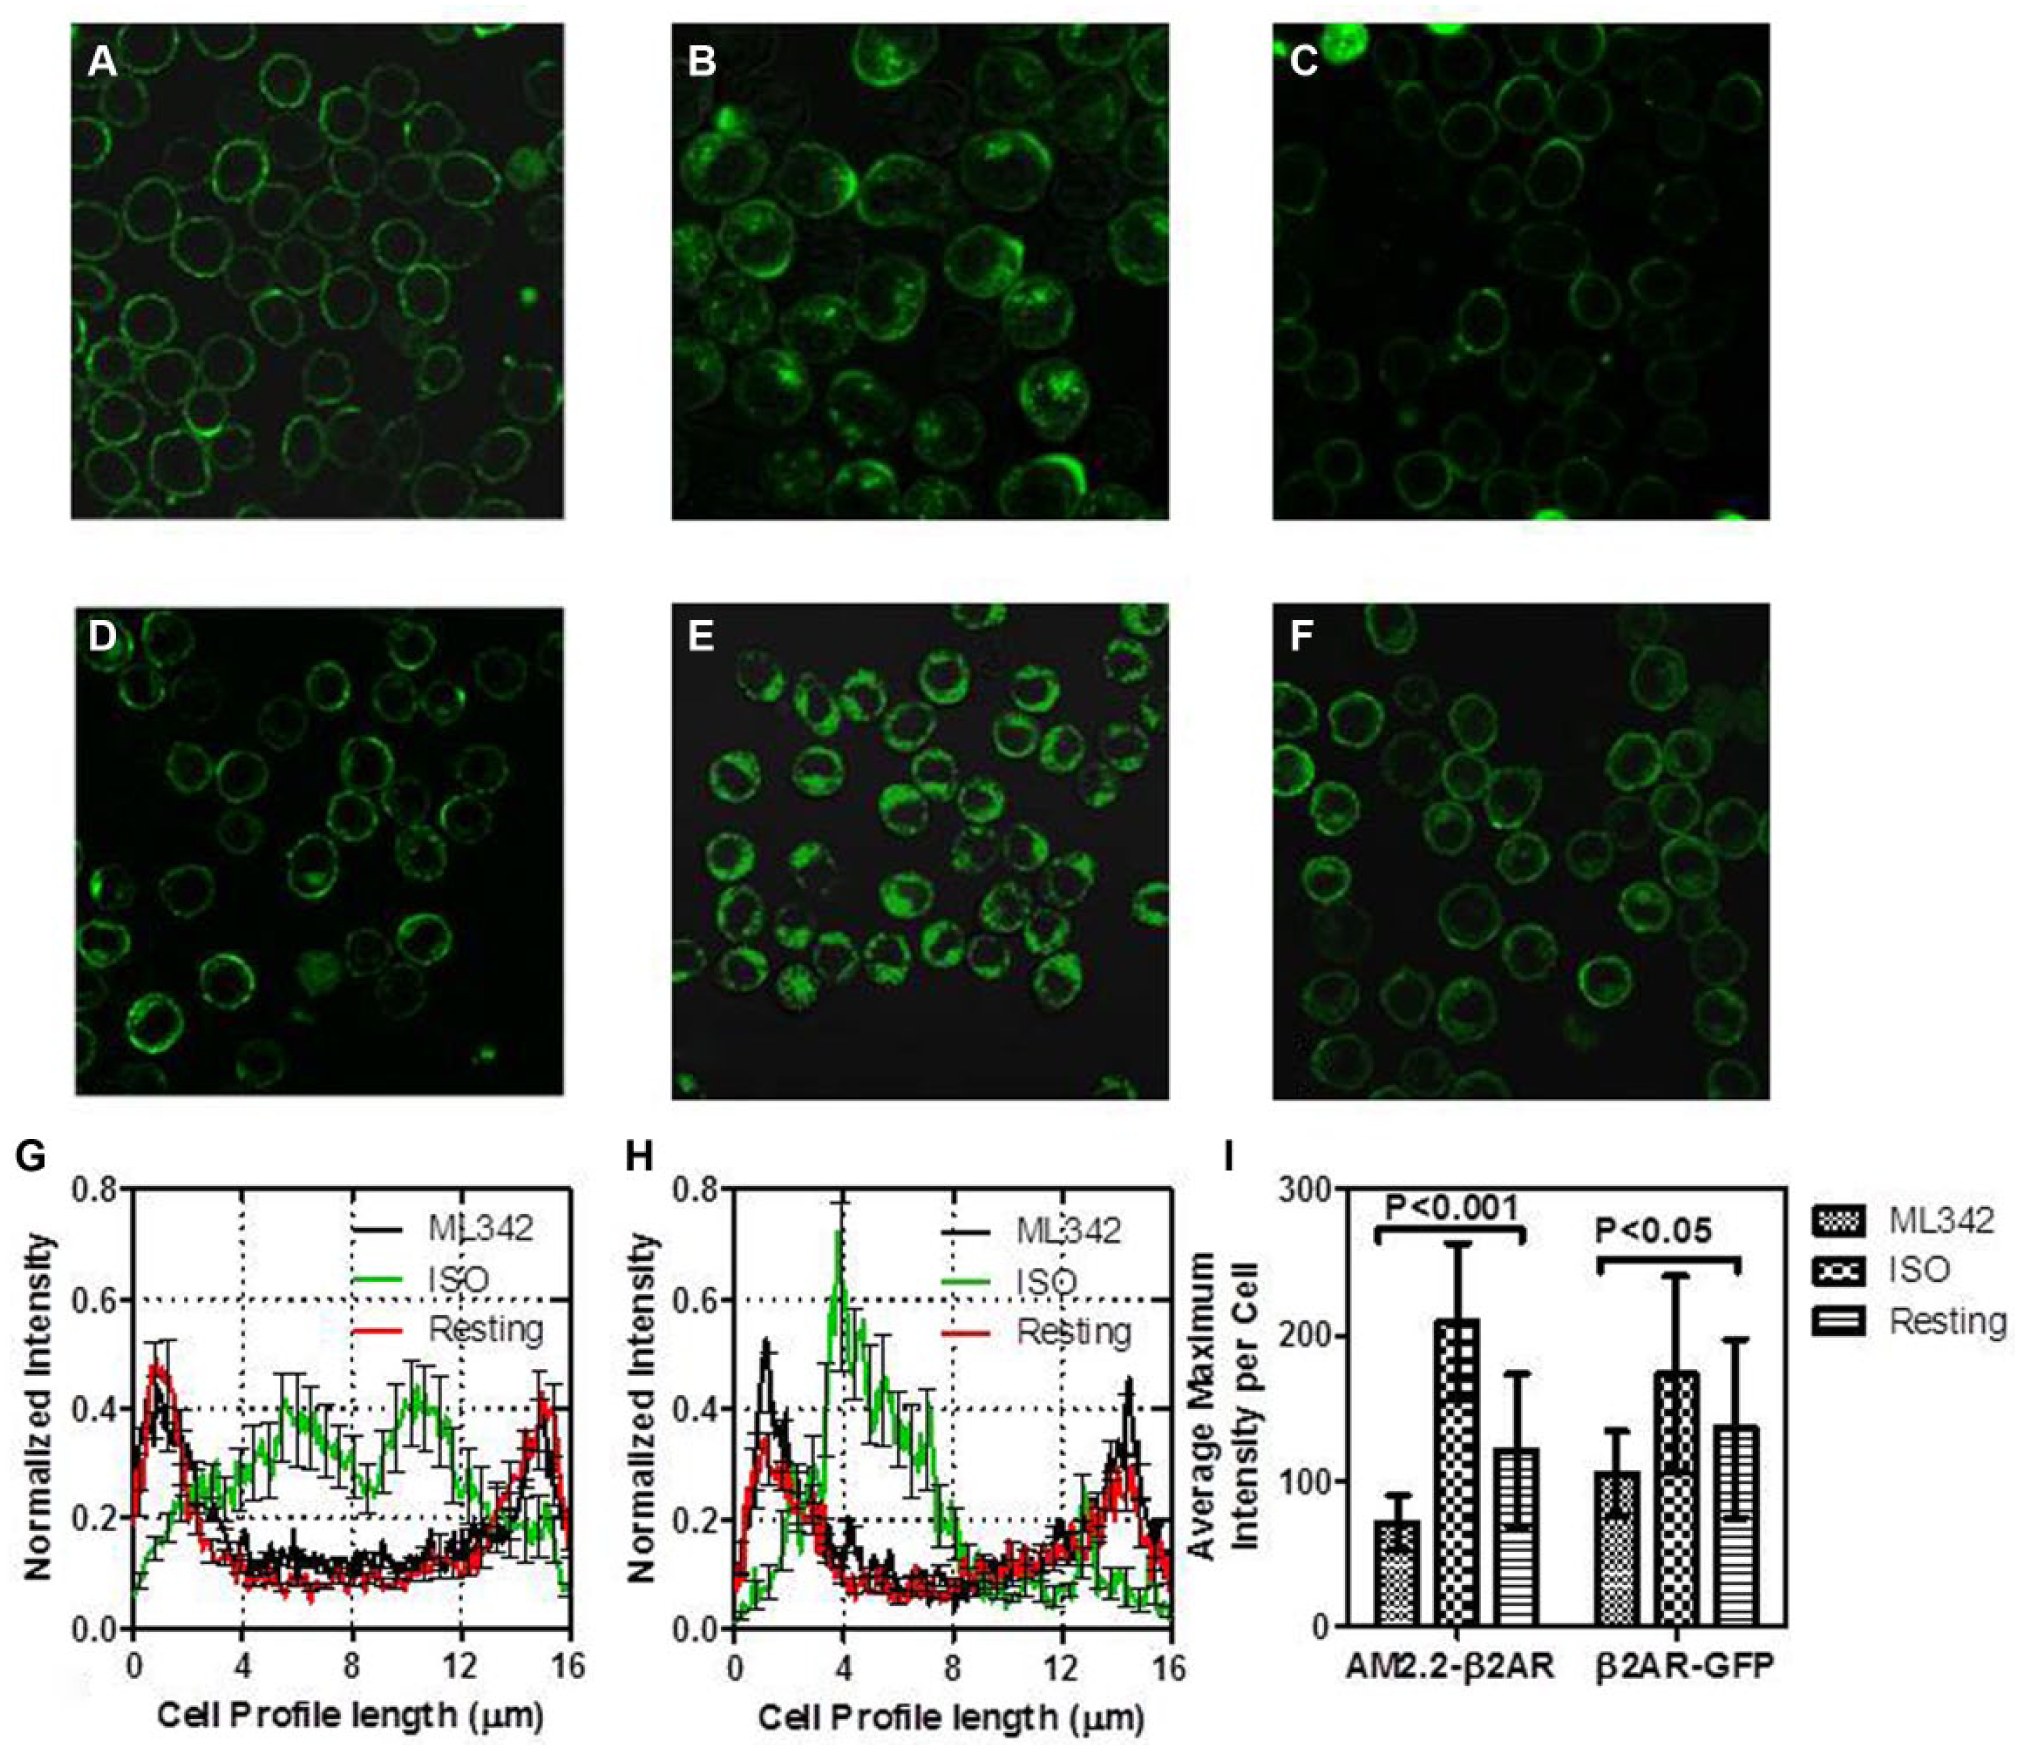
Confocal microscopy comparison of AM2.2-β2AR- (
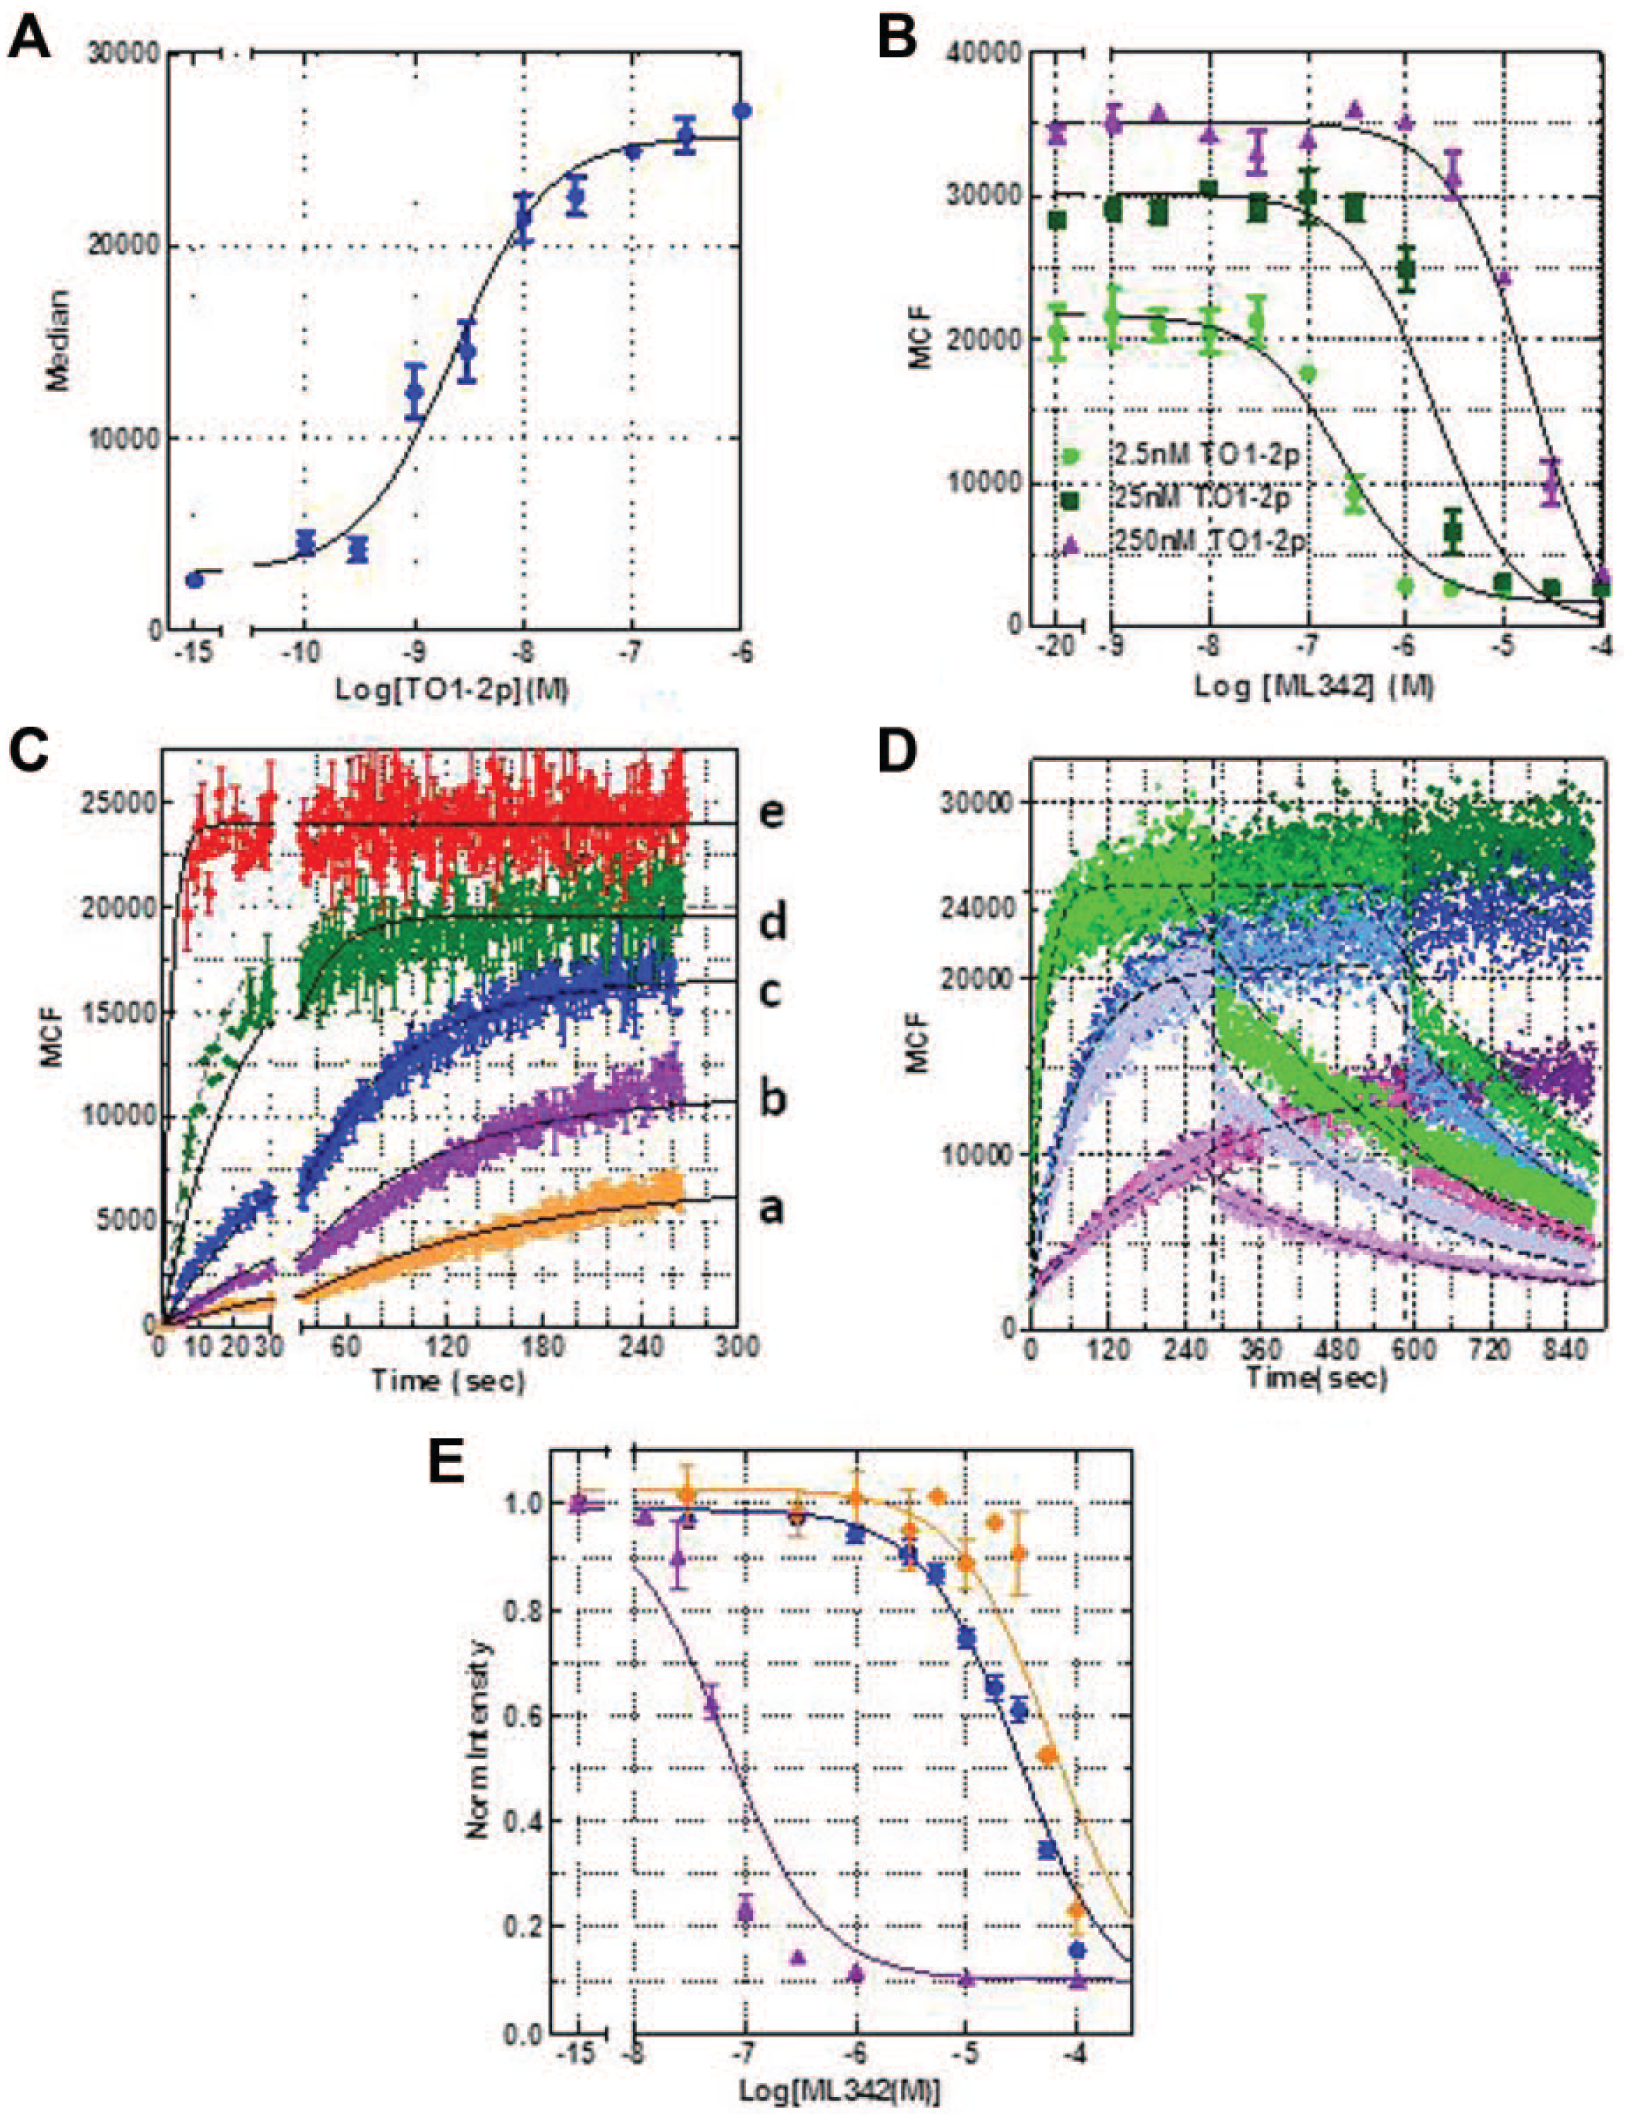
Further characterization of these interactions was performed at 4 °C to stabilize the surface presentation of the target AM2.2-β2AR. Median channel fluorescence (MCF) from AM2.2-β2AR–expressing cells exposed to TO1-2p in the absence and presence of ML342 was measured by flow cytometer, and the results are plotted in Figure 3A and 3B , respectively. TO1-2p binds to AM2.2 with high affinity (~2.3 nM; Fig. 3A ), comparable to what was observed at 37 °C (1.7 nM9). On the other hand, the measured IC50 of ML342 and AM2.2 was unexpectedly high (150 ± 40 nM) when a mixture of ML342 and TO1-2p was added to the cells at 4 °C ( Fig. 3B ), compared with the observed IC50 from the dose-response screen when the cells were exposed to ML342 for 90 min at 37 °C before the addition of TO1-2p (2.2 ± 0.5 nM). The significant affinity difference is not likely solely explained by the temperature difference. Therefore, we further investigated the interaction by varying the equilibrium binding protocols and performing kinetic experiments. 23
(
Flow cytometry results from real-time association and dissociation of TO1-2p to AM2.2 are presented in Figure 3C,D . Binding of five different concentrations of TO1-2p to AM2.2 were measured and rate constants were fitted with Prism software to determine the association kinetics with multiple ligand concentrations ( Fig. 3C ). The association and dissociation rate constants were fitted as 1.52 × 10⁶ M−1s−1 and 0.003 s−1, respectively, after restricting the fitting to a set of rate constants applied to all data sets. The fitted Kd of 1.9 nM is in close agreement with the measured affinity ( Fig. 3A ). Although complex protein-ligand association dynamics have been described by several kinetic models, 24 we chose the classical model as appropriate for one-site reversible ligand-receptor association, although the goodness-of-fit (R2) value decreased from 0.98 to 0.61 with an increase in TO1-2p concentration. The systematic deviation of the fit suggests that the binding of TO1-2p consisted of fast and slow components that cannot be explained by a ligand-receptor binding model with a single affinity state or one-site binding.
Figure 3D shows the real-time association of 2.5 nM (purple), 7.5 nM (blue), and 25 nM (green) TO1-2p at 4 °C, followed by rapid dissociation induced by saturating ML342 at 5 min (pale color), 10 min (medium color), or no ML342 as controls (dark color). Note that for all three concentrations measured, there is a mismatch between the simulated data (dotted lines, one-site association followed by one-site dissociation model). The experimental data (scattered dots) could not be adequately addressed by modeling two affinity states of AM2.2 or two conformations of TO1-2p to AM2.2 with different quantum yields. Application of a two-phase exponential dissociation model (a two-site model) from Prism resulted in the fast dissociating component contributing to ~15% to 30% of the total binding. The half-life exceeded the experimental detection limit (fitted off-rate is >500 s−1, or t1/2 < 0.0014 s). Most of the dissociation appeared to be slow, at a rate of ~0.003 s−1, which is similar to the simulated off-rate in Figure 3C . Results from Figure 3D indicated that the binding between fluorogen TO1-2p and FAP-AM2.2 is a reversible, yet heterogeneous interaction, with an observed affinity in the nanomolar range.
Figure 3E shows the equilibrium binding curves of saturating TO1-2p (250 nM) in the presence of ML342 using protocols varying the order of reagent additions. Interestingly, the apparent affinity of ML342 binding to AM2.2 is strongly affected by the protocol used. Cells exposed to ML342 prior to the exposure to TO1-2p presented much higher affinity compared with those exposed to the mixture of TO1-2p and ML342 or TO1-2p before exposure to ML342. Ki values, calculated from the one-site competitive binding model, varied from 0.5 nM for prolonged incubation of ML342 (purple dots and line) before TO1-2p addition to ~350 nM for the mixture (blue dots and line) and ~760 nM for 60 min of TO1-2p preincubation (orange dots and line). However, the R2 value is relatively poor for both the preincubation of TO1-2p and of ML342, suggesting that the interaction is too complex to be explained by a simple one-site competition binding model. In summary, the kinetic and equilibrium experiments presented in Figure 3 indicate that TO1-2p and ML342 both bind to AM2.2 with a rapid on-rate and relatively slow off-rate, with the on-rate of TO1-2p potentially faster than the on-rate of ML342. Thus, the binding between TO1-2p/ML342 to FAP-AM2.2 is more complicated than a one-site binding phenomenon.
To further understand these interactions at the molecular level, crystals of AM2.2/TO1-2p and AM2.2/ML342 were formed, and data were collected at the SSRL Beamline 11-1 to 2.7-Å resolution (the TO1-2p complex) and 2.0-Å resolution (the ML342 complex). X-ray data collection and refinement statistics are in
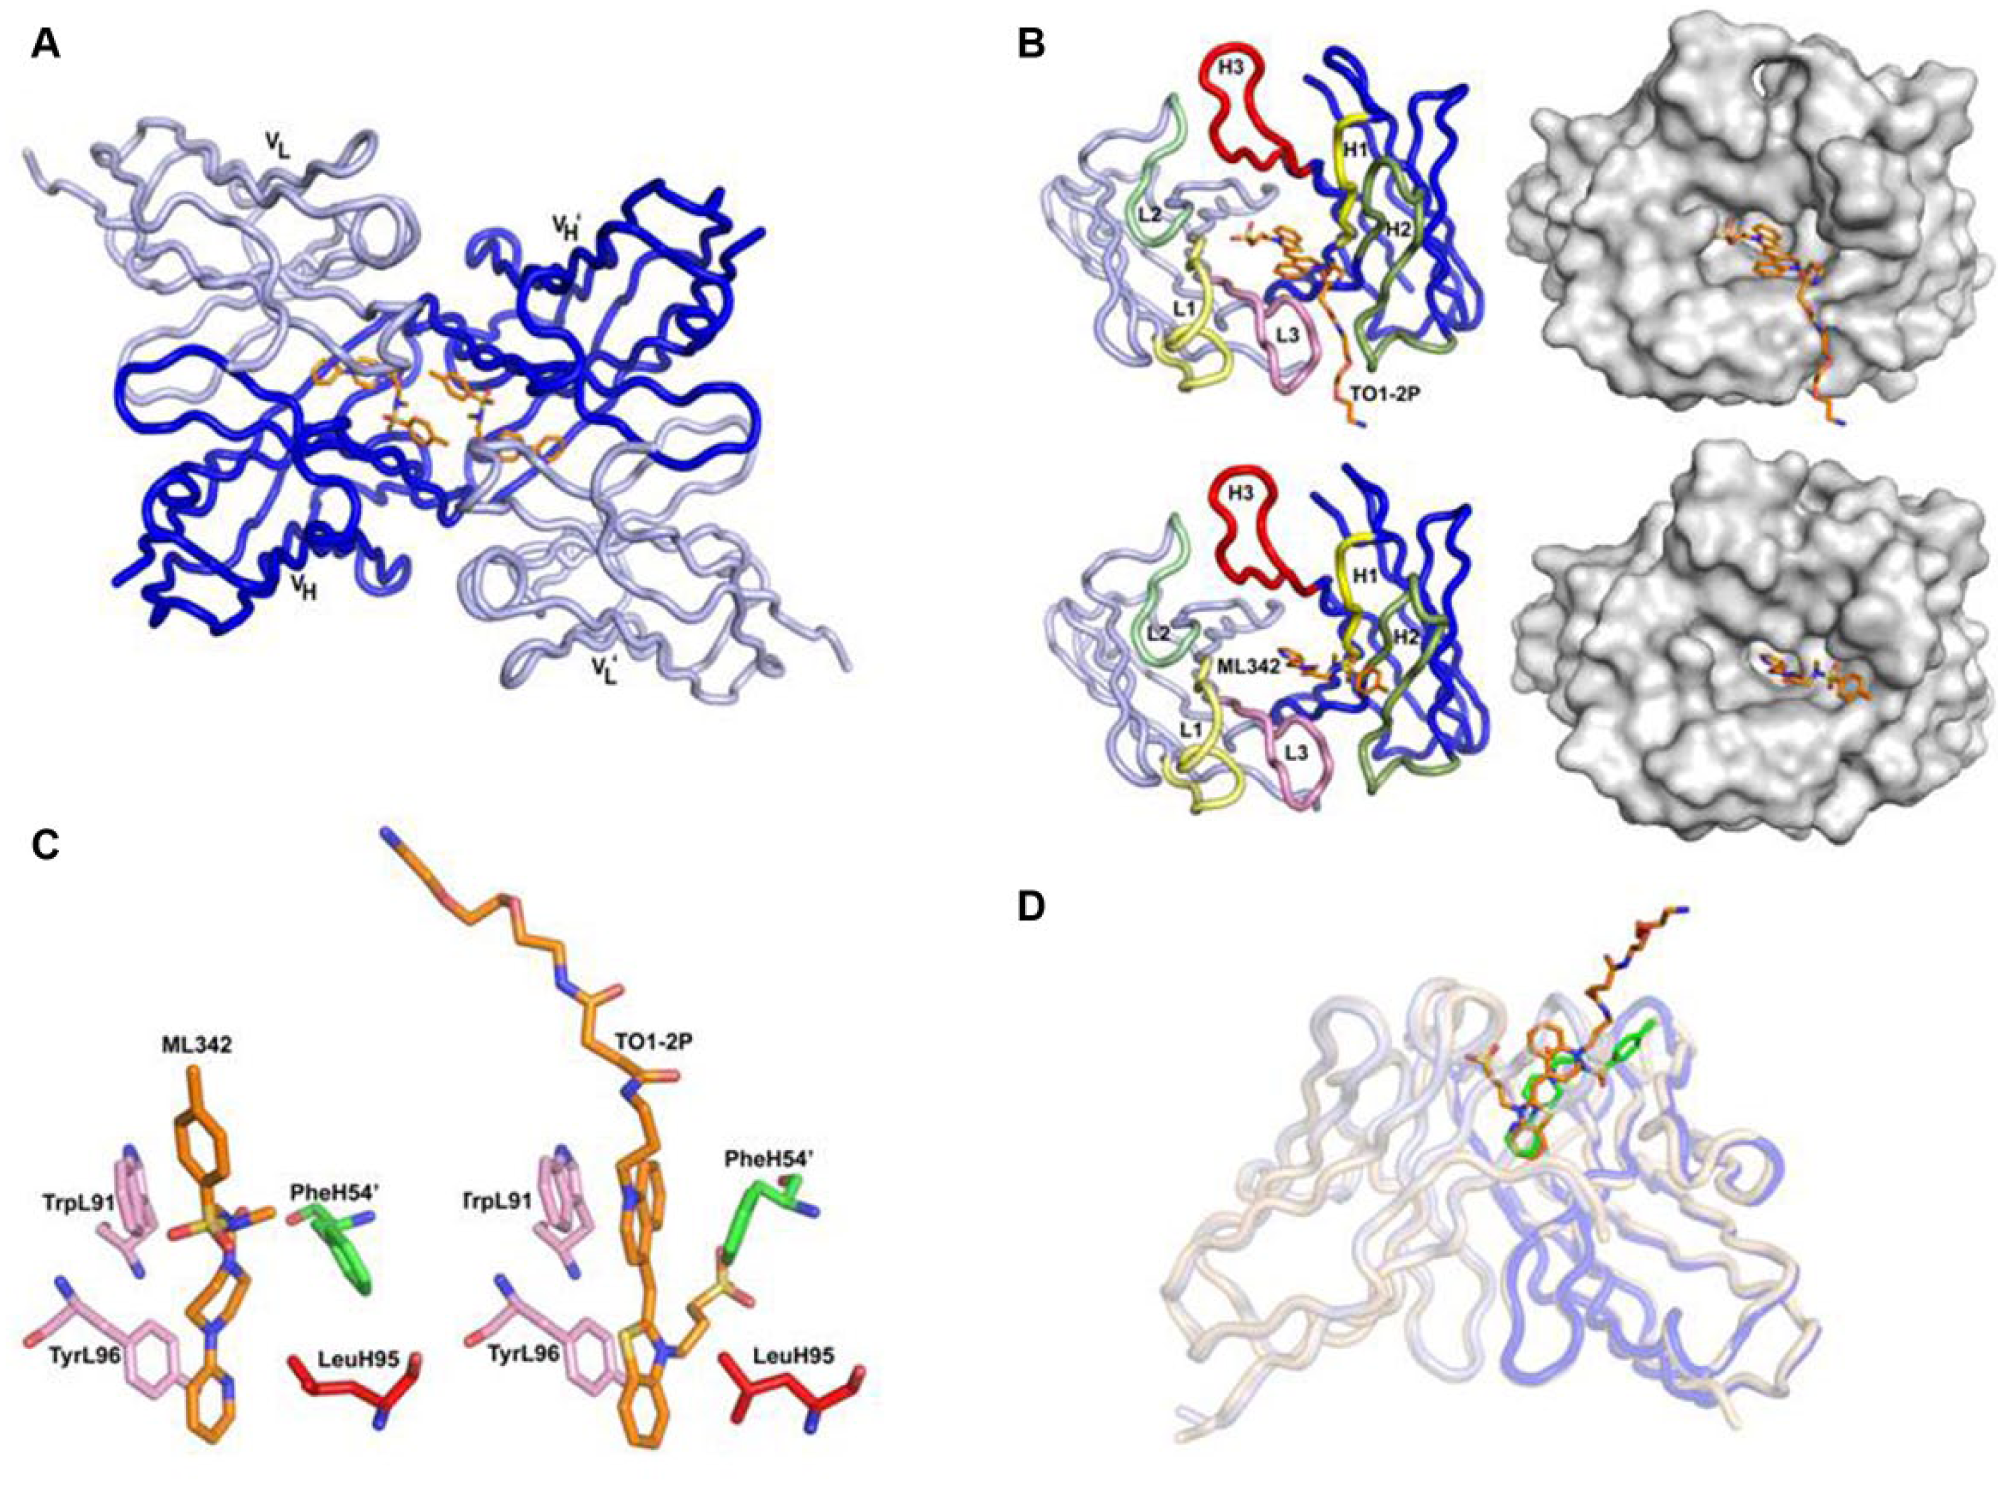
Crystal structure of AM2.2 in the presence of ML342 or TO1-2p. (
Both AM2.2/ligand crystal forms contain two scFv/ligand complexes per asymmetric unit, packed in a head-to-head fashion such as the AM2.2/ML342-dimer of scFvs ( Fig. 4A ). The two AM2.2/ML342 scFv molecules within the asymmetric unit are similar, with root mean square deviations (RMSDs) on Cα atoms of 0.26 Å. Both scFv molecules have clear density for residue L0-118 (L0 is a linker residue) and H2-112. The scFv-scFv dimer interface buries a total of 1360 Å 2 of molecular surface. As indicated in Figure 4B , ML342 binds in a pocket at the VL-VH interface, with its pyridine ring at the base of the pocket and toluene ring near at the surface. The pyridine is flanked on each side by TyrL96 and LeuH95, with residues TrpL91 and the PheH54 from the dimeric-related scFv also sandwiching the ML342 compound ( Fig. 4C ).
There are also two very similar AM2.2/TO1-2p complexes in the asymmetric unit (0.51 Å RMSD on Cα atoms), and numbers of contacts and buried surface values are reported for the first complex. Electron density is clear for residues L1-108 and H2-111 in molecule 1 and L1-109 and H2-112 for molecule 2, while the linker connecting the VL to VH domain has no ordered electron density. The two scFv molecules in the asymmetric unit pack in a dimeric assembly with the tips of the complementarity-determining region (CDR) loops at the dimer interface, burying a total of 1195 Å2 of molecular surface, slightly larger than the ~1100 Å2 of surface buried at the VL-VH interface of each scFv. The TO1-2p fluorogen binds in a pocket located between the heavy and light chain CDRs, with the benzothiazole ring at the bottom of the pocket and sandwiched between residues TyrL96 and LeuH95, while the quinoline ring is flanked by TrpL91 on one face, with the other face sandwiched by residue PheH54 from the neighboring scFv in the dimeric assembly. The PEG tail protrudes from the binding site, and the sulfate group attached to the benzothiazole ring is located near the surface of the binding pocket ( Fig. 4B,C ). The AM2.2 scFv is similar in both TO1-2p and ML342 complexes (RMSD on Cα atoms of 0.73 Å), with only a small (~4 Å) shift in position of the tip of CDR H2 between the two complexes. These data revealed that ML342 and the fluorogen TO1-2p compete for the same binding pocket on the FAP, as shown in a simulated structural overlay of ML342 and TO1-2p bound to AM2.2 ( Fig. 4D ).
Discussion
The revolutionary development of FPs provided a noninvasive tool to study cell physiology in real time. 4 Similar to FPs, FAPs can also be stably expressed in cells with no interference with their normal function. Researchers from several areas could benefit from the present augmentation of FAP technology, including (1) basic biologists following protein trafficking in real time, even with limited numbers of receptors expressed in the cells due to the extremely high level of fluorescent signal enhancement from fluorogen-bound FAP-tagged target receptors; (2) investigators using FAP-based high-throughput screening to separate FAP blockers from biological ligands of the target proteins; and (3) the potential for in vivo identification of target proteins in animal models.
The newly discovered molecules described here that specifically inhibit or reverse fluorogen activation by an FAP tag should have a number of immediate applications. Our ongoing investigations of receptor recycling kinetics benefit from selectively blocking the fluorescence signal from FAP-tagged receptor molecules at the cell surface without affecting the internalized signal or the expression of surface receptors. This approach would enable more robust and accurate analysis of receptor internalization poststimulation and requires no fixation or trypsin treatment. The molecules can also serve as a control for the newly available, two-fluorogen self-checking assays to monitor receptor trafficking. 26 In addition, the new probe could be used to make more precise measurements of the fraction of fluorescent signal that is due to background fluorescence. This more accurate determination of the net prestimulation and poststimulation signal should lead to higher Z′ factors in screening, thus permitting the identification of weak (but genuine) agonists and antagonists that would otherwise be missed. The newly discovered FAP tags and inhibitors may also find utility in vivo. The total FAP signal would represent the amount of labeled protein. It would be possible to use a new impermeable probe to determine the amount of protein accessible to the extracellular environment. The addition of the probe molecule could enable the specific elimination of signals from one FAP in multi-FAP, multicolor pulse-chase experiments. By splitting the sample and adding probe over time, it would be possible to assess the level of extracellular and intracellular protein. The newly discovered molecule ML342 is also a starting point for designing other types of FAP binding molecules such as radioactive isotopes that can be valuable for in vivo imaging.
Crystal structures comparing TO1-2p/AM2.2 and ML342/AM2.2 complexes confirmed that ML342 and TO2-2p compete for the same binding site on AM2.2. Data also indicate the potential for the formation of a stable FAP dimer of scFvs in the presence of TO1-2p or ML342. β2AR homodimers are often formed in the absence of a stimulus (agonist, antagonist, or inverse agonist) on the cell surface 27 or synthetic lipid bilayers. 28 Although monomeric β2AR is capable of activating the Gαs signaling pathway, 29 the formation of homodimers may be necessary for the receptors to export from the endoplasmic reticulum to the cell surface for subsequent cell surface trafficking. 30 These reports provide a possibility that two neighboring FAP tags from a β2AR homodimer could be close enough to form a stable FAP dimer in the presence of TO1-2p or ML342 and that the dimerization of FAPs may explain the unusual kinetic data presented in Figure 3 . Even though preliminary data provide no evidence that soluble FAP segments dimerize in the presence of TO1-2p (R. Stanfield, unpublished observation), there is a possibility of FAP dimer formation under high local concentration. If two molecules of fluorogen or ML342 and two neighboring FAPs form a more stable structure, a slower off-rate from the dimer could result compared with that from the monomer. Moreover, the protocol (or time)-dependent variation of the observed IC50 could also depend on the dynamics of FAP dimerization. In combination, insight into the spatial orientation of the FAP in the presence of its binding partner and results presented in Figure 4 could reflect β2AR homodimers in living cells, but with dimerization having no impact on the trafficking pathway in response to isoproterenol stimulation.
In summary, we discovered a new class of compounds that interferes with the binding between fluorogen and FAP. These compounds are tight-binding, nonfluorescent analogues of fluorogens. High concentrations (up to 100 µM) of most of these compounds present no cytotoxicity to U937 cells, and their presence has no impact on the normal function of the receptor. The most potent compound among these, ML342, has been resynthesized, and the chemical and biological properties of ML342 have been investigated. Crystal structures revealed that ML342 and TO1-2p competed for the same binding site of FAP AM2.2. The nonfluorescent fluorogen analogues bind to surface-displayed AM2.2 with high affinity and can be used to quickly identify molecules targeting the FAP-fluorogen binding site from molecules modulating receptor internalization. The discovery of ML342 provides a novel tool to study the real-time binding kinetics of fluorogen TO1-2p and FAP-AM2.2, and we further investigated the association and dissociation kinetics of the pair. To our surprise, the interaction is complex, potentially as a result of heterogeneity of either the fluorogen or the FAP, or the dimerization of the FAP, an insight gained through the use of ML342.
Footnotes
Acknowledgements
ML342 is available from Vanderbilt Specialized Chemistry Center at Vanderbilt University Medical Center.
Declaration of Conflicting Interests
Larry Sklar is a co-inventor of HyperCyt, a high-throughput flow cytometry platform used for drug identification, and is a co-founder of IntelliCyt, a company that manufactures HyperCyt. Alan Waggoner is an inventor of the FAP technology and the scientific co-founder of Sharp Edge Labs, which markets this technology. Jonathan Jarvik is an inventor of the FAP-tagged GPCRs technology, which is marketed by SpectraGenetics, a company co-founded by Dr Jarvik.
Funding
The authors disclosed receipt of the following financial support for the research, authorship, and/or publication of this article: This research was supported by US National Institutes of Health 1U54MH084690-02 (LAS), 5U54MH084690-03 CDP2 (YW and LAS), U54MH084659 (SRS, ARG, CWL), and 5U54RR022241 (ASW). Some data were generated in the Flow Cytometry Shared Resource Center supported by University of New Mexico Health Sciences Center and the University of New Mexico Cancer Center. Images in this article were generated in the University of New Mexico & Cancer Center Fluorescence Microscopy Shared Resource, funded by the US National Cancer Institute (NCI P30 CA118100).
References
Supplementary Material
Please find the following supplemental material available below.
For Open Access articles published under a Creative Commons License, all supplemental material carries the same license as the article it is associated with.
For non-Open Access articles published, all supplemental material carries a non-exclusive license, and permission requests for re-use of supplemental material or any part of supplemental material shall be sent directly to the copyright owner as specified in the copyright notice associated with the article.