
Abstract
Image-processing programs are used to identify and classify eukaryotic cell colonies as spots following seeding at low density on dishes or in multiwell plates. The output from such approaches, however, is generally limited to 1–2 parameters, and there is no ability to extract phenotypic information at the single colony level. Furthermore, there is a lack of user-friendly pipelines for analysis of clonogenicity in the context of high-content analysis. This article describes an experimental and multiparametric image analysis workflow for clonogenic assays in multiwell format, named the Colony Assay Toolbox (CAT). CAT incorporates a cellular-level resolution of individual colonies and facilitates the extraction of phenotypic information, including the number and size of colonies and nuclei, as well as morphological parameters associated with each structure. Furthermore, the pipeline is capable of discriminating between colonies composed of senescent and nonsenescent cells. We demonstrate the accuracy and flexibility of CAT by interrogating the effects of 2 preclinical compounds, Nutlin-3a and ABT-737, on the growth of human osteosarcoma cells. CAT is accessible to virtually all laboratories because it uses common wide-field fluorescent microscopes, the open-source CellProfiler program for colony image analysis, and a single fluorescent dye for all the segmentation steps.
Introduction
The mammalian colony outgrowth assay is a widely used in vitro approach within the oncology research field.1,2 Indeed, the clonogenic assay is considered a “gold standard” in terms of evaluating the efficacy of treatments, including radiation and novel potential antitumor drugs. This methodology, however, relies predominantly on manual counting of colonies, which is a time-consuming and subjective process. When evaluating the effects of drug combination treatments over several concentrations and conditions using colony formation assays, the increased number of samples rapidly becomes a burden in terms of time and reagent cost. Thus, there is a clear need for the development of platforms that enable automated image capture and analysis. In this regard, several groups have developed automated threshold methods to segment images of colonies. Computer-aided colony-counting methods have addressed some difficulties associated with the segmentation of overlapping colonies or of colonies at the periphery of a culture dish. Two independent groups improved the analysis either by means of an edge segmentation coupled to a compact Hough transform 3 or by using a model-based segmentation process based on prior knowledge of colony shape. 4 Although these automated counters decrease the subjectivity of colony counting, they can process only 1 dish at a time. This has been somewhat improved by Dahle et al., 5 who used a flatbed scanner to count colonies in 12 culture dishes simultaneously. Laser scanning microplate cytometry also improves throughput; indeed, this technology has been used to determine the colony number in a 24-well format through the application of a volume algorithm. 6 All of these approaches, however, suffer from poor resolution in terms of high-content information. Although they do provide information on area and density distribution in addition to the number of colonies, the methods lack depth of information regarding single-colony composition as well as cell number, cell shape, cell size, and DNA content. Recently, Katz et al. 7 were able to extrapolate more information from a single clonogenic assay by using high-content microscopy and an integrated software for automated colony counting. The cost of this type of integrated technology, however, together with the use of expensive dyes for colony staining, is prohibitive for many laboratories that wish to perform automated clonogenic assays. Thus, several groups have implemented automated colony analysis of crystal violet–stained colonies in culture dishes using freely distributed programs either as standalone solutions (CellProfiler8,9 and OpenCFU 10 ) or as macros in ImageJ (National Institutes of Health, Bethesda, MD 11 ). Recently, the ImageJ plugin entitled ColonyArea was developed for quantitative analysis of the area covered by foci of cell colonies in scanned 6- to 24-well plates stained by crystal violet. 12 This plugin demonstrates the simplicity and efficiency of analysis routines that can provide information regarding colony area and an indirect estimation of cellular density within colonies by means of crystal violet staining intensity. Still, in view of the wealth of high-content information potentially available in clonogenic assays, it would be useful to improve image resolution while preserving throughput; such optimization should also be accessible to biologists with no specialized knowledge of programming languages.
To meet these needs, we have developed the Colony Assay Toolbox (CAT), which is an improved end-to-end approach for clonogenic assays that enhances the cost-effectiveness in terms of materials, instruments, and software, and also decreases the total time required for experimental procedures and analytical follow-up. CAT also allows the user to discern phenotypic information for individual colonies that would otherwise require specialist stains or direct observation by a trained operator. These improvements were achieved by using (1) a common wide-field fluorescent microscope with a 4× objective, (2) a 96- or 384-multiwell plate format to improve throughput, (3) an algorithm for analysis segmentation developed in the open-source CellProfiler image analysis software,8,9 (4) and the ability to use a single dye to concurrently label for nuclei and segment for colonies.
The performance of the CAT system and the robustness of the pipeline were evaluated by comparing 2 colony segmentation methods, regular plastic versus optical multiwell plate formats, and different microscope and camera systems. We also compared the output and performance of CAT to a commonly used adenosine triphosphate (ATP)-based cell viability assay. CAT was able to accurately determine the in vitro potency of the p53-activating agent, Nutlin-3a, yielding values almost identical to those in previously published studies.13,14 Furthermore, CAT revealed that although treatment with Nutlin-3a alone leads to senescence, a combined treatment with the BCL2 antagonist ABT-737 abrogates this response and instead triggers tumor cell death.
Materials and Methods
96-Well Colony Formation Assay, Drug Treatments, and Viability Assay
U2OS osteosarcoma cell lines (see Suppl. Material for cell culture conditions) were trypsinized, counted, and plated at different densities ranging from 25 to 400 cells/well on plastic (tissue culture–treated Falcon #3072; Corning, Corning, NY) or clear optical (tissue culture–treated Costar #3904; Corning) 96-well plates. Most of the experiments were performed in plastic plates unless otherwise specified. Colony formation was monitored for 6–7 days, after which colony analysis and viability assays were carried out. Cell densities between 25 and 150 cells/well were found to be optimal for our requirements. Single-drug treatments with Nutlin-3a and combinatorial treatments with ABT-737 were performed following seeding at 150 cells/well.
Cells were allowed to attach overnight and then treated with 0, 0.5, 1.5, 2.5, and 5 μM of Nutlin-3a (SML0580-5MG; Sigma-Aldrich, St. Louis, MO) alone or in combination with 0.5, 1.5, 2.5, and 5 μM of ABT-737 (sc-207242; Santa Cruz, Dallas, TX). All of the solutions were prepared in such a manner that the final DMSO concentration was the same (0.01%) in all treatments. After 6–7 days, the colonies were fixed and stained.
Interwell homogeneity and even cell distribution within wells were achieved using an automated liquid dispenser (Multidrop Combi Reagent Dispenser; Thermo Scientific, Waltham, MA).
The CellTiterGlo viability assay used in this article is described in the Supplementary Material.
Immunofluorescence Protocol
To perform image acquisition and automated image analysis of colonies, cells were labeled with DAPI dye and (when reported) with HCS CellMask Red Stain by using the immunofluorescence protocol detailed in the Supplementary Material.
Fluorescent Microscopy
The 96-well assay plates were scanned by 1 of the following wide-field inverted fluorescent microscopes: a Nikon-Ti Eclipse (Tokyo, Japan), an Olympus Scan^R (Tokyo, Japan), or an AMG EVOS digital microscope (Life Technologies, Carlsbad, CA). A 4× objective was used in all of the systems to acquire a large area of the well. Depending on the experiment, 1 or 2 fluorescent channels were acquired per well: DAPI for nuclear staining and CellMask for whole cell staining. Further details are described in the Supplementary Material.
Image Processing
The algorithms for image segmentation described in this work were implemented as modules in CellProfiler image analysis software.8,15
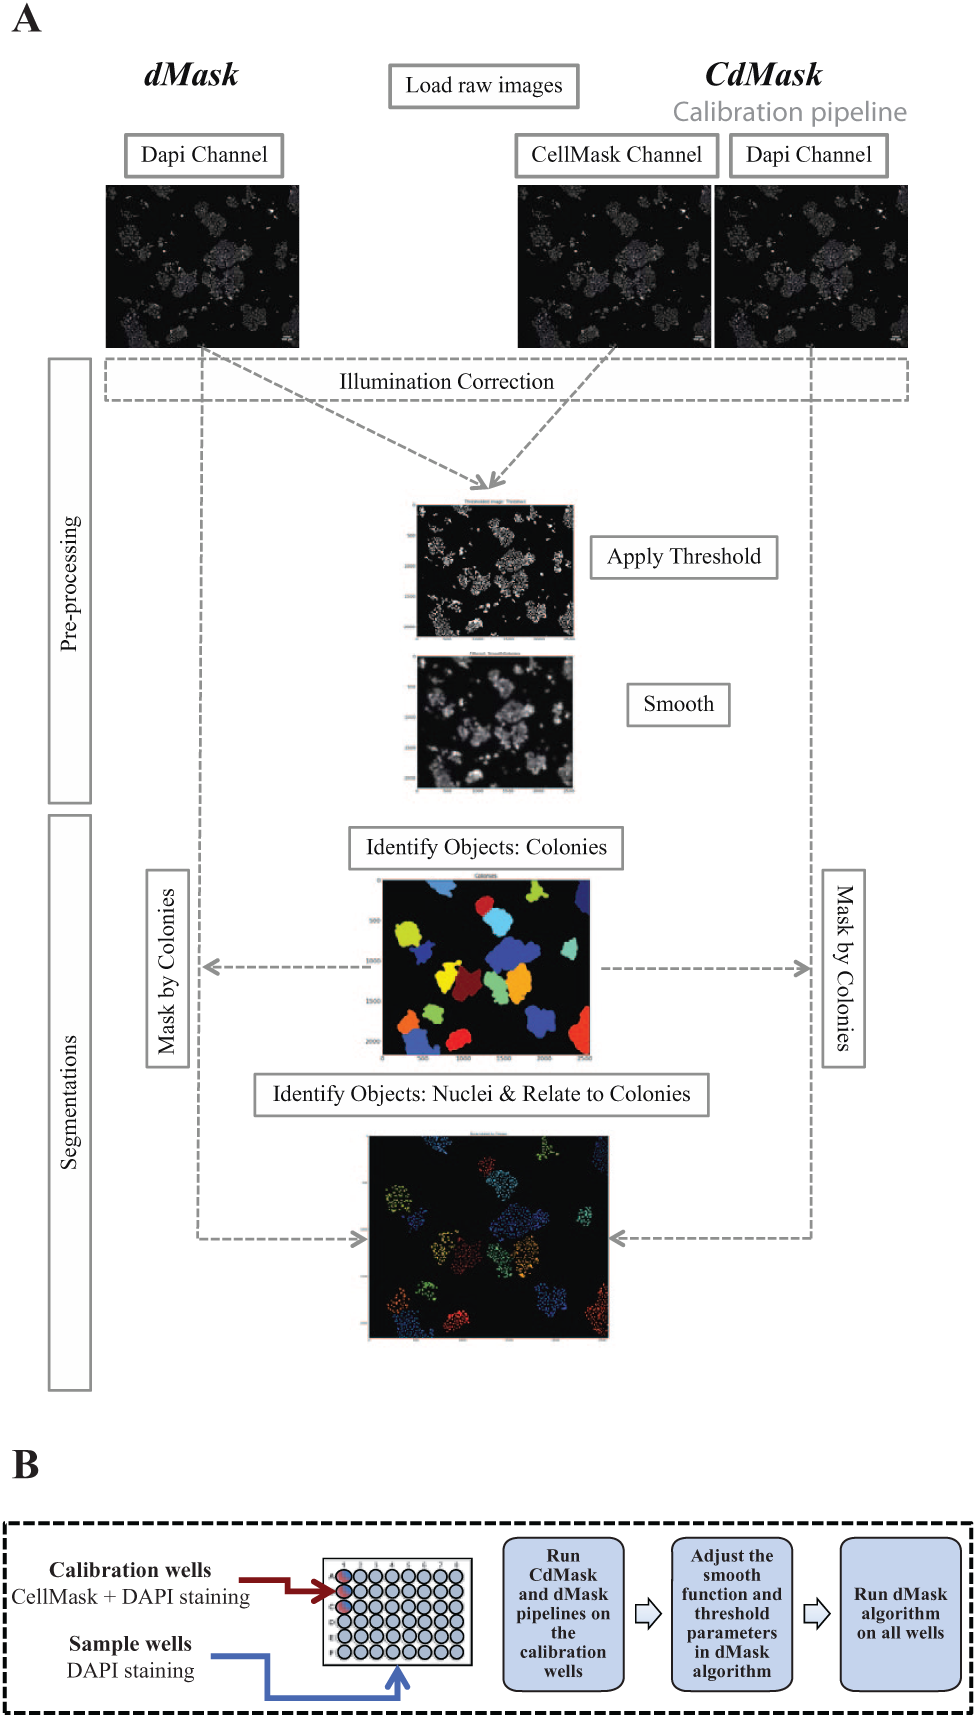
All of the images acquired were initially processed to correct for the uneven illumination. To remove differences in light intensities throughout the well, we used a regular correction function for both the DAPI and CellMask channels (CorrectIlluminationCalculate Module). The algorithm processed the raw images by rescaling the intensity at each pixel of the image. Next, we applied an average smoothing function that resembled the uneven illumination pattern of the raw images. Finally, the resulting correction pattern was applied to the raw images (CorrectIlluminationApply Module).
When the images were scanned with the EVOS digital inverted microscope, 2 steps were added to the pipeline before the correction illumination module: 1 to convert the color images using the ColorToGray Module (because the digital output of the images is JPEG format), and 1 to correct the alignment of the blue and red channels using the Align Module because of a small shift in the x–y coordinates. The alignment correction was not required for images generated by the Nikon or Olympus microscopes.
The image-processing algorithm called dMask (for DAPI mask) was designed to use the DAPI channel alone to segment for both nuclei and colonies simultaneously. The method was compared and parameters optimized with the same pipeline workflow but using the dual-staining CellMask–DAPI to segment for colonies and nuclei, respectively. This latter algorithm was termed CdMask (for CellMask and DAPI mask) and was required for the calibration procedure solely at the start of a new screening experiment. Specifically, CdMask was used to fix parameters for a good estimation of colonies’ shapes and sizes. These parameters are then used to adjust the smoothing function (Smooth Module) and intensity thresholds (IdentifyPrimaryObjects Module) of the dMask method to obtain the same number and size of colonies reported by the calibration pipeline.
dMask pipeline (
Fig. 1A
,
(
Subsequently, the thresholded images were submitted to a Gaussian smooth filter with a kernel size at least twice the mean diameter of U2OS nuclei (Smooth Module). This size-related smoothing filter was required so that colony segmentation obtained by the machine was consistent with the size and number of colonies identified by trained researchers, and it also compared well with CellMask staining. Next, the smoothed images were used to identify colonies as primary objects (IdentifyPrimaryObjects Module) by using the Otsu intensity threshold method. Clumped colonies were separated based on shape features, and typical diameters ranging between 125 and 2500 pixels were optimal to distinguish all colony sizes present in our images.
Next, colony segmentation was used to mask the DAPI-corrected channels (Mask Module) and to identify discrete nuclei within colonies (IdentifyPrimaryObjects Module). The Otsu intensity threshold method was able to robustly distinguish foreground from background regions; to remove background artifacts due to intraexperimental variations in the staining procedure or in object numbers in the field of view (FOV; i.e., no or few colonies in the FOV), some minor adjustments in the minimum and maximum allowable thresholds may be required on a day-to-day basis.
Clumped nuclei were separated based on intensity values, and we found that typical diameters ranging between 6 and 35 pixels were optimal for distinguishing all nuclei present in our images.
Finally, we assigned relationships between children objects (nuclei) and the associated parent objects (colonies) based on spatial reference (RelateObjects Module).
CdMask calibration pipeline (
Fig. 1A
,
Finally, relationships were assigned between children objects (nuclei) within the proper parent objects (colonies) based on spatial reference (RelateObjects Module).
Data and Statistical Analysis
Data generated during the CellProfiler pipelines were exported to .csv files and analyzed using OriginPro data analysis and graphing software by OriginLab (Northampton, MA).
Further details are described in the Supplementary Material.
Results
Calibration Procedures to Set and Optimize the dMask Pipeline
Our method for segmentation of colony images was developed within the CellProfiler environment8,9 (www.cellprofiler.org). The pipeline was named dMask because it was able to perform segmentation of both colonies and nuclei by recording the single DAPI intensity channel. Once acquired, the DAPI images were loaded and analyzed by the pipeline.
Following pre-processing steps, the resulting DAPI smoothed images were segmented for colonies (
Fig. 1A
,
The challenge during the design of the dMask pipeline was to define the smoothing function in such a way that it expanded the nuclear staining to the entire area of the cell within the membrane. Because nuclear staining does not permit the detection of cellular boundaries, a whole-cell staining using CellMask was necessary to acquire the “cell shape” parameter. Thus, at the beginning of a new colony assay screening experiment, we labeled and recorded both DAPI and CellMask channels for only a selected range of colony densities, whereas the rest of the wells in the plate were stained with only DAPI (
Fig. 1A
,
With this approach, we obtained a suitable overlap among the number of colonies detected by the dMask process and the CdMask segmentation, with a maximum differences of 1–2 colonies between the 2 methods. Moreover, there was excellent overlap between the 2 pipelines with regard to estimation of the total area covered by colonies within the FOV (
Accordingly, data obtained using the single DAPI stain and the dMask segmentation algorithm were as robust as those obtained using the standard dual-staining CdMask method. 16
Moreover, dMask significantly decreases not only the material costs (by using exclusively DAPI staining after the initial calibration plate is run) but also the time for the experimental procedure (≅50 min), image acquisition (1 single fluorescent channel), and data analysis (the latter used between 20 and 60 min for a 96-well plate) (
Quantitation of Colony Growth in a 96-Well Format
Colony outgrowth is one of the gold standard in vitro tests for the efficacy of potential therapeutic agents. We thus reasoned that miniaturizing this assay to a multiwell format would increase the throughput of clonogenic assays during compound testing. Initially, we tested the ability of the algorithm to detect colony formation in a commonly used plastic 96-well plate format (Falcon #3072). Specifically, U2OS cells were seeded at 25, 50, 100, 200, and 400 cells/well on day 0. After 6–7 days, we stained the cells and scanned the wells. The acquired images were then loaded and run using the automated dMask method, and the images were segmented for nuclei and colonies, as described above ( Fig. 2A ).
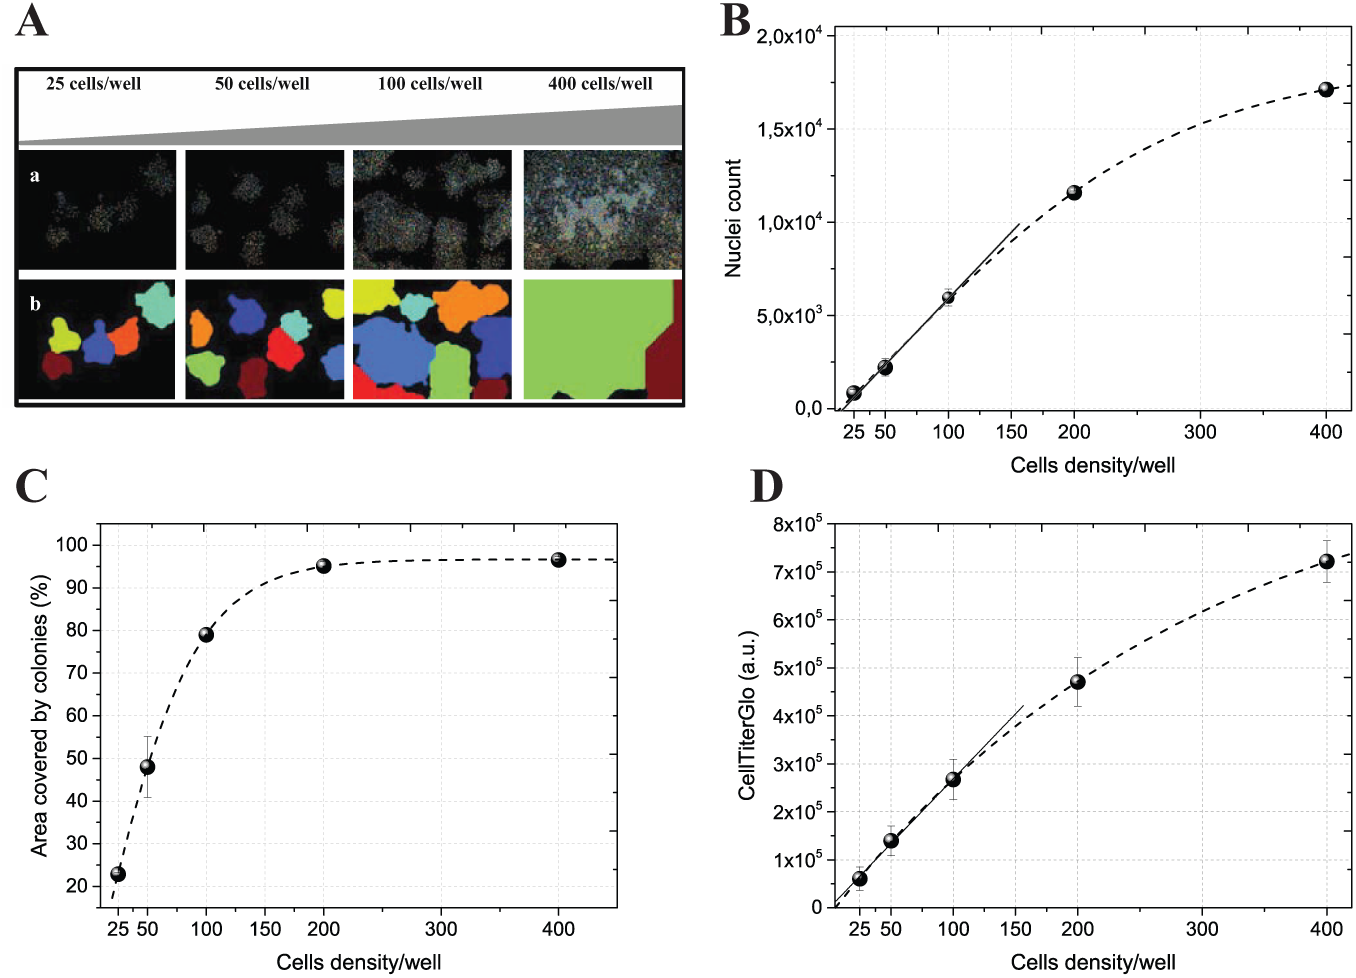
Estimation of colony formation for different cell densities. Several colony densities were obtained by seeding 25, 50, 100, 200, and 400 cells/well. DAPI mask (dMask) was run to segment for colonies and nuclei. (
For the data analysis, we decided to use a simplified alternative to colony number by determining the percentage of area covered by the colonies on a per-well basis and already used by other groups.12,17–19 Indeed, we wanted to design the present analysis in such a way that a single algorithm could provide an estimation of colony formation regardless of the precise density of colonies per well. Moreover, the relationship between the number of cells seeded and the number of colonies formed is not one-to-one due to differences in plating efficiency; thus, increasing the initial cell density could result in fewer colonies than expected. 20 In addition, wells in which cells were seeded at low cell density (i.e., 150 cells/well in a 96-well format) and left untreated were almost confluent by 6 days, precluding an accurate quantification of colony numbers. Thus, the area occupied by each colony most accurately reflected “colony formation units”; also, the output data were independent from numbering clustered colonies in high-density samples.
Hence, for each cell density, we measured 2 indices that characterized the colony growth. First, we calculated the proliferative potential by extracting the number of nuclei per colony. Second, colony-forming potential was evaluated by analyzing the total area covered by colonies in each well. The initial threshold number of nuclei that an object had to contain to be scored as a colony was ≥40, because this is the minimum number that is consistent with growth throughout a 6–7-day period. Subconfluent growth conditions (ca. 104 cells/well) were found by seeding from 25 to 150 cells per well at day 0 (
Fig. 2B
). Within this range, the area occupied by colonies increased linearly with cell density and covered from 20% to 80% of the total FOV area (
Fig. 2C
). Similar results were obtained for U2OS colony-forming units’ growth on 96-well optical plates (

where t is the growth period; N0 is the initial number of cells; and Nt is the final number of cells. The results indicated a td of approximately 24 h and 26 h for U2OS growing on plastic and optical 96-well formats, respectively (data not shown).
Drug Dose–Response Curve Validation
The utility of dMask for evaluating compound activity was therefore investigated using a preclinical compound to treat U2OS osteosarcoma cells, which express the wild-type allele of the p53 tumor suppressor (p53WT). 21 We tested Nutlin-3a (Nut-3a), a nongenotoxic MDM2 antagonist that induces p53-dependent growth arrest or apoptosis, depending on the cell type.
Initially, we verified colony growth for each subconfluent cell density over a range of Nut-3a concentrations (data not shown). The goal here was to identify doses that partially suppressed colony outgrowth; this would facilitate the detection of combination treatments that further enhanced the cytotoxicity of Nut-3a. For this purpose, we chose to seed 150 cells/well at day 0, because seeding at a lower cell density led to virtually complete suppression of outgrowth with Nut-3a as a single agent (data not shown).
To validate the robustness of our dMask staining and pipeline in determining the IC50 for Nut-3a, we compared the data with those obtained by using the CdMask dual-staining and analysis pipeline.
The percentage of area occupied by colonies in each well was plotted against the Nut-3a dose. The dose–response and associated inhibitory curves for both the dMask and CdMask segmentation methods are shown in
Figure 3A
. The 2 curves, which were highly correlated with one another (
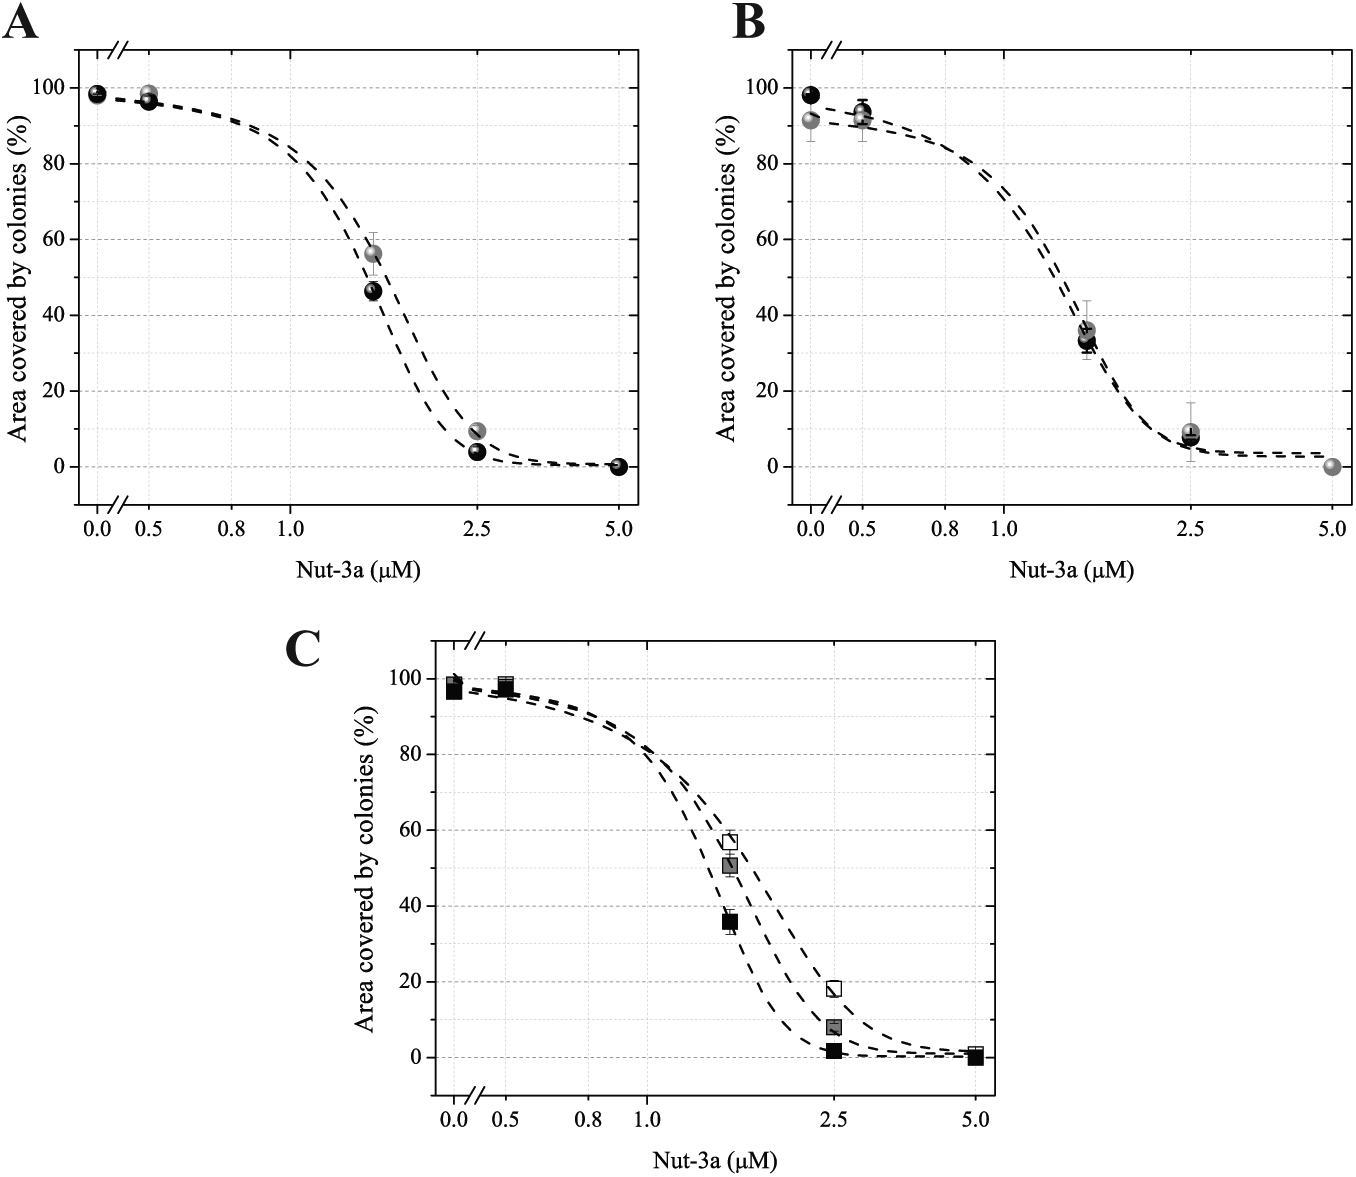
Nut-3a dose–response curves. Quantitation of the percentage of the area covered by the colonies following Nut-3a treatment. (
The consistency, accuracy, and robustness of the dMask method to account for drug IC50 were also underscored by performing Nut-3a titrations in optical-quality 96-well plates on 2 different image acquisition systems. Specifically, the same data set was acquired using both the Ti-Eclipse and Scan^R microscopes equipped with 2 different camera sizes: the Zyla CMOS camera and ORCA-ER camera, respectively. The resulting dimensions for a single FOV acquired with a 4× objective were 4.2×3.5 mm and 2.2×1.7 mm for Zyla and ORCA, respectively. Thus, 4 FOVs per well were acquired with the Scan^R to cover the same area acquired by a single FOV in the Zyla CMOS camera (
We also tested whether the IC50 calculations were affected by altering the size of the cutoff used to define colonies. To that end, we ran dMask segmentations in parallel when the size cutoffs for mean colony diameter were set to 200 µm, 400 µm, or 500 µm (
Because the IC50 was not significantly affected with any cutoff selected, and CellTiterGlo measurements performed on the same data set yielded similar values (
Extraction of Multiparametric Data from Colony Outgrowth Assays
We further compared the data derived from our analysis on Nut-3a treatments to those obtained using CellTiterGlo.
In
Figure 4
, the CellTiterGlo signal is plotted together with the nuclei number as obtained using the dMask method. We observed Nut-3a dose-dependent inhibition for both of these measurements. From each single response, however, we obtained singular parametric information. Indeed, proliferation (nuclei count) and metabolic activity (CellTiterGlo) were affected at low Nut-3a doses (≅0.5 µM), with a relative IC50 of 0.7±0.05 µM and 0.9±0.004 µM, respectively (
Fig. 4
), compared to colony formation (IC50 = 1.5±0.05 µM;
Fig. 3
and
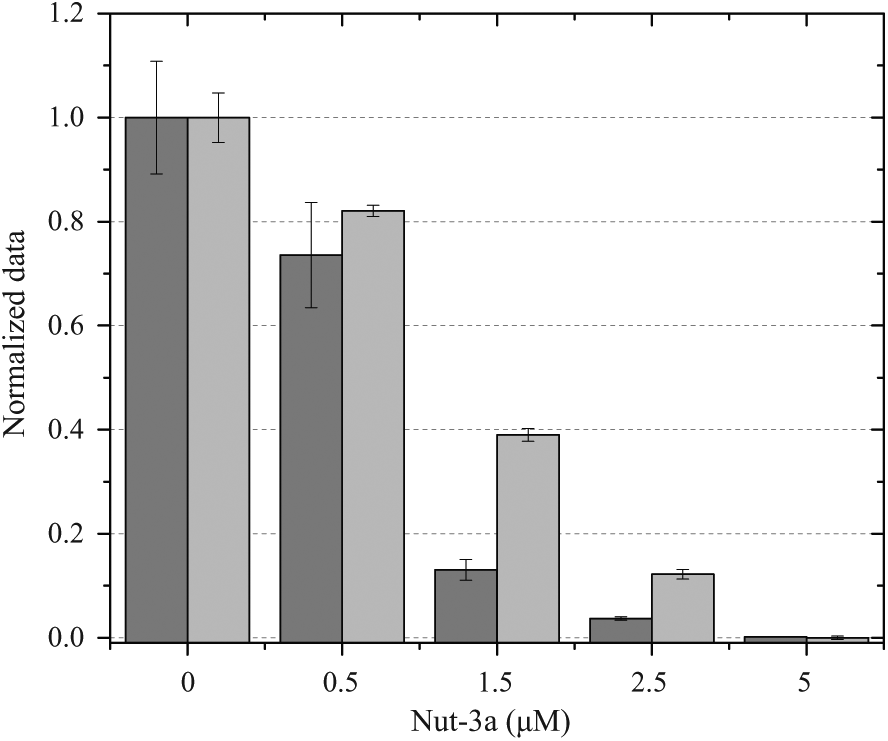
Relationship between metabolism and proliferation in Nut-3a treatment. The figure shows 2 parameters, proliferation (nuclei counts), and metabolic state [adenosine triphosphate (ATP) content], in the presence of increasing drug concentrations; the nuclei number obtained by dMask and the viability measurement obtained with CellTiterGlo are represented by dark gray and light gray bars, respectively. The ratio between ATP content and nuclei number gives a 3-fold increase in ATP demand for 1.5–2.5 µM of Nut-3a-treated cells compared to untreated cells or those treated with lower doses of drug. The data (mean and SE) for Nut-3a titrations are derived from triplicate experiments and are normalized to the control (0 µM Nut-3a).
An added advantage of the segmentation process that we developed is the ability to extract a series of morphological information, such as circularity, major and minor axis length (
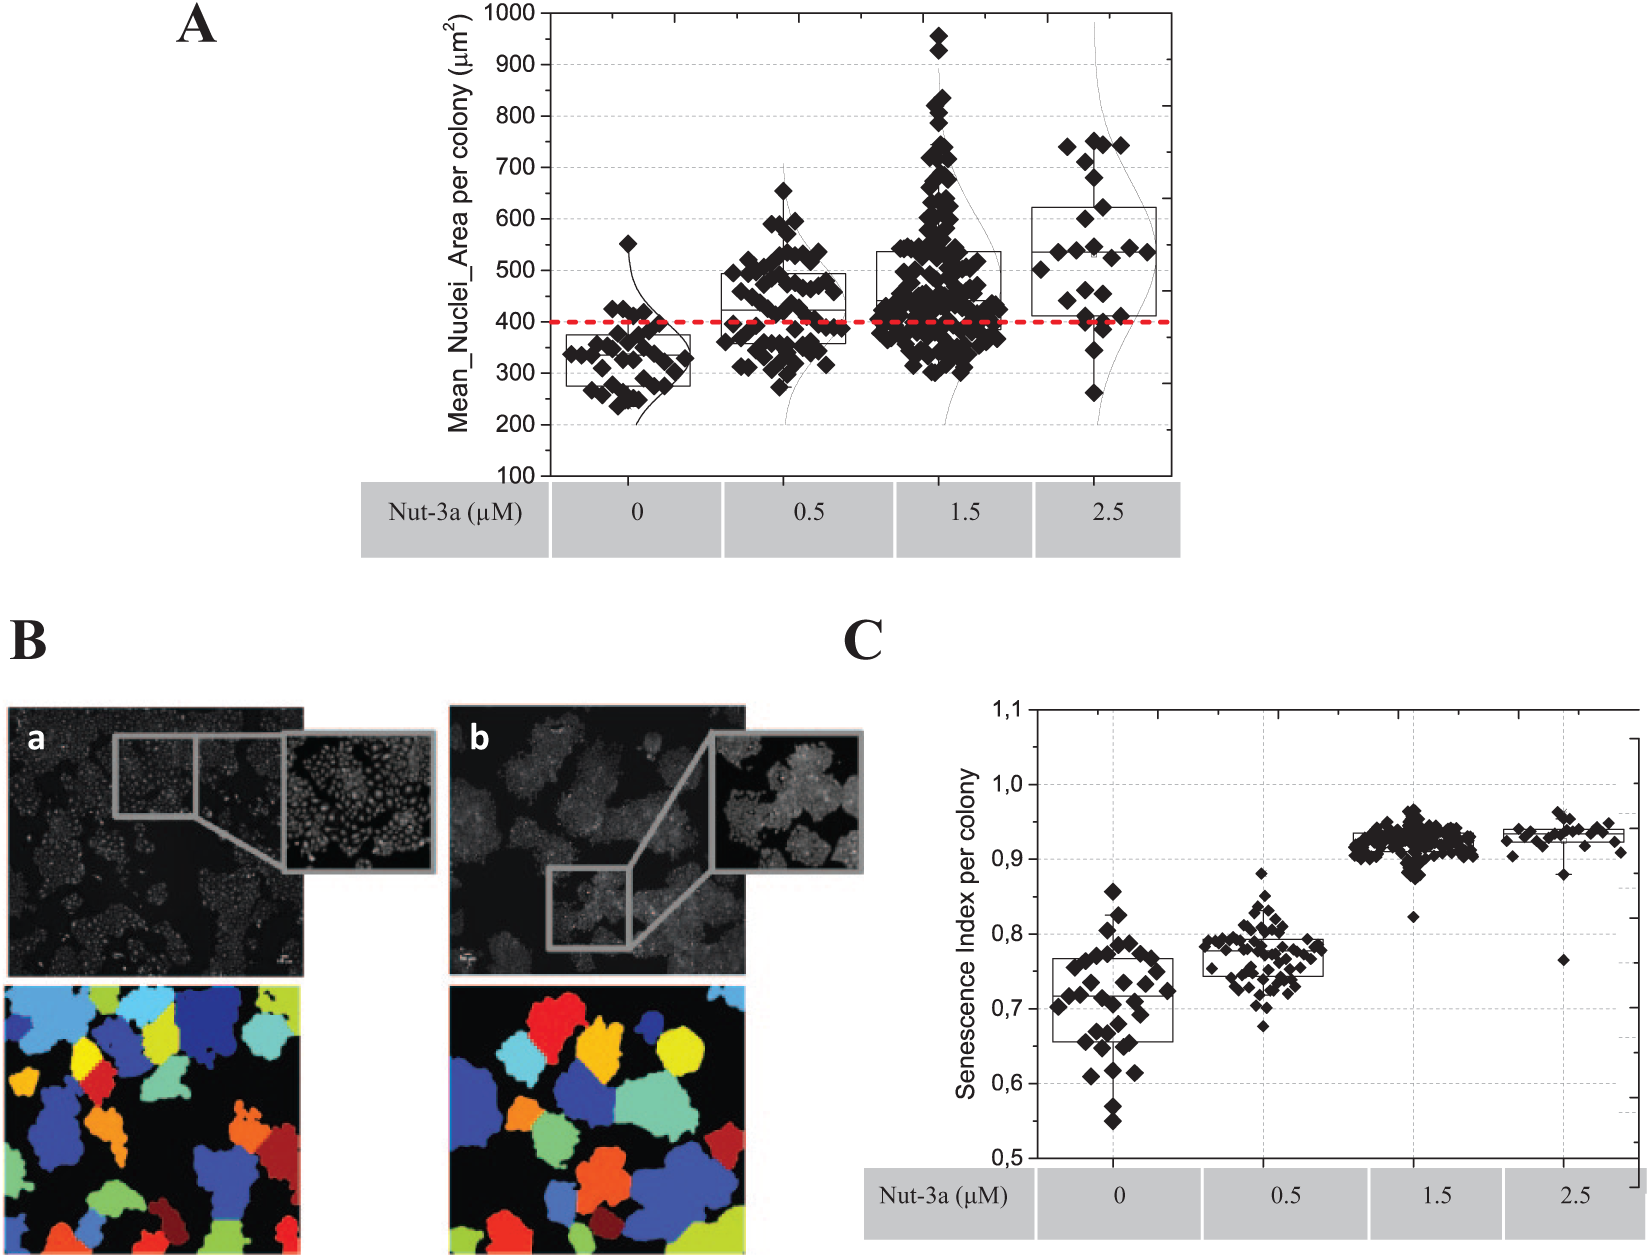
Phenotypic colony composition. (
To estimate this, we defined a Senescence Index (SI) [Equation (2)] for each colony as follows:

We assumed that a senescent colony in a drug-treated sample would occupy a similar overall area as, but have far fewer nuclei than, its nontreated counterpart.
The results of the SI analysis are shown in
Figure 5C
. Nut-3a treatment significantly increased the SI, which rose from 30% of colonies at 0.5 µM to 80% at 2.5 µM Nut-3a compared to untreated samples. Moreover, by fitting the mean SI per Nut-3a concentration, we obtained an IC50 value for senescence induction of 0.64±0.05 µM (
Finally, we assessed whether the toolbox could quantify the effects of combination treatments. For this purpose, we evaluated the phenotypic response of U2OS to a mixture of Nut-3a and ABT-737.
Figure 6A
shows the effect on the area occupied by colonies in single treatments. Increasing concentrations of Nut-3a affected the colony-forming potential, as shown above; in contrast, ABT-737 alone had no effect on the growth of U2OS at doses up to 5 µM. We verified colony growth over low doses of Nut-3a (0.5–1.5 µM) with a range of ABT-737 concentrations (data not shown). A combination of ABT-737 (up to 5 µM) with 0.5 µM Nut-3a did not show any effects on colony formation (data not shown). By contrast, ABT-737 significantly enhanced the toxicity of a dose of Nut-3a that, when used alone, caused senescence. Specifically, the combination of 2.5 µM ABT-737 and 1.5 µM Nut-3a elicited a significant 30% reduction in growth compared with Nut-3a alone at this dose (
Fig. 6B
; and
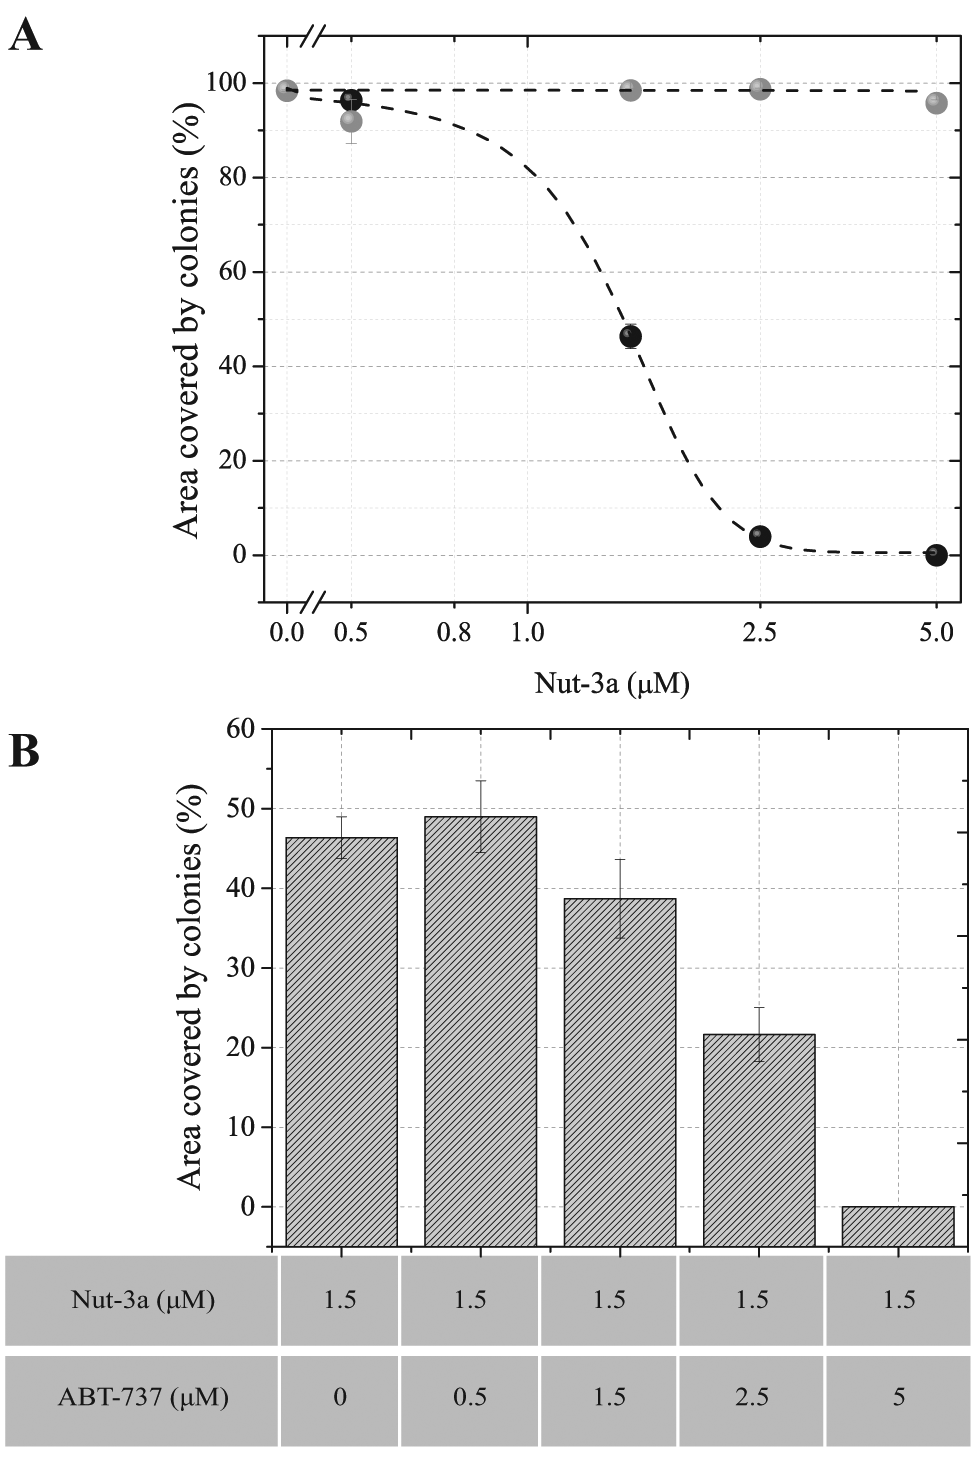
Evaluation of drug combinations. (
Discussion
The CAT system we describe here is characterized by a cellular-level resolution of colonies in multiwell format, which facilitates the extraction of high-content information from colony formation assays.
Following the initial calibration of the system with a pan-cellular stain such as CellMask, this workflow can be performed using only a nuclear stain. This method potentially could be applied to samples stained with a single dye that is able to label both the nucleus and cytoplasm, thereby obviating the need for a calibration procedure (data not shown). The cell type–dependent variability in the relative nuclear versus cytosolic staining efficiency of a specific single dye, however, will require careful consideration on a case-by-case basis. Thus, to provide a robust and universal method to automate colony analysis, we opted to introduce a nuclear stain combined with a short step for cell calibration (which is neither cost-prohibitive nor challenging in terms of analysis). Combined with the excellent performance of the dMask algorithm on regular (i.e., non-optical-quality), clear-bottom plastic plates, this makes CAT extremely low-cost.
In addition, the complete CAT workflow can be performed in a short period of time (comparable with other automated approaches10,12); indeed, only half a day was required from the staining procedure to the data analysis, which is a dramatic reduction compared to the time required for manual approaches (
In a single experiment, the CAT toolbox enables the user to optimize the measurement of the colony growth potential of any cell line in different multiwell formats (
The image segmentation and analysis we used enabled us to define and measure, in a colony assay format, an SI without the requirement for complex additional staining protocols. The hallmarks of senescence, such as hypertrophy of cells and nuclei,27,30,31 are induced by activated oncogenes and chemotherapeutic drugs, and thus have direct clinical relevance. We observed this phenotype in Nut-3a-treated (but not in ABT-737-treated) cells (
Fig. 5B
and
Induction of tumor cell senescence has been suggested as a potential chemotherapeutic strategy. The persistence of senescent cells that harbor oncogenic lesions, however, could increase the risk of tumor recurrence. Thus, shifting the phenotypic response from senescence toward apoptosis using combination therapies may be beneficial. We show here that the CAT method can be used to predict such drug combinations. For example, when compared with either single agent alone, the area covered by U2OS colonies was lower when Nut-3a (1.5 µM) was combined with ABT-737 (
Fig. 6B
). The remaining colonies, however, still exhibited a senescent phenotype (data not shown). Notably, senescence was not observed with ABT-737 alone. Together, these data confirm that in these cells, ABT-737 induced neither apoptosis (
Fig. 6A
) nor senescence (
In some contexts, subtle phenotypic changes, such as changes in the nuclear length–width ratio, may precede more “obvious” effects, such as cell death or inhibition of proliferation. Although this was not the case with Nut-3a in our experiments (
We note that CAT was developed using U2OS, which is representative of a number of “workhorse” tumor cell lines used for image-based screening. Such lines perform well with wide-field imaging systems due to their planar morphology and well-separated nuclei. The extension of CAT to cell lines in which nuclei within colonies are close to one another or to 3D culture models will require careful consideration on a case-by-case basis.
We tested CAT in other human tumor cell lines with more tightly clustered nuclei (HeLa adenocarcinoma and A375 melanoma), however; our system was able to segment colonies and extract proliferative information in these cell types and in higher density multiwell formats (
In conclusion, the Colony Assay Toolbox (CAT) enables the multiparametric analysis of mammalian cell colony-forming potential. The multiwell format of this assay, combined with a simple and cost-effective experimental procedure, renders CAT accessible to virtually all laboratories. In contrast to previous methods, a single dye for nuclear staining and a simple pipeline (dMask) were sufficient for the extraction of high-content information, even in the context of a colony assay, due to the level of single-cell resolution obtained; the procedure also leaves other fluorescence channels available for the additional labeling of organelles or proteins. Furthermore, the simple workflow allows the user to set up the image analysis without prior knowledge of programming languages. Moreover, the use of wide-field microscopes and our integration with CellProfiler, an open-source image analysis environment, make this protocol widely accessible. The CAT system can thus be used as a high-content alternative to quantify colony growth in the context of combinatorial drug treatments, and it can be exploited in both compound and functional genomic screens to identify regulators of senescence. The pipelines used in this work are also available freely for download both at the CellProfiler Web site (www.cellprofiler.org) and at our Web site (http://genomics.iit.it/core-platforms/high-throughput-screening-unit.html).
Footnotes
Declaration of Conflicting Interests
The authors declared no potential conflicts of interest with respect to the research, authorship, and/or publication of this article.
Funding
The authors received no financial support for the research, authorship, and/or publication of this article.
References
Supplementary Material
Please find the following supplemental material available below.
For Open Access articles published under a Creative Commons License, all supplemental material carries the same license as the article it is associated with.
For non-Open Access articles published, all supplemental material carries a non-exclusive license, and permission requests for re-use of supplemental material or any part of supplemental material shall be sent directly to the copyright owner as specified in the copyright notice associated with the article.