
Abstract
In recent years, advances in structure-based drug design and the development of an impressive variety of high-throughput screening (HTS) assay formats have yielded an expanding list of protein-protein interaction inhibitors. Despite these advances, protein-protein interaction targets are still widely considered difficult to disrupt with small molecules. The authors present here the results from screening 220,017 compounds from the National Institute of Health’s small-molecule library in a novel p53-hDM2 protein-protein interaction biosensor (PPIB) assay. The p53-hDM2 positional biosensor performed robustly and reproducibly throughout the high-content screening (HCS) campaign, and analysis of the multiparameter data from images of the 3 fluorescent channels enabled the authors to identify and eliminate compounds that were cytotoxic or fluorescent artifacts. The HCS campaign yielded 3 structurally related methylbenzo-naphthyridin-5-amine (MBNA) hits with IC50s between 30 and 50 µM in the p53-hDM2 PPIB. In HCT116 cells with wild-type (WT) p53, the MBNAs enhanced p53 protein levels, increased the expression of p53 target genes, caused a cell cycle arrest in G1, induced apoptosis, and inhibited cell proliferation with an IC50 ~4 µM. The prototype disruptor of p53-hDM2 interactions Nutlin-3 was more potent than the MBNAs in the p53-hDM2 PPIB assay but produced equivalent biological results in HCT116 cells WT for p53. Unlike Nutlin-3, however, MBNAs also increased the percentage of apoptosis in p53 null cells and exhibited similar potencies for growth inhibition in isogenic cell lines null for p53 or p21. Neither the MBNAs nor Nutin-3 caused cell cycle arrest in p53 null HCT116 cells. Despite the relatively modest size of the screening library, the combination of a novel p53-hDM2 PPIB assay together with an automated imaging HCS platform and image analysis methods enabled the discovery of a novel chemotype series that disrupts p53-hDM2 interactions in cells.
Keywords
Introduction
T
The structural interactions between p53 and hDM2 have been well characterized. 24,25 The N-terminus of p53 (Phe19, Trp23, and Leu26) binds to a small hydrophobic pocket on the surface of hDM2. Nutlin-3s, a class of cis-imidazoline analogs, were the first potent small-molecule inhibitors of the p53-hDM2 protein-protein interaction to demonstrate in vivo stabilization of p53 and suppression of tumor growth in xenograft models. 21 Since then, other small molecules have been identified that disrupt the p53-hDM2 interaction. 26 Compounds that inhibit the E3-ubiquitin ligase activity of hDM2 directly are also under investigation as a means to stabilize p53 protein levels and suppress tumor progression. 27,28 Another popular strategy to reactivate p53 is to pharmacologically assist mutant (or in some cases wild-type) p53 to fold into an active state and to restore transactivation activity. CP-31398, 19 PRIMA, 18 RITA, 29 MIRA, 30 and MITA 20 all stabilize mutant p53 and permit transactivational activity. However, the mechanism(s) by which these compounds reactivate p53 remain unclear. Despite a significant drug discovery effort culminating in the identification of several lead compounds that stabilize p53 protein levels and reactivate p53 functions, none of these compounds has yet to be approved for clinical use in cancer therapy.
In this report, we present the results from the implementation of a high-content screening (HCS) campaign to identify disruptors of the interaction between p53 and hDM2 using a novel p53-hDM2 protein-protein interaction biosensor (PPIB) to screen a 220,017-compound library. We document the performance of the p53-hDM2 PPIB in HCS and illustrate the use of the multiparameter image analysis data extracted from the 3 fluorescence channels of the PPIB to identify cytotoxic compounds and fluorescent outlier artifacts. We present data on the confirmation of primary HCS actives in concentration response assays together with the chemical structures of the hit compounds. We present data on the characterization of the methylbenzonaphthyridine hit series for stabilization of p53, transcriptional activation of hDM2 and p21 in Western blotting assays, effects on growth inhibition, cell cycle arrest, and the induction of apoptosis in a panel of isogenic HCT116 cell lines that are wild type (WT) for p53 or that are p53 or p21 null.
Materials and Methods
Reagents
Nutlin-3, nocodazole, camptothecin, formaldehyde, and Hoechst 33342 were purchased from Sigma-Aldrich (St. Louis, MO). DMSO (99.9% high-performance liquid chromatography grade, under argon) was from Alfa Aesar (Ward Hill, MA).
Cell culture
HCT116 and U-2 OS cell lines were acquired from American Type Culture Collection (Manassas, VA). The HCT116-p53 null and HCT116-p21 null cell lines were a gift from Dr. Bert Vogelstein (Johns Hopkins University). All cell lines were maintained in McCoy’s 5A medium with 2 mM L-glutamine (Invitrogen, Carlsbad, CA) supplemented with 10% fetal bovine serum (Gemini Bio-Products, West Sacramento, CA) and 100 U/mL penicillin and streptomycin (Invitrogen) in a humidified incubator at 37°C with 5% CO2.
Compound library
The 220,017 compounds and cherry-picked actives from the primary p53-hDM2 HCS assay were supplied to the Pittsburgh Molecular Library Screening Center (PMLSC) by the National Institutes of Health (NIH) small-molecule repository (SMR; Biofocus-DPI, a Galapagos company, San Francisco, CA) as part of the Molecular Library Screening Center Network (MLSCN) pilot phase as described previously. 31-33 The NIH library was supplied at 10 mM concentration in DMSO arrayed into 384-well microtiter master plates. NIH compounds were identified by their PubChem substance identity numbers (SIDs). Daughter plates containing 2 µL of 10 mM compounds in DMSO were prepared and replicated from the MLSCN master plates using the VPrep (Velocity11, Menlo Park, CA) outfitted with a 384-well transfer head. Aluminum adhesive plate seals were applied with an Abgene Seal-IT 100 (Rochester, NY) plate sealer, and plates were stored at –20°C in a Matrical MatriMinistore™ (Spokane, WA) automated compound storage and retrieval system. For the primary screen, immediately prior to use, daughter plates were withdrawn from –20°C storage, thawed at ambient temperature, and centrifuged 1 to 2 min at 50 g, and the plate seals were removed prior to the transfer of 78 µL of McCoy’s 5A media into wells using the FlexDrop liquid handler (PerkinElmer, Waltham, MA) to generate a 200-µM intermediate stock concentration of library compounds (in 2.5% DMSO). The diluted compounds were mixed by repeated aspiration and dispensation using a 384-well P30 dispensing head on the Evolution-P3 (EP3) liquid handling platform (PerkinElmer), and then 5 µL of diluted compounds was transferred to the wells of assay plates. In the primary screen, compounds were individually screened at a final concentration of 25 µM (0.25% DMSO). For the determination of the 50% inhibition concentrations (IC50), 10-point 2-fold serial dilutions of test compounds in McCoy’s 5A medium-DMSO were performed using a 384-well P30 dispensing head on the EP3 liquid handling platform. The diluted compounds were mixed by repeated aspiration and dispensation using a 384-well P30 dispensing head on the EP3, and then 5 µL of diluted compounds was transferred to the wells of assay plates to provide a final concentration response ranging from 0.195 to 50 µM.
p53-hDM2 protein-protein interaction biosensor HCS assay
The components of the p53-hDM2 protein-protein interaction biosensor have been described previously.
34
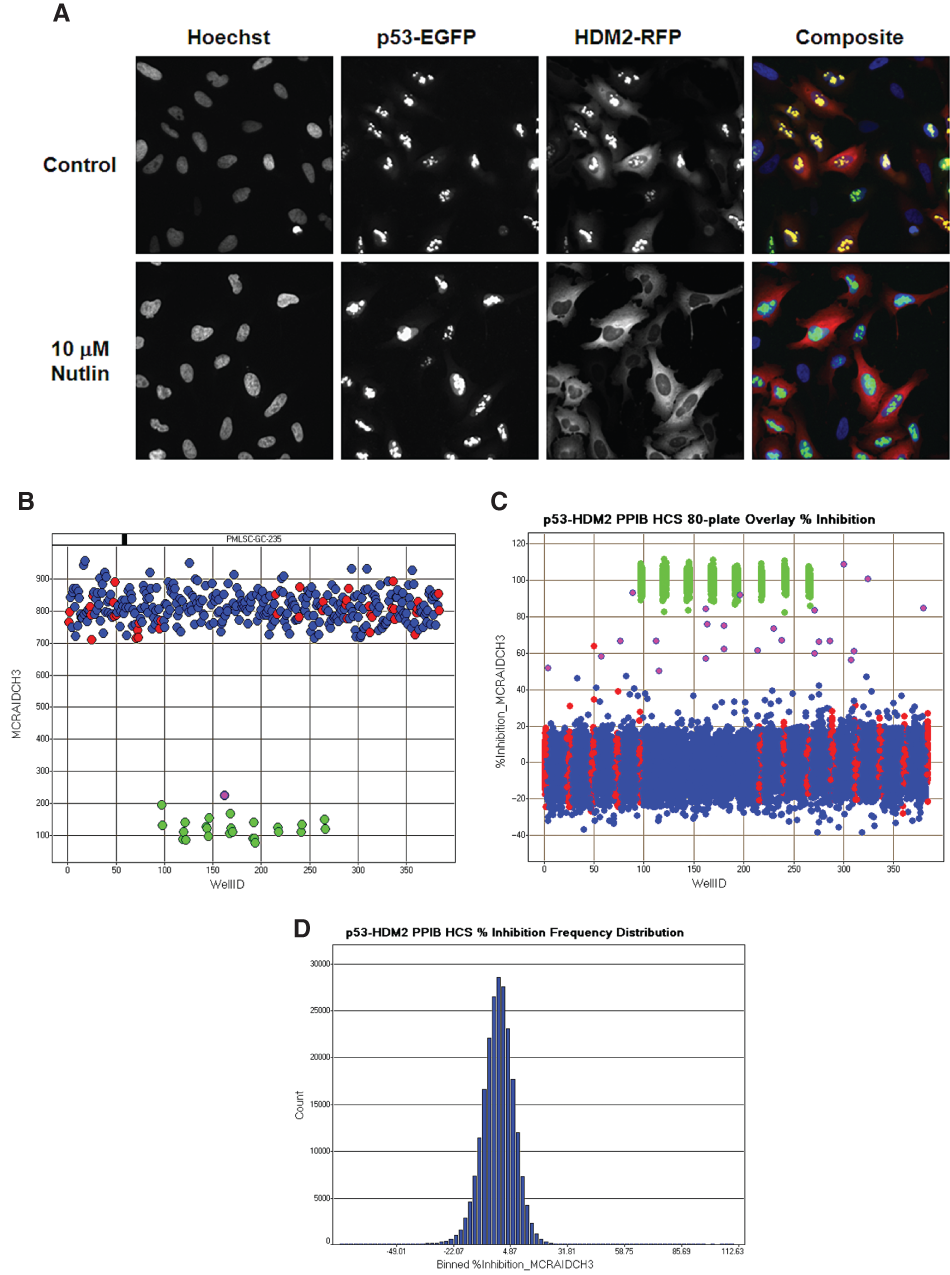
N-terminal residues 1-131 of p53 encompass the binding site for hDM2 that overlaps with the p53 transactivating domain. The p53-monomeric TagGFP (Evrogen, Inc., Moscow, Russia) fusion protein is targeted and anchored in the nucleolus by the inclusion of a nuclear localization (NLS) sequence. N-terminal residues 1-118 of hDM2 encompass the domain for binding to the N-terminal transactivating domain of p53. The hDM2-monomeric Tag RFP (Evrogen, Inc.) cytoplasm-nucleus shuttling protein interaction partner includes both an NLS and a nuclear export sequence (NES). When U-2 OS cells are coinfected with both adenovirus constructs, the hDM2 component binds to the p53 component, and both proteins become localized to the nucleolus (
High-content screening (HCS) assay performance. (
Image acquisition and analysis
Images of 3 fluorescent channels (Hoechst, GFP, and red fluorescent protein [RFP]) were sequentially acquired on the ArrayScan VTI platform using a 10× 0.3 NA objective with the XF93 excitation and emission filter set (Hoechst, FITC, and TRITC), and the images were analyzed using the molecular translocation image analysis algorithm. The ArrayScan VTI platform was set up to acquire 250 selected objects (nuclei) or 2 fields of view, whichever came first. The nucleic acid dye Hoechst 33342 was used to stain and identify the nucleus, and this fluorescent signal was used to focus the instrument and define a nuclear mask. Objects in channel 1 that exhibited the appropriate fluorescent intensities above background and size (width, length, and area) characteristics were identified and classified by the image segmentation as nuclei. The nuclear mask was eroded to reduce cytoplasmic contamination within the nuclear area, and the reduced mask was used to quantify the amount of target channel, p53-GFP (channel 2) or hDM2-RFP (channel 3), fluorescence within the nucleus. The nuclear mask was then dilated to cover as much of the cytoplasmic region as possible without going outside the cell boundary. Removal of the original nuclear region from this dilated mask created a ring mask that covered the cytoplasmic region outside the nuclear envelope. The image analysis algorithm outputs quantitative data such as the total and average fluorescent intensities of the Hoechst-stained objects (channel 1), the selected object or cell count from channel 1, the total and average fluorescent intensities of the p53-GFP (channel 2), and the hDM2-RFP (channel 3) signals in the nucleus (Circ) or cytoplasm (Ring) regions as an overall well average value or on an individual cell basis. To quantify the translocation of the hDM2-RFP from the nucleus to the cytoplasm induced by disruptors of the p53-hDM2 protein-protein interaction, the image analysis algorithm calculates a mean average intensity difference by subtracting the average hDM2-RFP intensity in the Ring (Cytoplasm) region from the average hDM2-RFP intensity in the Circ (Nuclear) region of channel 3: mean Circ-Ring average intensity difference channel 3 (MCRAID-Ch3).
p53-hDM2 automated HCS protocol
For a typical 50-plate day of HCS operations, 1 × 10⁷ U-2 OS cells were coinfected with the p53-GFP and hDM2-RFP adenovirus expression constructs by incubating cells with the manufacturer’s (Cellumen, Inc., Pittsburgh, PA) recommended volume of virus in 1.5-mL culture medium for 1 h at 37°C, 5% CO2 in a humidified incubator. Typically, ≥95% of cells were coinfected with both adenoviruses under these conditions. Coinfected cells were then diluted to 5.6 × 10⁴ cells/mL, and 45 µL (2500 cells/well) were seeded in each well of a 384-well collagen-coated barcoded microplate (#781986, Greiner Bio-One, Monroe, NC) using a Zoom liquid handler (Titertek, Huntsville, AL). Plates were incubated overnight at 37°C, 5% CO2 in a humidified incubator. Compounds or plate controls (5 µL) were added to appropriate wells using a VPrep (Velocity11) or an Evolution P3 (PerkinElmer) for a final screening concentration of 25 µM. Plates were incubated at 37°C for 90 min. Samples were fixed by the addition of 50 µL of prewarmed (37°C) 7.4% formaldehyde and 2 µg/mL Hoechst 33342 in phosphate-buffered saline (PBS) using a BioTek ELx405 (BioTek, Winooski, VT) or a MapC liquid handler (Titertek) and incubated at room temperature for 30 min. Liquid was then aspirated and plates were then washed twice with 85 µL PBS using the BioTek or MapC liquid handler and sealed with adhesive aluminum plate seals (Abgene) with the last 85-µL wash of PBS in place. Fluorescent images were then acquired on an ArrayScanVTI automated imaging platform (Thermo Fisher Scientific, Waltham, MA), and the images were analyzed using the molecular translocation image analysis algorithm as described above.
HCS data analysis, visualization, statistical analysis, and curve fitting
Data analysis for the primary HCS assay and IC50 determinations were performed using ActivityBase™ (IDBS, Guildford, UK) and CytoMiner (University of Pittsburgh Drug Discovery Institute), and processed data and HCS multiparameter features were visualized using Spotfire™ DecisionSite® (Somerville, MA) software. An ActivityBase primary HTS template was created that automatically calculated percent inhibition together with plate control signal-to-background (S/B) ratios and Z′ factors. For the HCS campaign, we used the mean MCRAID-Ch3 value of the DMSO minimum plate control wells (n = 32) and the mean MCRAID-Ch3 value of the 10 µM Nutlin-3 maximum plate control wells (n = 24) to normalize the MCRAID-Ch3 compound data and to represent 0% and 100% disruption/inhibition of the p53-hDM2 interactions, respectively. The PMLSC also constructed an ActivityBase concentration-response template to calculate percent inhibition together with plate control S/B ratios and Z′ factors for quality control purposes. IC50 values were calculated using an XLfit 4-parameter logistic model, also called the sigmoidal dose-response model: y = (A + ((B – A)/(1 + ((C/x)D)))), where y was the percent activation and x was the corresponding compound concentration. The fitted C parameter was the IC50 and defined as the concentration giving a response halfway between the fitted top (B) and bottom (A) of the curve. The A and B parameters were locked as 0 and 100, respectively. We also used GraphPad Prism 5 software to plot and fit data to curves using the following sigmoidal dose-response variable slope equation: Y = Bottom + [Top – Bottom]/[1 + 10(LogEC50-X) * Hill slope].
Z-score statistical methods for HCS outlier analysis and hit criterion
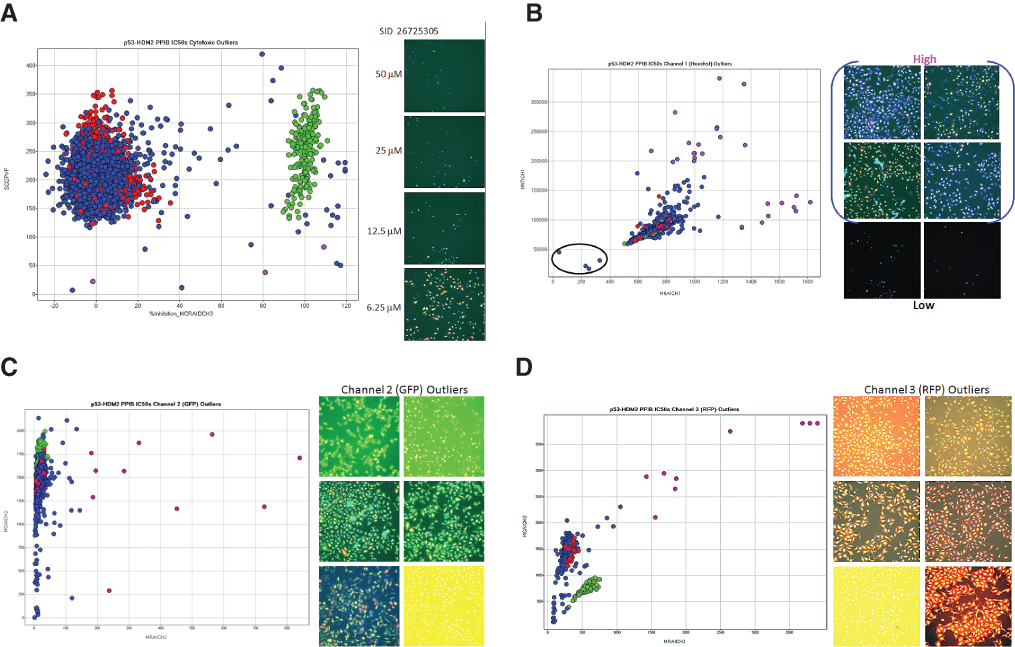
We used the Z-score plate-based statistical scoring method to estimate the compounds that behaved as outliers compared with the other substances (n = 320, no controls) tested on an assay plate for selected HCS multiparameter measurements output by the image analysis module: Z-score = (xi – X)/σ, where xi was the raw measurement on the ith compound, and X and σ were the mean and standard deviation of all the sample measurements on a plate. We used the selected object counts per valid field of view (SCCPVF) parameter derived from the Hoechst DNA staining in channel 1 to identify compounds that were cytotoxic. A deviation of 4σ below the sample average X selected object counts per field of view on the plate (SCCPVF Z-scores <–4) was designated as the threshold or cutoff for cytotoxic compounds. We also calculated Z-scores for 2 fluorescent intensity parameters from each of the 3 fluorescent channels: the mean nuclear total intensity (MNTI-Ch1) and the mean nuclear average intensity from the Hoechst channel (MNAI-Ch1), the mean Circ (nuclear) average intensity (MCAI-Ch2) and the mean Ring (cytoplasm) average intensity (MRAI-Ch2) from the GFP channel, and the mean Circ (nuclear) average intensity (MCAI-Ch3) and the mean Ring (cytoplasm) average intensity (MRAI-Ch3) from the RFP channel. Compounds that exhibited a deviation of 4σ above the sample average X (Z-scores >4) in either one or both of the intensity parameters from each channel were considered fluorescent outliers.
Compounds that met all of the following criteria were designated active in the p53-hDM2 PPIB primary HCS: ≥50 % inhibition of the MCRAID-Ch3, a SCCPVF Z-score >–4, an MNTI-Ch1 Z-score <4, an MNAI-Ch1 Z-score <4, an MCAI-Ch2 Z-score <4, an MRAI-Ch2 Z-score <4, an MCAI-Ch3 Z-score <4, and an MRAI-Ch3 Z-score <4.
Compound structure clustering analysis
Disruptors of the p53-hDM2 interaction that were identified in the HCS and confirmed in 10-point concentration-response IC50 assays were analyzed using the Leadscope Enterprise 2.4.6-1 software. The confirmed hit compounds were subjected to structure-based clustering and classification techniques based on recursive partitioning as described previously. 31-33,35
Cell proliferation assay
Cell proliferation was measured using a previously described high-content image analysis method. 36 HCT116 WT, p53 –/–, p21 –/–, and U-2 OS WT cell lines were seeded at 1000 cells/well using a Zoom liquid handler in collagen-coated 384-well black-walled clear-bottom plates (#781986, Greiner Bio-One) and cultured for 2 to 72 h at 37°C in a 5% CO2 atmosphere and 95% humidity. After a 2-h cell attachment period, 1 plate of cells was fixed, stained, and analyzed as described below to establish the cell density at the time of treatment; the other plates were treated with the indicated compound concentrations by transfer of stocks to the 384-well plate by the Evolution P3 liquid handling platform using a 384-well P30 dispensing head and cultured for an additional 22 to 70 h. At the indicated time points, plates were fixed with 3.7% formaldehyde containing 1 µg/mL Hoechst 33342 at 37°C for 30 min, the fixed cells were then washed twice with PBS, and plates were sealed with adhesive aluminum plate seals (Abgene). Images using a 10× objective of the Hoechst-stained nuclei from 9 fields of view covered the entire well and provided the total cell count per well. The extent of growth inhibition observed in compound-treated wells is expressed as a percentage of the total cell counts in these wells relative to the total cell counts in DMSO control wells: % growth inhibition = ([mean total cell count in DMSO control wells – total cell count in treated wells] × 100)/mean total cell count in DMSO control wells.
Immunoblotting
Cells were harvested in a modified immunoprecipitation buffer as described previously 37 and incubated on ice for 30 min with frequent, vigorous vortexing. Lysates were cleared by 13,000 g centrifugation for 15 min at 4°C. Protein concentration was determined by the Bradford method. Total cell lysates (10-20 µg protein) were resolved by sodium dodecyl sulfate polyacrylamide gel electrophoresis (SDS-PAGE) using 16% Tris-glycine gels and transferred to nitrocellulose membranes using the i-Blot semi-dry transfer system (Invitrogen) for Western blotting. Antibodies against p53, phosphorylated p53 (Ser15), and γH2A.X were from Cell Signaling Technologies (Danvers, MA). The hDM2 antibody was purchased from Santa Cruz Biotechnology (Santa Cruz, CA), the β-tubulin antibody was obtained from Cederlane Labs (Burlington, NC), and the anti-p21 antibody was received from Merck KGaA (Darmstadt, Germany). Bound primary antibodies were detected using horseradish peroxidase–conjugated secondary antibodies (Jackson ImmunoResearch, West Grove, PA) and proteins were visualized using Pierce Enhanced Chemi-luminescence Western Blotting Substrate (Pierce, Rockford, IL). Chemiluminescence was detected using an LS3000 image analyzer and quantitated using Multigauge software (Fujifilm, Woodbridge, CT).
Flow cytometry
M phase cells were identified by simultaneous staining with propidium iodide (PI) and phospho-histone H3 using an anti-phospho-histone H3 antibody (Upstate, Lake Placid, NY) as previously described 38 using the manufacturer’s recommended protocol. Briefly, cells were washed twice with cold PBS and detached from dishes using 0.05% trypsin/EDTA. Culture medium, PBS washes, and detached cell suspension were pelleted by a 5-min centrifugation at 300 g and washed twice with cold PBS to remove trypsin. Cells (~1 × 10⁶) were fixed overnight in 70% ethanol and permeabilized with 0.25% Triton X-100 in PBS for 8 min on ice. After washing with 1% bovine serum albumin (BSA) in PBS, cells were incubated with 1 µg anti-phospho-histone H3 antibody for 2 h. Cells were subsequently washed with PBS containing 1% BSA before incubation with 1 µg antirabbit IgG-FITC for 40 min in the dark. Finally, cells were resuspended in 500 µL PI/RNAse staining buffer (BD Pharmingen, San Diego, CA) for 15 min, and 20,000 cells were analyzed by fluorescence-activated cell sorting (FACS) using an EasyCyte Plus flow cytometer (Guava Technologies, Hayward, CA).
S phase cells were identified using a BrdU flow kit (BD Pharmingen). Cells were treated and stained per the manufacturer’s recommendations. Briefly, cells were stained with 10 µM bromodeoxyuridine (BrdU) 30 min prior to harvesting. Cells were washed twice with cold PBS and detached from dishes using 0.05% trypsin/EDTA. Culture medium, PBS washes, and detached cell suspension were pelleted by a 5-min centrifugation at 300 g and washed twice with cold PBS to remove trypsin. Cells were then permeabilized with saponin and fixed with 4% paraformaldehyde in PBS. Cells were then treated with DNAse to expose BrdU epitopes. Immunofluorescence staining was achieved using a FITC-conjugated anti-BrdU antibody followed by 7-amino-actinomycin-D (7-AAD) for staining of total DNA content. Cells were then resuspended in PBS and analyzed by FACS as described above.
Apoptotic cells were identified using the Annexin V–FITC Apoptosis Detection Kit I from BD Pharmingen. Briefly, cells were washed twice with cold PBS and gently detached from dishes using 0.05% trypsin/EDTA. Culture medium, PBS washes, and detached cell suspension were pelleted by a 5-min centrifugation at 300 g and washed twice with cold PBS to remove trypsin. Cells were resuspended in 100 µL binding buffer plus FITC–Annexin V and PI and incubated at room temperature in the dark for 15 min. Samples were diluted with 400 µL binding buffer and acquired by FACS as above. WinMDI software (TSRI, La Jolla, CA) was used to determine phospho-histone-positive, BrdU-positive, and Annexin V–positive/PI negative cells in their respective experiments.
Results
p53-hDM2 PPIB HCS assay performance
An initial characterization of the components of the p53-HDM2 PPIB HCS assay has been described previously.
34
Briefly, U-2 OS cells were coinfected with 2 recombinant adenovirus expression constructs: a nucleolar-localized p53-GFP fusion component and a cytoplasmic-localized hDM2-RFP fusion component. When U-2 OS cells were coinfected with both adenovirus constructs, the shuttling hDM2 interaction partner bound to the anchored p53 interaction partner, and both proteins became localized to the nucleolus (
Over the course of a 6-week period, in 13 separate 2-day HCS operational runs, the UPDDI screened 220,017 compounds from the NIH compound library at 25 µM in the p53-hDM2 PPIB HCS assay. For the HCS campaign, we used the mean MCRAID-Ch3 value of the DMSO minimum plate control wells (n = 32) and the mean MCRAID-Ch3 value of the 10 µM Nutlin-3 maximum plate control wells (n = 24) to normalize the MCRAID-Ch3 compound data and to represent 0% and 100% disruption/inhibition of the p53-hDM2 interactions, respectively.
Outlier analysis and confirmation of hits
We used a Z-score plate-based statistical scoring method to estimate the compounds that behaved as outliers compared with the other substances (n = 320) tested on an assay plate for selected HCS multiparameter measurements extracted from the digital images by the molecular translocation image analysis algorithm: the SCCPVF, the mean nuclear total intensity (MNTI-Ch1) and the mean nuclear average intensity from the Hoechst channel (MNAI-Ch1), the mean Circ (nuclear) average intensity (MCAI-Ch2) and the mean Ring (cytoplasm) average intensity (MRAI-Ch2) from the GFP channel, and the mean Circ (nuclear) average intensity (MCAI-Ch3) and the mean Ring (cytoplasm) average intensity (MRAI-Ch3) from the RFP channel. A SCCPVF Z-score <–4 was designated as the threshold or cutoff for cytotoxic compounds. Compounds that exhibited Z-scores >4 in either one or both of the intensity parameters from any of the 3 channels were considered fluorescent outliers. Compounds that met all of the following criteria were designated active in the p53-hDM2 PPIB primary HCS: ≥50% inhibition of MCRAID-Ch3, a SCCPVF Z-score >–4, an MNTI-Ch1 Z-score <4, an MNAI-Ch1 Z-score <4, an MCAI-Ch2 Z-score <4, an MRAI-Ch2 Z-score <4, an MCAI-Ch3 Z-score <4, and an MRAI-Ch3 Z-score <4. After excluding 133 cytotoxic compounds (0.06% of the library) with cell counts below the threshold and 3037 compounds that were fluorescent outliers (1.38% of the library) in 1 or more of the intensity parameters from the 3 channels, only 312 compounds (0.14% of the library) exhibited ≥50% disruption of the p53-hDM2 interaction (Suppl. Table S1).
Of the 312 primary HCS actives, only 284 compounds were available for cherry picking by the NIH SMR. To confirm their initial activity in the p53-hDM2 PPIB HCS assay, we conducted duplicate 10-point concentration-response assays starting at a maximum of 50 µM to determine the reproducibility of the initial hit characterization and an IC50 for the compounds. The images and multiparameter HCS data from these studies were rigorously investigated for the presence of outliers and artifacts (
Hit confirmation data outlier analysis. (
Despite the filtering of the primary HCS actives for fluorescence outliers at 25 µM (Suppl. Table S1), the concentration-response assays starting at a maximum of 50 µM yielded compounds that were fluorescent outliers in 1 or more of the intensity parameters from the 3 channels (
Of the compounds tested in concentration-response assays, 213 (75%) failed to confirm the activity observed in the p53-hDM2 PPIB primary HCS assay. After excluding 3 cytotoxic compounds (1%) with cell counts below the cutoff threshold and 66 compounds that were fluorescent outliers (23.2%) in 1 or more of the intensity parameters from the 3 channels, only 3 of the compounds (1.06%) exhibited reproducible concentration-dependent disruption of the p53-hDM2 interaction (Suppl. Table S1). The chemical structures of the 3 confirmed hits with their average IC50s and percent inhibition at 50 µM are presented in
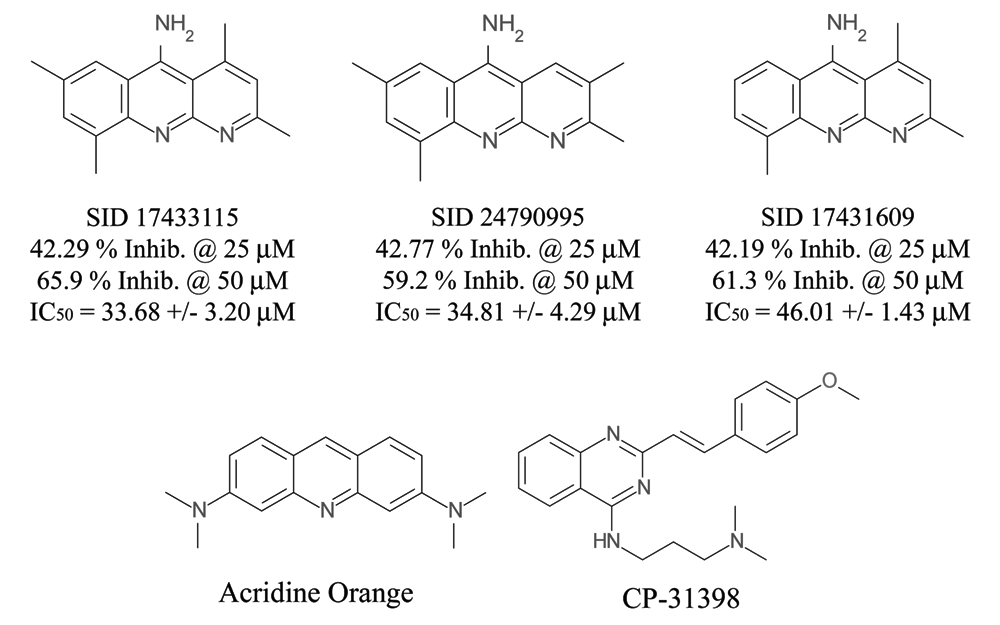
Compound structures of p53-hDM2 biosensor hits. The chemical structures of the methylbenzonaphthyridin-5-amines (MBNAs) (PubChem SIDs 17433115, 24790995, and 17431609), together with their corresponding percent inhibition from the primary high-content screening and the mean IC50s from the 10-point concentration confirmation assays, are presented. For comparison, the structures of acridine orange and CP-31398 are shown.
Hit characterization experiments
Methylbenzonaphthyridin-5-amines induce stabilization of p53, hDM2, and p21 protein levels independent of DNA damage repair pathways
Activation of p53 leads to stabilization of p53 protein levels and increased expression of p53 target genes, including hDM2 and p21. To demonstrate p53 stabilization and/or activation, we treated the HCT116 p53 +/+ (HCT-116-WT) cell line with SID 24790995 or Nutlin-3 and measured the total p53, hDM2, and p21 protein levels by Western blotting (
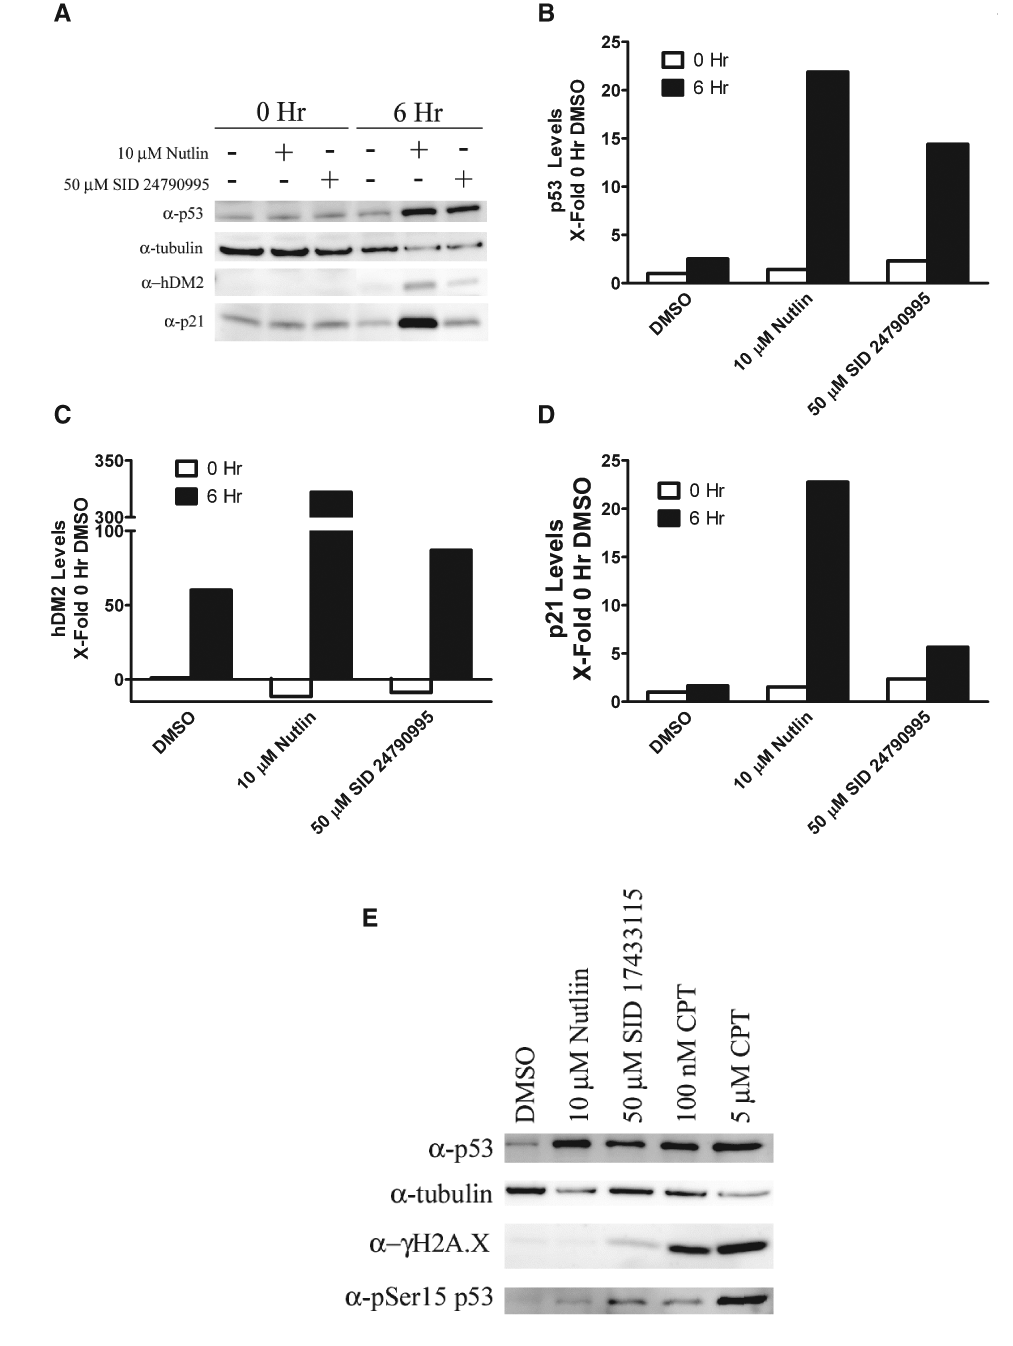
Methylbenzo-naphthyridin-5-amines (MBNAs) increased p53 activity through a DNA damage-independent pathway. HCT116-WT cells were treated with 0.25% DMSO control, 10 µM Nutlin-3 in 0.25% DMSO, or 50 µM SID 24790995 in 0.25% DMSO for 0 or 6 h. (
In the p53 DNA damage response, serines 15 and 20 of p53 become phosphorylated upon DNA damage; this results in abrogation of hDM2 binding and stabilization of p53 protein levels. Lysates of cells treated with 50 µM SID 17433115 were subjected to SDS-PAGE and transferred to nitrocellulose, and Western blots were probed for p53-phospho-ser15. Although p53 protein levels increased as expected with 50 µM SID 17433115 treatment, the p53-pSer15 levels were significantly less than those observed with 100 nM camptothecin (CPT), a known inducer of the DNA damage response (
The inhibition of cell proliferation by methylbenzonaphthyridin-5-amines is not entirely p53-dependent
One of the hallmarks of compounds that promote p53 stabilization and activation is the ability to inhibit cell proliferation in a p53-dependent fashion. Isogenic HCT116-WT, HCT116-p53 null, and HCT116-p21 null cell lines were treated with a concentration series of SID 24790995, Nutlin-3, or paclitaxel, and the change in cell numbers was monitored over time (
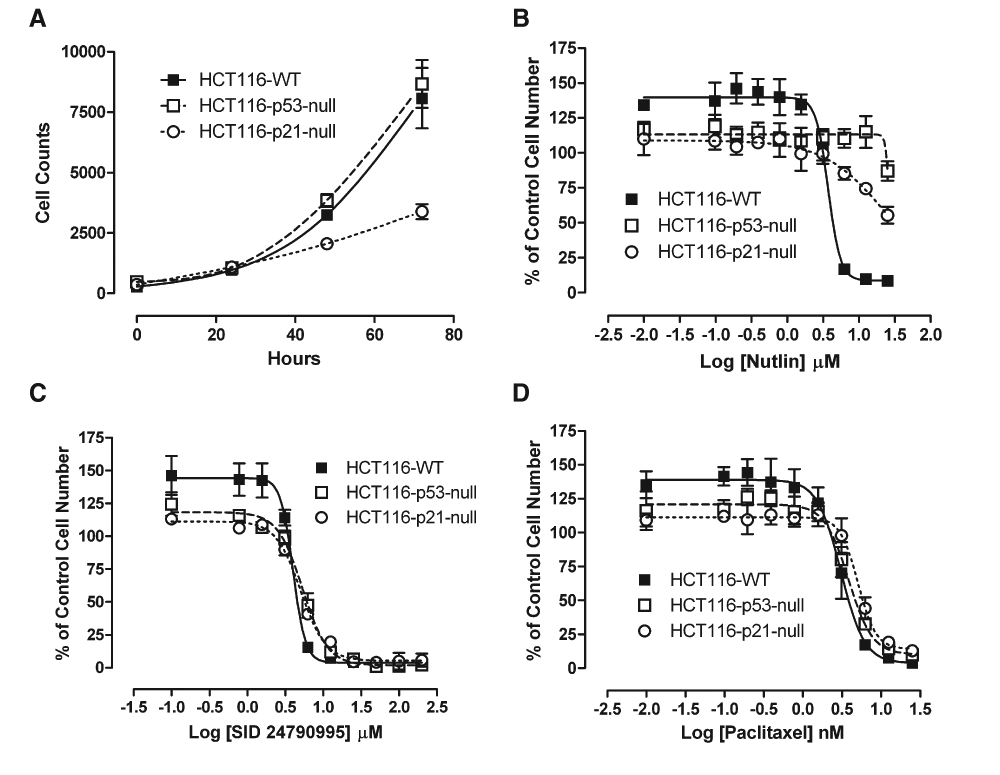
Inhibition of isogenic HCT116 cell line proliferation by methylbenzo-naphthyridin-5-amines (MBNAs), Nutlin-3, and paclitaxel. HCT116-WT, p53 null, and p21 null cell lines were seeded at 1000 cells/well in collagen-coated 384-well plates. A titration series of Nutlin-3, SID 24790995, or paclitaxel in 0.5% DMSO was added. After allowing 2 h for cells to settle, initial plates were fixed, stained with Hoechst 33342, and counted on the ArrayScanVTI. Subsequent samples were fixed, stained, and scored at 24, 48, and 72 h. (
Methylbenzonaphthyridin-5-amines induce a p53-dependent cell cycle arrest and apoptosis
Activation of p53 increases the transcription of target genes that promote cell cycle arrest and apoptosis. Cell cycle arrest facilitates DNA repair, and if the DNA repair process is unsuccessful, proapoptotic genes initiate apoptosis to kill the cell. HCT116-WT and HCT116-p53 null cells were treated with 10 µM SID 17433115 or Nutlin-3 for 24 h, S phase cells were stained with BrdU, and DNA content was measured by flow cytometry after 7-AAD staining (
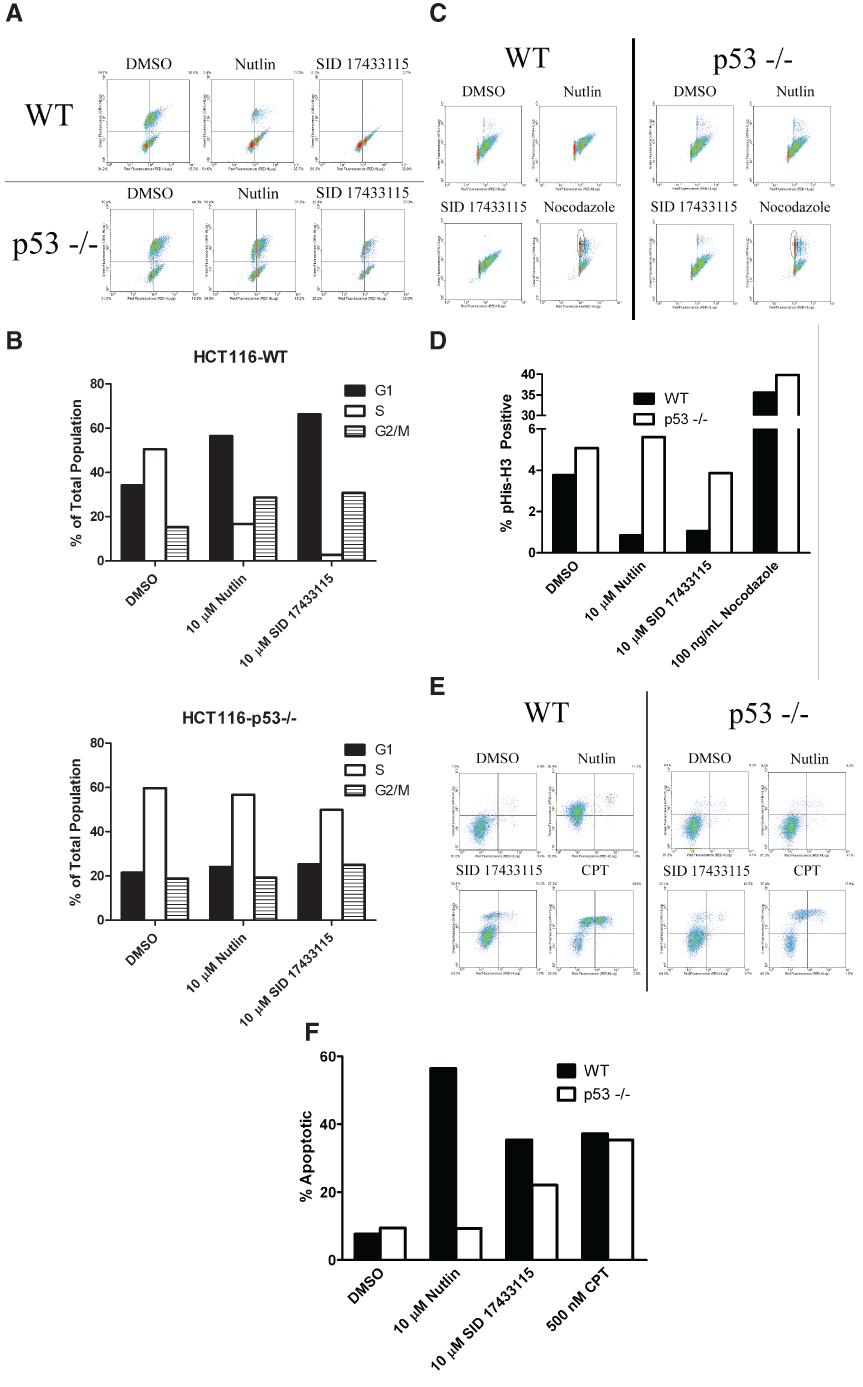
Methylbenzo-naphthyridin-5-amines (MBNAs) arrest the cell cycle and induce apoptosis in p53-dependent and p53-independent manners. (
To explore potential effects on apoptosis, we treated HCT116-WT and HCT116-p53 null cells with 10 µM SID 17433115 or Nutlin-3 for 48 h, stained them with Annexin V–FITC and PI, and analyzed them by 2-color flow cytometry (
Discussion
Although the enhancement or restoration of p53 function has been a major focus of drug discovery efforts to identify novel anticancer therapies, no modulator of p53 activity is currently approved for clinical use. A variety of screening campaigns have been conducted to identify small molecules that disrupt the protein-protein interactions between p53 and hDM2, inhibit the ubiquitin E3 ligase activity of hDM2, or restore the thermal stability and DNA binding activity of p53 DNA binding mutants. 19,28,40-42 We report here the results of screening the NIH’s small-molecule diversity library with a novel p53-hDM2 protein-protein interaction biosensor HCS assay to identify novel p53-hDM2 protein-protein interaction disruptor (PPID) chemotypes.
The N-terminal residues 1-131 of p53 encompass the binding site for hDM2 that overlaps with the p53 transactivating domain, and the p53-GFP interaction partner of the biosensor was targeted and anchored in the nucleolus by an NLS.
17,24,25,34
The N-terminal residues 1-118 of hDM2 encompass the domain for binding to the N-terminal transactivating domain of p53, and the hDM2-RFP interaction partner of the biosensor includes both an NLS and an NES such that the relative distribution of this protein between the nucleus and cytoplasm can be used to measure the interactions between p53 and hDM2.
17,24,25,34
In U-2 OS cells coinfected with both of the PPIB adenovirus constructs, p53-GFP:hDM2-RFP complexes colocalized within the nucleolus, but upon exposure to compounds similar to Nutlin-3 (which disrupt the p53-hDM2 interaction), the hDM2-RFP partner translocated into the cytoplasm (
Treatment of HCT116 WT cells with the MBNA hits increased endogenous protein levels of p53 and enhanced the expression of the p53 target genes hDM2 and p21 relative to DMSO controls (
In HCT116 cells that were null for p53, however, neither the MBNAs nor Nutlin-3 significantly altered the cell cycle distribution of cells with respect to DNA content, S phase, and mitosis (
The cis-imidazoline Nutlin-3 analogs are the prototype disruptors of p53-hDM2 protein-protein interactions that were identified using a combination of structure-based drug design and surface plasmon resonance technology (Biacore, Piscataway, NJ) to measure p53-hDM2 binding.
7,21
Nutlin-3s inhibit the p53-MDM2 interaction by mimicking the binding of 3 critical p53 amino acid residues within the hydrophobic cavity of MDM2.
7,21
Nutlin-3 treatment of human cancer cell lines with WT p53 stabilizes p53 protein levels, leading to activation of p53 target genes, cell cycle arrest, induction of apoptosis, and the inhibition of cell growth. Treatment of established SJSA-1 osteosarcoma xenografts with Nutlin-3 reduced tumor growth by 90% relative to vehicle controls.
7,21
Mice treated with Nutlin-3 doses causing effective tumor inhibition and regression did not exhibit any significant weight loss or pathological changes.
7,21
Nutlin-3 treatment of normal human or murine fibroblasts produced transient growth arrest but no apoptosis.
7,21
Unfortunately, surface plasmon resonance technology has neither the throughput nor the capacity to screen compound libraries that contain more than 10 to 100 compounds. Although Nutlin-3 was ~30-fold more potent than the MBNAs in the p53-hDM2 PPIB, they exhibited equivalent IC50s for the inhibition of cell proliferation in the HCT116-WT cell line (
The MBNA compounds identified in this screen are structurally related to the styrlyquinazoline CP-31398 and acridine orange compounds (
A different positional biosensor HCS assay has previously been used to screen a very small compound library of 3165 compounds for inhibitors of the p53-hDM2 protein-protein interactions. 42 The assay employed a GFP-assisted readout (GRIP) p53-hDM2 redistribution format in which a cell line was constructed where hDM2 was expressed as a fusion protein with cAMP phosphodiesterase (PDE) isoform 4A4B, and p53 was expressed as a GFP fusion protein. 42 Treatment of the cell line with the PDE-4A4B agonist RS25344 induces the hDM2-PDE-4A4B to relocate to compact intracellular foci. Through its interactions with hDM2-PDE-4A4B, the p53-GFP is recruited to the PDE-4A4B binding sites, and the p53-GFP redistributes from a diffuse cytoplasm staining pattern to a granular foci pattern. 42 Compounds that disrupt p53-hDM2 interactions such as Nutlin-3 or that inhibit PDE-4A4B such as RP73401 disperse the RS25344-induced GFP foci phenotype. Using the PDE-4A4B inhibitor RP73401 (10 µM) as a disruption control, 41 compounds (1.3%) exhibited >40% activity at 10 µM, and only 30 of these were subsequently confirmed in concentration-response assays. Of the 30 confirmed actives, the activity of 10 compounds was deemed too low to be followed up on, 15 produced a PDE-4A4B inhibitor spot dispersion phenotype, and 14 of these were confirmed in a PDE-4A4B redistribution counterscreen. 42 One of the 5 confirmed p53-hDM2 GRIP redistribution hits was Nutlin-3 spiked into the screening library, and only the Nutlin-3 “hit” was shown to activate a p53-luciferase reporter secondary assay and to differentially inhibit the proliferation of tumor cell lines with WT p53. It was concluded that none of the screening hits from this very limited screen were functional inhibitors of the p53-hDM2 protein-protein interaction. 42
In conclusion, we have screened 220,017 compounds from the NIH’s small-molecule library in this novel p53-hDM2 PPIB assay. The p53-hDM2 PPIB assay performed robustly and reproducibly throughout the 6-week HCS campaign, and our statistical analysis of the high-content parameters extracted from the digital images of the 3 fluorescent channels enabled us to identify and eliminate compounds that were cytotoxic or fluorescent artifacts either in solution or within the cells. We identified 3 structurally related MBNA hit compounds with IC50s between 30 and 50 µM in the p53-hDM2 PPIB biosensor. In HCT116 cells with WT p53, the MBNAs enhanced p53 protein levels, increased the expression of p53 target genes, caused a cell cycle arrest in G1, induced apoptosis, and inhibited cell proliferation with an IC50 ~4 µM. Nutlin-3 was ~30-fold more potent in the p53-hDM2 PPIB assay, and treatment of HCT116 cells with WT p53 produced equivalent biological results, save that Nutlin-3 induced more p53, hDM2, and p21 protein expression and induced more apoptosis. However, unlike the Nutlin-3s, which are dependent on WT p53 for their activity, MBNAs also increased the percentage of apoptosis in p53 null cells and also produced IC50s ~4 µM for growth inhibition in isogenic cell lines null for p53 or p21. The MBNA compounds share similar biological activities and are more structurally related to acridine orange compounds that reactivate mutant p53 and activate WT p53 by inhibiting the ubiquitination of p53 by hDM2. However, the MBNA structures differ from the acridine orange derivatives in that 2 of the 3 rings are nitrogen hetero-cycles, and the central ring is amino-substituted at the 5 position. In recent years, advances in structure-based drug design and the development of an impressive variety of high-throughput screening assay formats have yielded an expanding list of protein-protein interaction inhibitors. Nevertheless, the perception persists that protein interaction interfaces are flat, occur over very large surfaces, and present challenging targets for drug-like small molecules. Despite the relatively modest size of the screening library, the combination of a novel p53-hDM2 PPIB assay together with an automated imaging HCS platform and image analysis methods enabled us to discover a novel chemotype series that disrupts p53-hDM2 interactions in cells.
Footnotes
Acknowledgements
This work was supported by grants from the National Institutes of Health Molecular Library Screening Center Network (U54MH074411; JSL), The Hartwell Foundation (DD), the Heinz Foundation (JSL), and the PA Department of Health SAP4100027294 (JSL, DLT).
References
Supplementary Material
Please find the following supplemental material available below.
For Open Access articles published under a Creative Commons License, all supplemental material carries the same license as the article it is associated with.
For non-Open Access articles published, all supplemental material carries a non-exclusive license, and permission requests for re-use of supplemental material or any part of supplemental material shall be sent directly to the copyright owner as specified in the copyright notice associated with the article.