
Abstract
The emergence of human stem cell–derived cardiomyocyte (hSCCM)–based assays in the cardiovascular (CV) drug discovery sphere requires the development of improved systems for interrogating the rich information that these cell models have the potential to yield. We developed a new analytical framework termed SALVO (synchronization, amplitude, length, and variability of oscillation) to profile the amplitude and temporal patterning of intra- and intercellular calcium signals in hSCCM. SALVO quantified drug-induced perturbations in the calcium signaling “fingerprint” in spontaneously contractile hSCCM. Multiparametric SALVO outputs were integrated into a single index of in vitro cytotoxicity that confirmed the rank order of perturbation as astemizole > thioridazine > cisapride > flecainide > valdecoxib > sotalol > nadolol ≈ control. This rank order of drug-induced Ca2+ signal disruption is in close agreement with the known arrhythmogenic liabilities of these compounds in humans. Validation of the system using a second set of compounds and hierarchical cluster analysis demonstrated the utility of SALVO to discriminate drugs based on their mechanisms of action. We discuss the utility of this new mechanistically agnostic system for the evaluation of in vitro drug cytotoxicity in hSCCM syncytia and the potential placement of SALVO in the early stage drug screening framework.
Introduction
Cardiovascular (CV) drug development urgently needs enhanced screening systems that enable improved early stage assessments of drug hazard and more accurately predict in vivo drug toxicity and clinical efficacy.1,2 Multicellular syncytia of human stem cell–derived cardiomyocytes (hSCCMs, which encompass both embryonic stem cell–derived CMs [ESCMs] and induced pluripotent stem cell–derived CMs [iPSC-CMs]) have emerged as important new tools for drug screening.1,3–5 These models re-create, to some extent, the cell-to-cell communication that modulates cellular behavior in vivo and obviate some of the issues associated with nonhuman cell-based assays. However, there are acknowledged issues regarding their hybrid embryonic-adult proteomic and transcriptomic signatures, cellular heterogeneity postdifferentiation, intracellular microarchitecture and signaling organization, electrophysiological profiles, and pharmacological sensitivities.
The incorporation of hSCCM-based assays into the drug discovery toolkit now warrants the development of improved systems that can better interrogate the rich information that these new cellular models have the potential to yield. Moreover, the shift toward phenotypic profiling strategies, which evaluate drug bioactivities in the context of a deep understanding of cellular signaling networks, requires methodological innovation beyond the transposition of conventional optical and electrophysiological technologies onto these new cell systems.1,2
The calcium (Ca2+) signaling network underpins virtually every biological phenomenon, 6 and thus understanding the spatiotemporal organization of Ca2+ signals in functionally coupled hSCCMs, under normal and drug-exposed conditions, could potentially reveal the mechanistic bases of drug-evoked phenotypic modulation and cellular (dys)function.7–9 Previous studies in single mammalian cells showed that subtle changes in Ca2+ signaling dynamics, which did not perturb steady-state Ca2+ homeostasis, had profound consequences for cell phenotype.6,10–12 In this study, we extend these approaches to profile Ca2+ signal organization in spontaneously contractile, functionally coupled hSCCMs. We describe the development and proof-of-concept validation of a novel system (termed SALVO: synchronization, amplitude, length, and variability of oscillations) that enables a detailed interrogation of the spatiotemporal patterning of Ca2+ signals in hSCCMs and the exploration of the mechanisms of drug action. We discuss the potential utility of this system in the drug safety screening landscape and how, in combination with other contemporary screening approaches, SALVO may enable a better understanding of the mechanisms underlying CV drug cytotoxicity and lead to the improved prediction of drug hazard in humans.
Materials and Methods
Cytiva Culture and Maintenance
Cytiva hSCCMs were derived from monolayer differentiation of an H7 hESC cell line that had been expanded under feeder-free conditions and then subjected to a proprietary differentiation protocol (GE Healthcare, Piscataway, NJ, USA). 13 Cytiva were supplied as a heterogeneous cell population containing 50.5% ± 5.4% cardiomyocytes (n = 6 batches; batch numbers 4799455, 4903456, 4638600, 4636900, 7396634, 6265575). Cells were thawed and seeded into 7-mm2 chambers created by the adherence of silicon gaskets (CultureWell MultiWell 3 mm in diameter, 1-mm-depth inserts [Life Technologies]) on glass-bottomed culture chambers (In Vitro Scientific, Sunnyvale, CA, USA) that had been precoated with Matrigel (BD Biosciences, Franklin Lakes, NJ, USA), Franklin Lakes, NJ, USA diluted 1:30 (v/v) in Knockout DMEM (Life Technologies, Carlsbad, CA, USA). Cells were seeded as per the manufacturer’s instructions at a density of 2500 cells per mm2 surface area (i.e., 17,500 cells in each 7-mm2 chamber corrected for plating efficiency) in antibiotic-free RPMI 1640 (15 µL) supplemented with B27 (1:50 [v/v] dilution) (RPMI/B27) (Life Technologies) and maintained at 37 °C in a humidified 5% CO2 environment. Cells were allowed to adhere to the coverslip for 2 h before the dish was filled with RPMI/B27 (2 mL). Medium was exchanged every 48 h.
Immunofluorescent Detection of Troponin-T
Cells were fixed (4% [v/v] formaldehyde in phosphate-buffered saline [PBS], containing [in mM] NaCl [140], KCl [2.7], Na2HPO4 [10], NaH2PO4 [2], pH 7.4) for 10 min at room temperature (RT) and then washed three times with PBS prior to permeabilization (0.1% [v/v] Triton X-100 in PBS, 4 min at RT). Nonspecific antibody interactions were blocked by incubation in horse serum (4% [v/v] in PBS, 1 h, RT) before cells were incubated with mouse anti–troponin-T (TnT; 1:200 [v/v] in PBS) (MA5-12960; Thermo Scientific, Waltham, MA, USA) overnight at 4 °C. Cells were washed with PBS (3 × 5 min) before being incubated with Alexa Fluor 546 anti–mouse IgG (1:200 [v/v]; Life Technologies) for 1 h at RT in the dark. Following washing with PBS (3 × 5 min), cell nuclei were counterstained with DAPI (1 µg/mL; 20 min) prior to further washing in PBS (2 × 1 min) and mounting under Prolong Gold (Life Technologies). Cells were imaged using a confocal microscope (SP5; Leica Microsystems, Wetzlar, Germany), and assessments of TnT positivity and cellular alignment were made using image analysis (LAS-AF [Leica Microsystems] and ImageJ [National Institutes of Health, Bethesda, MD, USA]).
Ca2+ Imaging and Analysis of Ca2+ Signals
Cells were incubated with fluo-4 AM (5 µM) (Life Technologies) for 1 h at 37°C before coverslips were flooded with RPMI/B27 (2 mL). Fluo-4 Ca2+-dependent signals were visualized in 0.021-mm2 regions with a 63× oil immersion objective (NA 1.4) using argon laser excitation (488 nm) and a confocal microscope (SP5; Leica Microsystems). Cells were maintained at 37 °C throughout experiments. Images were recorded every 100 ms at a 512 × 512–pixel resolution. The application of caffeine (5 mM final concentration) was used to trigger sarcoplasmic reticulum (SR) Ca2+ release and thereby estimate the intra-SR Ca2+ store load.
Taking our lead from Uhlen’s method of using spectral analysis to investigate the organization of Ca2+ signals,
14
we developed SALVO to decode the spatiotemporal patterning of Ca2+ oscillations within individual cells and across multicellular populations. SALVO outputs 30 parameters that describe Ca2+ signal organization,
15
but for the purposes of this study, we focused on five parameters: oscillation rate (rate, Hz) and four other parameters that quantify the amplitude and temporal patterning of Ca2+ oscillation: (1) amplitude heterogeneity index (AHI) and (2) temporal heterogeneity index (THI), statistical assessments of signal amplitude and temporal variability within single cells, respectively; (3) intertransient noise (ITN), defined as the Ca2+ signal variability occurring between Ca2+ oscillations and that extends the use of signal variability (SV) to measure point-by-point differences in very low-amplitude Ca2+ signals6,10,12; and (4) synchronization, an index of the temporal coincidence of Ca2+ oscillation maxima occurring across cells in the population. The calculation of these parameters is described in
Characterization of Drug-Evoked Ca2+ Perturbation
Baseline assessments of Ca2+ signals in fluo-4–loaded cells prior to the addition of drug (control) were established as described above. Cells were then sequentially exposed to increasing concentrations of cardioactive drugs, selected to represent those categories assigned by Redfern and colleagues 16 as category 1 (“repolarization-prolonging as an intended, desirable effect”; sotalol, prescribed as a β-blocker with class III antiarrhythmic properties 17 ), category 2 (“drugs that have been withdrawn or suspended from the market in at least one major regulatory territory due to an unacceptable risk of TdP”; astemizole and cisapride, QT-prolonging IKr/hERG-blocking antihistamine and gastric prokinetic, respectively), category 3 (“drugs that have a measurable incidence of TdP in humans”; thioridazine, a drug with the highest incidence of TdP among prescribed antipsychotics via off-target effects on IKr/hERG, 18 and flecainide, a torsadogenic class IC antiarrhythmic [Nav1.5 channel blocker] 17 ), and category 5 (“no published reports of TdP in humans”; nadolol, a nonselective β-blocker). Valdecoxib, a COX-2–selective nonsteroidal anti-inflammatory drug (NSAID) that was initially approved for use in the treatment of osteoarthritis and rheumatoid arthritis but was subsequently withdrawn from the market due to adverse CV effects, 19 was not included in the assessment by Redfern et al. 16 but was included here. We purchased rofecoxib (Vioxx) from Sequoia Research Products (Pangborne, UK), but the supplied compound exhibited inconsistent bioactivity in our assay system.
Stock solutions of drugs (10 mM) in ultrapure water or tissue-culture grade DMSO were diluted in RPMI/B27, and the concentration of each drug under test was sequentially increased. After each addition and following a period of equilibration (approximately 90 s), fluo-4–dependent Ca2+ signals were acquired for 30 s. Using this protocol, the same population of cells was imaged throughout the entire drug addition sequence.
To validate the system, we used a second set of compounds at maximal effective concentrations in our assay (1–30 µM): category 1, amiodarone (class III antiarrhythmic); category 2, terodiline (QT-prolonging proarrhythmic); category 5, metoprolol (selective β1-blocker); celecoxib (COX-2 inhibitor), and aconitine (non–QT-prolonging proarrhythmic). We also included two drugs that have mechanisms of actions distinct from those above: verapamil (L-type Ca2+ channel blocker, category 5) and ranolazine (late INa current inhibitor). In all experiments, operators were blinded to the identities of the drugs under test throughout all phases of postexperimental data analysis.
Electrophysiological Recordings of Action Potentials in Cytiva
Cells in 35-mm glass-bottomed culture dishes containing a superfusion insert (AutoMate PCP-1; Digitimer Ltd., Welwyn Garden City, UK) were mounted on the stage of an inverted microscope (CKX-41; Olympus, Tokyo, Japan) and were superfused with normal Tyrode (NT) solution (containing [in mM] NaCl [145], KCl [4], MgCl2 [1], CaCl2 [2], HEPES [10], glucose [10]; pH 7.4 with NaOH) or NT-containing drugs maintained at 37 °C using a heated jacket.
Cells were whole-cell clamped with 3- to 4-MΩ patches and an intrapipette solution (containing in [mM] KCl [120], MgCl2 [1.75], CaCl2 [5.37], EGTA [10], HEPES [10], and Na2ATP [4]; pH 7.2 with KOH) in current-clamp (IC) mode using a CV-7B headstage and MultiClamp 700B amplifier controlled by MultiClamp software (Molecular Devices, Sunnyvale, CA). Data were digitized and acquired using a Digidata 1322a card and pClamp software, respectively (Molecular Devices). Action potentials were sampled at a rate of 20 kHz and low pass (Bessel) filtered at 10 kHz.
Spontaneous cell contracture was terminated using blebbistatin (5 µM, 10 min), an agent that inhibits myofilament shortening and thereby negates patch-clamp recording instability but preserves normal Ca2+ cycling. 20 Following cessation of contractures, spontaneous action potentials were observed in all cells following the application of a current pulse to obtain whole-cell access. Action potential (AP) recordings from blebbistatin-immobilized cells were taken under control (no-drug) conditions (1 min) and following the switch to drug-containing NT. APD90, corrected for AP cycle length using Fridericia’s method (APD90(corr) = APD90/cycle length0.3), was calculated from five consecutive APs following a 3-min exposure of the cells to drug.
Hierarchical Clustering and Statistical Analysis
Hierarchical clustering of SALVO outputs was performed using the uncentered correlation similarity metric and centroid clustering method in Cluster 3.0 (Lawrence Berkley Laboratories, CA, USA) with output visualization using TreeView (v1.1.6r4; JAM Software, Trier, Germany). Data sets were tested for normality using the D’Agostino-Pearson algorithm, and normally distributed data were compared using analysis of variance with intergroup comparisons performed using Bonferroni’s post hoc test. Nonnormally distributed data were compared using the Kruskal-Wallis test with Dunn’s post hoc test. For comparing only two groups of data, two-tailed Student t test (normal) or the Mann-Whitney test (nonnormal) was used. All statistical analysis was performed using Prism 6.0 (GraphPad Software, La Jolla, CA, USA). All data are given as mean ± standard error (SE). A p value of 0.05 was considered statistically significant.
Results and Discussion
Profiling the Functional Maturation of Ca2+ Handling
The relative axial alignment of TnT-positive cardiomyocytes (CMs) was low on days 2 and 3 postseeding but progressively increased to a maximum at day 5 with no further change to day 7 (
Fig. 1A–C
). This alignment of cells was associated with the intracellular redistribution of TnT that transitioned from a form that lacked apparent organization (day 2) into well-defined striatal arrangements (days 4–7) (
Fig. 1A
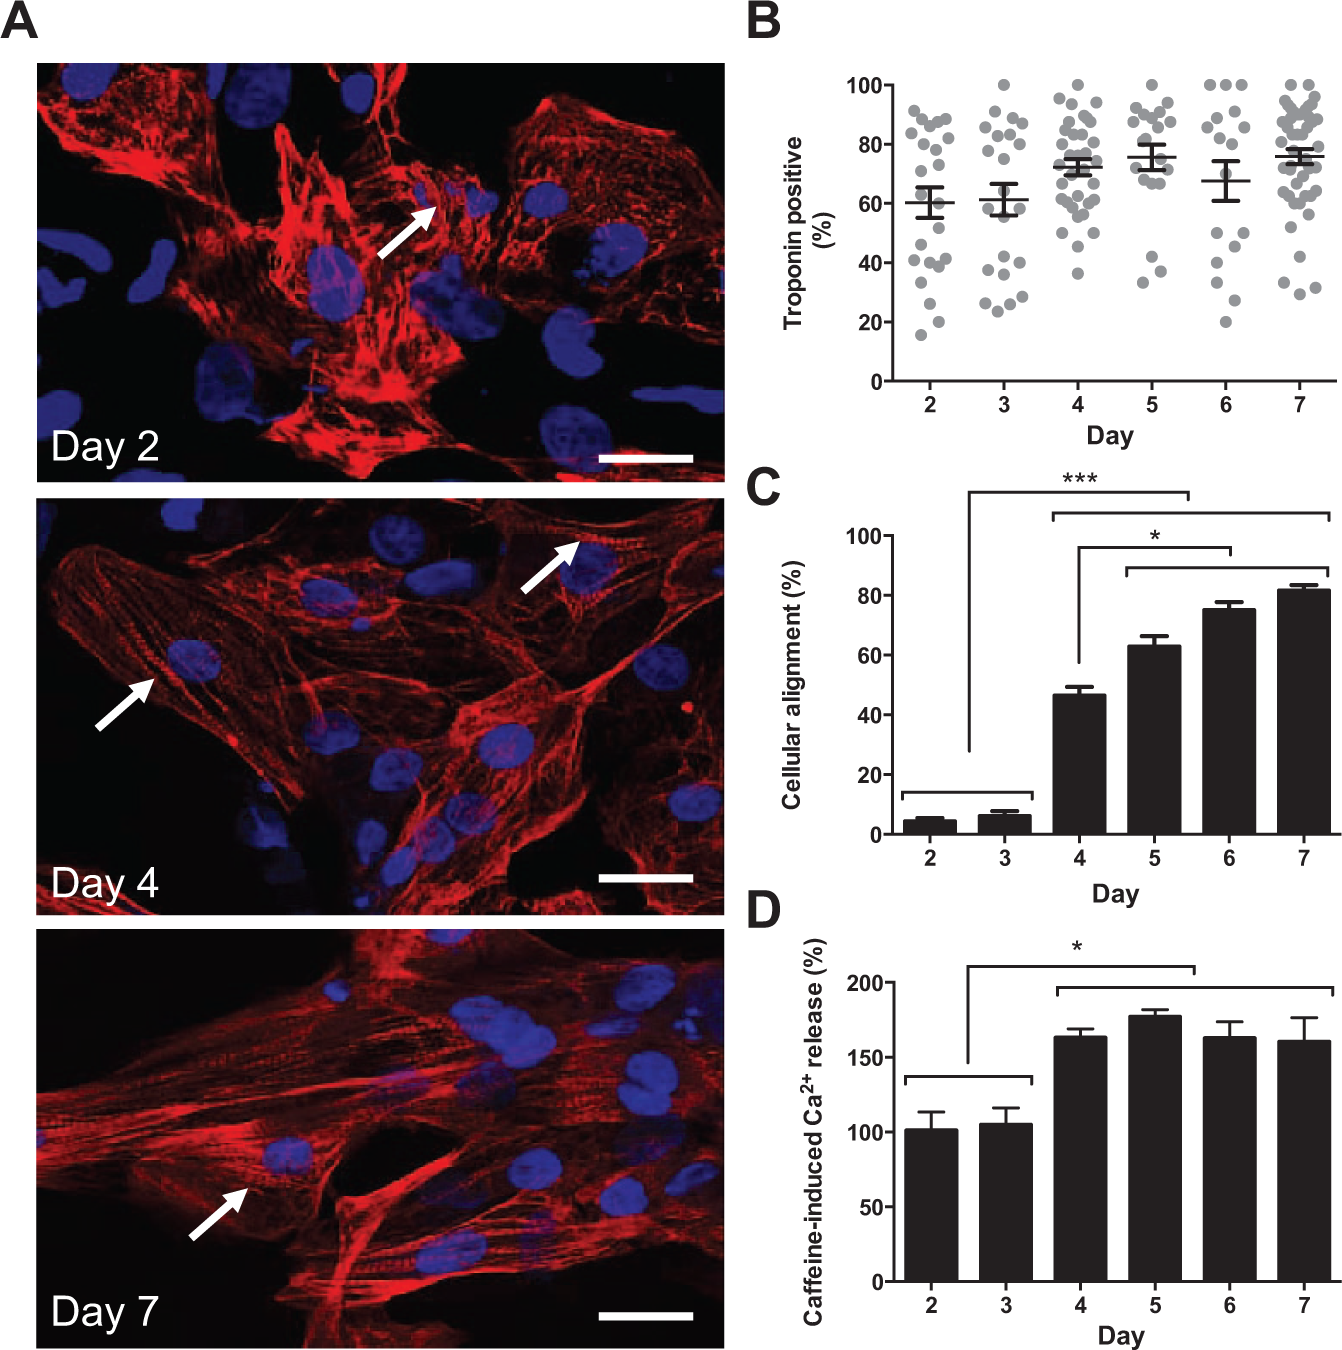
Phenotypic characterization of Cytiva. (
Our data point to the culture-dependent alignment of CMs, the intracellular reorganization of TnT, and the improved functional capacity of the Ca2+ handling machinery and corroborate reports of progressive SR maturation in cultured hSCCMs.
21
Although our study did not establish the causal drivers of these phenomena, we observed that day 4 CMs exhibited maximal amplitude and kinetics of caffeine-induced Ca2+ release (
Fig. 1D
and
The morphological and Ca2+ signaling changes observed at day 4 coincided with the onset of spontaneous Ca2+ oscillations (53.6% ± 19.7% cells on day 4 exhibited spontaneous Ca2+ oscillations vs. 0% on day 3, p < 0.0001) and synchronized contraction (
Fig. 2A(i)
and
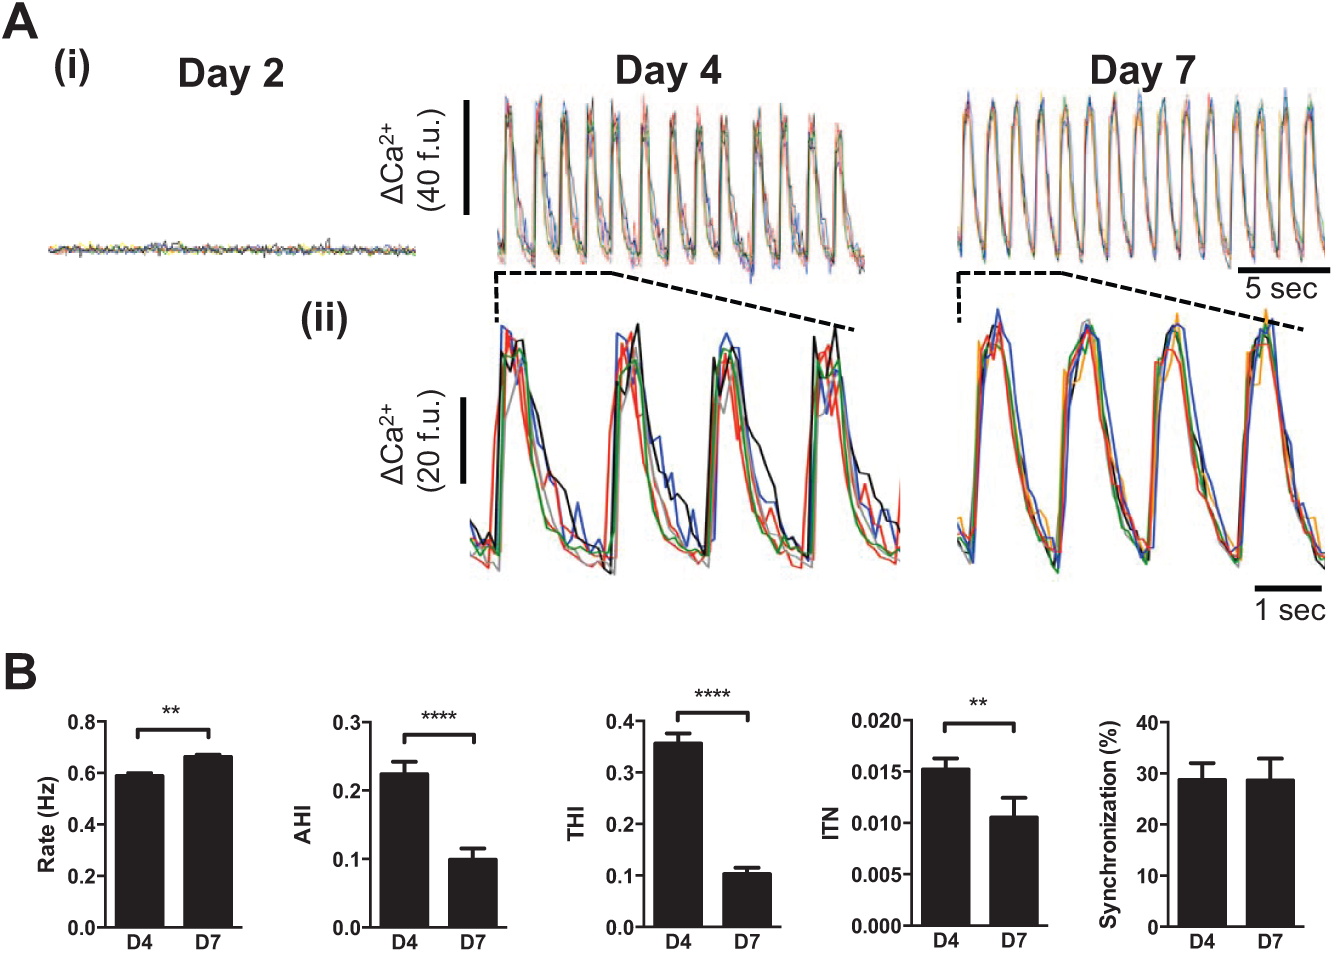
Functional maturation of Ca2+ cycling in Cytiva. (
The optimal functional state of Cytiva CMs (i.e., like that determined on days 6 and 7;
Using Ca2+ Signal Perturbation to Assess Drug-Induced Cytotoxicity
The disruption of the spatiotemporal patterning of Ca2+ signals is a hallmark of cellular dysfunction, and so we next investigated the propensity of cardioactive drugs to perturb intra- and intercellular Ca2+ signal organization. Nadolol, a nonselective β-blocker with an excellent clinical safety profile, had no measurable effect on Ca2+ handling at concentrations up to 30 µM (
Fig. 3
and
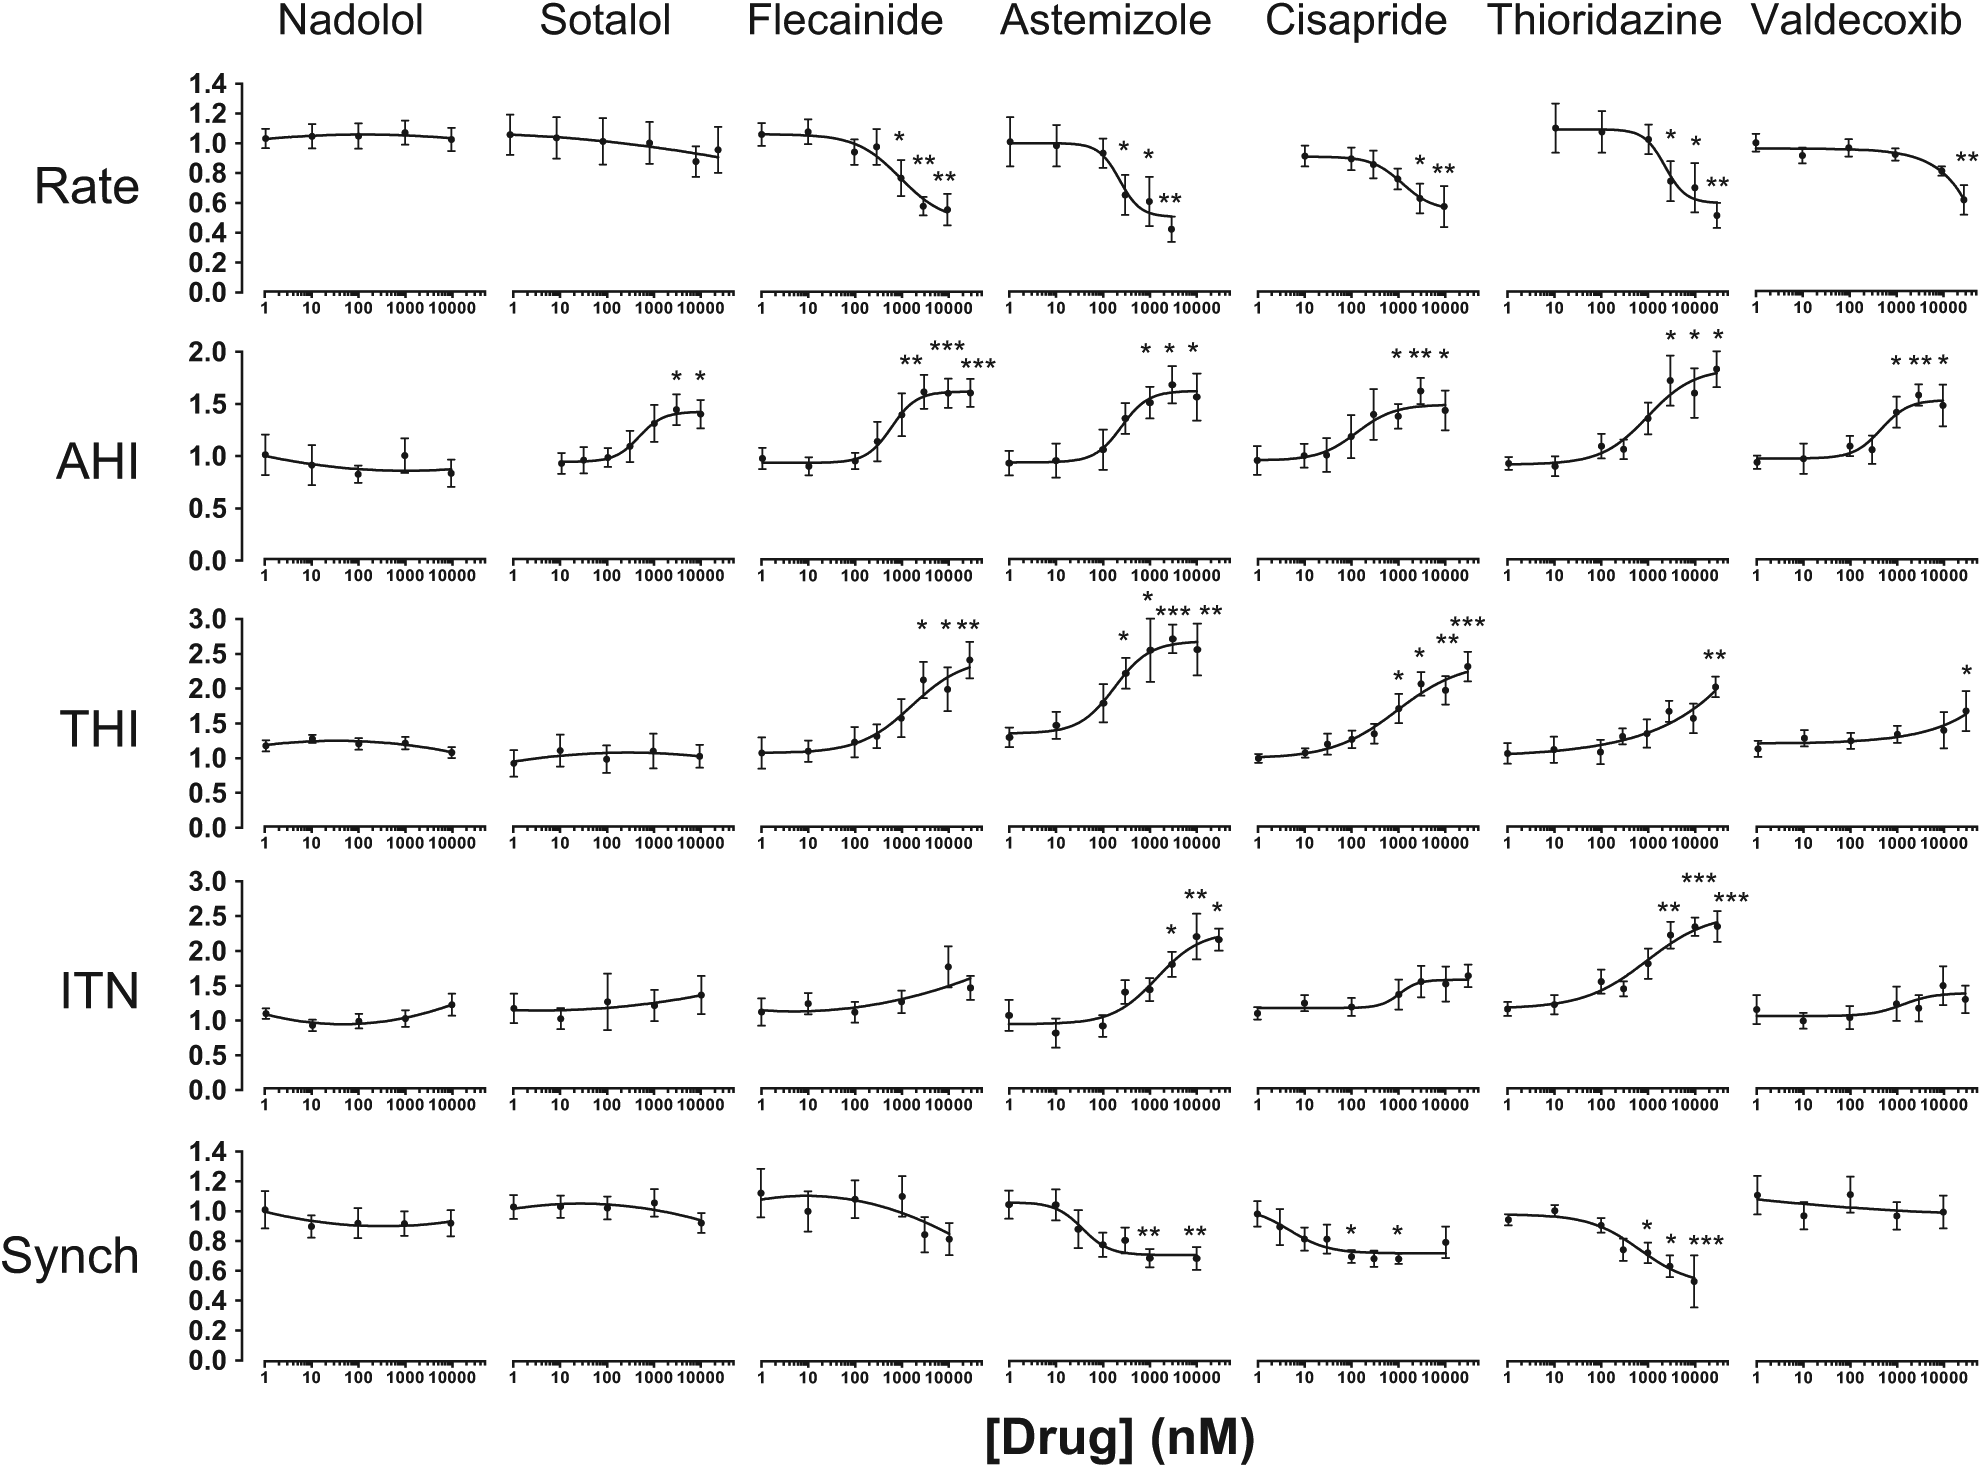
Profiling cardiovascular drug-evoked perturbations in Ca2+ signals. Spontaneously oscillating cells were exposed to compounds (1 nM–30 µM) (see Materials and Methods). Data were normalized to controls (no drug) and are plotted as mean ± SE (n ≥ 6). *p < 0.05. **p < 0.01. ***p < 0.001. EC20 values, the concentration of drug that produces a 20% change relative to control values, are given in
To further corroborate the utility of SALVO to identify potential CV drug hazard that arises from diverse mechanistic bases, we profiled the effects of these same drugs on spontaneous APs. Cytiva CMs were characterized by resting membrane potentials of approximately −60 mV and exhibited ventricular-like waveforms (
Fig. 4
). Astemizole, cisapride, and thioridazine increased APD90, entirely in keeping with their known IKr/hERG blocking activities. However, flecainide and valdecoxib, drugs that markedly perturbed Ca2+ signals (
Fig. 3
) and are known to increase proarrhythmic susceptibility in some circumstances,16,19 had no effect on action potential duration (
Fig. 4A
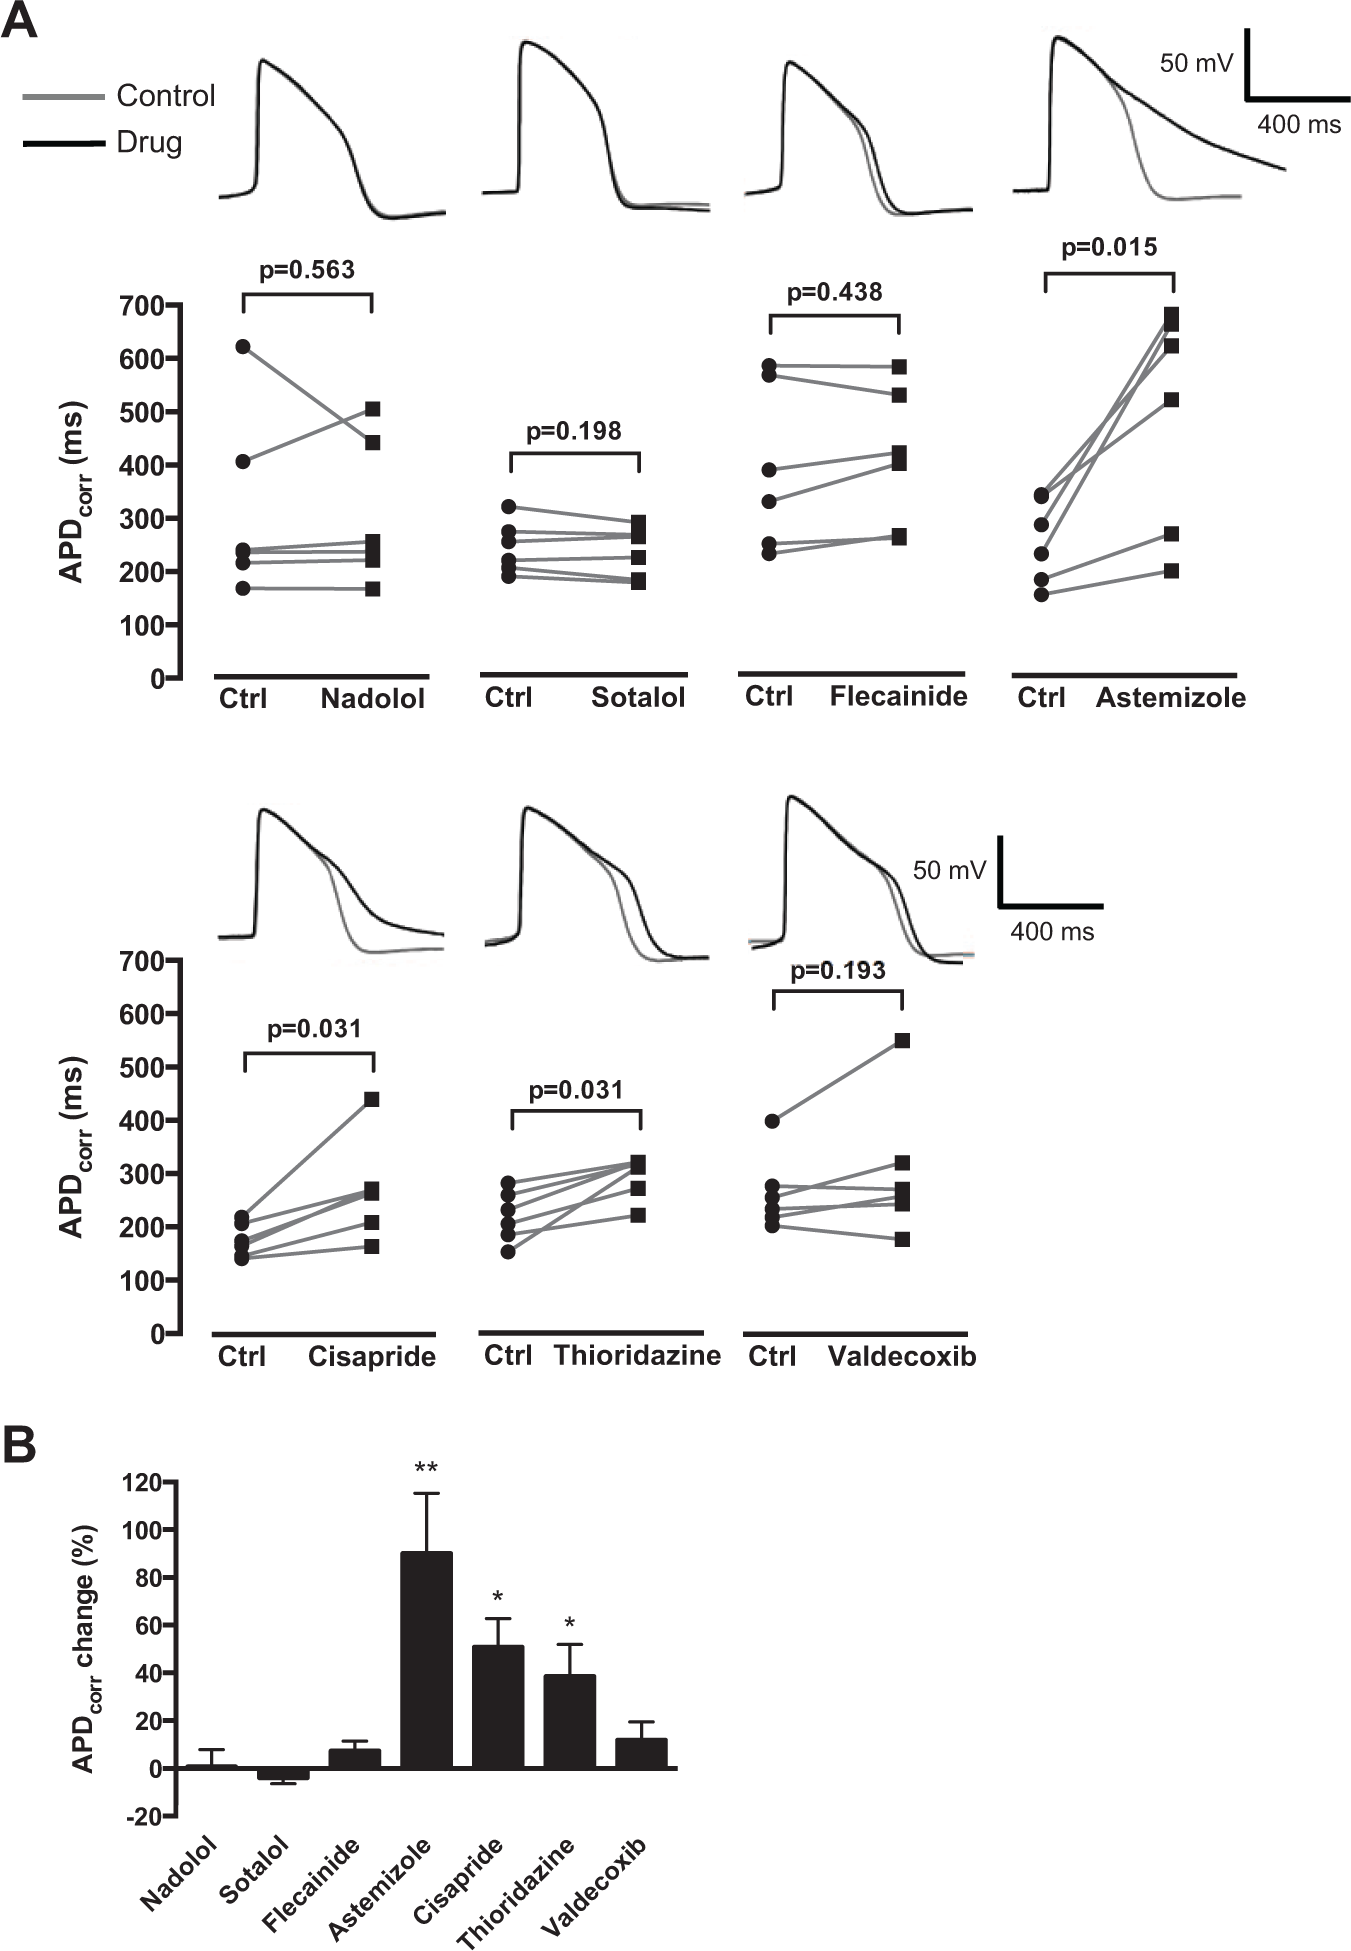
Investigating the effect of cardiovascular-active drugs on Cytiva APD90. (
Cytiva are supplied as a heterogeneous mix of CMs and non-CMs. It is therefore plausible that effects of drugs on contaminant non-CMs could influence the measured effect on CMs (e.g., EC20 values). We used a fluorescence-activated cell sorting (FACS)–based strategy to enrich CMs, but the small population of viable yet morphologically abnormal CMs that were obtained offset any improvement in Ca2+ signal organization observed in post-FACS CMs (
Calculation of a SALVO Toxicity Score and Its Alignment with Proarrhythmic Risk in Humans
The five-parameter SALVO output (
Fig. 3
) was integrated into a single in vitro cytotoxicity score (SALVO toxicity score). The rank order of the extent of Ca2+ perturbation (astemizole > thioridazine > cisapride > flecainide > valdecoxib > sotalol > nadolol) was in very close agreement with the known proarrhythmogenic liabilities of these drugs in humans13,16,25,26 (
Fig. 5A
and
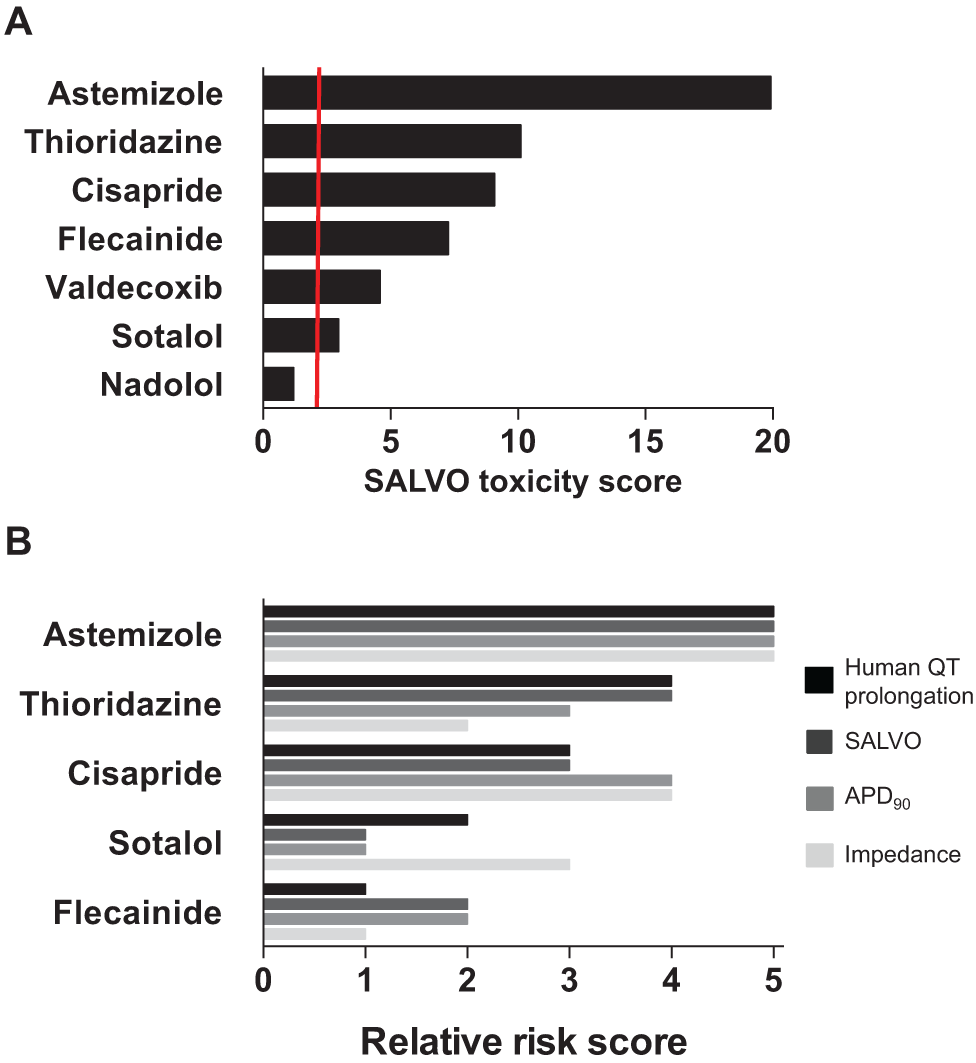
Integrating multiparametric outputs into the SALVO toxicity score. (
There is also the issue regarding the relevance of drug potency determined in vitro to clinical dosing in humans. Guo and colleagues25,27 used an impedance-derived index of arrhythmic beating in hSCCMs to derive a predicted proarrhythmic score (PPS) that took into account the therapeutically relevant total concentration of drug in human plasma (defined as Ceff). More recently, Clements and Thomas
13
used a similar approach to generate a predictive risk score (PRS) based on their measurement of field potential duration (FPD) in Cytiva. In keeping with these studies, we adjusted the five-parameter SALVO output to account for the free plasma concentration of the clinically effective drug (ETPCunbound) (
Hierarchical Clustering Analysis of SALVO Outputs to Discriminate Mechanisms of Drug Action
To further validate the system and to investigate the ability of SALVO to discriminate drugs based on their mechanisms of action, we tested a second set of compounds (see Materials and Methods). Hierarchical cluster analysis (HCA) revealed that, as anticipated, drugs with comparable mechanisms of action clustered together—for example, hERG blockers (terodiline with astemizole), non-hERG blockers (aconitine with flecainide), COX-2 inhibition (celecoxib with valdecoxib), class III antiarrhythmics (sotalol with amiodarone), and β-blockers (nadolol with metoprolol) ( Fig. 6 ). Importantly, we studied two cardioactive drugs selected on the basis of distinct mechanisms of action to those compounds used above. Verapamil, a clinically safe L-type Ca2+ channel blocker, reduced the rate of Ca2+ oscillation at very high concentrations of drug (>10 µM) but otherwise had no measurable effect on cellular Ca2+ handling. Ranolazine, an inhibitor of the late INa that is not associated with elevated CV hazard, 28 reduced intercellular synchronization against a background of unchanged Ca2+ cycling. Consistent with their different mechanisms of action, verapamil and ranolazine were separated in the resultant dendrogram and did not cluster with the other compounds tested in this study ( Fig. 6 ). These data support the conclusion that SALVO discriminates compounds based on their mechanism of action. This analysis used data obtained from the maximally effective concentration of drug to reconcile the impact of these compounds on cellular Ca2+ signaling with their known mechanisms of action. However, these concentrations (typically >1 µM; see Fig. 6 ) greatly exceed the free plasma levels of drug achieved via clinical dosing regimes.16,29 We emphasize therefore that Figure 6 shows the clustering of drugs based on their mechanisms of action and not on their established safety/risk profile in humans.
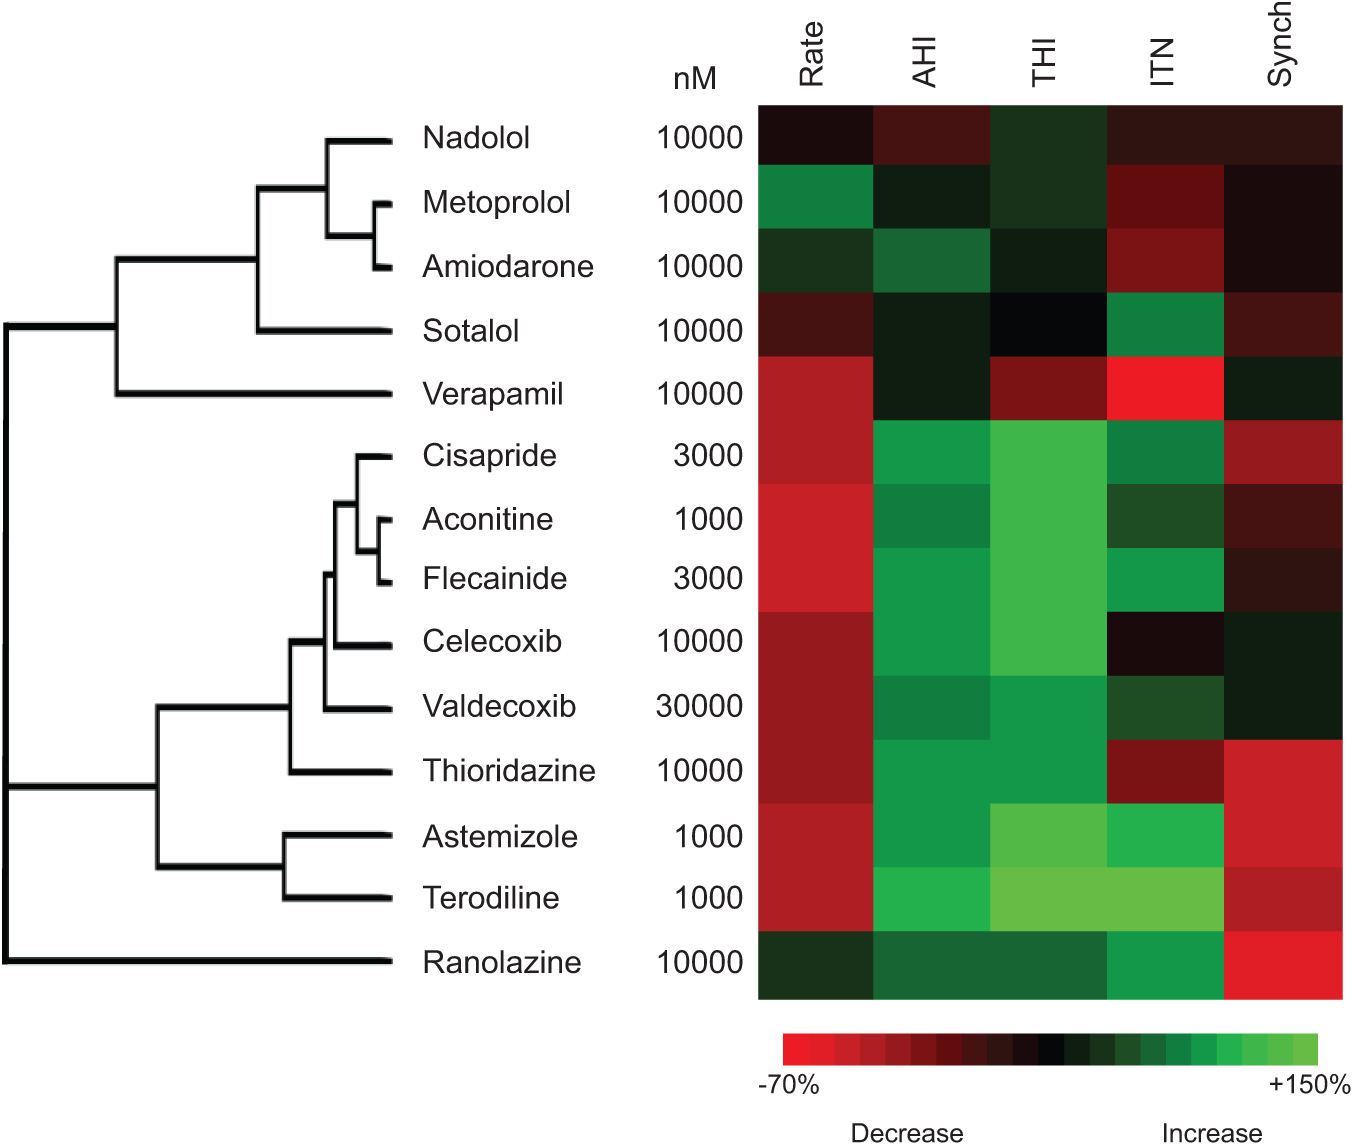
Hierarchical cluster analysis of compounds based on their mechanism of action. The effects of drugs, including a secondary set of validation compounds (see Materials and Methods), on Ca2+ cycling parameters were determined at their maximal effective concentrations.
Future Directions
This study reports the development and proof-of-concept validation of SALVO, a new system to quantify drug-induced (dys)organization of intra- and intercellular Ca2+ signaling in hSCCM populations. We propose that SALVO fills a current void in the early stage drug screening process, specifically via its ability to identify those compounds that exhibit CM cytotoxicity (and thus potentially increase proarrhythmic susceptibility) but have negligible impact on the cellular electrophysiological profile. We also demonstrate the utility of SALVO to discriminate drugs based on their mechanism of action. The present work used only a small number of compounds of known proarrhythmia risk, and clearly, a systematic evaluation of a much larger panel of compounds is now warranted.
The comparative assay miniaturization reported here—17,500 cells seeded in 7-mm2 gaskets and with the potential to use fewer cells still—suggests that this system is amenable to scaling to higher throughput formats (e.g., 384-well plates). Moreover, the system could be configured toward “multiplexing” ion-sensitive fluorescent probes or in combination with electrophysiological platforms. 30 Outside of the predictive toxicology arena, such detailed assessments of cellular Ca2+ signaling may also be useful in quality control (QC) processes, cellular phenotyping, and profiling batch-to-batch variability during the manufacture/differentiation process. It is also noteworthy that SALVO analysis could be applied to any oscillatory biological signal. To this end, it is of interest to explore SALVO in the context of other cell systems (e.g., hepatocytes) and to the analysis of other cellular signals that change on different timescales (e.g., pH).
Footnotes
Acknowledgements
We thank Dr. Catherine Naseriyan (Central Biotechnology Services, Cardiff University) for technical assistance with FACS.
Declaration of Conflicting Interests
The authors declared the following potential conflicts of interest with respect to the research, authorship, and/or publication of this article: SALVO is the subject of a filed patent but is not yet commercially available.
Funding
The authors disclosed receipt of the following financial support for the research, authorship, and/or publication of this article: This work was supported by grants from the British Heart Foundation (FS/09/028/27602, FS/06/082/21723), Heart Research UK (RG2559), Wellcome Trust (094219/Z/10/Z), and the Cardiff Partnership Fund.
References
Supplementary Material
Please find the following supplemental material available below.
For Open Access articles published under a Creative Commons License, all supplemental material carries the same license as the article it is associated with.
For non-Open Access articles published, all supplemental material carries a non-exclusive license, and permission requests for re-use of supplemental material or any part of supplemental material shall be sent directly to the copyright owner as specified in the copyright notice associated with the article.