
Abstract
Spheroid-based cellular screening approaches represent a highly physiologic experimental setup to identify novel anticancer drugs and an innovative preclinical model to reduce the high failure rate of anticancer compounds in clinical trials. The resazurin reduction (RR) assay, known as the alamarBlue or CellTiter-Blue assay, is frequently used to determine cell viability/proliferation capacity in eukaryotic cells. Whether this assay is applicable to assess viability in multicellular spheroids has not been evaluated. We analyzed the RR assay to measure cytotoxic and/or cytostatic responses in tumor cell spheroids compared with conventional 2D cultures. We found that tight cell-cell interactions in compact spheroids hamper resazurin uptake and its subsequent reduction to resorufin, leading to lowered reduction activity in relation to the actual cellular health/cell number. Treatment with staurosporine disrupted close cell-cell contacts, which increased resazurin reduction compared with untreated controls. Loss of tight junctions by trypsinization or addition of EGTA or EDTA restored high resazurin reduction rates in untreated spheroids. In conclusion, the RR assay is unsuited to quantitatively measure cellular health/cell number in compact spheroids. However, it can be used to distinguish between cytotoxic versus cytostatic compounds in spheroids. Restoration of the correlation of cell viability/number to resazurin reduction capacity can be achieved by disruption of tight junctions.
Introduction
Cancer is one of the leading causes of death in the world and accounted for an estimated 8.2 million deaths worldwide in 2012. 1 The overall survival rate of patients with cancer undergoing systemic therapy has been extended only marginally over the past 30 years (cancer statistics reports, “Statistik Austria” 2 and “Cancer Mortality in the UK” 3 ). Cancer therapy for advanced cancers is far from being efficient to date. Despite some key therapeutic success in targeted therapy such as the development of BCR-Abl inhibitors, the current failure rate of anticancer compounds in clinical trials is 96%. 4 This inefficiency is among the major reasons why the costs have risen to more than $2 billion for the development of one anticancer drug until final approval. 4 Clearly, there is an urgent need for more innovative preclinical models to thoroughly test promising compounds before proceeding into clinical trials.
Conventional cell culture on flat surfaces (2D culture) was crucial to understand many basic molecular principles in cell biology and cancer development. 5 However, these culture conditions do not properly reflect the in vivo situation. For example, correct tissue architecture, cell-cell contacts, cell-matrix interactions, and mechanical features are lost. Cells grown in three dimensions in scaffolds or as multicellular spheroids better simulate in vivo tumor biology.6–8 In 3D cultures, global gene expression 9 and drug and radiation therapy responses 10 closely resemble the in vivo situation. In addition, as is the case in tumors, proliferating and quiescent, normoxic, and hypoxic cells, as well as alive, apoptotic, or necrotic cells, coexist in multicellular spheroids. 11 Consequently, 3D models are promising candidates for improved preclinical models, because they represent appropriate physiological systems and are suited to perform cell-based drug screening or to evaluate potential therapeutic molecules.
To identify antiproliferative or cytotoxic compounds in cellular screening assays, a rapid, simple, reliable, robust, ideally nontoxic, and cost-efficient method is advantageous. The alamarBlue (AbD Serotec, Oxford, UK) assay 12 was often employed to fulfill these criteria and is frequently used in high-throughput screening (HTS) attempts. The active component in the alamarBlue assay is resazurin (7-hydroxy-3H-phenoxazin-3-one 10-oxide), 13 which can be used as an oxidation reduction indicator. The blue-colored resazurin is nonfluorescent, whereas in its reduced form, called resorufin (7-hydroxy-3H-phenoxazin-3-one), it is pink and highly red fluorescent ( Fig. 1A ). The resazurin reduction (RR) assay is a longstanding assay used to identify bacterial or fungal contamination in the food industry or to assess sperm quality. 14 More recently, it was used to measure cell proliferation and viability in eukaryotic cells.15,16 The molecular details of cellular RR are not fully understood; it is assumed that resazurin enters the cells and is reduced in metabolically active cells in the cytoplasm, and resorufin is excreted into the medium. 13

Different response of colon cancer cells to staurosporine treatment in 2D and 3D. (
To our knowledge, a detailed analysis regarding whether the RR assay is suitable to measure cell viability and/or cell number in multicellular spheroids is not available. Therefore, we performed a systematic analysis to determine whether cancer spheroids are able to reduce resazurin and whether there is a linear correlation between resazurin reduction and cell number/viability as known for 2D cultures. As a model system, we used four colon cancer cell lines, which were induced to form spheroids of different cell numbers. To interfere with cell viability, we used staurosporine, a natural alkaloid isolated from the bacterium Streptomyces staurosporeus. 17 This adenosine triphosphate (ATP)–competitive kinase inhibitor with low selectivity 18 is widely used to induce apoptosis in cultured cells. One way of staurosporine action is to induce apoptosis by activating caspase-3, 19 which can lead to a decrease in cell-cell contacts by cleavage and shedding E-cadherin. 20
Materials and Methods
Cell Culture
Human colonic cancer cell lines DLD-1 (ATCC CCL-221), HCT 116 (ATCC CCL-247), SW620 (ATCC CCL-227), and HT-29 (ATCC HTB-38) were obtained from the American Type Culture Collection (ATCC, Manassas, VA) and were cultured in Dulbecco’s modified Eagle’s medium (DMEM; PAA, Pasching, Austria) high glucose (4.5 g/L), supplemented with 10% fetal calf serum (FCS; PAA), 2 mM L-glutamine (PAA), and antibiotics (60 mg/L penicillin and 100 mg/L streptomycin sulfate; Sigma-Aldrich, St. Louis, MO).
Spheroid Formation
Spheroid formation (3D) was induced as described earlier. 21 In brief, cells were washed, trypsinized, and subsequently seeded in 100-µL cell culture medium per well in a 96-well plate (round bottom, untreated; PAA). Spheroids were formed for 24 h and grown in DMEM high glucose (4.5 g/L), supplemented with 5% fetal calf serum, 2 mM L-glutamine, and antibiotics (60 mg/L penicillin and 100 mg/L streptomycin sulfate) containing methylcellulose (Sigma-Aldrich; 0.3% final concentration). In parallel, cells were seeded on conventional cell culture plates (2D) and cultured as described for spheroids above. The 2D and 3D cultures were cultivated in plastic humidity chambers to avoid unequal evaporation 22 in a cell culture incubator under standard conditions (80% humidity, 5% CO2, 20% O2, 37 °C). When spheroid formation was completed, 2D and 3D cultures were treated for 18 to 48 h with the apoptosis-inducing 19 agent staurosporine (1 µM; Sigma-Aldrich) or DMSO as solvent control. Afterward, cellular health was evaluated via cell viability and apoptosis assays.
Cell Viability Assays
For determining the presence of metabolically active cells, the resazurin reduction assay and a luminescence assay measuring cellular ATP levels were performed according to the manufacturer’s protocols (CellTiter-Blue and CellTiter-Glo assays, respectively; Promega, Madison, WI). In this study, the CellTiter-Blue assay was used. It is a fluorometric method to estimate the number of viable cells by measuring the reduction of resazurin into resorufin. One-tenth of culture volume of the CellTiter-Blue solution was added to each well of the 96-well plate, which was then incubated for 1 to 6 h at 37 °C and 5% CO2. Importantly, for extended HTS approaches, resazurin, in contrast to the commercially available ready-to-use solutions, is very cheap, and 5 g of the pure chemical can be dissolved in 400 L of NaCl/Pi buffer to yield a 10× stock solution ready to use at 10% in standard growth medium. 13 Fluorescence intensity was measured at a 530-nm excitation wavelength and a 590-nm emission wavelength 15 using a Synergy HT Photometer (Biotek Instruments, Winooski, VT).
The CellTiter-Glo luminescent assay determines the number of viable cells in culture based on quantifying the ATP present. In total, 100 µL of CellTiter-Glo reagent was added to each well containing 100 µL of cell culture medium and the spheroids. The contents were mixed for 2 min at room temperature on an orbital shaker to induce cell lysis. Afterward, the 96-well plates were incubated at room temperature for 10 min, and luminescence was measured photometrically. Propidium iodide (PI) staining was used to determine the amount of permeable, dead cells. For that, spheroids (3D) and cells on conventional culture plates (2D) were incubated with 2 µg/mL PI for 1 h at 37 °C. PI uptake was quantified by counting PI-positive (PI+) cells in 2D and by measuring the fluorescence intensity in 3D via image analysis software (Image J, mean integrated density; National Institutes of Health, Bethesda, MD).
Apoptosis Assay
For measuring the rate of apoptosis by the activity of caspase-3 and caspase-7, the Apo-ONE Homogeneous Caspase-3/7 assay (Promega) was performed according to the manufacturer’s protocol. In this apoptosis assay, activated caspase-3 and caspase-7 cleave and remove the DEVD (Asp-Glu-Val-Asp) peptides of the rhodamine 110 substrate, which then becomes intensely fluorescent. In total, 100 µL of Apo-ONE Homogeneous Caspase-3/7 reagent was added to each well containing 100 µL of cell culture medium and cells. Contents were mixed on a plate shaker for 30 min at room temperature, and the fluorescence signal was recorded at a 499-nm excitation wavelength and a 521-nm emission wavelength.
Immunofluorescence/Confocal Microscopy
For microscopic analysis, spheroids were prepared as described by Weiswald et al. 23 Briefly, spheroids were fixed and permeabilized in phosphate-buffered saline (PBS; PAA) containing 4% paraformaldehyde (PFA; Sigma-Aldrich) and 1% Triton X-100 (Sigma-Aldrich). After washing in PBS, spheroids were dehydrated in an ascending series of methanol in PBS (25%, 50%, 75%, 95%, and 100%) and rehydrated in the same descending series. After blocking in PBS containing 0.1% Triton X-100 (PBST) and 3% bovine serum albumin (BSA; GE Healthcare, Little Chalfont, UK), spheroids were first incubated with zonula occludens 1 (ZO-1, 1 µg/mL; Zymed, Life Technologies, Carlsbad, CA) or with normal mouse IgG (Santa Cruz Biotechnology, Dallas, TX) and then in the Alexa Fluor 488–conjugated secondary antibody (4 µg/mL; Molecular Probes, Life Technologies, Carlsbad, CA), both diluted in PBST. Cell nuclei were counterstained with 1 µg/mL 4′,6-diamidino-2-phenylindole (DAPI; Sigma-Aldrich). Mounting of spheroids was performed with Vectashield mounting medium for fluorescence (Vector Laboratories, Burlingame, VT) on a glass slide with a cover slip on top, using Parafilm (Bemis, Neenah, WI, USA) as a “spacer” in between. Fluorescence images were recorded on a Zeiss LSM700 (Carl Zeiss, Jena, Germany) confocal microscope with a 40× oil immersion objective (NA = 1.3).
Disruption of Tight Junctions in Spheroids
The cell culture medium of each well containing the spheroids was removed and cells were washed once with PBS. Trypsin-EDTA was added and enzymatic dissociation was observed via microscopic examination for a maximum of 10 min.
Alternatively, disruption of adherens junctions leading to loss of tight junctions in spheroids was performed by the application of EDTA (5 mM final concentration) or ethylene glycol tetraacetic acid (EGTA) 24 (4 mM final concentration). For that, EDTA or EGTA was added directly to each well containing cell culture medium and spheroids and incubated at 37 °C. After 45 min, the RR assay was performed or the medium containing the EGTA was replaced by fresh cell culture medium, allowing the reestablishment of intercellular junctions prior to the RR assay.
Screening Assay
Spheroids were formed for 24 h and grown in DMEM high glucose (4.5 g/L), supplemented with 5% fetal calf serum, 2 mM L-glutamine, and antibiotics (60 mg/L penicillin and 100 mg/L streptomycin sulfate) containing methylcellulose (Sigma-Aldrich; 0.3% final concentration). After a 24-h aggregation, treatment with the compounds of the Prestwick Chemical Library (10 µM) was carried out for another 48 h. Afterward, the resazurin solution was added and resorufin fluorescence was measured. All experiments were done in biological triplicates.
Statistical Analysis
Bar graphs were created in Microsoft Excel 2007 for Windows (Microsoft, Redmond, WA) and are presented as mean ± standard deviation (SD). For statistical analysis, the Student t test (unpaired, two-tailed) was performed in GraphPad Prism 4 (GraphPad Software, La Jolla, CA). The number of biological replicates for each assay is indicated in the figure legends.
Results
Resazurin/Resorufin Fluorescence in Colon Cancer Spheroids upon Apoptosis Induction
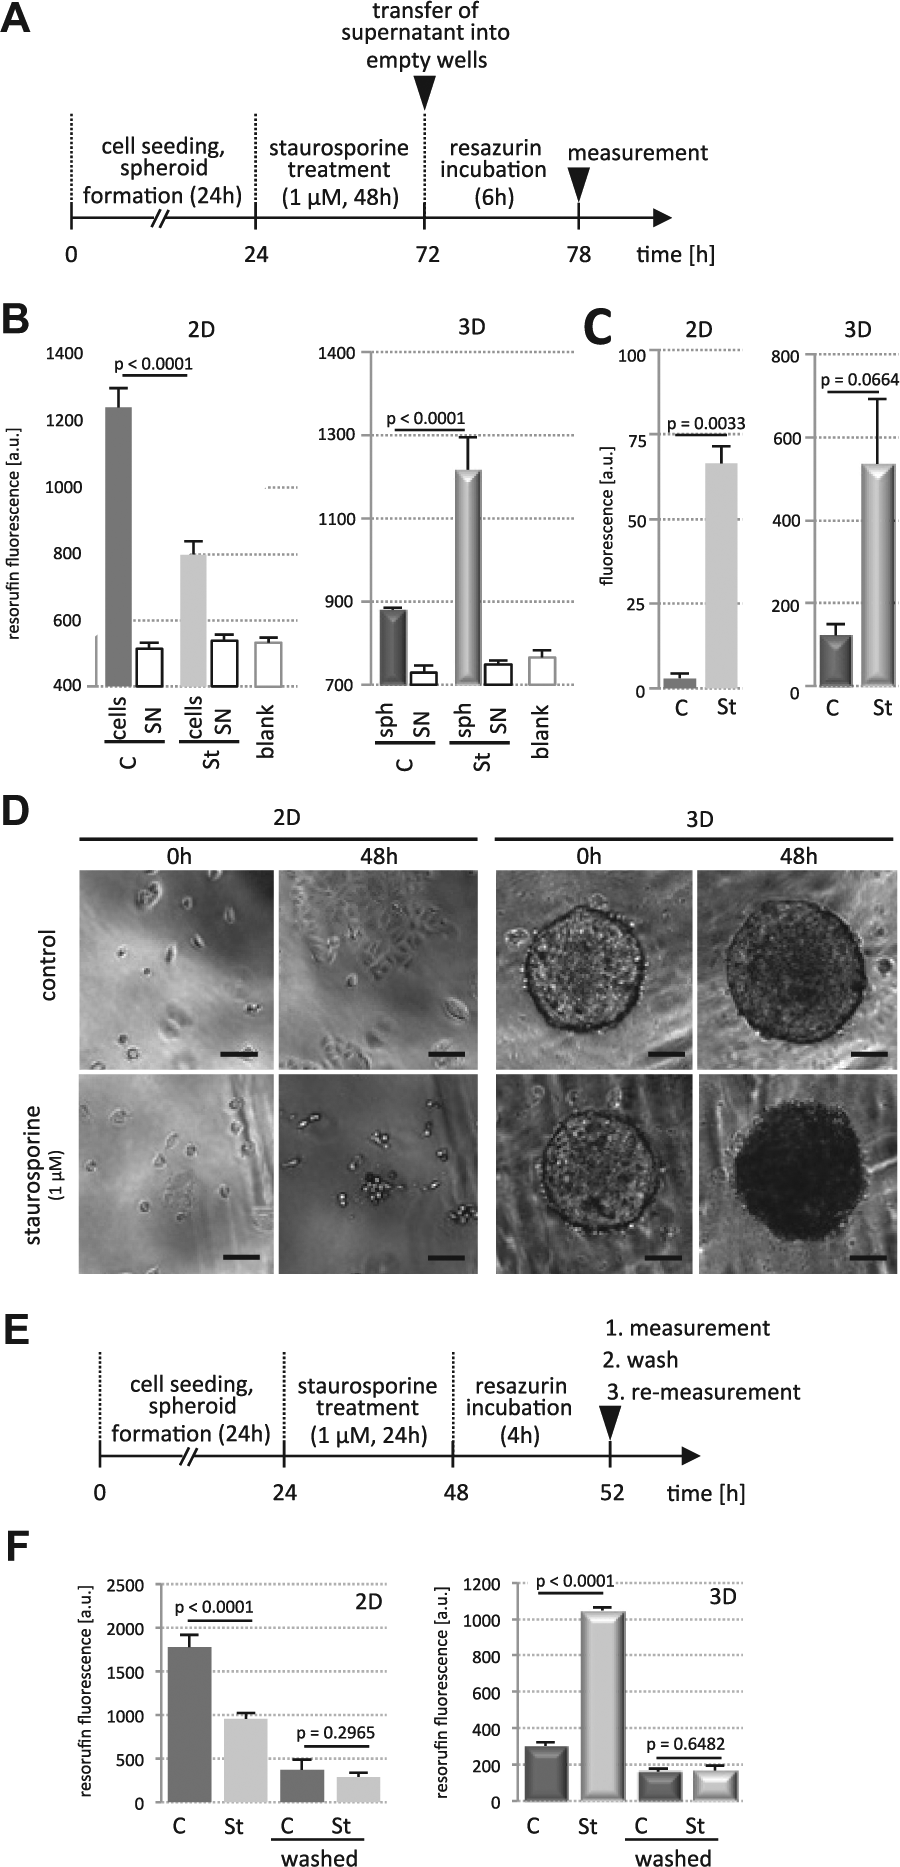
The colorectal cancer cell lines DLD-1, HT29, HCT116, and SW620 were induced to form spheroids (3D) and were seeded in 2D culture in parallel ( Fig. 1B ). Two cell lines (DLD-1, HT29) formed compact spheroids, with close cell-cell interactions, where individual cells could not be distinguished any more ( Fig. 1C , upper panels). In contrast, HCT116 and SW620 formed cell aggregates in which individual cells remained recognizable (loose spheroids; Fig. 1C , lower panels). The cells and spheroids were treated with staurosporine (1 µM) or DMSO as control. Upon staurosporine treatment, cells in 2D stopped dividing and displayed cell rounding and membrane blebbing typical for apoptosis. In DMSO controls, the expected increase in cell number was detectable ( Fig. 1C ). Spheroids treated with staurosporine became refractive and appeared dark in transmission light microscopy ( Fig. 1C ). In addition, dense cell-cell contacts of HT29 and DLD-1 cells were lost and individual cells were recognizable. After phenotypical evaluation, cellular health (we use here cellular health as a hyponym for viability and proliferative/metabolic/respiratory activity) of the cells in 2D and 3D with and without staurosporine treatment was evaluated using the resazurin/resorufin assay. As expected for a potent apoptosis inducer, staurosporine treatment resulted in lower resorufin levels (i.e., loss of cellular health) in the 2D cultures by decreased reduction potential in the dying cells ( Fig. 1D ). Surprisingly, in 3D, the compact spheroids of HT29 and DLD-1 cells showed an increase in resorufin upon staurosporine treatment compared with the DMSO controls. In contrast, staurosporine-treated HCT116 and SW620 spheroids displayed decreased resorufin levels ( Fig. 1D ). These data indicate that there was a differential response of tightly packed spheroids and loose spheres. However, morphologically all spheroids showed signs of dying cells upon staurosporine exposure.
Staurosporine-Induced Caspase Activity in DLD-1 Cells, Both in 2D and 3D
DLD-1 cells were treated in 2D and 3D with staurosporine (1 µM) for 48 h, and subsequently, cellular health was measured with the RR assay and compared with caspase-3/7 activity measurements thereafter ( Fig. 2A ). In agreement with the previous results, staurosporine treatment resulted in decreased resorufin levels in 2D ( Fig. 2B ), whereas in 3D, again an increased fluorescence was observed ( Fig. 2B , right). To rule out that dying cells in 3D released an undefined activity into the medium, which might reduce resazurin to resorufin, we determined resorufin fluorescence in cell supernatants in parallel control cultures. Supernatants alone displayed no increase in fluorescence compared with medium-only controls ( Fig. 2B ), indicating that there was no reducing activity released into the culture medium under staurosporine treatment in 2D and 3D. However, measurement of caspase-3/7 activities using the Apo-ONE Homogeneous Caspase-3/7 assay (Promega) revealed that both 2D and 3D cultures underwent apoptosis in the staurosporine conditions ( Fig. 2C ). This was consistent with morphological changes typical for apoptosis such as cytoplasmic shrinkage, apoptotic body formation, and changes in the refractive index ( Fig. 2D ). The increased refractivity was most apparent in the spheroids, which appeared very dark under staurosporine treatment ( Fig. 2D , lower right panel). Next, we wanted to rule out that the increase in resorufin fluorescence in staurosporine-treated spheroids was due to an accumulation of unspecific fluorescence within the spheroid. For this, treated and untreated DLD-1 cells cultured in 2D and 3D were measured for resorufin fluorescence (experimental setup; see Fig. 2E ) and confirmed the previous data (compare Figs. 1C and 2B ). Thereafter, resorufin was removed by discarding the supernatants. Cells (2D) and spheroids (3D) were washed and immediately remeasured for resorufin fluorescence at the same wavelength settings as for the RR assay. This experiment showed very low endogenous autofluorescence of the spheroid alone, which was not altered upon staurosporine treatment ( Fig. 2F ). Conventional 2D cultures were measured in parallel as controls ( Fig. 2F ) and were also low in autofluorescence.
Caspase activity is induced in 2D and 3D upon staurosporine treatment. (
Staurosporine-Induced Cell Death in DLD-1 Spheroids in a Dose-Dependent Manner
To further substantiate our findings that DLD-1 spheroids displayed many signs of apoptosis in contrast to increased resazurin reduction activity, we analyzed dose responses to staurosporine in DLD-1 cells grown as 2D and 3D cultures. Cell death in staurosporine- or DMSO-treated spheroids was determined by propidium iodide (PI) uptake ( Fig. 3A ) and quantified. The 2D and 3D cultures displayed a dose-dependent increase in cell death as a measure of PI positivity ( Fig. 3B ). The accumulating dark appearance of the spheroids in transmission light microscopy paralleled the augmentation in PI-positive cells with increasing staurosporine concentrations. Apo-ONE Homogeneous caspase-3/7 activity assays affirmed the staurosporine dose-dependent induction of cell death in conventional 2D and spheroid cultures ( Fig. 3C ). In line with this, a decrease in cell viability/metabolic activity was detectable in 2D with the RR assay. In sharp contrast again, in 3D, a dose-dependent increase in fluorescence was detectable ( Fig. 3D ). We concluded that in 3D, the RR assay as a single readout would misleadingly indicate an increase in metabolic or respiratory activity/cellular health/cell proliferation in a dying cell population.
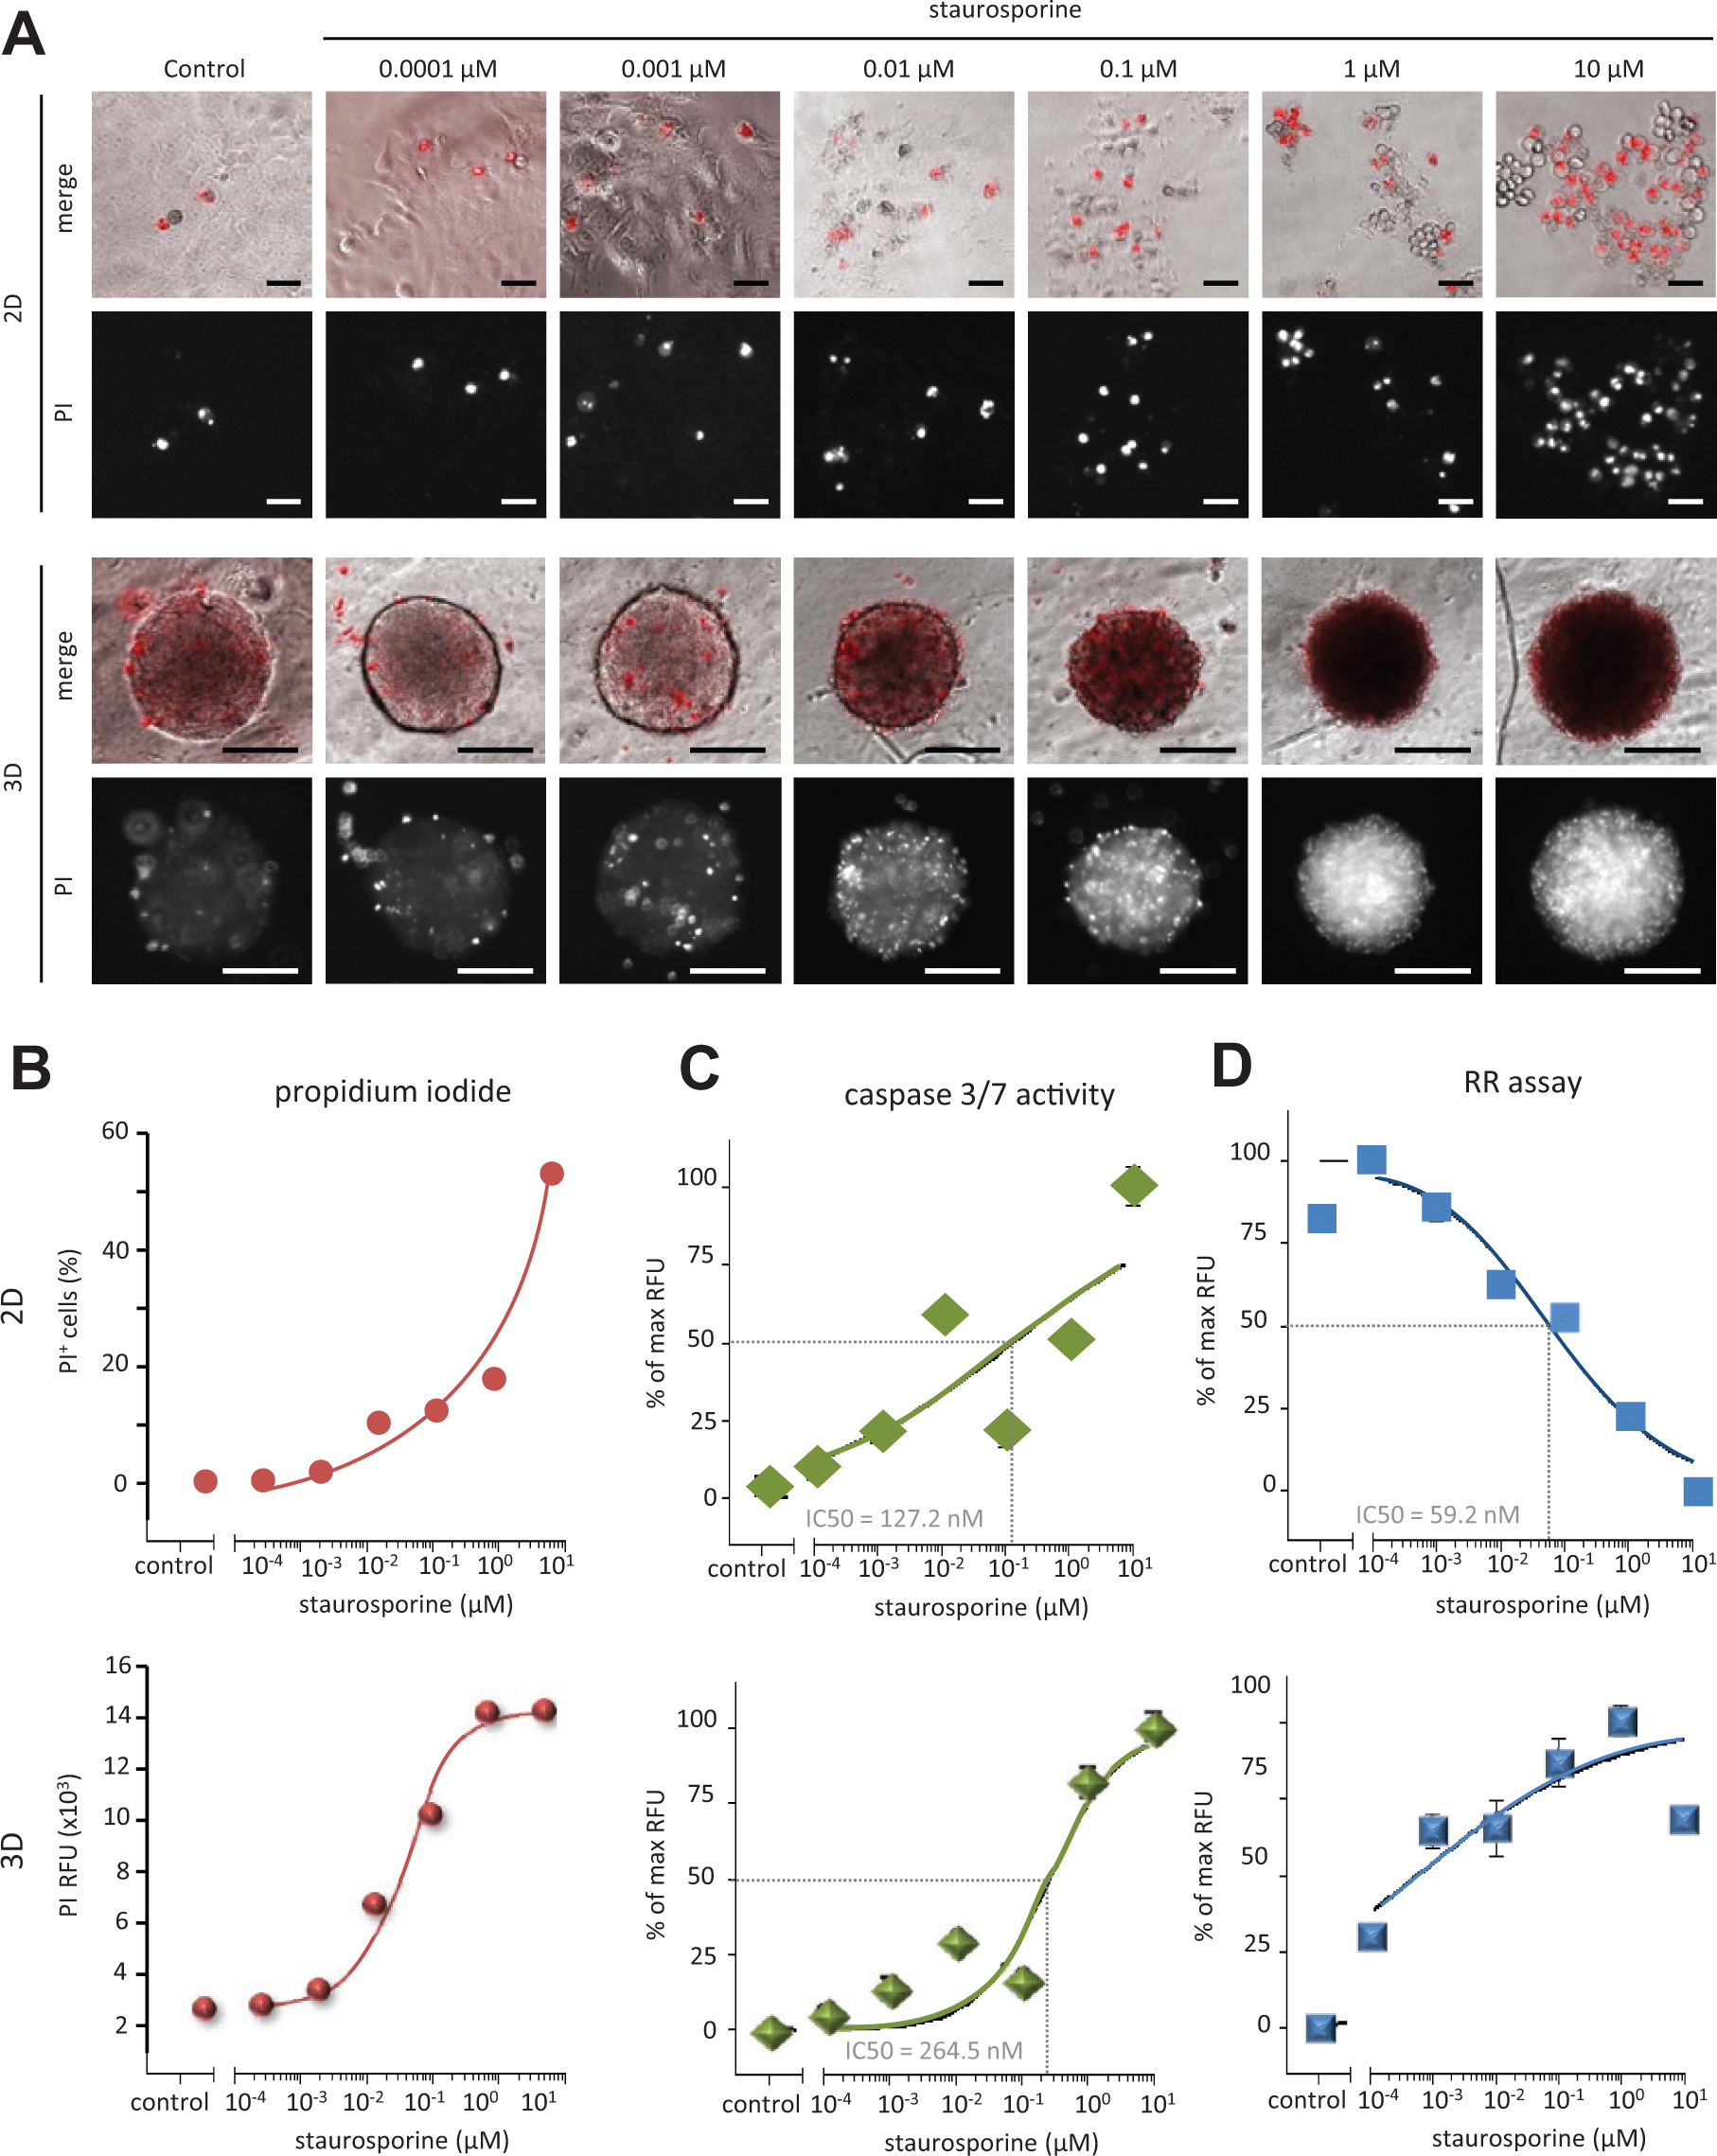
Dose response to staurosporine of DLD-1 cells grown in 2D and 3D. DLD-1 cells were grown as 2D or 3D cultures for 24 h and were treated with DMSO or 1 µM staurosporine for 48 h. (
Influence of Spheroid Size on Resazurin Reduction in Compact but Not in Loose Spheroids
Next we determined the impact of spheroid size on the RR assay. Compact (DLD-1 and HT29) and loose (HCT116 and SW620) spheroids of different sizes were grown for 24 h and subsequently resorufin fluorescence was determined. DLD-1 and HCT116 data are shown (
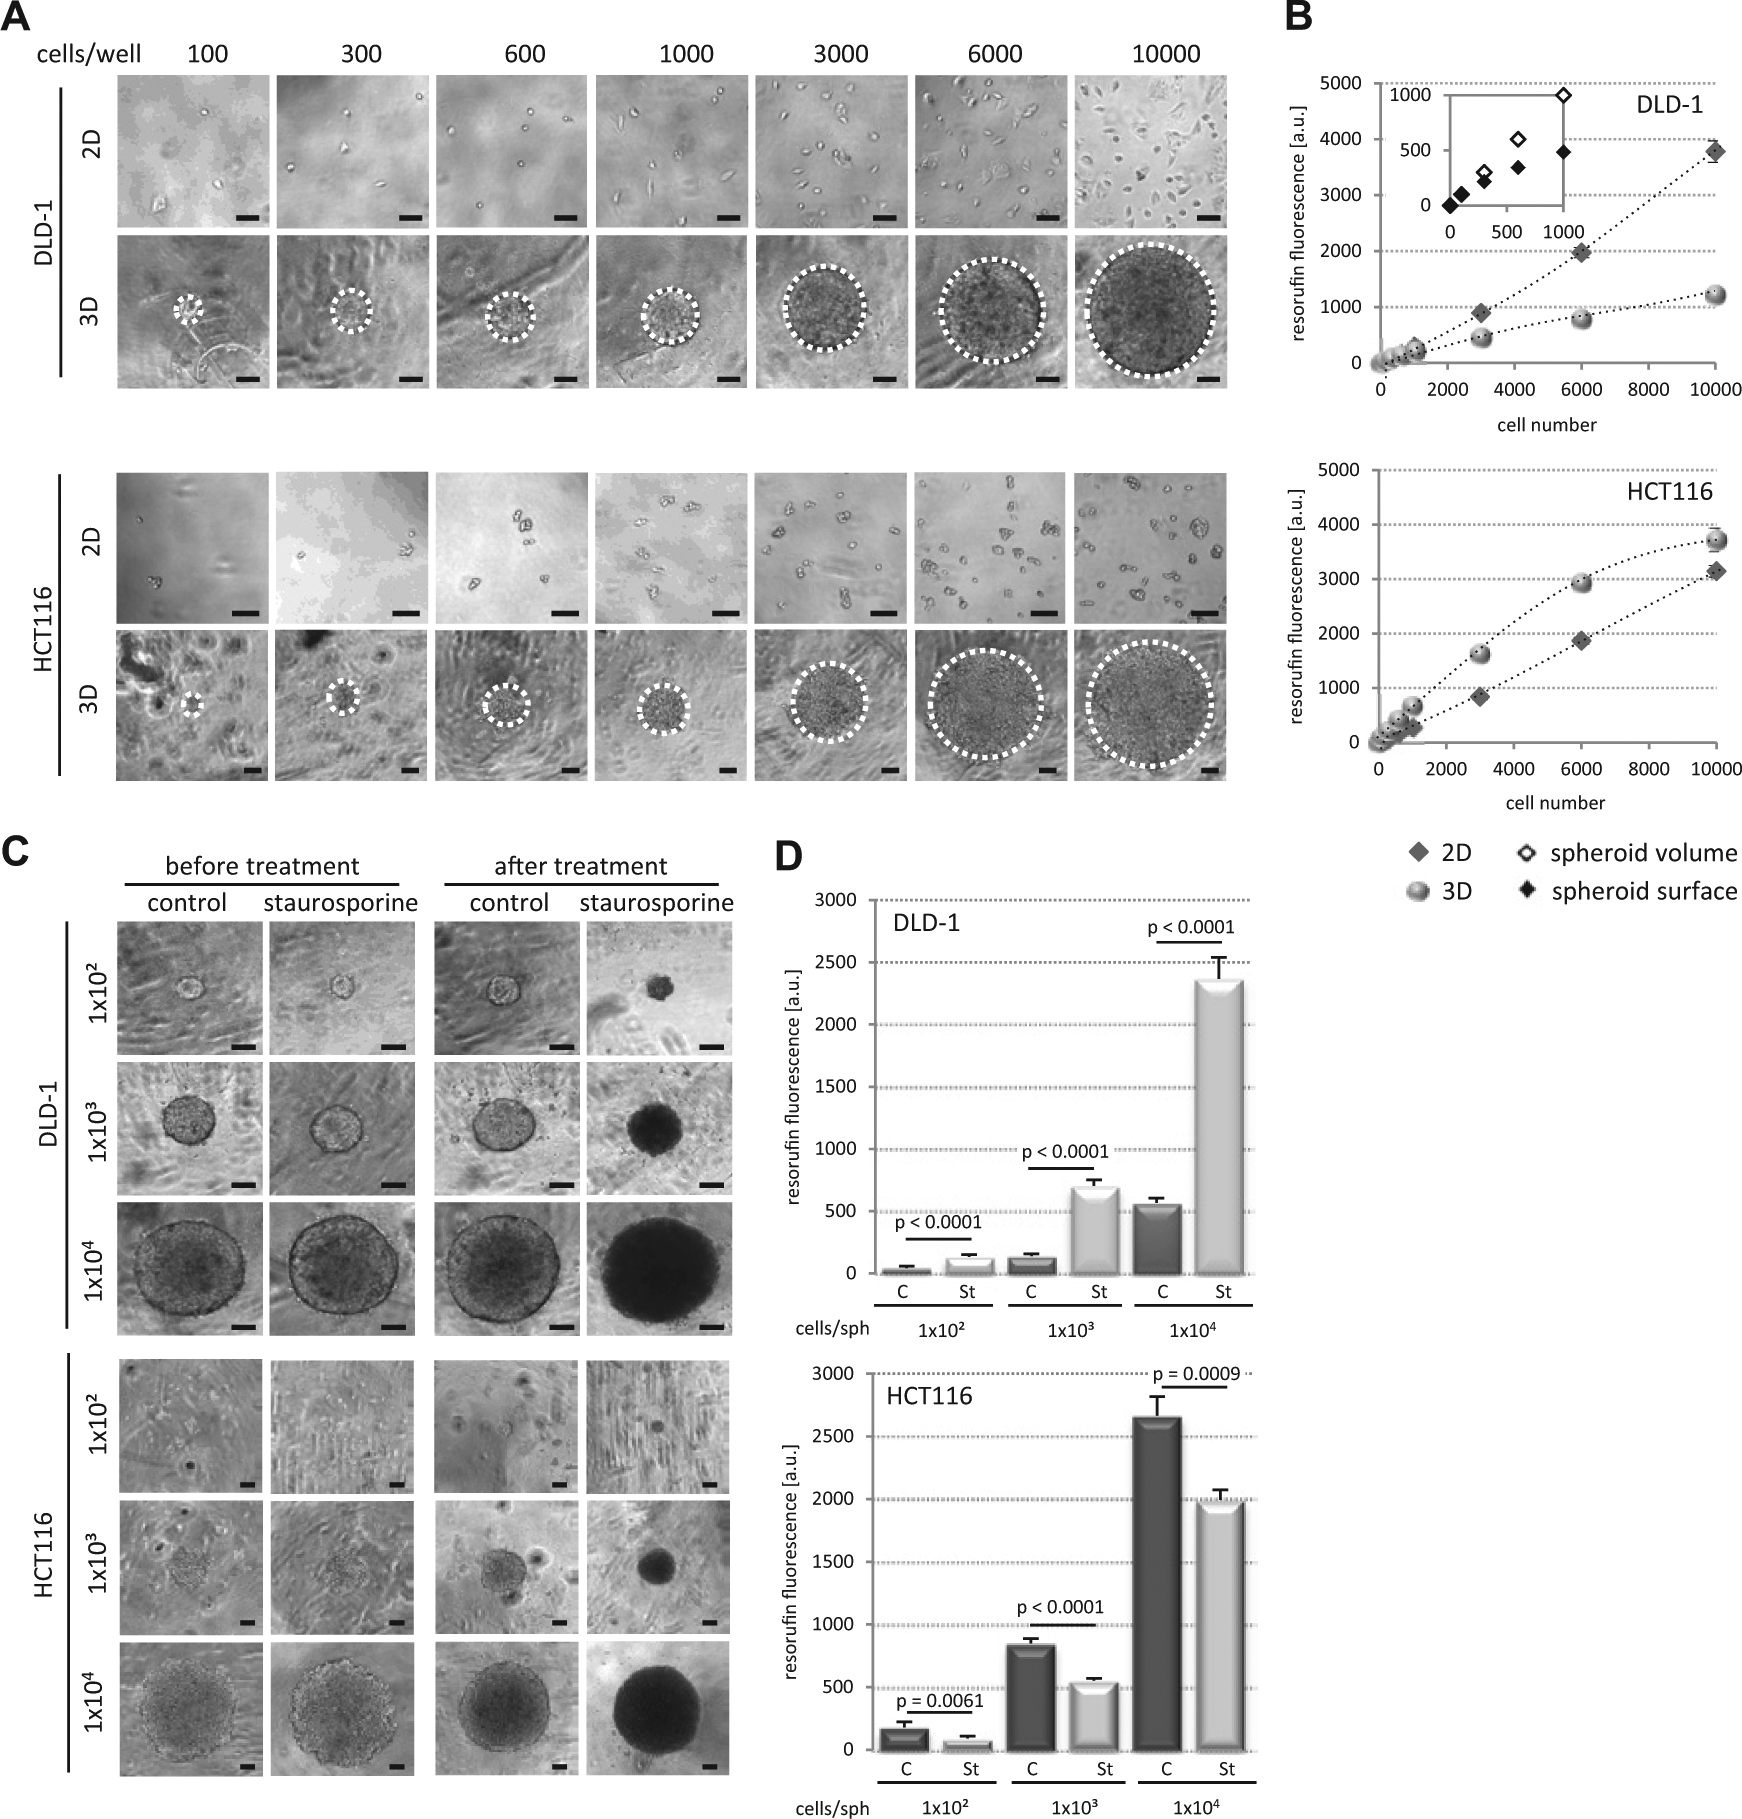
Spheroid size influences resazurin reduction in compact spheroids. (
Spheroid Decompaction and Loss of Tight Junctions Restored High Resazurin Reduction Activity
To further test our hypothesis, DLD-1 and HT29 spheroids were formed and incubated with staurosporine (1 µM) for 18 h, and subsequently resazurin reduction activity was measured in intact spheroids as done before. In parallel, spheroids were trypsinized for a short period ( Fig. 5A ), and resazurin reduction was carried out. The obvious loss of close cell-cell contacts upon trypsinization ( Fig. 5B ) and accessibility of the substrate to every single cell of the spheroid resulted in an increase of resazurin reduction activity in DMSO controls and in staurosporine-treated spheroids ( Fig. 5C ). Interestingly, with this experimental setup, staurosporine treatment resulted in a decreased resazurin reduction activity in line with the previously shown induction of cell death in the compact spheroids compared with controls.
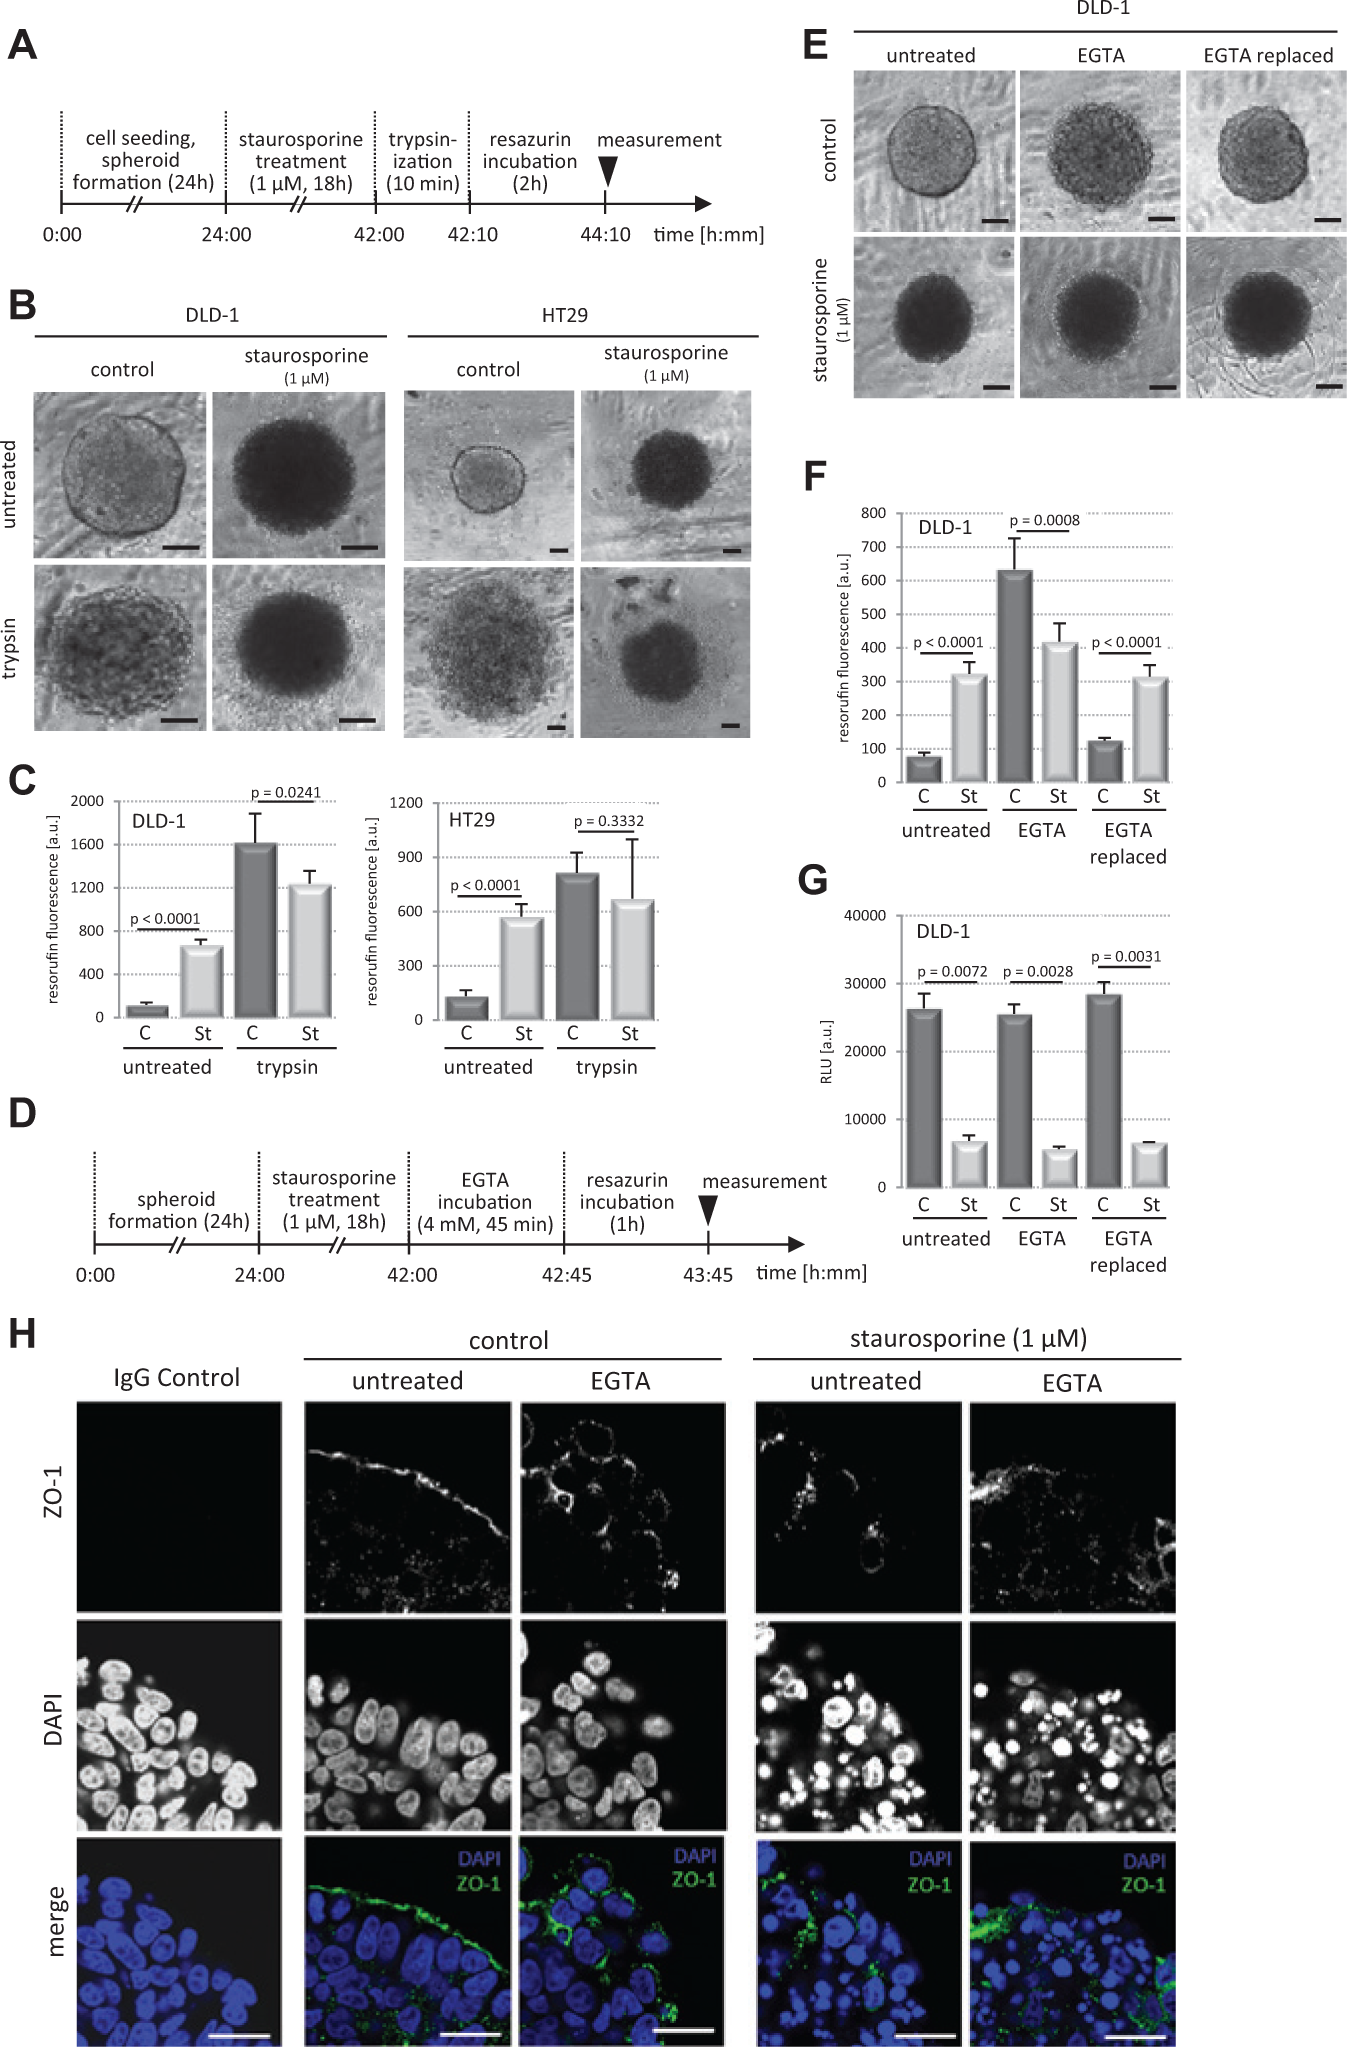
Loss of tight junctions restores resazurin reduction activity. (
Trypsinization is laborious and time-consuming in medium- to high-throughput cellular screening assays; therefore, disruption of tight cell junctions in the spheroids was also tested with the Ca2+ chelator EGTA, known to break down adherens and consequently tight junctions. DLD-1 spheroids treated with staurosporine (1 µM) for 18 h and DMSO as control were incubated with EGTA (4 mM) for another 45 min (
Fig. 5D
). Short-term EGTA treatment resulted in loss of tight cell-cell contacts but cell-cell interaction remained, which kept spheroids intact (
Fig. 5E
). Resorufin fluorescence was measured in untreated and EGTA-treated spheroids, which were washed in medium to remove the EGTA. This quickly reestablished close cell-cell interactions (
Spheroid Surface Expression of the Tight Junction Protein ZO-1 Is Lost in Staurosporine- and EGTA-Treated DLD-1 Spheroids
To corroborate our findings that tight cell-cell contacts can hinder resazurin from entering the spheroid core, which falsely lead to low resorufin levels despite high cell viability and metabolic activity, we performed immunofluorescence stainings of the tight junction marker ZO-1
25
in DLD-1 spheroids. Confocal microscopy revealed that a layer of cells covers the spheroid surface, which express ZO-1 at the outward oriented cell surface (
Fig. 5H
), indicating polarization of this cell layer. ZO-1 was distributed over the entire spheroid surface, suggesting a tight layer of cells hindering resazurin uptake into the inner core of the spheroids. Staurosporine as well as EGTA, EDTA, and trypsin treatment disrupted these dense cell-cell contacts on the spheroid surface (
Fig. 5H
). HT29 spheroids displayed ZO-1 expression throughout the entire spheroid, whereas loose HCT116 (
The RR Assay Can Be Used to Distinguish Cytotoxic from Cytostatic Compounds in Cellular Screening Assays
The fact that the resazurin reduction is decreased in spheroids with functional tight junctions (as DLD-1 or HT29 spheroids) excludes a reliable quantitative measurement of viability or proliferation in response to anticancer drug treatment. However, this drawback at first glance opens a possibility to distinguish cytotoxic compounds from cytostatic or proliferation reducing compounds. We hypothesized that the first, which is accompanied by destruction of the tight cell-cell interactions, will lead to increased resorufin levels, whereas the latter will lead to decreased resorufin levels, because tight junctions remain intact and cell numbers decrease.
We tested this by screening HT29 and DLD-1 spheroids with the Prestwick Chemical Library (PCL) of 1200 Food and Drug Administration (FDA)–approved drugs in biological triplicates and taking the RR assay as the readout. Of those 1200 compounds, about three-fourths were ineffective, whereas about 10% each led to an increase or decrease in resorufin levels in the spheroid cultures (
Fig. 6A
). Effective compounds displayed similar responses in HT29 and DLD-1 spheroids (
Fig. 6B
). Indeed, compounds, which induced resorufin fluorescence, were spheroid destructive. The spheroids displayed variable size, loose morphology, and a dark appearance (
Fig. 6C
and
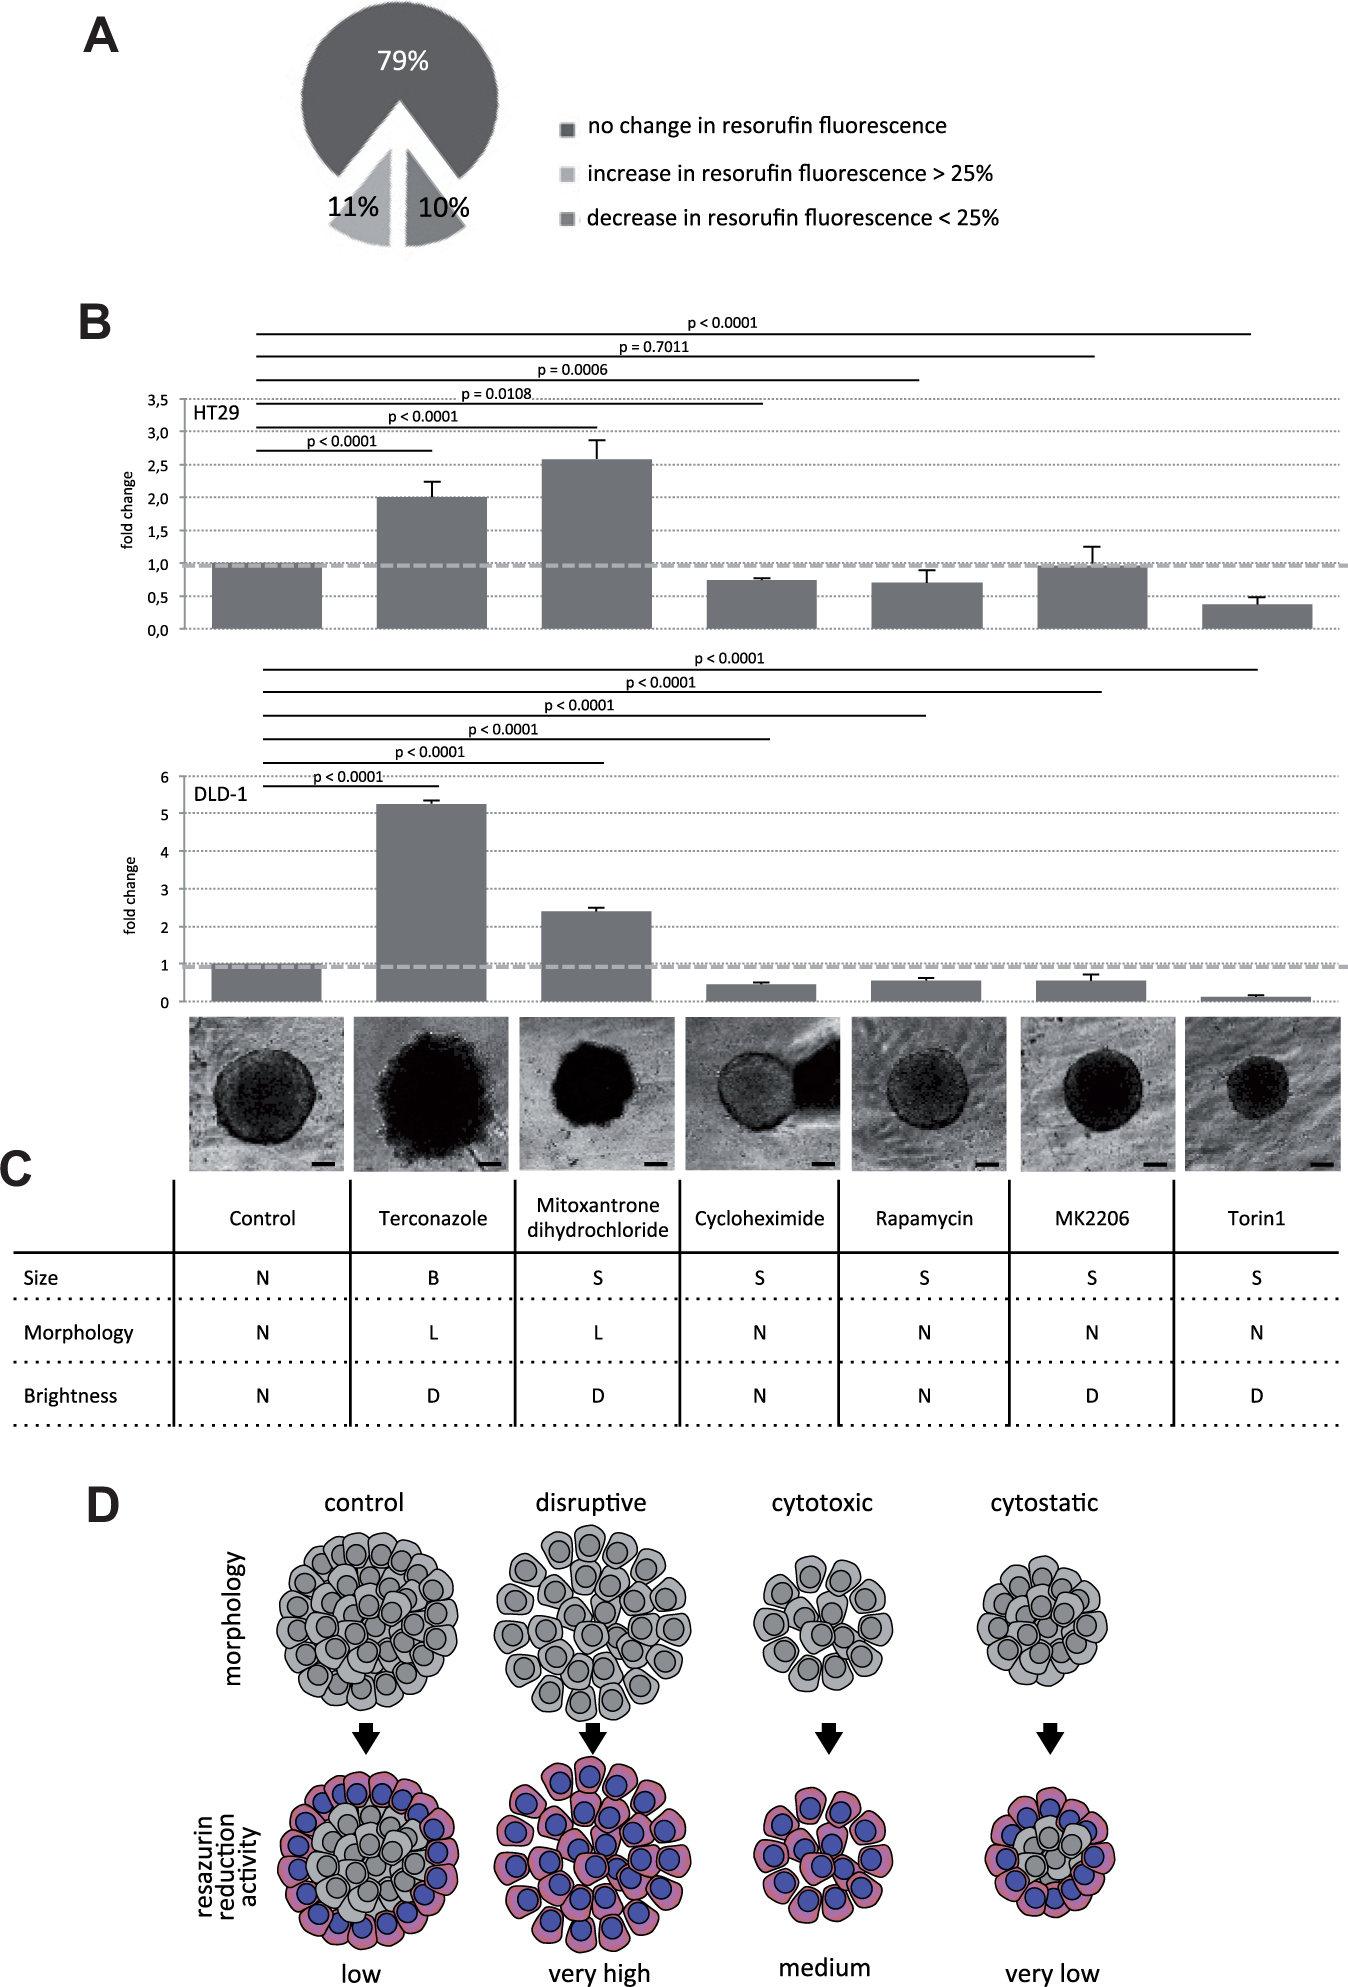
Distinction between cytotoxic and cytostatic compounds in cellular screening assays. DLD-1 and HT29 spheroids were screened with the Prestwick Chemical Library consisting of 1200 Food and Drug Administration–approved drugs. (
Discussion
Spheroid cellular screening assays are doubtlessly superior to conventional (2D) cell culture to determine drug responses in a more physiologic setting. Therefore, 3D cellular screening assays provide a promising tool to identify, select, and validate novel anticancer drugs in the preclinic. Established 2D assay systems reliably reflecting treatment responses have to be reevaluated to test the antiproliferative or cytotoxic effects of chemical compounds in 3D models. Here we have systematically analyzed the reliability of the RR assay, commercially available as the alamarBlue or CellTiter-Blue assay, to detect proliferation reduction or arrest and/or cytotoxicity in multicellular tumor spheroid models. The RR assay is widely used because it is cheap, highly sensitive, and nontoxic, and cells can be reused for other experiments after measurement. 13
We clearly demonstrate that the RR assay generates a nonreliable readout to indicate cytotoxicity without the prior knowledge of the tight-junction status of the cells comprising the spheroids. One intrinsic feature of spheroid formation is the establishment of close cell-cell interactions, mostly mediated via adherens junction proteins such as E-cadherin or N-cadherin. 26 Often, E-cadherin expression is highly induced upon spheroid formation (H. Dolznig, unpublished observations) in cell lines being low in E-cadherin expression in 2D. In addition, establishment of tight junctions can occur upon increasing polarization of epithelial cells in 3D. 27 We provide compelling evidence that establishment of tight junctions within or on the surface cell layer of DLD-1 and HT29 spheroids hinders resazurin to penetrate the spheroid core and as a consequence is reduced only by a limited number of cells (see Fig. 6D ). SW620 and HCT116 spheroids are loose cell aggregates and show a leaky phenotype in 3D. In line with our observations, it has been shown that tight junctions can be established in dense DLD-1 28 and HT29 29 cell layers in 2D, as determined by increased transepithelial electric resistance (TEER). An establishment of tight junctions in SW620 and HCT116 cells has never been reported. Functional tight junctions are dependent on Ca2+ present in adherens junctions. The chelating agent EGTA, which depletes the divalent cations from cadherins, disrupts cell-cell contacts and tight junctions24,30 without affecting cell viability. This allowed us to ultimately prove that indeed the tightness of the spheroids led to the very low resorufin levels in intact DLD-1 and HT29 spheroids. After EGTA induced leakiness, resorufin levels were induced to high values in the healthy spheroids, which was fully reversible by EGTA removal and Ca2+ readdition. Importantly, resorufin levels did not change in staurosporine-treated spheroids upon EGTA incubation, as these were already leaky by the drug treatment. Furthermore, EGTA-treated control spheroids produced significantly more resorufin than the staurosporine group. This was in perfect agreement with morphological observations, caspase activities, and ATP level measurements.
At first sight, these findings disqualify the RR assay as a reliable tool to indicate cell number and viability in multicellular spheroids. However, a single EGTA treatment for 45 min before RR measurement is sufficient to restore the expected correlation of cellular reduction activity and cell number/cell viability. This additional incubation step is even manageable in large screening attempts, where the RR assay might be the only choice because of its low costs. Here, a prior determination of spheroid tightness can be omitted.
However, if cells are used that form tight spheroids, the limitations of the RR assay may be used to gain additional information on the mechanism of action of certain drugs. This concept is illustrated in Figure 6D . As we have demonstrated, RR activity is low in healthy compact spheroids due to restricted penetration of resazurin into the spheroid. When a drug disrupts tight cell-cell interactions, this will result in augmented RR activity due to unlimited access of resazurin to all viable cells. A cytotoxic compound will destruct close cell-cell contacts in combination with decreased cell survival, which will lead to reduced RR activity compared with the above-mentioned disruptive drugs. It remains to be proven that a clear distinction between these two conditions can be made. However, cytostatic drugs, which affect only cell proliferation without interfering with cell-cell contacts, can be clearly distinguished from toxic or disruptive compounds. This is possible because of the diminished effect on RR activity compared with untreated controls. Fewer cells in a tight spheroid simply reduce less resazurin (see Fig. 6D ). The feasibility of this concept has been proven with the Prestwick Chemical Library in two cell lines. Notably, the RR assay can be easily combined with ATP-dependent luciferase assays in a multiplex setup. Therefore, we conclude that the RR assay is a valuable tool for spheroid screening assays with bonus readout, if performed in a controlled fashion.
Footnotes
Acknowledgements
We thank Sarah Schweighofer for critically reading the manuscript.
Declaration of Conflicting Interests
The authors declared no potential conflicts of interest with respect to the research, authorship, and/or publication of this article.
Funding
The authors disclosed receipt of the following financial support for the research, authorship, and/or publication of this article: This work was supported by the “Niederösterreichische Forschungs- und Bildungsges.m.b.H” (DSP, HD) and the Herzfelder Family Foundation (HD). Angelika Walzl is a recipient of a DOC Fellowship of the Austrian Academy of Sciences at the Institute of Medical Genetics, Medical University of Vienna.
References
Supplementary Material
Please find the following supplemental material available below.
For Open Access articles published under a Creative Commons License, all supplemental material carries the same license as the article it is associated with.
For non-Open Access articles published, all supplemental material carries a non-exclusive license, and permission requests for re-use of supplemental material or any part of supplemental material shall be sent directly to the copyright owner as specified in the copyright notice associated with the article.