
Abstract
The NCI60 cell line panel screen includes 60 human tumor cell lines derived from nine tumor types that has been used over the past 20+ years to screen small molecules, biologics, and natural products for activity. Cells in monolayer culture in 96-well plates are exposed to compounds for 48 h, and Sulforhodamine B is used to determine cell viability. Data analysis tools such as COMPARE allow classification of compounds based on the pattern of cell line response. However, many compounds highly active in monolayer cell culture fail to show efficacy in vivo. Therefore, we explored 3D culture of the NCI60 panel as a strategy to improve the predictive accuracy of the screen. 3D cultures more closely resemble tumors than monolayer cultures with tighter cell-cell contact and nutrient and oxygen gradients between the periphery and the center. We optimized the NCI60 cell line panel for generating 3D spheroids of a prespecified diameter (300–500 µm) in ultra-low attachment (ULA) plates. Spheroids were classified into four categories based on imaging, and concentration response of select agents in 2D and 3D models is presented.
Introduction
Many companies and academic laboratories have focused their efforts on the discovery of small-molecule therapeutics to target cancer cells and provide a therapeutic benefit to cancer patients. To assist in the identification of small molecules from synthetic libraries or natural extracts, the National Cancer Institute (NCI) established the NCI60 cell panel screen to examine compound effect on cell viability. Over the past 20+ years, compounds submitted by investigators have been screened against this panel of 60 human tumor cell lines derived from nine tumor types.1–3 A compound is first tested at a single concentration and then, if the compound is active, it is tested in a 5-point concentration response. The NCI60 cell lines have been well characterized for gene/microRNA (miRNA) expression,4–8 mutations, DNA methylation, 9 and protein expression.6,10,11 The information provided from compound structure–activity relationship (SAR) studies in the screen allowed the development of a computational tool to identify mechanism(s) of action for unknowns using COMPARE—a software program that evaluates the similarity between mean graph patterns. 12 Several active anticancer compounds have been identified by the NCI60 screen.12–14
Unfortunately, the success rate for compounds that have moved forward through preclinical testing from the NCI60 cell line screen, as well as many other cell-based screens, has been very low. 15 The question is, can cell lines and cell line assays be developed with better predictive accuracy for in vivo efficacy? In the search for more predictive cell-based models, there is interest in mimicking the structure of tumors in cell culture assays. The goal was to develop 3D cell structures (spheroids) and use these in cell-based screens.
3D multicellular spheroid models have been studied for over four decades but only now are being considered for cell-based high-throughput screening (HTS) due to the recent availability of hardware, consumables, and reagents to support inexpensive growth and analysis of multicellular spheroids exposed to various test compounds.16–22 Spheroids have been demonstrated to be more representative of the tumor structure and microenvironment than monolayer cell cultures. 23 As a result of a tissue-like architecture, some spheroid models have lower sensitivity to chemotherapeutic drugs than the same cells in monolayer culture.16,21–25 Since the NCI60 cell line panel has been well characterized, there is a wealth of experimental data from 20+ years of screening using these cells as monolayers in culture.1–3,12–14 The NCI60 cell line panel provides a valuable tool to address the question of whether using 3D spheroid architecture in place of 2D cultures will improve the success rate of in vivo evaluation.
This report describes the results of our examination of the NCI60 lines as spheroids and their sensitivities to various small molecules. We provide information on optimal cell densities and conditions for spheroid assays using the NCI60 cells, allowing rapid application of these models to screening.
Materials and Methods
Cell Lines
Cell lines were obtained from the NCI repository working stocks and were maintained in monolayer cultures in flasks incubated at 37 °C in a 5% CO2/>90% humidity environment until used in these experiments. All cells were maintained in RPMI 1640 (Life Technologies, Gibco, Gaithersburg, MD) containing 5% Fetal Bovine Serum (FBS; Life Technologies, HyClone, Logan, UT). Cells were split weekly or when approaching 80% confluence within the flasks.
Spheroid Generation
To make multicellular spheroids, a number of technologies, including hanging drop plates and various scaffolds, can be employed.16–20 However, the methods presented here used 96-well ultra-low attachment (ULA) plates from Corning (Corning, Corning, NY). These plates are U-bottomed microtiter plates in which each well is chemically treated to reduce the ability of cells to adhere to the plastic and hence promote cell-cell adhesion to form the spheroids. The wells are transparent, thus allowing imaging of the spheroids through the bottom of the plate.
At the initiation of an experiment, cells were seeded into the 96-well ULA plates at the densities indicated and allowed to incubate for 48 to 72 h in order for spheroids to form ( Table 1 ). The cells were seeded in RPMI media containing 10% fetal bovine serum (FBS) in a volume of 190 µL per well. To determine the optimal seeding density in these plates for each cell type, the growth rate of the spheroids from varying starting densities was monitored. These studies ensured that the spheroid size did not exceed imaging capabilities during the time course of the experiment. Varying cell densities were dispensed into the ULA plates using handheld multichannel pipettors.
Seeding Densities and Morphological Characteristics for NCI60 Cells in 3D Compared to 2D Formats.
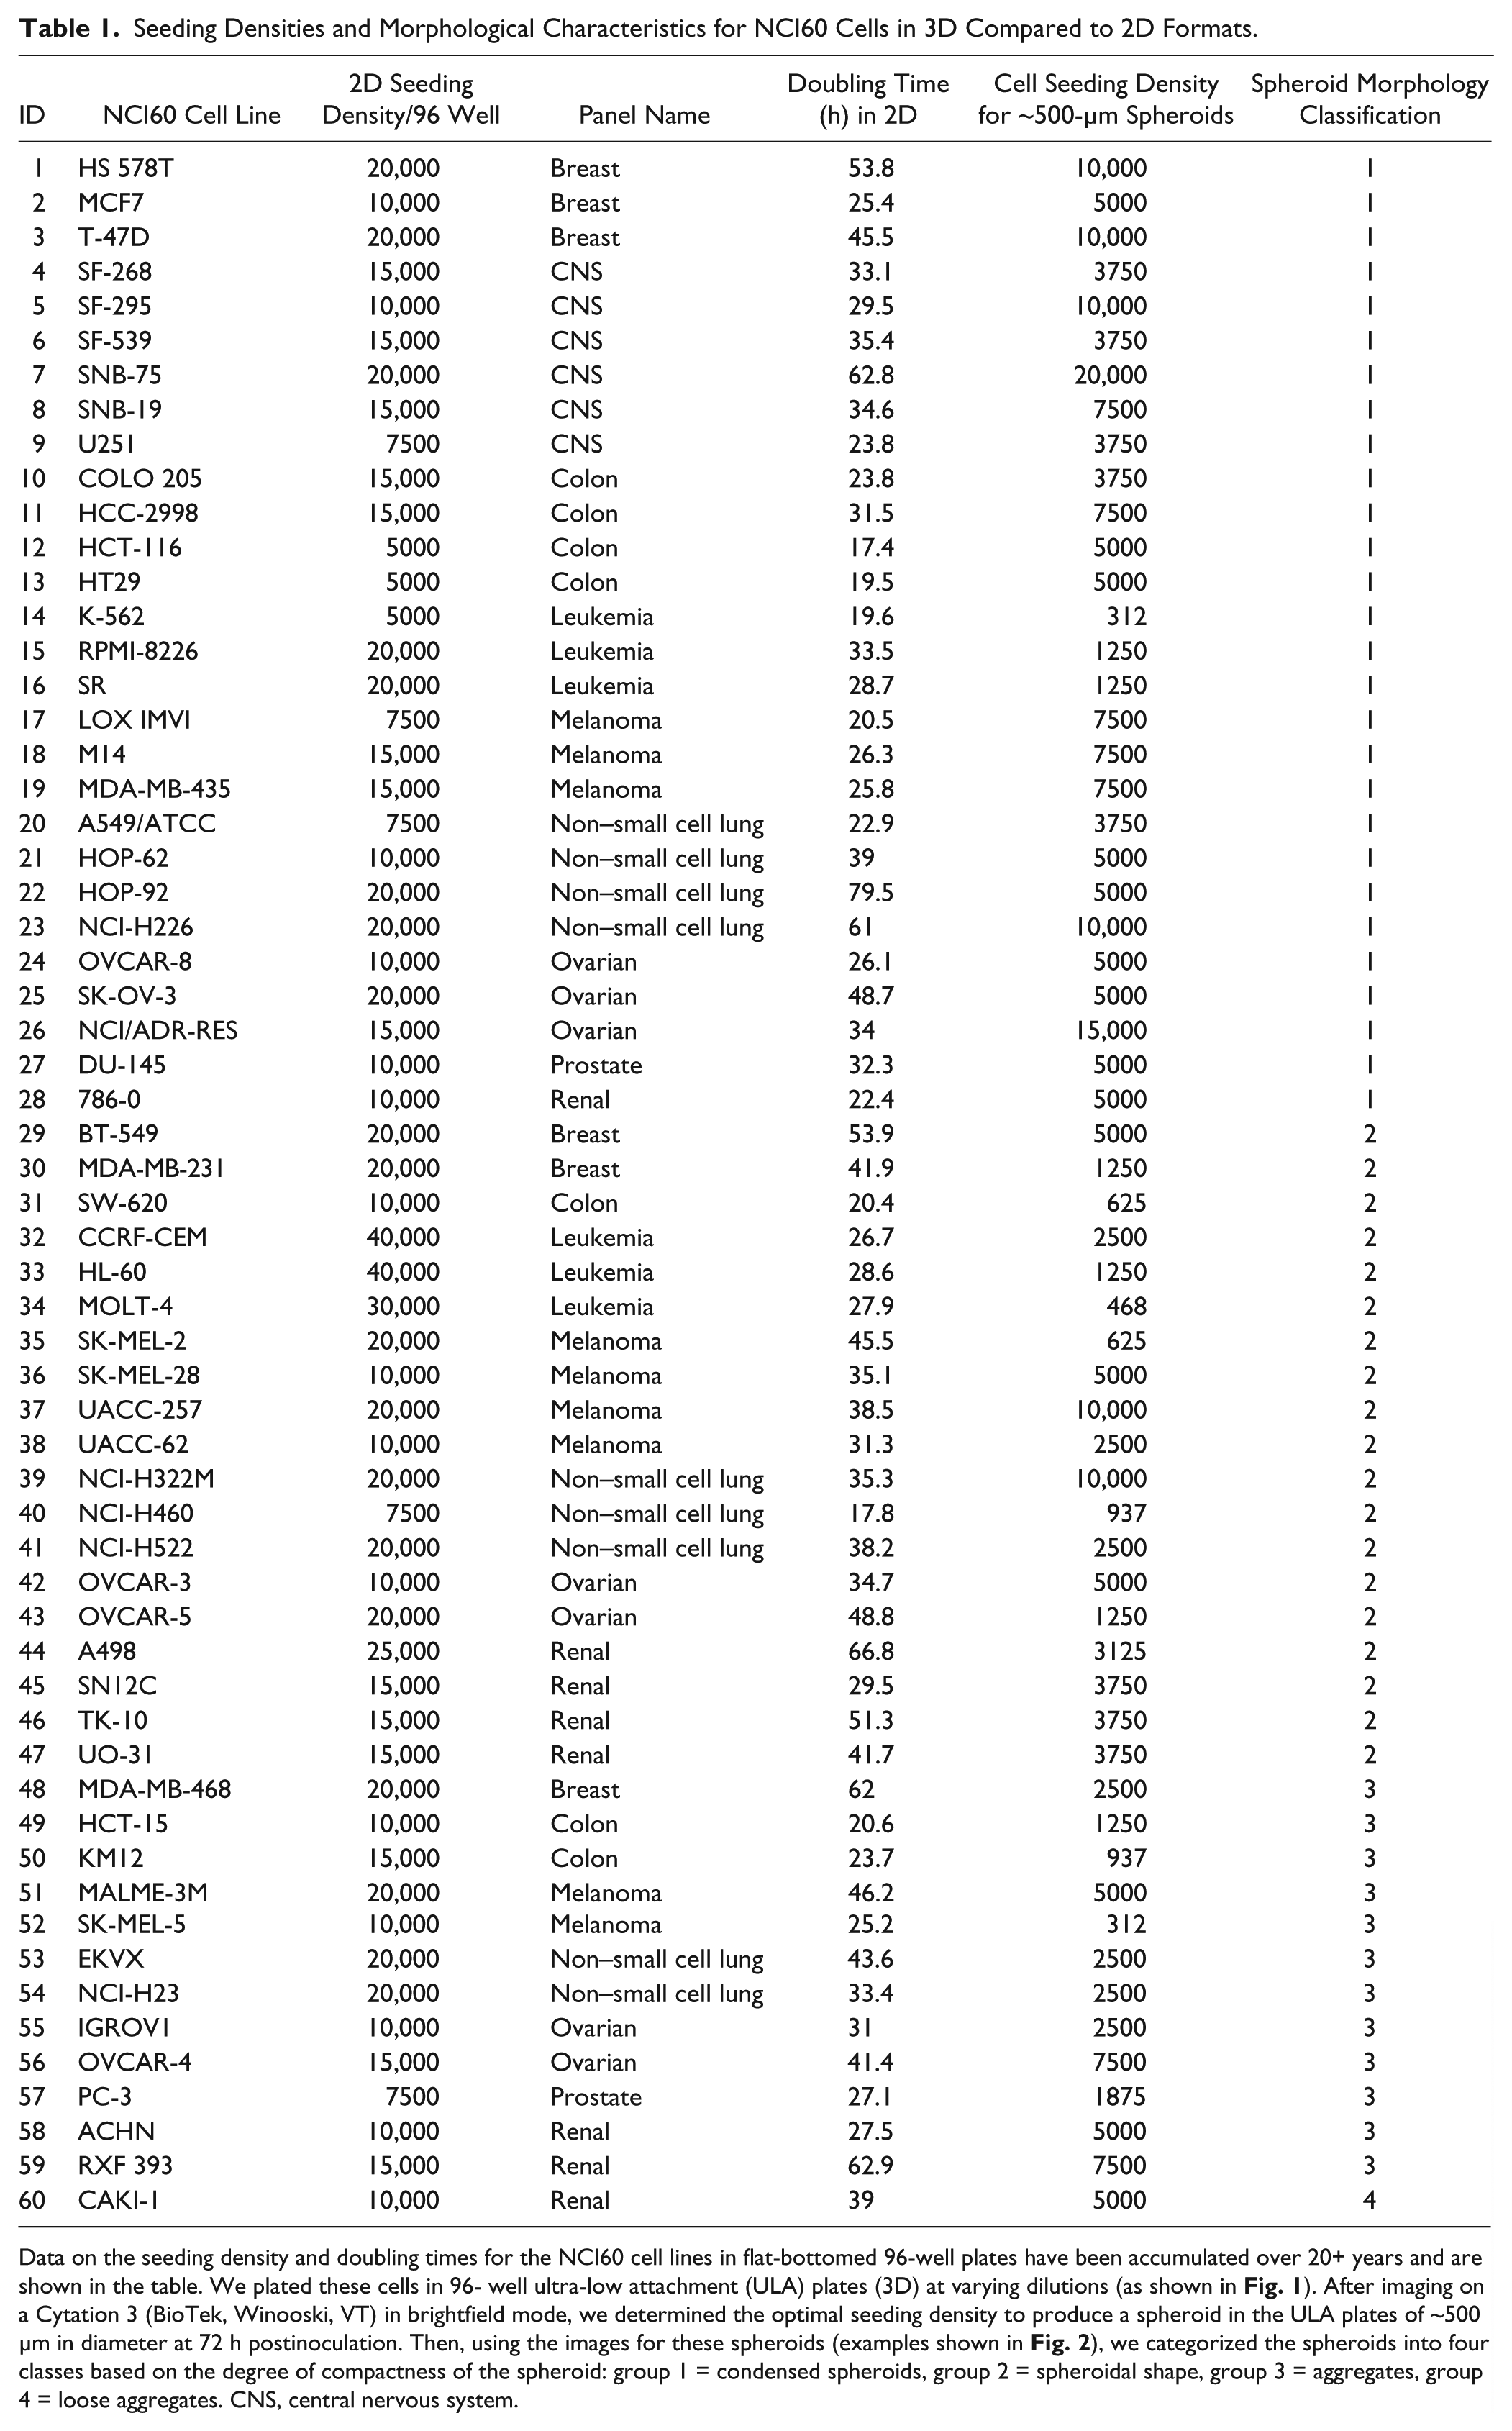
Data on the seeding density and doubling times for the NCI60 cell lines in flat-bottomed 96-well plates have been accumulated over 20+ years and are shown in the table. We plated these cells in 96- well ultra-low attachment (ULA) plates (3D) at varying dilutions (as shown in Fig. 1 ). After imaging on a Cytation 3 (BioTek, Winooski, VT) in brightfield mode, we determined the optimal seeding density to produce a spheroid in the ULA plates of ~500 µm in diameter at 72 h postinoculation. Then, using the images for these spheroids (examples shown in Fig. 2 ), we categorized the spheroids into four classes based on the degree of compactness of the spheroid: group 1 = condensed spheroids, group 2 = spheroidal shape, group 3 = aggregates, group 4 = loose aggregates. CNS, central nervous system.
Compounds Tested
Compounds were serially diluted in DMSO from a 10-mM stock concentration and then further diluted by adding to RPMI media (10% FBS) such that the targeted final concentrations would be achieved and the final DMSO concentration in the assays remained below 0.2% v/v. To examine the response of the spheroids to treatment with various compounds as models of therapeutic agents, media containing test compounds were added to the spheroid cultures 72 h after seeding. Compounds were added in a volume of 6 µL per well using a Tecan EVO 96 channel dispenser fitted with 50-µL tips (Zymark, Hopkinton, MA). Drug substances were obtained from the Developmental Therapeutics Program (DTP) repository. The ATR inhibitor VE-821 (NSC761070) was also obtained from the DTP repository.
Spheroid Imaging
Spheroids were imaged using brightfield imaging on a Cytation 3 high-content imaging system (BioTek, Winooski, VT) equipped with a 4× objective. Images were captured digitally.
Live/dead spheroid staining was performed using a kit from Life Technologies consisting of Calcein AM dye (monitored in the green channel) to identify live cells and ethidium homodimer (monitored in the red channel) to identify dead cells. The kit was used according to the manufacturer’s instructions. The spheroids were imaged on the Cytation 3 in fluorescence mode using the red/green fluorescence excitation and emission filters.
Viability Measurement in Spheroids
CellTiter-Glo (CTG; Promega, Madison, WI) was used to quantify adenosine triphosphate (ATP) from cells grown in 2D, and CellTiter-Glo 3D (CTG3D; Promega) was used to determine ATP from spheroids. In the 2D assay, CTG (20 µL per well) was added to the cells in the 96-well plates, and the plates were shaken for 2 min at 420 rpm on a Teleshake microplate shaker (Thermo Fisher Scientific, Waltham, MA) and then read on an Enspire multifunction plate reader equipped with enhanced luminescence reading capabilities (PerkinElmer, Waltham, MA). For the spheroid measurements, the CTG3D was used per the manufacturer’s instructions. In total, 50 µL CTG3D was added to each ULA well, and the plates were shaken on the Teleshake shakers (420 rpm/2 min) and then incubated at room temperature for 10 to 30 min prior to reading luminescence on an Enspire plate reader.
Data Processing
Data from the Cytation 3 and Enspire readers were exported to Microsoft Excel (Microsoft Corp., Redmond, WA) for analysis using custom templates for determination of IC50 and statistical variation.
Spheroid Capture, Sectioning, and Staining
Human HT29 colon carcinoma multicellular spheroids were seeded at densities to yield ~500-µm spheroids after 72 h in 96-well ULA plates (5000 cells per well). Media were added to control wells and topotecan added to test wells at a final concentration of 0.1 µM, 1 µM, or 10 µM. At 24 h and 72 h posttreatment, the spheroids were transferred to a 50-mL conical tube (48 spheroids per tube) and allowed to sediment under gravity. Media were removed and replaced with 10% neutral buffered formalin (NBF; Sigma-Aldrich, St. Louis, MO). Cells were incubated overnight and then paraffin embedded and sectioned onto microscope slides prior to staining and imaging.
γH2AX-IFA
The paraffin-embedded sections were stained with hematoxylin and eosin (H&E) to identify those with suitable spheroid sections, and closely adjacent sections were stained with the nuclear stain DAPI (blue channel) and a fluorescent-labeled antibody against γH2AX (green channel). The sections were imaged on an Aperio Scanscope FL (Leica Biosystems, Buffalo Grove, IL). Slides were scanned with a 20× objective under constant illumination and exposure across all slides.
Results
Cells from the NCI60 cell panel were seeded in 96-well ULA U-bottomed plates at varying cell densities. Imaging the spheroids on a Cytation 3 imager, the cell seeding density that produced ~500-µm diameter spheroids after a 72-h incubation was determined. Images from two cell lines seeded at varying densities and imaged at 72 h are shown ( Fig. 1 , bottom panel). CellTiter-Glo 3D was used to measure cell viability in spheroids of different sizes ( Fig. 1 , top panel). At the highest seeding density for MCF7 cells, a compact spheroid with a darker center formed. Most other cell line spheroids did not have this characteristic at the same seeding density and time point.
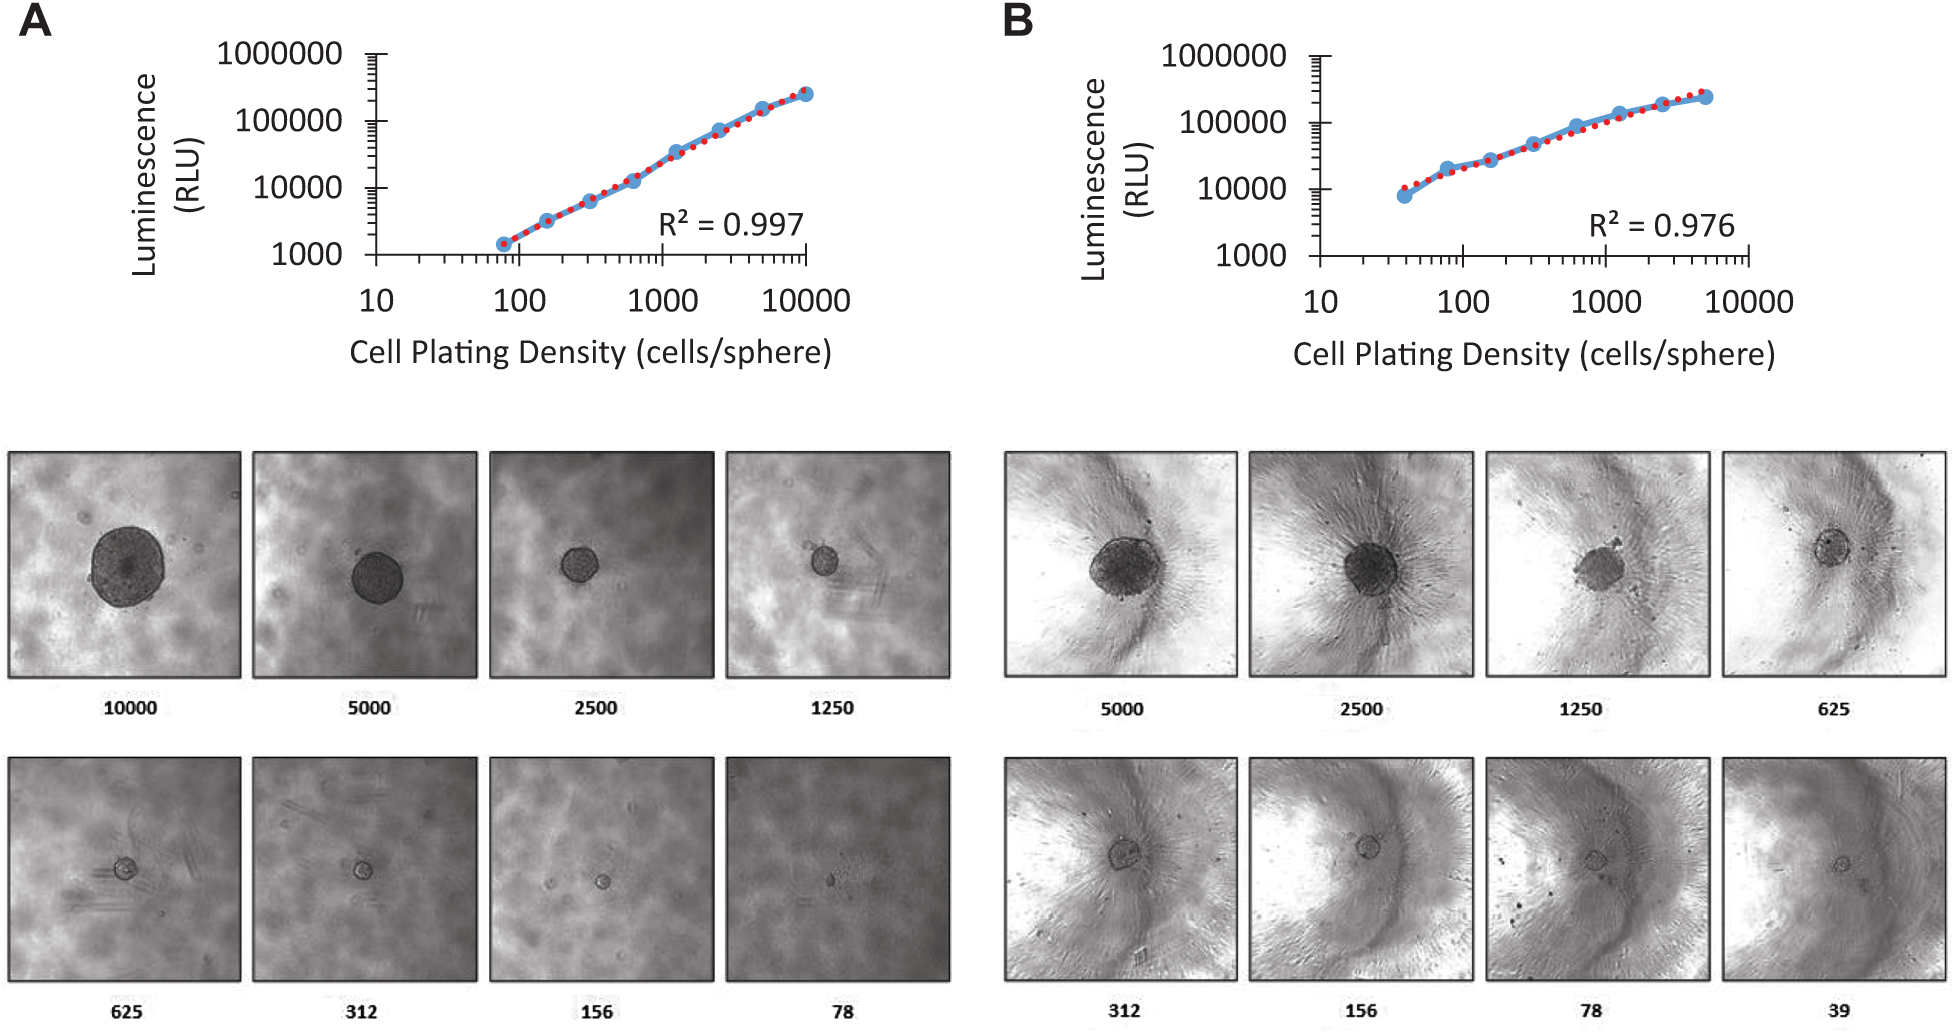
Representative spheroid images from cell dilution series. Cells were seeded in 96-well ultra-low attachment plates at twofold serial dilutions to provide seeding densities from 10,000 to 78 cells per well (
From the images obtained, the spheroids were classified into four groups based on the degree of intercellular adhesion. Examples of images from each of the nine tumor types represented in the NCI60 panel are shown ( Fig. 2 ). The four groups are as follows: group 1—condensed spheroids—appeared as tight round spheres with a smooth and even periphery. Examples included MCF7 and HT29 cell lines. Notably, all central nervous system (CNS) cell lines were classified in group 1. Group 2—spheroidal (not condensed)—appeared as generally rounded spheroids but with a rougher-appearing perimeter. Examples include MDA-MB-231 and NCI-H460 cells. Group 3—aggregates—appeared as clumped cells that could be individually discriminated, with highly irregular outer perimeters. Examples include MDA-MB-468, PC-3, and SK-MEL5 cells. Group 4—loose aggregates—appeared as very small numbers of cells in a highly irregular shape. The only cell line in this group was the renal line, CAKI-1.
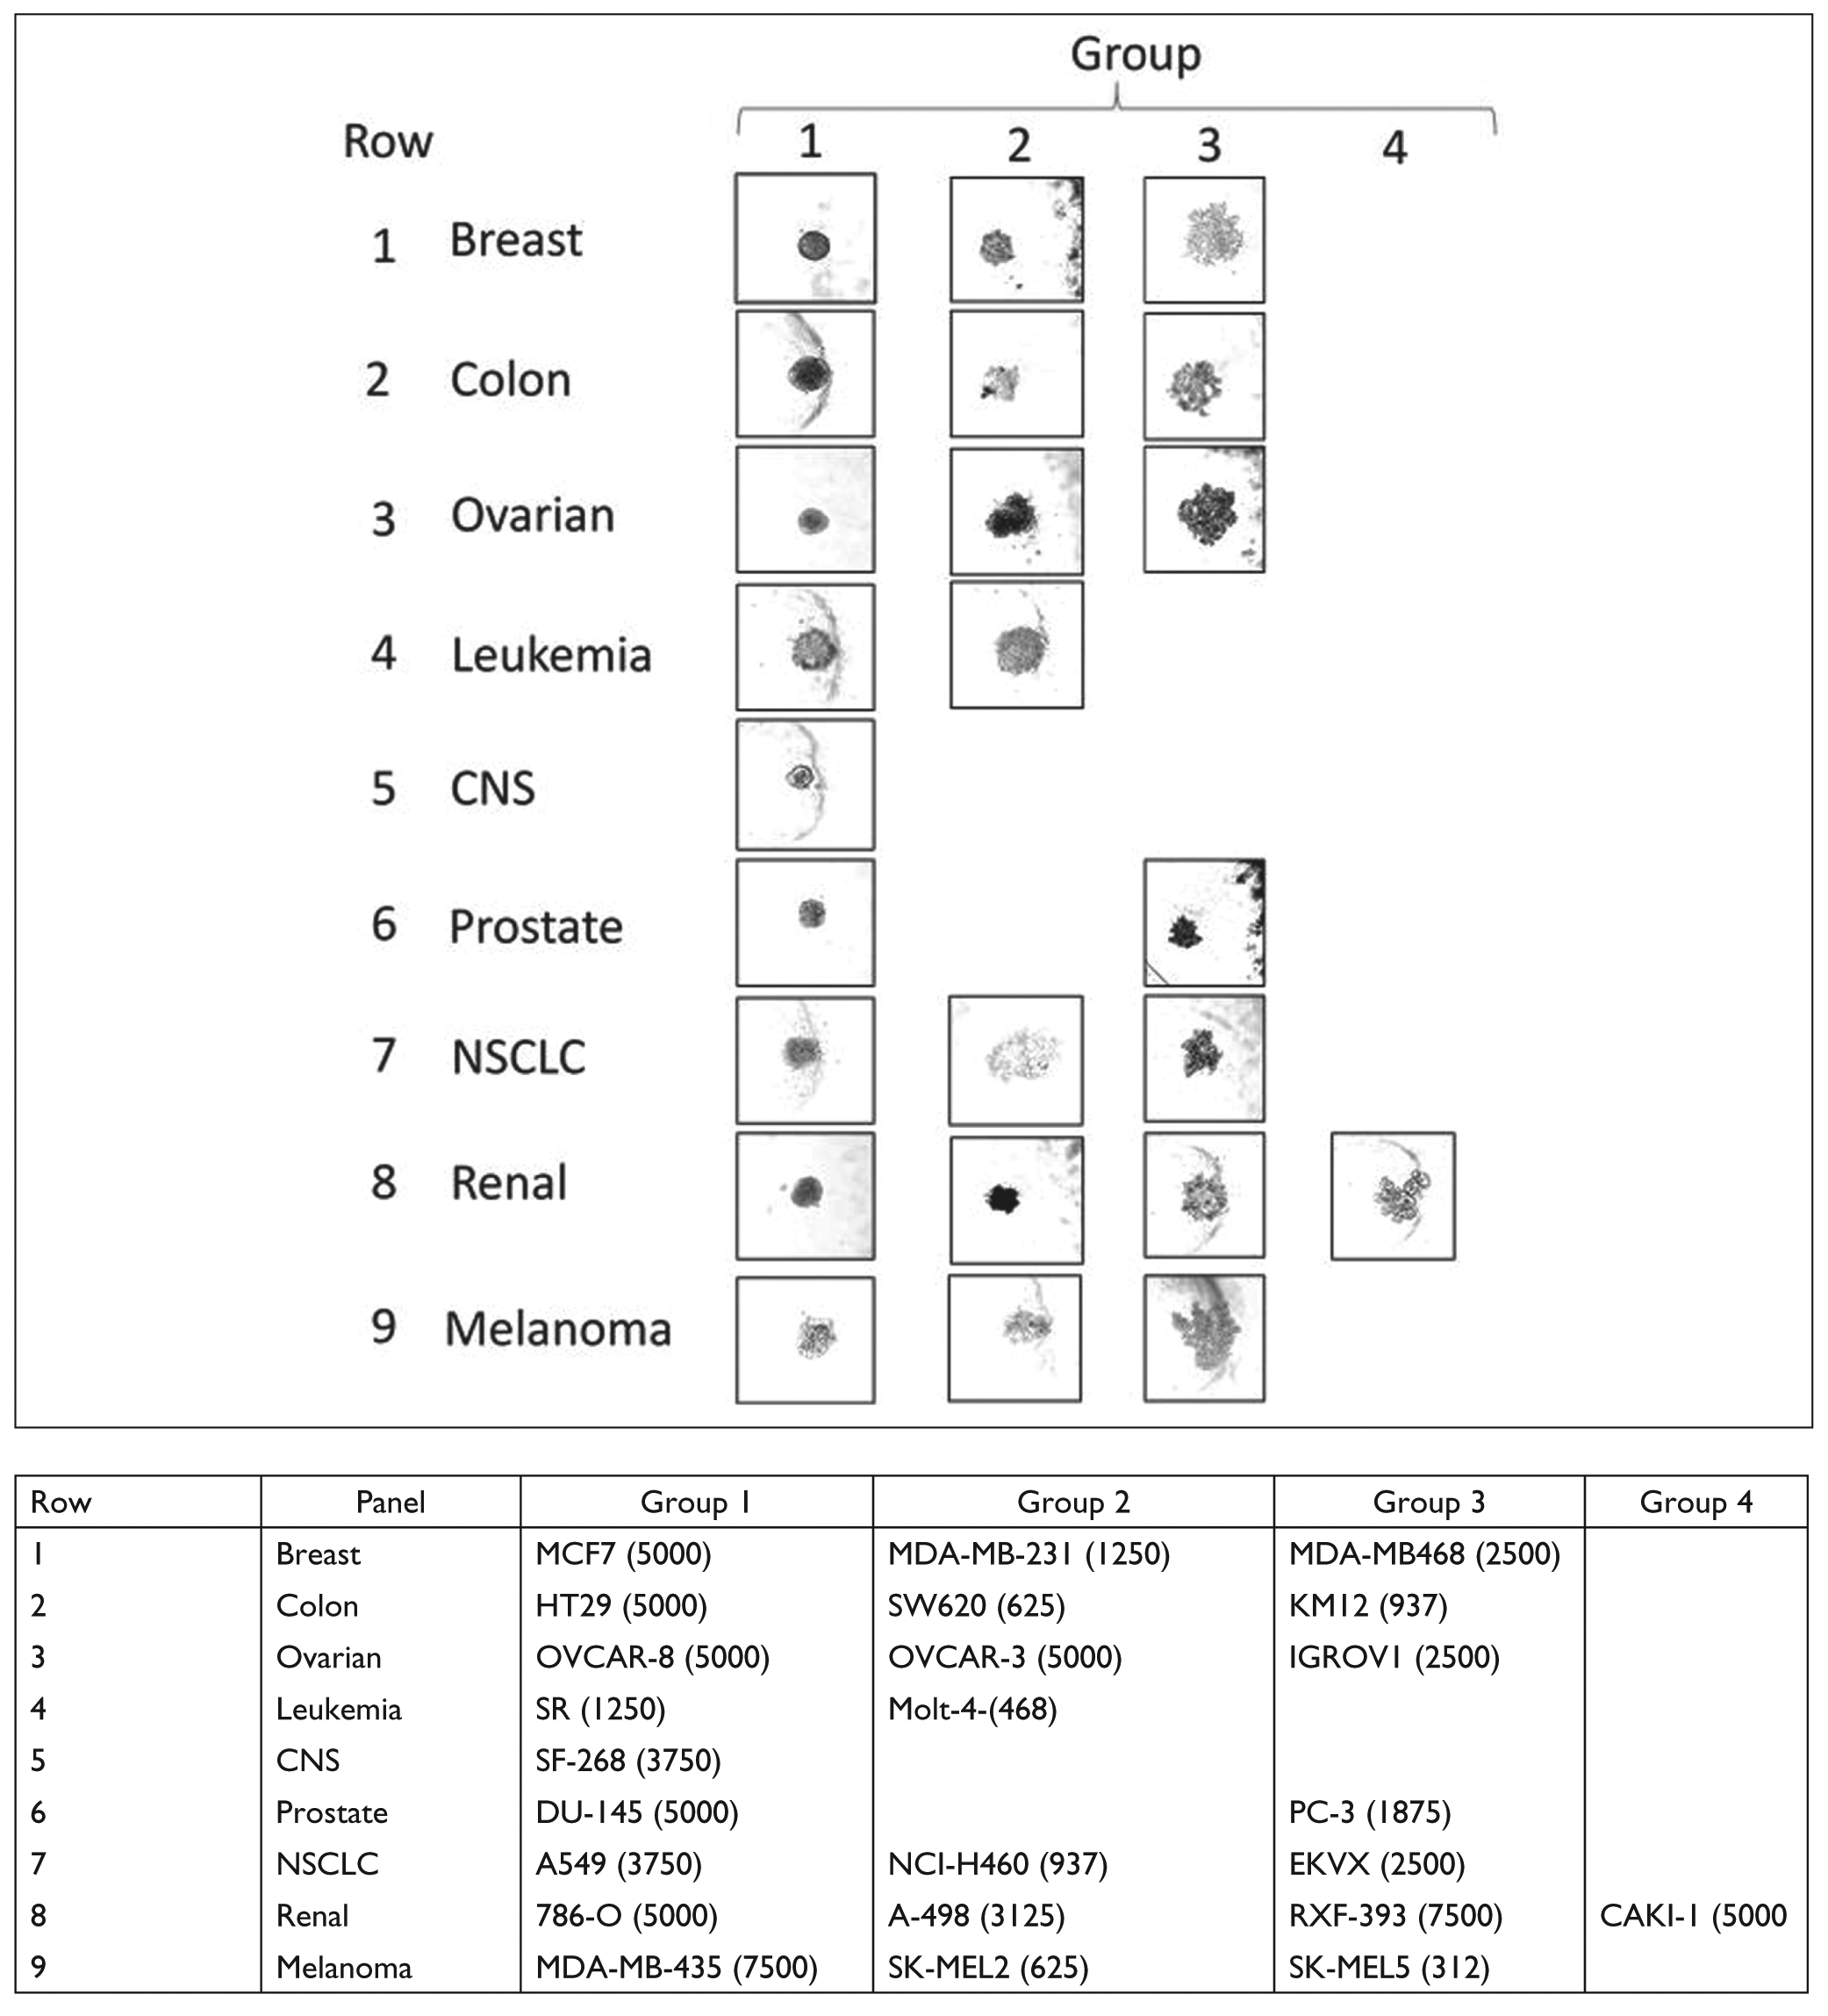
Cell morphologies and spheroid classification. Cell images are aligned as shown in the table. Cells were seeded in 96-well ultra-low attachment (ULA) plates (Corning, Corning, NY) at the densities indicated in parentheses in the legend such that the spheroid formed would be ~500 µm in diameter after 72 h in culture. Images were obtained using brightfield on a Cytation 3 imaging reader equipped with a 4× objective (BioTek, Winooski, VT). Images were then sorted into four groups based on spheroid morphology: group 1 = condensed spheroids, group 2 = spheroidal (not condensed), group 3 = aggregates, and group 4 = loose aggregates. Images shown are representative examples of the nine tumor types represented in the NCI60 panel categorized based on their classification into the four groups. Where there is no image, we were not able to identify a cell line in the tumor type that matched that classification.
Using the categories from Figure 2 and the optimal seeding densities that produced ~500-µm spheroids, the key metrics for the NCI60 cell line growth as spheroids were developed ( Table 1 ). Table 1 includes the optimal seeding density used in the 96-well monolayer culture assay, the cell doubling times in monolayer culture, and the optimal seeding densities in 96-well ULA plates to obtain ~500-µm spheroids at 72 h as well as the classification of the resultant spheroid based on morphology.
Some reports have indicated that spheroids are less responsive to drug treatment than the same cells grown in monolayer. 22 To explore the compound response of a 3D culture, the human HT29 colon carcinoma cell 3D culture was exposed to topotecan at three concentrations (0.1, 1, and 10 µM) for varying times (0–72h), and CTG3D was used to determine viability. There was a time- and concentration-dependent decrease in the viability of the cells in the spheroid ( Fig. 3A ). For comparison, HT29 cell monolayers were exposed to topotecan. Cell viability determined after 72-h exposure indicated that the spheroid cultures were less responsive to the compound than 2D cultures (~10× shift in IC50 value) ( Fig. 3B ).
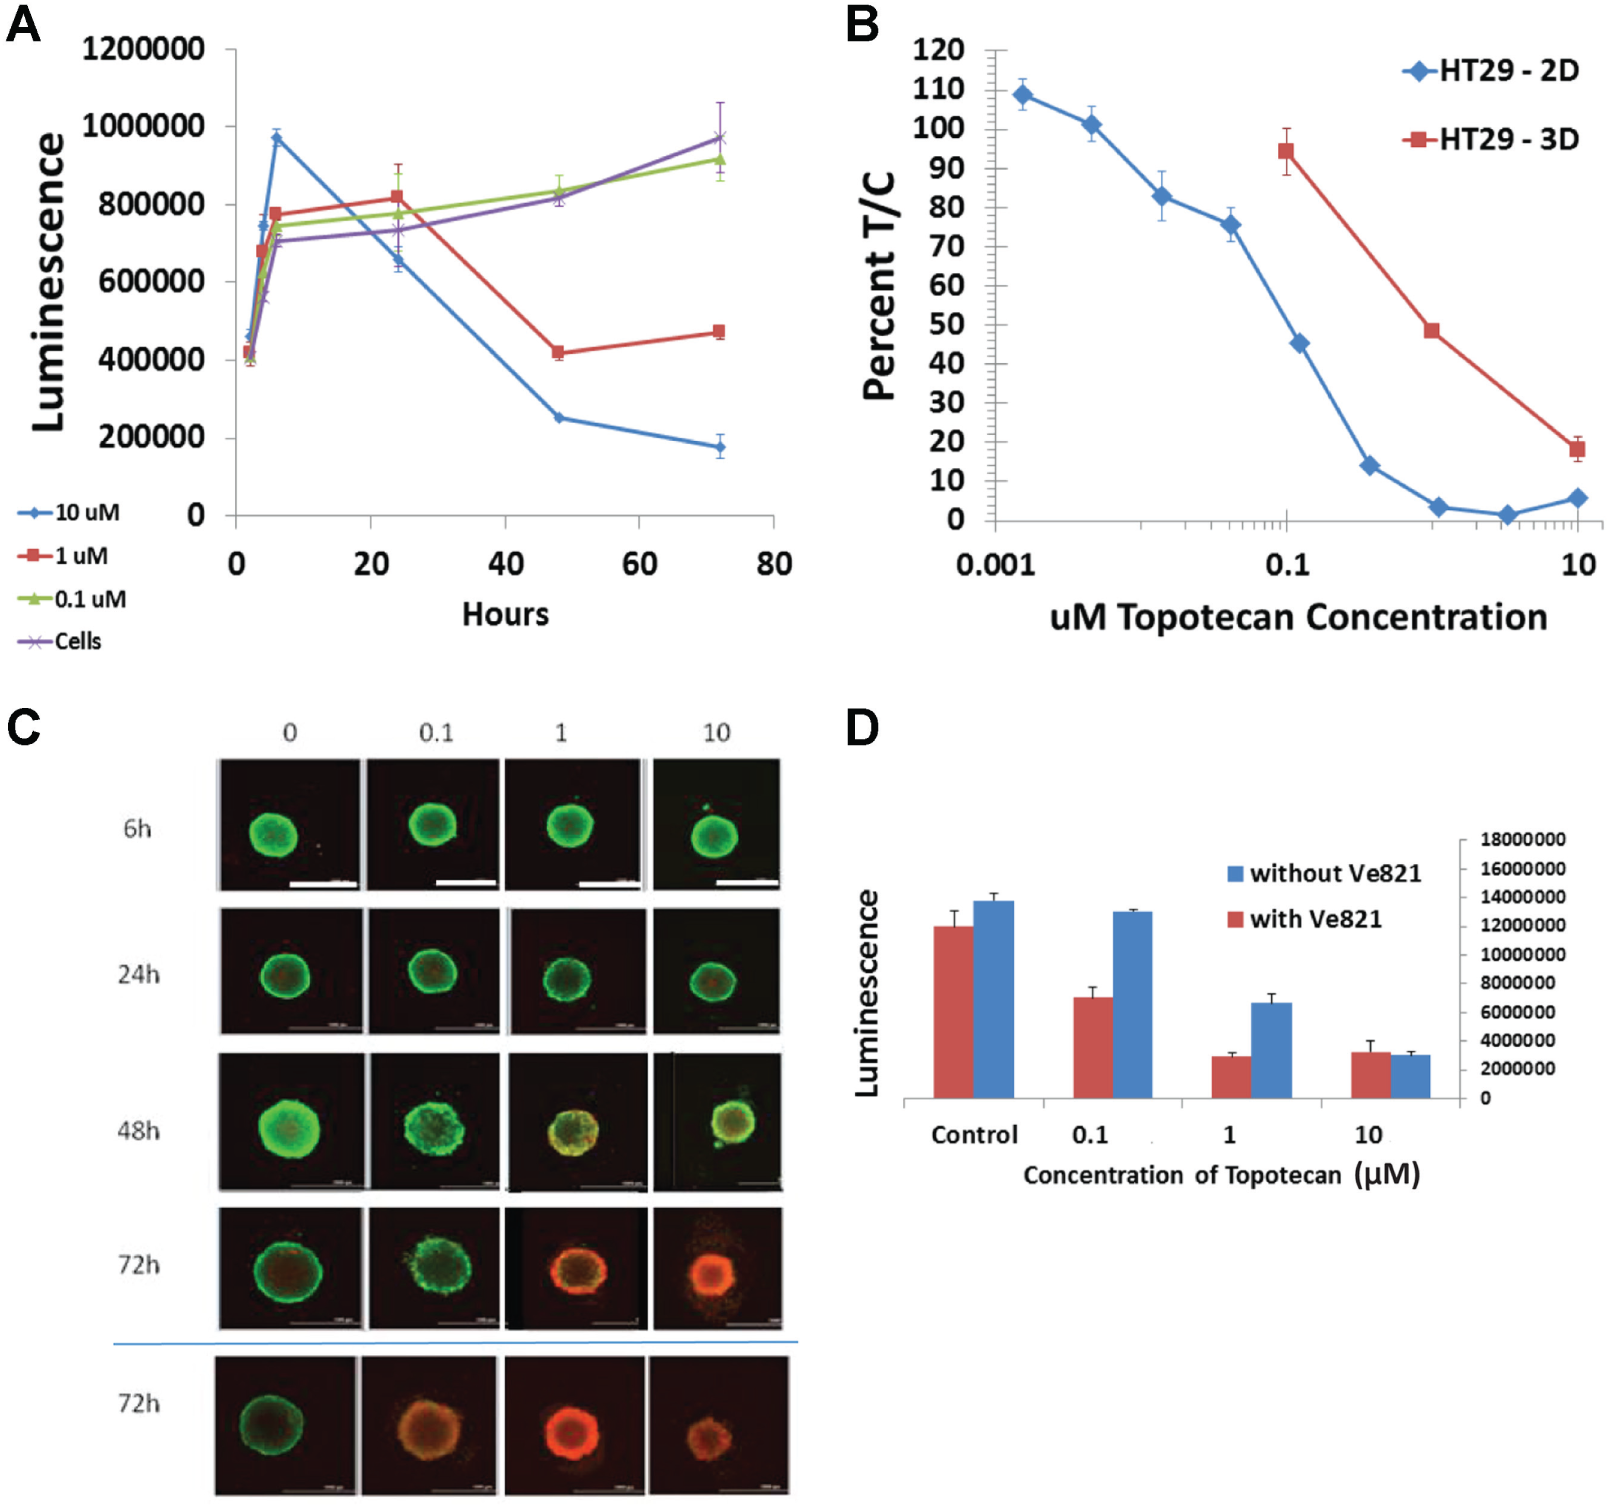
Sensitivity to drug treatment. (
In parallel experiments, live/dead cells in 3D cultures were quantified using the live/dead assay from Invitrogen (Carlsbad, CA). HT29 spheroids were exposed to three topotecan concentrations (0.1, 1, and 10 µM) for varying times (6, 24, 48, and 72 h) ( Fig. 3C ). Spheroids were then stained and imaged on a Cytation 3 imaging system. The images show a concentration- and time-dependent increase in dead cells induced by topotecan exposure with a slight reduction in spheroid size seen at higher topotecan concentrations and at time points beyond 24 h. There was an increase in dead cells when 1 µM of the compound VE821, an ATR inhibitor, was added to topotecan treatment ( Fig. 3C ). In parallel, the viability of the cells was determined using CellTiter-Glo 3D. The CellTiter-Glo 3D luminescence values were similar to the imaging results using the live/dead assay ( Fig. 3D ).
Diminished drug response was observed with several other NCI60 cell lines when grown as spheroids; for example, A549 human non–small cell lung carcinoma cell spheroids were less responsive to doxorubicin than the same cells grown in monolayer culture ( Fig. 4 , left panel). However, decreased response did not occur with all compounds in spheroids compared to their monolayer cultures. For example, the Wee-1 inhibitor MK1775 and carboplatin were equally cytotoxic toward A549 cells in 2D and 3D cultures ( Fig. 4 , middle and right panels).
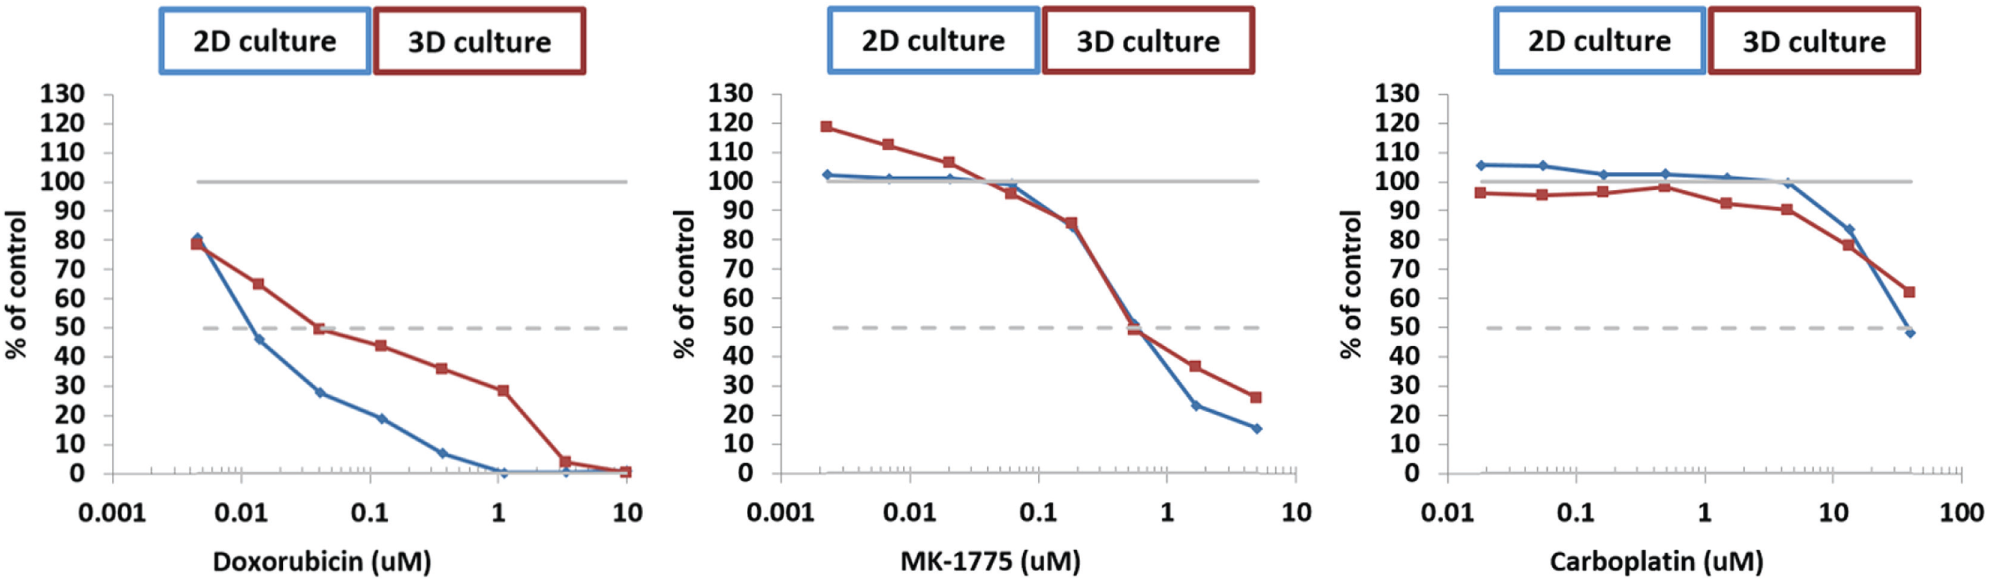
Drug sensitivity in 2D vs. 3D. Sensitivity to compound treatment in select NCI60 cells as monolayers (2D culture) and spheroids (3D culture) was determined using CellTiter-Glo or CellTiter-Glo 3D, respectively (as in Fig. 3B ). Data show the effects of three compounds on A549 cells exposed to compounds for 72 h. Left panel, doxorubicin; middle panel, MK1775; right panel, carboplatin. At the end of the drug exposure period, reagents were added, and plates were shaken and then incubated as per the manufacturer’s instructions. Luminescence was measured on a PerkinElmer (Waltham, MA) Enspire reader. Values are percentage of control (no drug treatment in each cell model) ± standard deviation for four replicates per data point. Dotted horizontal line represents 50% inhibition.
Topotecan (and other topoisomerase 1 inhibitors) are known to produce a rapid increase in γH2AX in response to DNA double-strand breaks induced by the compound(s).26–30 In spheroids of human HT29 colon carcinoma cells exposed to topotecan and then fixed, paraffin embedded, sectioned, and stained, we observed both a time- and concentration-dependent increase in the appearance of γH2AX ( Fig. 5 ).
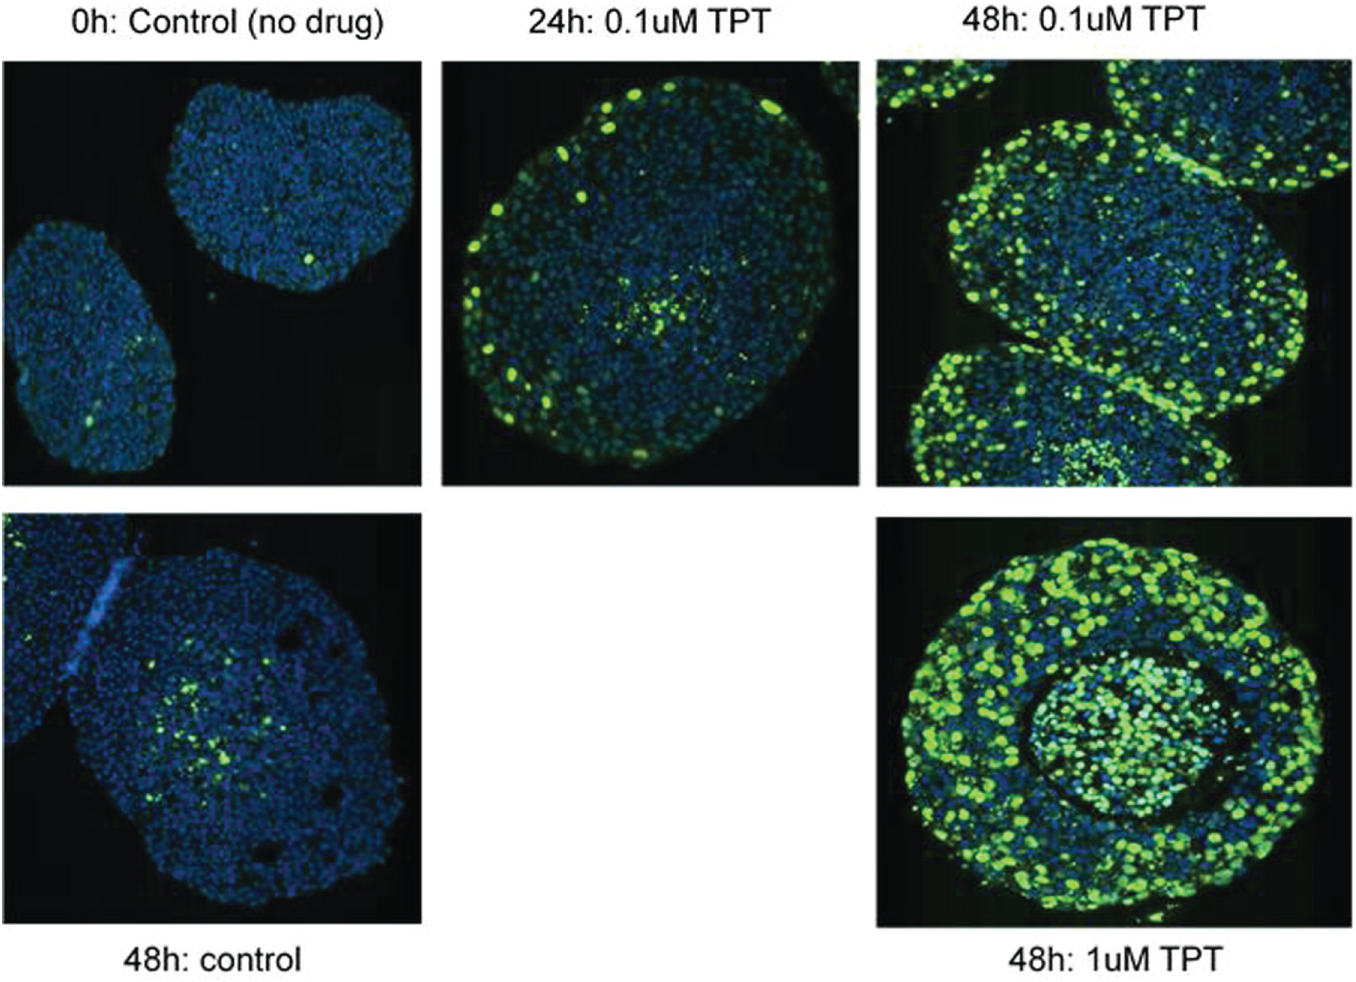
Use of spheroids to look at biomarkers of drug response. Spheroids of HT29 cells in 96-well ultra-low attachment plates (generated as in Materials and Methods, one spheroid per well, 48 replicates each condition) were exposed to topotecan (TPT) at the doses and times indicated. After drug exposure, the spheroids from all replicates (48) were captured, fixed (10% neutral buffered formalin), paraffin embedded, sectioned, and stained. Sections containing multiple spheroids from each treatment were stained with DAPI (nuclear stain; blue) and with a fluorescent-labeled antibody against γH2AX (green). Upper row: control (no drug exposure) and after 24-h and 48-h exposure to 0.1 µM topotecan. Lower row: control (no drug) and after 48-h exposure to 1 µM topotecan.
Discussion
Spheroids for Drug Discovery
Rationale for generating spheroids of NCI60 cells
In an assay performed over the past 20+ years by the NCI in the quest for better therapeutics, the NCI60 cell line panel has been a valuable resource in screening small-molecule compounds for cytotoxicity.1–4,11–14 A wealth of information on the relative sensitivity of these 60 human tumor cell lines derived from nine tumor types to test compounds has been accumulated. In parallel, the gene expression patterns, the mutational status, DNA methylation status, 9 microRNA expression, and protein expression have been determined.5–8,10 Furthermore, some of the tested compounds have entered clinical development. Thus, the NCI60 cell panel has served as a cell-based model to identify compounds with the potential to progress to late preclinical and early clinical stages of development. Using the data obtained from in vivo studies 15 will allow a comparison of predictive power of the 3D models versus monolayer cultures.
Advantages of spheroids over monolayer cultures
Spheroids have been studied as tumor models for 40 years because they more closely mimic the morphology of tumors.16,23–25 The hypothesis is that spheroid screens may better predict efficacy in xenograft studies and therefore reduce the attrition of compounds as they move through development. Based on our experience using the ULA plates, we have identified several advantages and disadvantages to the spheroid platform for studying drug response (summarized in
Some compounds require prolonged exposure times (>6 days) to observe an effect on cell viability in vitro. 26 Compound exposure times using monolayer cultures are sometimes limited by the cell doubling times and the size of the culture vessel. NCI60 cell lines vary in doubling times from 17.8 h (NCI-H460) to ~80 h (HOP-92). 1 To ensure that untreated (control) wells do not become confluent during the time of compound exposure, either the initial cell seeding density must be reduced (introducing error in the initial plating that is exacerbated with time), or the surface available for cell growth must be increased to accommodate proliferation or incubation time must be limited. At very long incubation times, monolayer cultures may exhaust the media.
Cells nearer the surface of the spheroid have a higher growth fraction than cells in the core of the spheroid due to oxygen and nutrient gradients. 16 This localized cell replication and the large surface of spheroids allow prolonged drug exposures that would be difficult in monolayer cultures. Consequently, compounds that do not exert a pronounced effect on cell viability in shorter exposure times may be identified in these prolonged exposure assays using spheroids.
Production of spheroids
There are many ways to grow spheroids in a manner compatible with HTS automation: two being the hanging drop plate and the ULA plate.16–20 We selected the ULA plate for the simplicity in integrating into a workflow similar to monolayer culture plates. The ULA plates are designed to promote cell-cell associations based on the crowded conditions resulting from gravity sedimentation in the round-bottomed wells. The surface is modified to inhibit cell attachment and hence promote cell-cell interactions in a small collection volume. ULA plates are available in both 96-well and 384-well formats. All of the work presented was performed in 96-well plates. While some cell lines (MCF7, HT29) form condensed spheroids—presumably due to cell-cell interactions—others (e.g., the leukemia lines) may form aggregates of single cells. While many of the NCI60 cell lines scaled well from the larger to the smaller well size in 384-well plates, the leukemia cell lines produced fewer viable spheroids in the 384-well format.
The use of ULA plates to generate spheroids for HTS campaigns has several advantages and disadvantages that are summarized in
Disadvantages of ULA plates and the utility of spheroids include that the curvature of the wells requires a focus offset for any imaging system to focus on the spheroids. There is also a need to adjust the focal point as spheroids grow since the spheroid center is moved further from the base of the plate as they expand. Thus, imagers able to acquire multiple images along the Z plane to ensure capturing the center of the spheroid in focus are required. Consequently, imaging is limited to objectives with longer focal depths (e.g., 2× to 4× objectives). However, the biggest disadvantage for spheroids in screening is that as the diameter increases, uptake of dyes in the spheroid is not uniform, and the intensity of excitation light (for fluorescence measurements) reaching the spheroid center is lower than at the periphery, and the emitted light from the center of the spheroid is also less than from the periphery. Although spheroid sectioning and staining are possible (as shown in this study), this is not readily automatable and is highly labor intensive, making it too expensive for use in primary screens.
Spheroids can replicate small-molecule effects seen in xenografts
γH2AX is an indicator of DNA double-strand break formation and a marker of early response to treatment with anticancer agents.27–30 γH2AX may also be a marker of apoptosis. 27 A γH2AX signal was observed in A375 xenografted tumors from mice treated with topotecan, which was both dose and time dependent. 28 γH2AX was observed in HT29 cells after a 2-h in vitro exposure to 1 µM topotecan. 29 When HT29 multicellular spheroids were exposed to topotecan, the effects seen were similar to those observed in the xenograft tissue. 28 There was a time- and concentration-dependent increase in γH2AX in the spheroids. At therapeutically relevant concentrations of topotecan (0.1 µM), the γH2AX signal was visible after a 24-h exposure around the periphery of the spheroids with minimal staining in the center. However, with prolonged incubation times and/or higher concentrations of topotecan, the γH2AX signal could be observed in the spheroid center as well as in the periphery. Thus, multicellular spheroids may more closely mimic the requirement for compounds to distribute across the cell layers within a tumor to induce their effects. Using similar methods, the NCI60 multicellular spheroids may allow selection of compound response markers in a shorter time and at less expense than using xenografts.
Are spheroid assays predictors of efficacy of a compound in xenografts?
Based on the limited compound treatments performed in this current study comparing the NCI60 cell lines grown as 2D and 3D cultures, it seems that some cell lines may exhibit differential sensitivity to specific compounds as spheroids than when grown in monolayer cultures. A549 non–small cell lung cancer spheroids had similar IC50 values when exposed to carboplatin and MK1775 as A549 monolayer cultures. However, doxorubicin had a higher IC50 in spheroids compared with monolayer cultures. HT29 colon carcinoma spheroids exposed to topotecan also exhibited a higher IC50 than HT29 monolayer cultures.
Tumor microenvironment is an important factor in tumor response to therapy.16,24,25 Cell-based models with improved predictive accuracy for in vivo activity may require replication of the microenvironment tumor cells’ experience in vivo. This may necessitate co-culture of tumor cells with other cell types (e.g., fibroblasts, endothelial cells, and/or infiltrating cells) in a vessel amenable to HTS compound screening. We are continuing to compare the concentration response of compounds between 2D, simple 3D, and more complex (multicell-type) 3D models using well-characterized cell lines such as the NCI60 panel to identify better models for primary in vitro screening for cancer therapeutics.
Footnotes
Acknowledgements
We would like to thank Lori Bowles and other members of the NCI60 screening group for supplying the initial cell stocks used in this study.
Declaration of Conflicting Interests
The authors declared no potential conflicts of interest with respect to the research, authorship, and/or publication of this article.
Funding
The authors disclosed receipt of the following financial support for the research, authorship, and/or publication of this article: This project has been funded in whole or in part with federal funds from the National Cancer Institute, National Institutes of Health (NIH), under contract HHSN261200800001E. This research also was supported in part by the Developmental Therapeutics Program in the Division of Cancer Treatment and Diagnosis of the National Cancer Institute, NIH. The content of this publication does not necessarily reflect the views or policies of the Department of Health and Human Services, nor does mention of trade names, commercial products, or organizations imply endorsement by the U.S. government.
Supplementary material is available online with this article.
References
Supplementary Material
Please find the following supplemental material available below.
For Open Access articles published under a Creative Commons License, all supplemental material carries the same license as the article it is associated with.
For non-Open Access articles published, all supplemental material carries a non-exclusive license, and permission requests for re-use of supplemental material or any part of supplemental material shall be sent directly to the copyright owner as specified in the copyright notice associated with the article.