
Abstract
Automated imaging screens are performed mostly on fixed and stained samples to simplify the workflow and increase throughput. Some processes, such as the movement of cells and organelles or measuring membrane integrity and potential, can be measured only in living cells. Developing such assays to screen large compound or RNAi collections is challenging in many respects. Here, we develop a live-cell high-content assay for tracking endocytic organelles in medium throughput. We evaluate the added value of measuring kinetic parameters compared with measuring static parameters solely. We screened 2000 compounds in U-2 OS cells expressing Lamp1-GFP to label late endosomes. All hits have phenotypes in both static and kinetic parameters. However, we show that the kinetic parameters enable better discrimination of the mechanisms of action. Most of the compounds cause a decrease of motility of endosomes, but we identify several compounds that increase endosomal motility. In summary, we show that kinetic data help to better discriminate phenotypes and thereby obtain more subtle phenotypic clustering.
Introduction
Live-cell imaging is a powerful analytical tool yielding information about the kinetics of biological processes or compound activity and allows for discrimination between primary and secondary phenotypes to correctly determine their mode of action. Nevertheless, most high-content screening assays are end-point assays as live-cell imaging is generally considered more challenging in high-throughput than fixed-cell imaging. Some examples of added difficulties of live-cell screening are maintaining sterile culture conditions, bleaching/phototoxicity issues during imaging, and devising schemes for adding compounds across many plates in a synchronous fashion to the acquisition to ensure equal incubation times across all wells. Therefore, only a few live-cell screens have been reported to date.1–4 Never-theless, imaging screens are in some aspects easier to perform with live cells compared with fixed cells since neither fixing nor washing is required, thereby streamlining robotic workflows and reducing variability.
We took the challenge to bring an assay tracking subcellular objects to a medium-throughput assay. We developed an assay measuring the dynamics of late endosomes labeled with LAMP1-GFP in U-2 OS cells. LAMP1 is concentrated on late endosomes and lysosomes (
Materials and Methods
Cell Culture
U-2 OS cells were grown in RPMI 1640 Glutamax media with phenol red (cat. 61870; Invitrogen, Carlsbad, CA) supplemented with 10% fetal calf serum (FCS) (cat. P282710; PAN, Aidenbach, Germany) and 50 µg/mL gentamicin (cat. 15750-037; Invitrogen). U-2 OS cells with Lamp1-GFP growth medium was supplemented with 200µg/ml G418 (Cat. 10131-35, Invitrogen).
For experiments in microtiter plates, cells were first stained by adding Hoechst 33342 (cat. H21492; Invitrogen) at a final concentration of 2 µg/mL to a cell culture flask for 30 min. After incubation, cells were washed twice with phosphate-buffered saline (PBS), dissociated with 0.05% trypsin (cat. 25300-054; Invitrogen) for 3 min, counted with the CASY counter (Scharfe System, Reutlingen, Germany), and seeded at 4000 cells per well in 30 µL RPMI 1640 without phenol red (cat. 32404; Invitrogen), supplemented with 2 mM L-glutamine (cat. 25030; Invitrogen), 25 mM HEPES (cat. 15630-049; Invitrogen), 50 µg/mL gentamicin, and 10% FCS into a 384-well imaging plate (cat. 781092; Greiner Bio-One, Monroe, NC). Prior to acquisition, 40 µL of mineral oil (cat. M8410; Sigma, St. Louis, MO) was added to each well to eliminate evaporation during acquisition.
Chemical Library and Layout
We screened the Spectrum Collection library from MicroSource Discovery (Gaylordsville, CT). This library contains approximately 2000 biologically active and structurally diverse compounds. Columns 2, 3, 4 and 23 contain negative and positive controls and untreated samples. Negative control was DMSO (cat. 276855; Sigma), and positive control was 5 µM nocodazole (cat. M1404; Sigma) in DMSO. The library was distributed in seven 384-well plates and screened at 10 µM in 0.1% DMSO final concentration.
Image Acquisition
Control movies to determine sampling parameters were acquired on an Olympus IX71 inverted wide-field microscope with an Olympus UApo/340—40×/0.9 objective (Olympus, Tokyo, Japan) and equipped with an Andor iXon EM DU 897_BV back-illuminated EMCCD camera (Andor, Belfast, Northern Ireland). This camera has 512 × 512 pixels, with a pixel size of 16 µm. With 40× lens and 2× optovar, the image pixel size is 0.2 µm.
All other images were acquired on an automated microscope (BD Biosciences Pathway 855; BD Biosciences, San Jose, CA) equipped with a live-cell chamber, using an Olympus UApo/340—40×/0.90 objective with the filter sets shown in
The pixel size of the CCD camera was 6.45 µm. We acquired images with a binning of 2, resulting in 0.323 µm/pixel.
Image Analysis
The image analysis was performed with the freely available in-house developed software MotionTracking (http://motiontracking.mpi-cbg.de/get/).
Image correction
We acquired reference images after each acquisition to correct images in a preprocessing step. The correction function is composed of a linear affine transformation (translation, rotation, projection) and a nonlinear spline fit for fine adjustment. 8
The background is estimated with a simple mean filter with a kernel size approximately four times the size of the objects to be detected. The resulting image is then subtracted from the original.
In fluorescence microscopy, the predominant noise is the photon counting noise that follows a Poisson distribution and whose amplitude is proportional to the signal intensity. Linear models can be used to estimate noise amplitude as a function of the pixel intensity to weigh each pixel according to its information value. 9
Image quantification
Segmentation of objects was achieved by fitting Lorenzian functions to find nuclei and endosomes, allowing determining intensity and shape parameters with high precision at a subpixel resolution. 10 The cells were segmented with an active contour algorithm on the combined image of the endosome and nuclear channel. 11 Static parameters were extracted from the segmented endosomes and nuclei.
For tracking, we used information about endosomal position, intensity, and shape to search locally for the best candidate for linking objects between frames. 12 From the endosome tracks, we extracted kinetic parameters such as endosome speed, processivity, and displacement.
Data Analysis
Image analysis data were further processed with MATLAB from MathWorks (Natick, MA). Out-of-focus movies (low nuclei contrast and gradient intensity on the object edges) and movies containing either less than 3 or more than 35 cells were removed from analysis. Movies were considered outliers and removed if one of their measurements was more than 4 standard deviations (SD) away from the population mean within the same condition and the same plate. The parameters of the remaining movies were normalized by applying a platewise z score normalization to DMSO.13,14 The median of the z scores per well was then computed. In live-cell imaging, compounds are not removed before imaging and autofluorescent compounds can be problematic. Compounds yielding either nuclear Hoechst fluorescence more than 10 SD or GFP Lamp1 fluorescence more than 4 SD from DMSO were considered autofluorescent. Compounds were considered toxic if their volume-weighted Hoechst nuclear intensity was 3 SD above DMSO and the ratio of the cell to nuclei areas was 4 SD above DMSO. Autofluorescent and toxic compounds were removed from the hit list and not used for validation screen. For hierarchical clustering, Z score values were length normalized onto the unit hypersphere.
Principal component analysis and hierarchical clustering were performed in open-source programming language R, version 2.14.0 and following versions (R Foundation for Statistical Computing, Vienna, Austria). Some graphs were produced using the ggplot2 library.
Parameters
Twenty-three of 96 measured Lamp1 parameters were chosen for analysis based on three criteria: (1) a Pearson correlation coefficient among parameters below 0.8 (absolute mean 0.225), (2) a Pearson correlation coefficient between runs above 0.8, and (3) a heuristic that parameters representing all categories (intensity, morphology, location, kinetic) should be present. Furthermore, nuclei intensity morphology was measured. A point in an endosome track is called “processive” if it is followed by three consecutive points that fall between two rays forming an angle of 30 degrees, drawn from the first point. Subsequent points classified as “processive” form subsets of endosome tracks that are defined as processive movement events. A list with parameter names and their respective IDs is included in Table 1 .
Complete Names of All Measured Parameters and Their Corresponding Parameter ID.
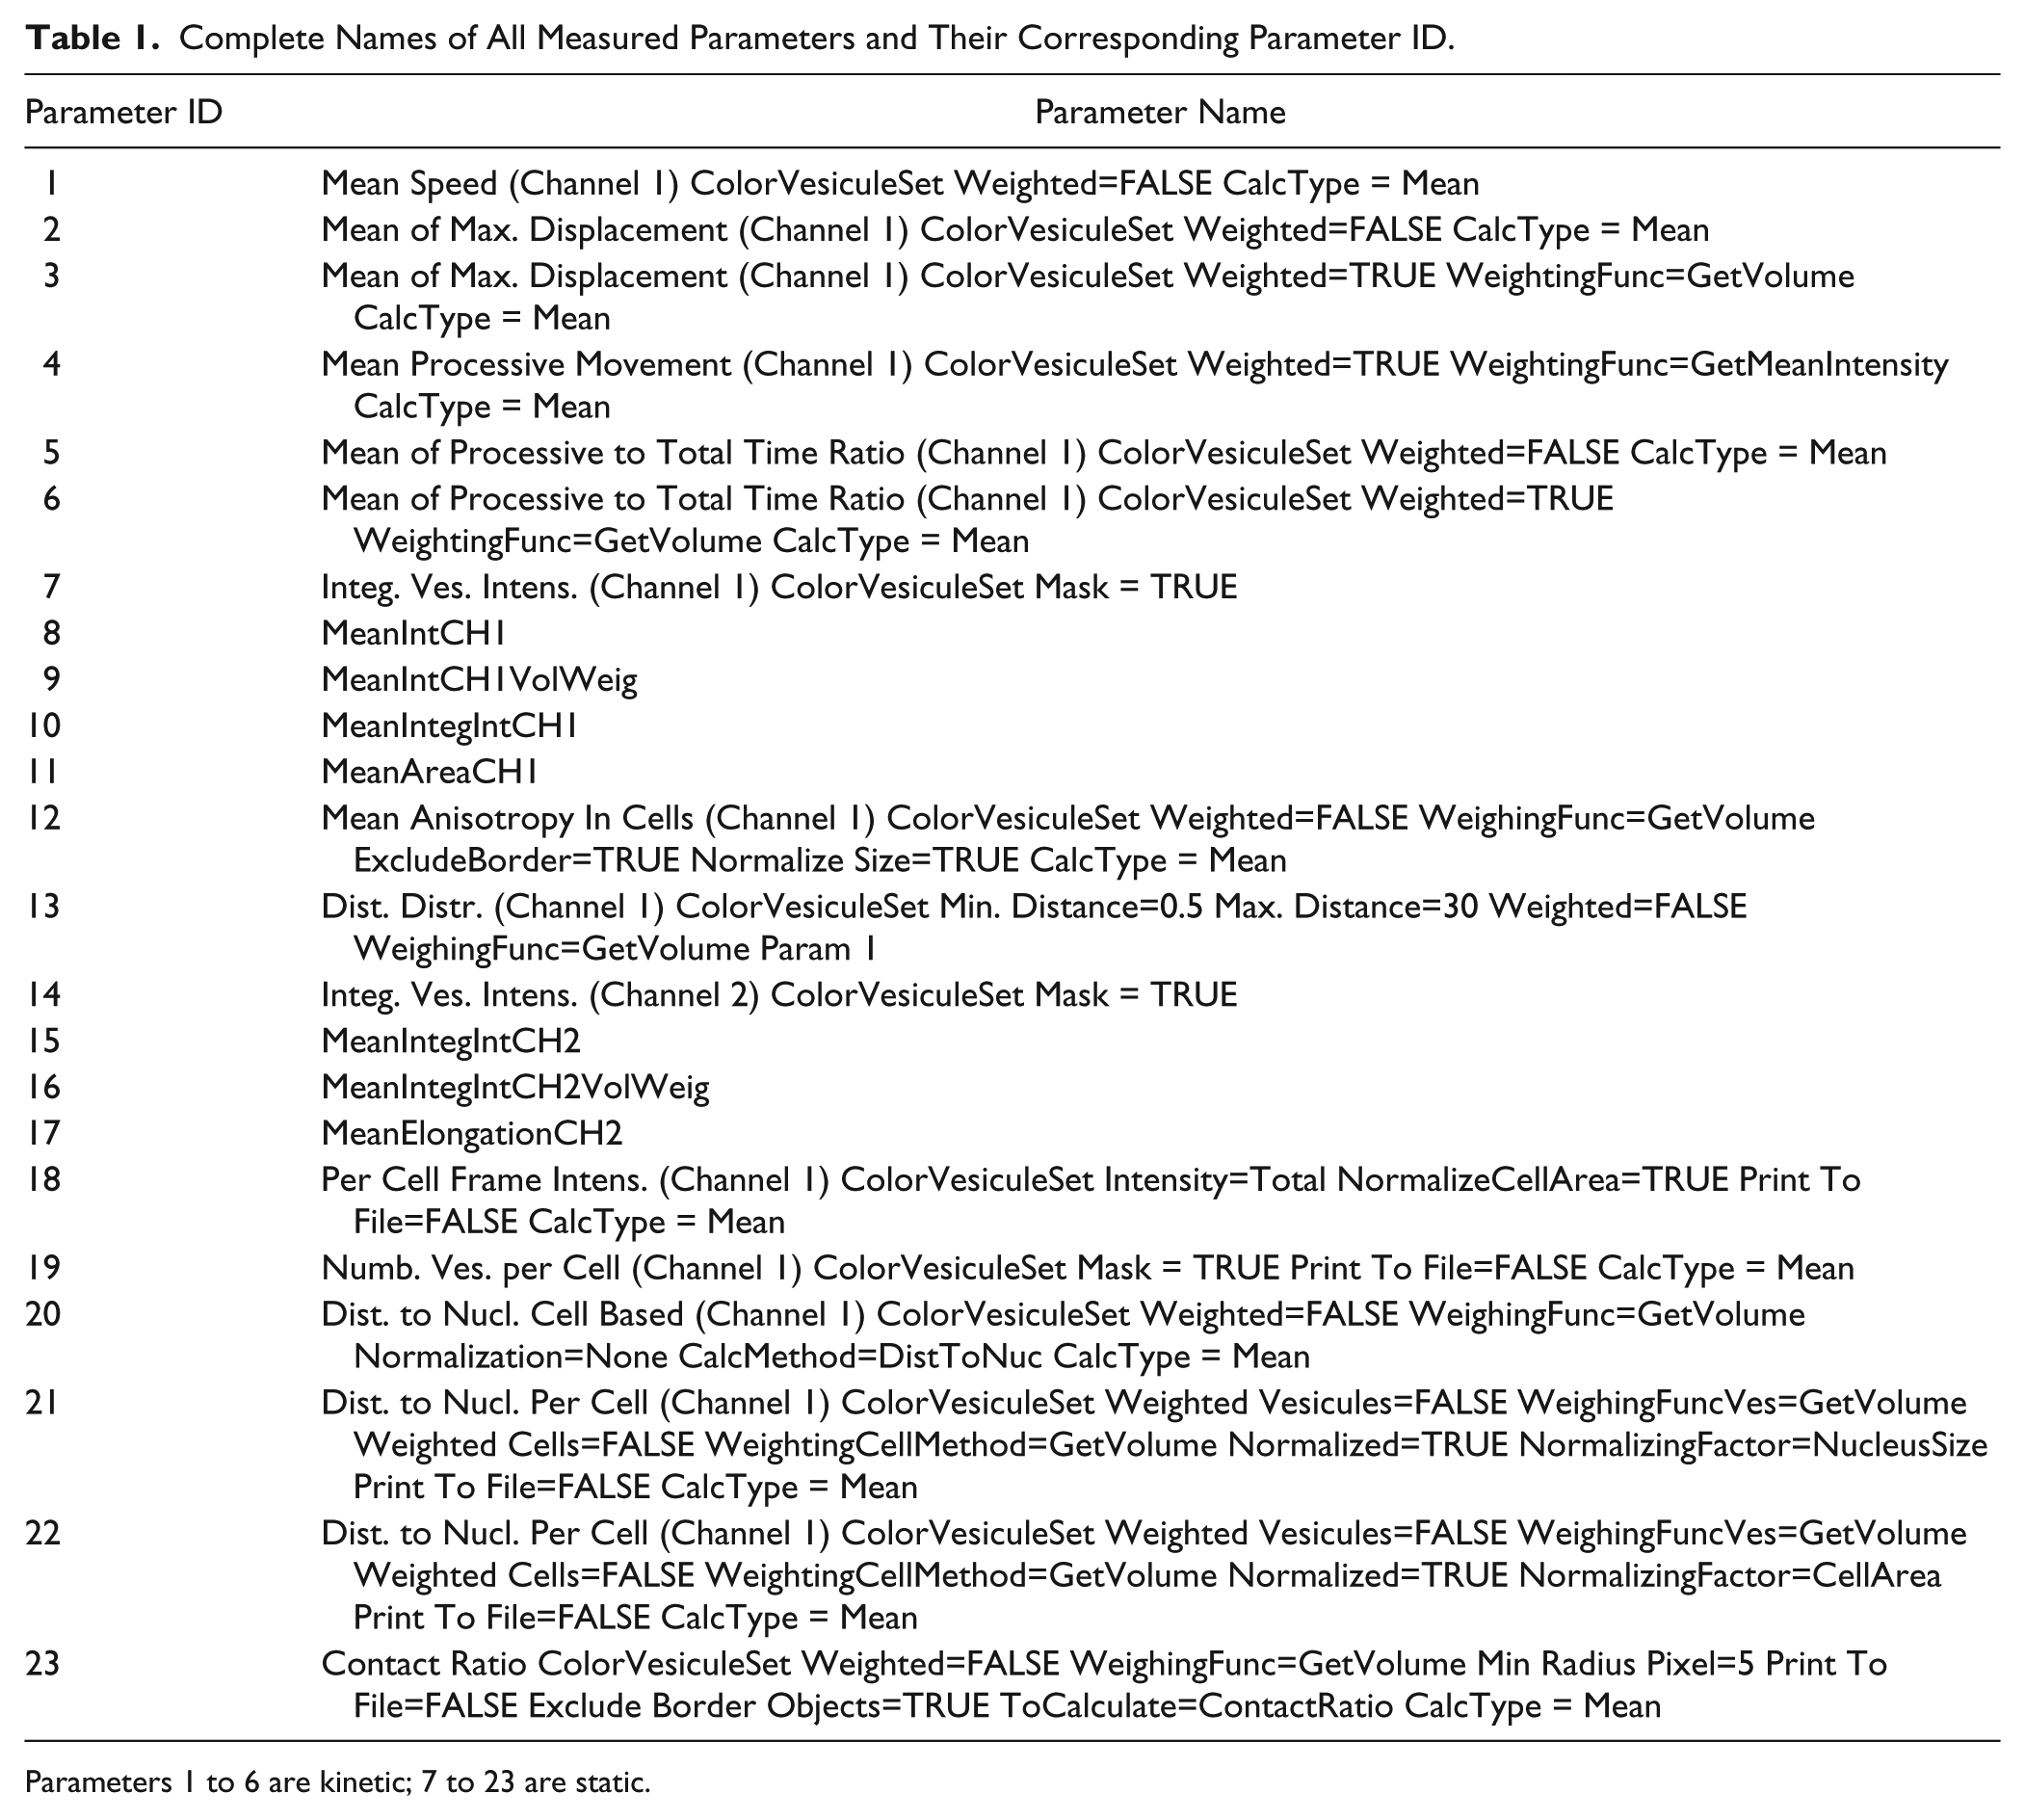
Parameters 1 to 6 are kinetic; 7 to 23 are static.
Results
Establishing the Lamp1-GFP Cell Line
To develop our endosome tracking assays, we established a stable cell line expressing a Lamp1-GFP construct under the control of the cytomegalovirus (CMV) promoter (see supplementary materials and Falcon-Perez et al. 15 ).
Determination of Image Acquisition Parameters
To estimate our required sampling rate and to establish a minimal observation time, we first determined the speed of the Lamp1-GFP labeled endosomes. We acquired control movies at frame rates ranging from 2 to 30 frames per second (fps) for 60 s on a wide-field inverted microscope equipped with a fast back-illuminated EMCCD camera. We calculated the mode of the speed of endosomes for different frame rates of the control movies ( Fig. 1A ).
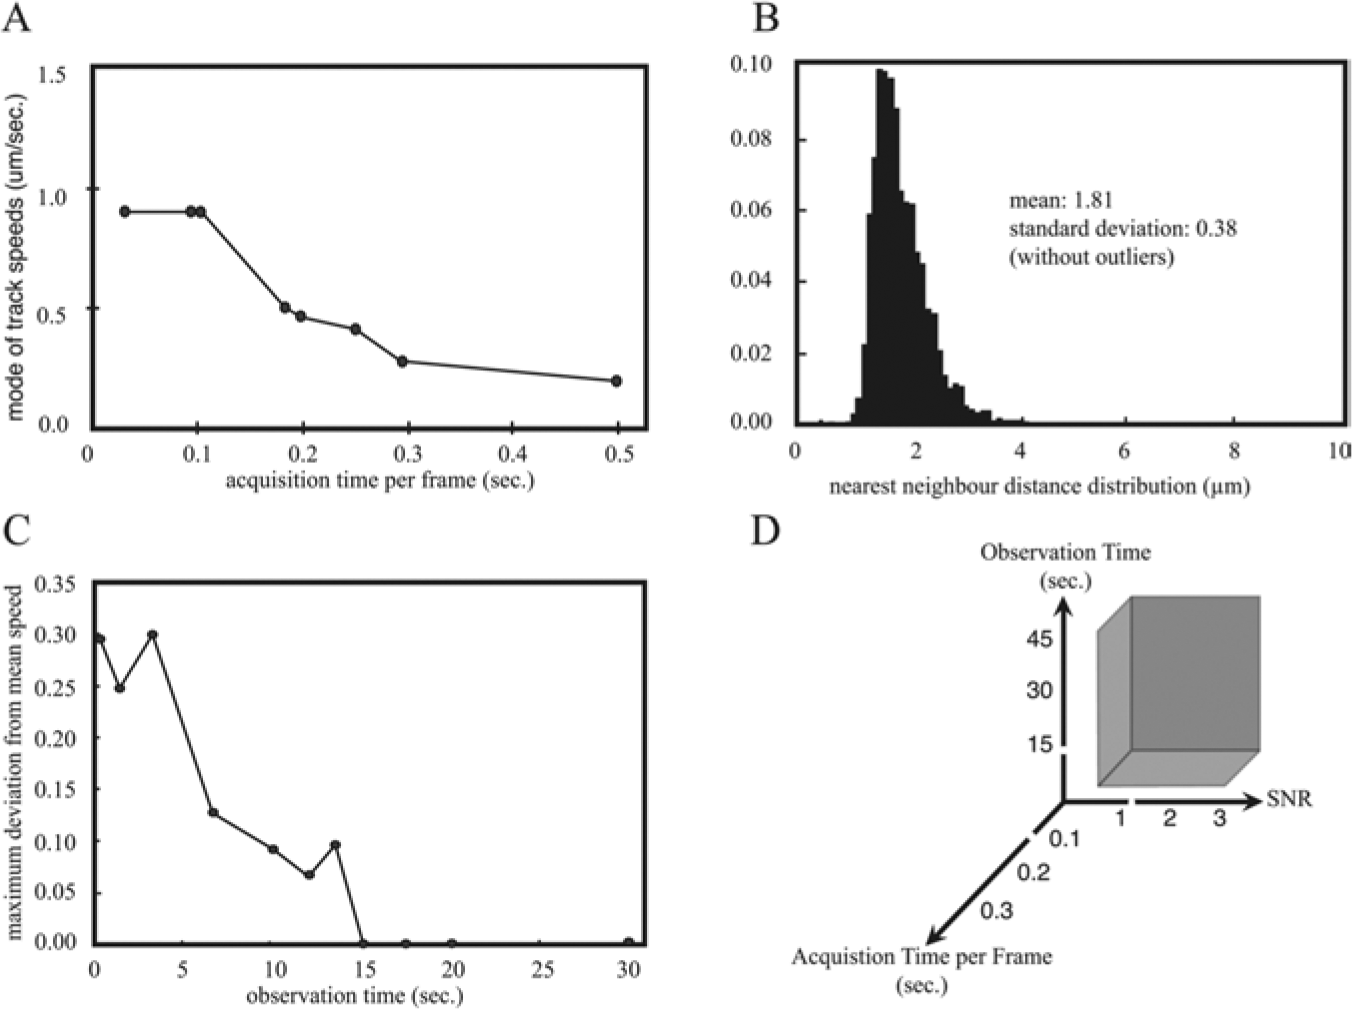
Optimization of parameters for kinetic acquisition of endosome movement. (
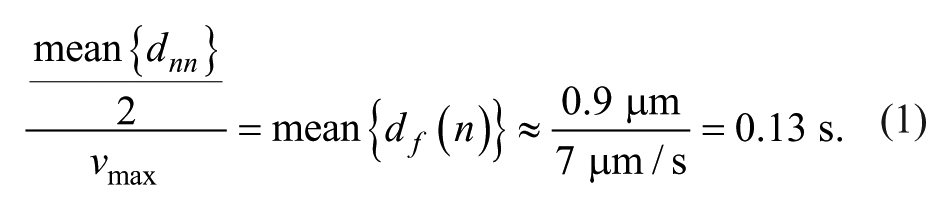
Another factor besides speed of objects influencing the necessary frame rate for tracking is the distance between objects. Densely distributed objects require faster frame rates compared with more sparse objects, as the distance traveled by an object between two frames can more readily exceed the object-to-object distance, potentially causing errors in object linking between frames. We therefore measured the nearest neighbor distances between objects ( Fig. 1B ) and estimated the maximum speed from a single movie.
We chose the mean of the nearest neighbor distance distribution divided by the maximum speed to obtain the frame rate (equation 1).
We determined that the maximal acquisition rate of the ORCA-ER CCD camera of our screening microscope at binning 2 was approximately 4.5 fps. Given the experimentally measured endosome speed and density, we determined that we were able to capture approximately 75% of all tracks but were not able to track the fastest events accurately.
To accurately estimate the kinetic parameters of objects, one needs to sufficiently sample them in time. We therefore aimed to establish the minimal number of images per movie necessary to obtain stable readouts. Several movies of 30 s length were acquired at the maximal frame rate of 4.5 fps. We calculated the mode of endosome speed for the entire sequences and shorter subsets to obtain different sampling intervals. The sampling interval yielding the minimal difference between the maximum deviation of individual measurements and the mean measurement for each movie was determined ( Fig. 1C ). These calculations resulted in a minimum movie length of 15 s with 68 images per movie. To have a safety margin, we decided to acquire 80 images per movie (approximately 19 s).
A further important setting is the exposure time of each image, since it determines the signal-to-noise ratio. We created a set of artificial images designed to resemble actual cells with a known number of cell objects and artificial endosomes with variable intensities and variable signal-to-noise ratios. We then tested our image-processing software and set a minimal threshold detection accuracy of 95% to determine the lowest acceptable signal-to-noise ratio. A similar signal-to-noise ratio was attained in our images with exposure times of 150 ms.
The minimal observation time, signal-to-noise ratio, and acquisition speed determine an acquisition parameter space, where the image analysis can be performed meaningfully. The observation time, signal-to-noise ratio, and acquisition speed are controlled on the microscope by setting the number of frames, exposure time, and the frame rate, respectively (see Fig. 1D ). These constraints need to be respected when optimizing other assay parameters such as cell viability.
Last, a single image of the Hoechst-stained nuclei was acquired per field of view to estimate directionality of endosome movement, estimate compound toxicity, and focus quality. The concentration of Hoechst was optimized to obtain reliable segmentation without inducing cell death, and cells were imaged with a 380/10-nm pass band filter with a 50% neutral density filter to reduce UV exposure (see Materials and Methods). To obtain a sufficient number of cells per condition for analysis, we acquired four movies per well.
Once the minimal acquisition parameters are determined, it is important to verify that cell viability is unaffected under those conditions. We compared the growth and survival of stained and imaged cells with unstained and nonimaged cells and showed that cell numbers were unaffected (data not shown). The light-induced damage induced by our acquisition conditions is therefore tolerable to cells and can be used for screening. In summary, for our screen, we determined that we could acquire four movies per well with 80 images at an excitation wavelength of 488/10 nm, an exposure time of 150 ms, and a frame rate of 4.5 images per second and 1 image at an excitation wavelength of 380/10 nm, a 50% neutral density filter, and an exposure time of 50 ms.
Assay Validation
Endosomes are moved by molecular motors along the tubulin and actin cytoskeleton. The tubulin network is essential for fast and directed movement and can be dissociated by microtubule depolymerizing agents such as nocodazole.16,17
To validate our acquisition parameters and experimental setup, U-2 OS cells were treated with increasing concentrations of nocodazole ranging from 0.4 to 10 µM and the kinetic parameters of vesicles were measured (see
Fig. 2A
). Average endosome speed was reduced with increasing concentrations of nocodazole, reaching a minimum at 3.5 µM. We calculated the IC50 values of 23 parameters and the Mahalanobis distance
18
of all parameters between DMSO and nocodazole. Most parameters had IC50 values below 5 µM; the IC50 of the Mahalanobis distance was 5 µM (see
Fig. 2B
). We decided to use 5 µM nocodazole as a control during the screen. Example videos of untreated cells, DMSO-treated cells, and nocodazole-treated cells with the tracking of the objects can be seen in
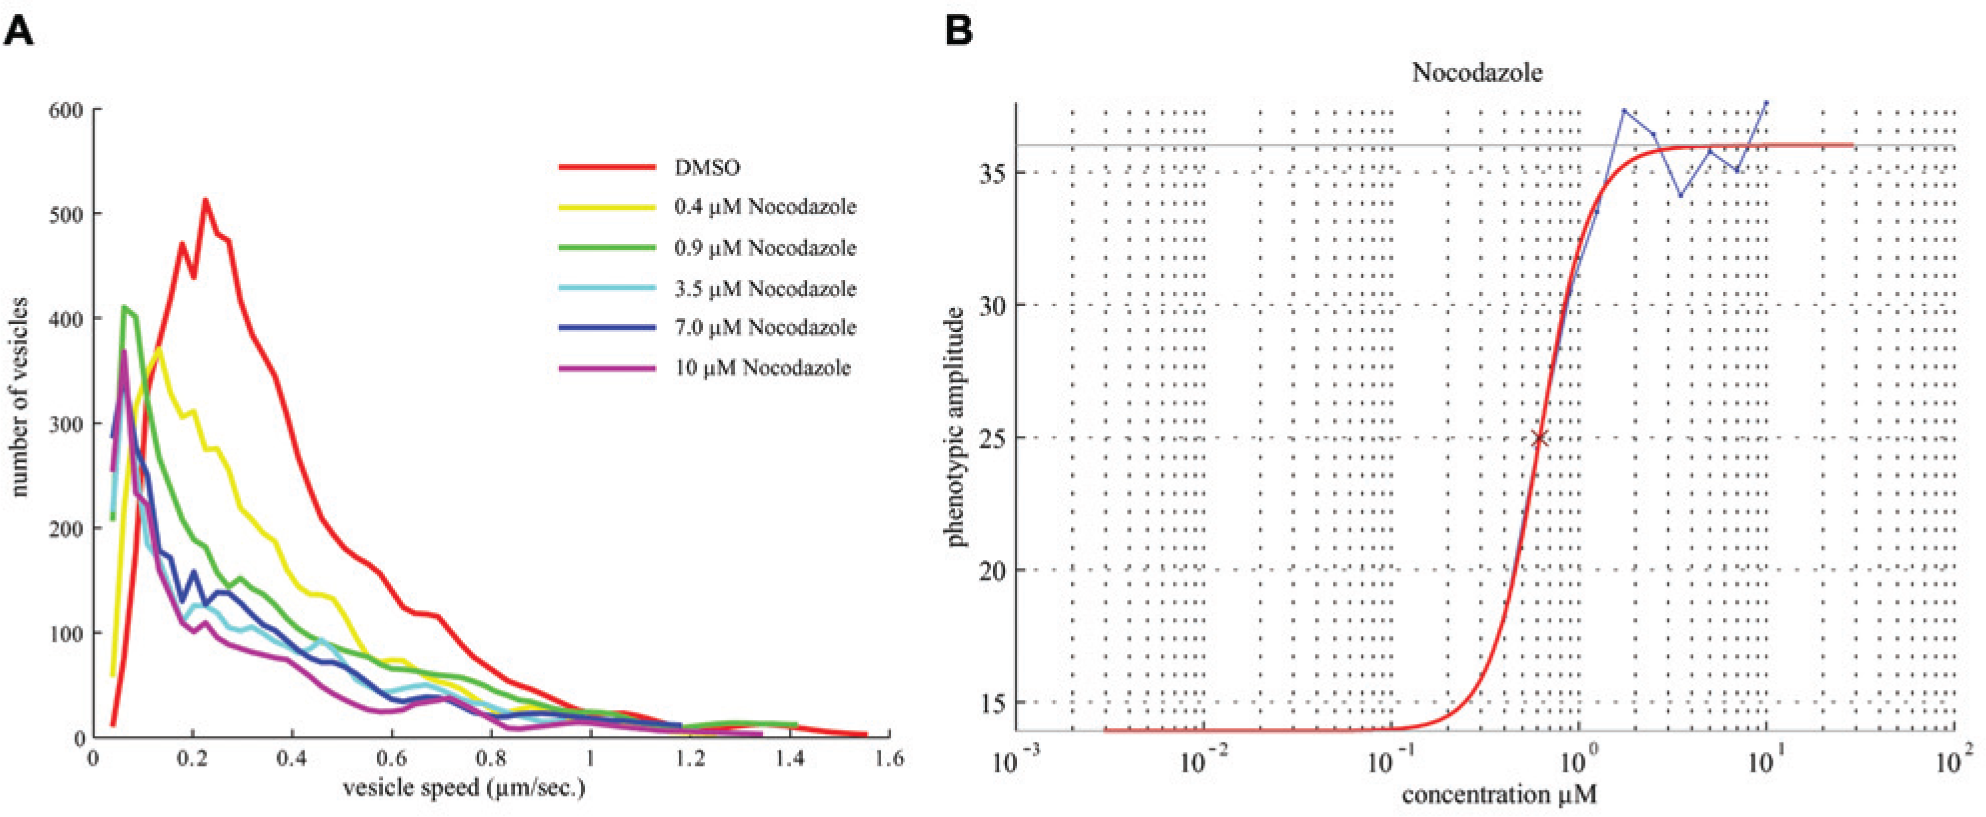
Assay validation on nocodazole-treated cells. (
Primary Screen of MSD Chemical Library
We screened the MSD Spectrum Collection library comprising 2000 compounds arrayed in seven 384-well plates using our optimized acquisition parameters. The acquisition of a well requires 1 min, 30 s; a column of 16 wells requires 24 min; an entire 384-well plate requires 9 h, 30 min; and the acquisition of all seven plates requires over 66 h.
Thus, compounds cannot be added simultaneously to all plates as the last well of the last plate would be incubated for 66 h longer than the first well of the first plate. The screen therefore needed to be carried out one plate at a time. A similar incubation problem arises within a plate since the acquisition of an entire plate requires 9.5 h. To solve this problem, we added the compounds column-wise every 24 min, which corresponded to the time required for the microscope to acquire a column. By acquiring the images column-wise, the incubation difference between the first and last wells was 24 min, and the compound addition required 9.5 h. The plate was imaged 4 h following the last compound addition. In this way, each well was incubated for approximately 14 h, and each plate was screened on a separate day. A further DMSO-only plate was screened to increase the robustness of the statistics. The entire screen took approximately a month to perform and generated 12,288 movies. A schematic workflow of the screen can be seen in
Multivariate Z factors 19 for six plates were between 0.77 and 0.87, indicating strong phenotypic responses. One plate showed low multivariate Z factor and was discarded from further analysis. The data were filtered for outliers, toxicity, and autofluorescent compounds (see Materials and Methods). For 247 compounds, tracking failed due to either focus problems or clumping of the objects, and the data were not further analyzed. In total, 1452 compounds could be successfully analyzed. The pairwise Pearson correlation coefficient between the multiparametric profiles of the nocodazole controls on different plates was on average 0.8, indicating that the assay was highly reproducible. The cell counts were not significantly different between positive and negative controls, indicating that nocodazole had not caused cells to detach.
Compounds were classified as active based on their Mahalanobis distance from DMSO.18–21 We chose a Mahalanobis distance of 13 as a cutoff since it was the halfway distance between the highest untreated control (11.13) and the lowest of the nocodazole control (14.9) (
Fig. 3A
). Our selected cutoff was very stringent as neither DMSO or untreated false positives nor nocodazole false negatives were selected. This cutoff selected 79 compounds out of 1452 reagents (5.4%). The normalized well-averaged data are shown in

Boxplots with Mahalanobis distance per group of treatment. (
Next, we performed hit confirmation with 73 of 79 hits in duplicate. Not all primary hits were tested in the reconfirmation, because a previous analysis (data not shown) had identified a slightly different subset of compounds, and hit picking had been carried out based on a common list. Forty-eight compounds showed in both duplicates a Mahalanobis distance greater than the highest Mahalanobis distance of the untreated control, resulting in a 65.7% reconfirmation rate (
Fig. 3B
). Forty-eight compounds showed a Pearson correlation coefficient above 0.6 between replicate runs and were therefore considered robust and reconfirmed (reconfirmation rate of 65.7%). The normalized well-averaged data are shown in
Clustering of Confirmed Hits
Next, we analyzed the phenotypes of our hit compounds. All compounds showed both a static and a kinetic phenotype, and none of the identified compounds would have been missed in a nonkinetic screen. This was to be expected since changes in exchange rates between donor and acceptor compartments would most likely lead to morphological changes in those compartments. We performed hierarchical clustering of the hit phenotypes using the cosine as a distance measure. To estimate the importance of the kinetic data for distinguishing phenotypes, clustering was carried out with (
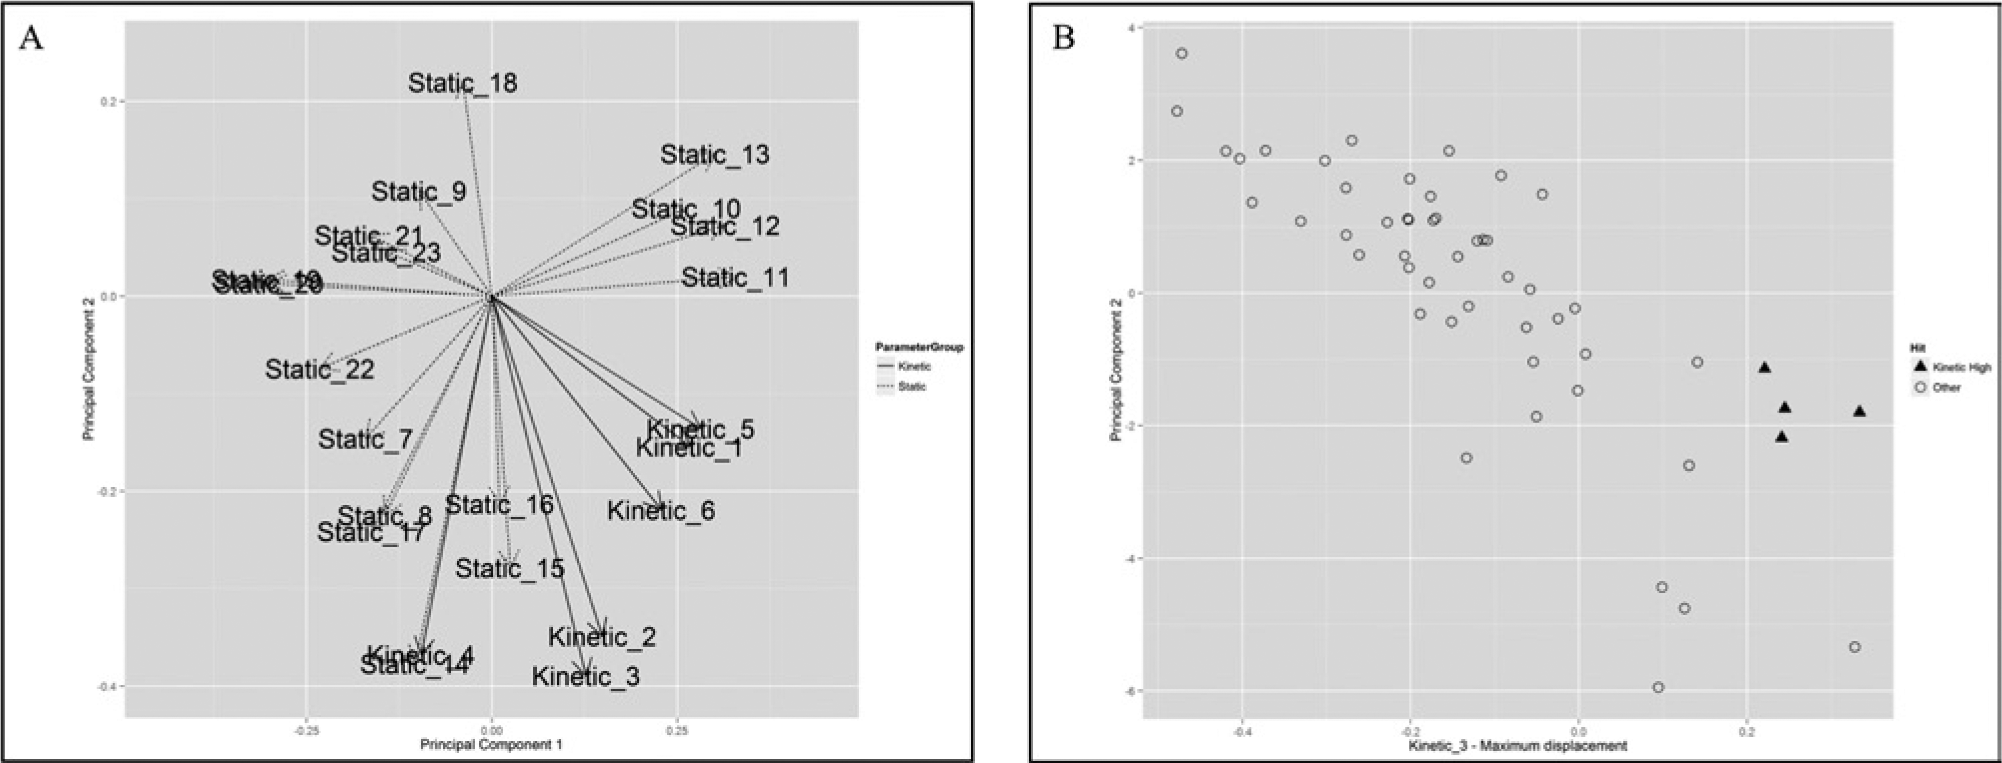
Principal component analysis. (
As the results of hierarchical clustering can depend on multiple parameter choices, we also performed an additional, independent test not relying on the clustering of the phenotypes. Chemically similar compounds can in many cases be expected to induce similar phenotypes and therefore show a lower phenotypic distance. We computed the Tanimoto similarities between hit compounds using 2D chemical fingerprints from the Chemistry Development Kit.
23
A group of 19 chemical pairs was observed to be clearly more similar to each other than the other compound pairs with Tanimoto distances between 0.74 and 1 versus less than 0.61 for others (annotated with color blocks in
Discussion
Our aim was to develop a high-content assay measuring the kinetic parameters of endosomal movement, with emphasis on going beyond the more commonly measured static parameters, such as morphology and intensity. The efforts to develop, carry out, and analyze the screen were considerable and in our experience much more difficult than for a conventional screen with fixed cells. First, object tracking requires the optimization of acquisition parameters, such as frame rate and movie length, that is not required for fixed assays. This optimization requires a suite of experiments where cells are imaged at a different frame rate and for long periods and the survival of the cells under optimized conditions is verified. Second, the throughput of the assay is massively reduced due to the time required to add compounds in a synchronized fashion and to acquire a plate. With our equipment and protocol, the acquisition of a single 384-well plate requires 10 h of recording. This imposes a compound addition time of 10 h, and therefore a single plate per day can maximally be acquired. The throughput could be increased with additional microscopes or a much faster microscope with a larger camera chip but would still be much lower than a conventional fixed-cell screen. Third, incubation conditions are not ideal in a microscope. This is particularly true for the BD Pathway 855, which does not have humidity control. We circumvented evaporation problems by covering the wells with mineral oil and using CO2 independent medium to compensate the diminished gas exchange. Fourth, the image analysis to segment all frames of the movies and link the objects between frames is challenging and computationally demanding. The computational costs are dependent on the software, the desired precision of the analysis, and the hardware available at the time of analysis. Our software, Motion Tracking, segments and tracks objects with high precision and requires correspondingly large computational resources. The processing time of a single 384-well plate required 43,000 CPU hours and was carried out on a 2500 CPU cluster farm of the Technische University of Dresden.
Thus, live-cell screens tracking numerous and fast objects are challenging, and the benefits of obtaining kinetic parameters must be carefully evaluated in light of the increased effort and costs involved.
Our analysis shows that the kinetic parameters did not contribute to the detection of hit phenotypes. Therefore, in our case, a large chemical screen could and should be carried out using fixed cells. Furthermore, our analysis showed that kinetic parameters contribute critical additional information for clustering of hit compounds. The kinetic parameters allow two classes of compounds to be distinguished: those that decrease and those that increase the motility of endosomes. The static morphological changes do not result in a clear distinction between these two classes. A further indication that the use of kinetic parameters is beneficial for phenotypic clustering is that the phenotypic clustering results are more consistent with the chemical clustering when including the kinetic parameters. Thus, even though our kinetic assay would not be amenable to a large compound screen, it is of great value for classifying compounds that would emerge from such a screen. In general, increasing the number of relevant and orthogonal parameters to measure cellular phenotypes allows more granular resolution of phenotypes and therefore better clustering.
Our kinetic analysis allowed us to distinguish a class of compounds that increased the kinetic parameters such a speed and processivity. All compounds belong to the family of cardiac glycosides, whose primary mode of action is the inhibition of Na+/K+ ATPases. Rosen et al. 24 have previously shown that cardiac glycosides had a profound effect on endocytosis and that transferrin accumulated in large perinuclear vesicles positive for Rab7 and Rab11 but negative for low-density lipoprotein. This effect was mediated directly by Na+/K+ ATPase activity. It was proposed that the cardiac glycosides alter the activity of Na+/K+ pump in endosomes, thereby increasing the acidification of endosomes. 25 The phenotype induced by the cardiac glycosides in U-2 OS cells appears to be different from the one reported by Rosen and coworkers. In some cells, large perinuclear vesicles can be observed, but the majority of cells have small, fast-moving Lamp1-GFP vesicles. The differences might be due to differences in cell lines, different concentration of drugs, or incubation time. At this stage, we cannot speculate as to the reasons for observed increased movement of Lamp1 endosomes in response to cardiac glycosides. Cardiac glycosides have been reported to have pleiotropic effects, affecting many cellular pathways 26 ; in particular, nonreceptor tyrosine kinase c–Src has been reported to be activated in response to binding to Na+/K+ pumps. Src family kinases have been implicated in regulating endosomal trafficking through control of distinct Rho family GTPases and the actin cytoskeleton. 27 Src associates with early endosomes containing RhoD and with late endosomes containing RhoB.28,29 Thus, it is possible that the increased motility of late endosomes upon treatment with cardiac glycoside is a result of the activation of c-Src and the activation of RhoD containing late endosomes.
Here we bring clear evidence that a kinetic screen improves phenotypic clustering of hit compounds and brings more insight into their modes of action. Due to the low throughput, this kind of assay is not suitable for primary screens but can be added to the secondary assay pipelines and hit confirmations.
Footnotes
Acknowledgements
We are grateful to Ina Nüsslein (MPI-CBG) for fluorescence-activated cell sorting of Lamp-1-GFP cells and to Esteban C. Dell’Angelica (UCLA) for providing Lamp1-GFP plasmid.
Declaration of Conflicting Interests
The authors declared no potential conflicts of interest with respect to the research, authorship, and/or publication of this article.
Funding
The authors disclosed receipt of the following financial support for the research, authorship, and/or publication of this article: The research was funded by the German Ministry of Education and Research (BMBF) within the Framework Concept “Quantpro” (0313831A) and managed by the Project Management Agency Jülich.
References
Supplementary Material
Please find the following supplemental material available below.
For Open Access articles published under a Creative Commons License, all supplemental material carries the same license as the article it is associated with.
For non-Open Access articles published, all supplemental material carries a non-exclusive license, and permission requests for re-use of supplemental material or any part of supplemental material shall be sent directly to the copyright owner as specified in the copyright notice associated with the article.