
Abstract
Cancer cells can be drug resistant due to genetic variation at multiple steps in the drug response pathway, including drug efflux pumping, target mutation, and blunted apoptotic response. These are not discriminated by conventional cell survival assays. Here, we report a rapid and convenient high-content cell-imaging assay that measures multiple physiological changes in cells responding to antimitotic small-molecule drugs. Our one-step, no-wash assay uses three dyes to stain living cells and is much more accurate for scoring weakly adherent mitotic and apoptotic cells than conventional antibody-based assays. We profiled responses of 33 cell lines to 8 antimitotic drugs at multiple concentrations and time points using this assay and deposited our data and assay protocols into a public database (http://lincs.hms.harvard.edu/). Our data discriminated between alternative mechanisms that compromise drug sensitivity to paclitaxel and revealed an unexpected bell-shaped dose-response curve for BI2536, a highly selective inhibitor of Polo-like kinases. Our approach can be generalized, is scalable, and should therefore facilitate identification of molecular biomarkers for mechanisms of drug insensitivity in high-throughput screens and other assays.
Keywords
Introduction
Understanding and combating variation in drug response is a central problem in cancer pharmacology. Acquired drug resistance is common, but large variation in response is also seen in drug-naive patients. Conceptually, variation in drug sensitivity and selection for resistance can occur at any step in the drug response pathway ( Fig. 1 ). Common approaches to elucidating the genomic and mechanistic basis of response variation compare response between isogenic lines, for example, using RNA interference (RNAi)–mediated changes in gene expression or across a panel of cancer-derived cell lines. Typically, in these screens, response is quantified as the fraction of cells surviving at a fixed time point (often 3 days) following treatment with a dilution series of drug. These data are typically parameterized as a single EC50 value (drug concentration causing half-maximal killing). Less commonly, Emax (efficacy, the maximum response achievable from a drug) and a slope parameter are also extracted. This approach is simple and inexpensive, and the EC50 (also called GI50 for the drug concentration causing half-maximal growth inhibition) values it generates have been widely used to compare drugs and cell lines, notably in the NCI60 COMPARE analysis. 1 This approach has been quite successful for predicting patient responses to kinase inhibitors as a function of their cancer genotype,2–4 but it has been less successful for other drug classes. A limitation of this approach is that it tells us little about the step or steps in the drug response pathway where a given cell line varies in response ( Fig. 1 ). An approach that makes it possible to begin to understand the different mechanisms leading to variation in sensitivity would be very valuable when trying to determine the genotypic basis of drug resistance or insensitivity and response-predictive genetic biomarkers.
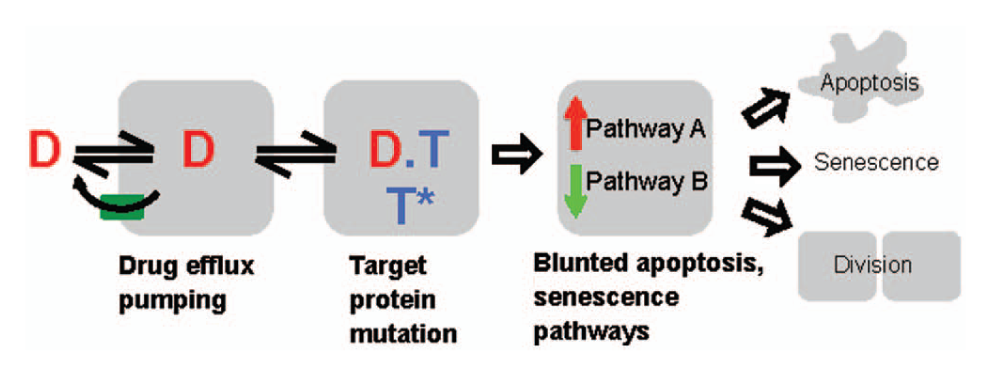
A flowchart illustrating the steps in the drug response pathway with different outcomes. D, drug; T, target.
Discriminating different mechanisms that compromise drug sensitivity in cells in culture requires multiplexed readout of response. Typical multiplexed readouts include messenger RNA (mRNA) profiles, multiplexed gene expression reporters, and high-content imaging assays.5–8 These assays can be highly informative, but they are typically much more costly and complex than simple GI50 measurements, which limits their application across large cell line panels at multiple drug concentrations. Furthermore, it can be difficult to infer alternative mechanistic effects on drug response pathways from gene expression and other multiplex readouts, in which the relationship between readout and the drug response pathway is complex. It would be useful to develop multiplexed assays that report directly on changes in cell physiology relevant to drug responses that are cheap enough to run across many cell lines and drug concentrations but informative enough to discriminate different mechanisms of drug sensitivity. Here, we developed such an approach using high-content screening (HCS; fluorescence microscopy with multiple markers followed by automated image analysis) as a multiplex readout of cell physiology.
Several considerations went into design of this HCS assay. Antibodies have been preferred as HCS markers due to their broad applicability, high specificity, and strong signal.9–11 However, fixation followed by antibody staining requires multiple wash steps that are time-consuming and bear the strong risk of selectively detaching cells that are loosely attached to the substrate. Cell detachment is problematic for accurate quantification of mitotic arrest and apoptosis, both of which weaken cell adhesion. Therefore, an imaging assay was developed in which living cells were labeled with three fluorescent dyes, followed by a fixation step to make the assay less time sensitive, but with no washes or medium changes. This lack of wash steps greatly increased the accuracy of scoring mitotic arrest and apoptosis. We demonstrate its utility by producing accurate dose-response curves at multiple time points for several aspects of cell physiology relevant to drug action. Together, these data comprise a pharmacological response signature that discriminates alternative mechanisms of compromised drug sensitivity to paclitaxel and reveal an unexpected dose-response profile for a Polo-like kinase inhibitor.
Materials and Methods
Cell Culture
Cell lines were from the Center for Molecular Therapeutics collection (Massachusetts General Hospital, Boston). Growth conditions for 33 cell lines are listed in
Reagents and Antibodies
Paclitaxel and staurosporine were from Sigma (St. Louis, MO; cat. T7191 and S3939). BI-2536 was from Haoyuan Chemexpress (Shanghai, China; cat. HY-506980). LysoTracker-Red was from Invitrogen (Carlsbad, CA; cat. No L-7528). Hoechst 33342 was from Sigma (cat. No. B2261). DEVD-NucView488 caspase-3 substrate was from Biotium (Hayward, CA; cat. 10402). Rabbit anti–phospho-Histone H3 (Ser10) antibody was from Millipore (Billerica, MA; cat. 06-570); mouse anti–cleaved PARP (Asp214) antibody was from BD Pharmingen (San Jose, CA; cat. 552597). Alexa Fluor 488 goat anti–mouse IgG and Alexa Fluor 568 goat anti–rabbit IgG were from Invitrogen (cat. A-11001 and A-11011). For additional kinase inhibitors screened: VX-680 (cat. HY-10161), GSK1070916 (cat. HY-70044), KIN001-220 (cat. HY-70061), and MLN8054 (cat. HY-10180) were from Haoyuan Chemexpress; AZD1152-HQPA (cat. 1580) was from Axon Medchem (Groningen, the Netherlands); and MPS-1-IN-1 was provided by the laboratory of Nathanael Gray (Dana Farber Cancer Institute and Harvard Medical School, Boston, MA).
Cell Staining and Immunofluorescence
For both the dye-based and the antibody-based assays, cells are first seeded into clear-bottom black 384-well imaging plates (Corning 3712; Corning, Corning, NY) at 2000 to 3000 cells/30 µL medium/well. After allowing cells to settle down in the plates for 24 h, compounds are added either by multichannel pipettor or by robotic pin transfer. Either the dye-based or the antibody-based staining is performed at 24-, 48-, and 72-h time points after compound addition.
For the dye-based assay, 10 µL of a cocktail of reagents (4 µg/mL Hoechst 33342, 2 µM NucView488, and 4 µM LysoTracker-Red in phosphate-buffered saline [PBS]) is dispensed into each well (so that the final concentration of Hoechst 33342 is 1 µg/mL, NucView488 is 500 nM, and LysoTracker-Red is 1 µM) using a Matrix WellMate plate filler (Thermo Fisher Scientific, Hudson, NH). The plates are incubated in a tissue culture incubator (37 °C, 5% CO2) for 1.5 h. Then, 40 µL of warm 2% formaldehyde in PBS is added to each well (final concentration 1%), using a Matrix WellMate. Plates are spun briefly in a table-top centrifuge at 1000 rpm while cells are being fixed for a total of 20 min at room temperature. After this, plates are sealed using aluminum plate seals (Corning 6570) and are imaged (best if imaged within the same day) using an ImageXpress Micro (Molecular Devices, Sunnyvale, CA) with 10× Plan Fluor objective lens and suitable filters (DAPI, FITC, and Texas Red). Four sites are imaged in each well.
For the antibody-based assay, 30 µL of warm fixative/permeabilizing reagent (7.4% formaldehyde and 0.4% Triton X-100 in PBS) is dispensed into each well using a Matrix WellMate (final concentration of formaldehyde is 3.7% and Triton X-100 is 0.2%). Plates are spun briefly in a table-top centrifuge at 1000 rpm while cells are being fixed and permeabilized for a total of 20 min at room temperature. After fixation/permeabilization, wells are washed three times in PBS. Then, 20 µL of the mixture of primary antibodies (phospho-Histone H3, 1:500; cleaved PARP, 1:250) in blocking buffer (8% bovine serum albumin [BSA], 0.4% Triton X-100 in PBS) is added to each well with 20 µL of residual volume of PBS. Plates are incubated either at room temperature for 1 h or in the cold room overnight. After primary antibody incubation, the wells are washed three times in PBS. Then, 20 µL of the mixture of secondary antibodies (Alexa Fluor 488 goat anti–mouse IgG, 1:250; Alexa Fluor 568 goat anti–rabbit IgG, 1:250) in blocking buffer is added to each well with 20 µL of residual volume of PBS. The plates are incubated at room temperature for 1 to 2 h. After this, the wells are washed three times in PBS. Then, 20 µL of 2 µg/mL Hoechst 33342 in PBS is added to each well with 20 µL of residual volume of PBS (so that the final Hoechst concentration is 1 µg/mL). Plates are incubated at room temperature for 0.5 h. Wells are washed three times in PBS, and then the plates are sealed. Plates are imaged using ImageXpress Micro with the same settings as the dye-based assay.
Live-Cell Imaging
Cell lines HLF, HEC-1, 5637, and T24 were incubated with 11.11 µM, 1.2 µM, 137 nM, 45 nM, and 15 nM BI-2536on a clear-bottom 96-well plate (655090; Greiner Bio-One, Monroe, NC) and imaged for 72 h on a Nikon Ti (Nikon, Tokyo, Japan) motorized inverted microscope with Perfect Focus System at 37 °C and 5% CO2. Phase-contrast images were acquired using a 20×, 0.75 NA Plan Apochromat Nikon objective.
Image and Data Analysis
The large-scale data analysis used our in-house image analysis algorithm and was carried out on the Orchestra high-performance computation cluster at Harvard Medical School. The image analysis algorithms for both the dye-based and the antibody-based assays are developed in MATLAB, and detailed step-by-step analysis for the dye-based assay is illustrated in
Both algorithms share the same basic structure, which comprises two steps: nuclear segmentation and phenotypic classification. The nuclear segmentation step is used to identify individual nuclei and is identical for both assays since they rely on the same marker, Hoechst 33342, which is shown in panels a1 to a3 of
For the antibody-based assay, the algorithm performs phenotypic classification by matching the spots detected from phospho-Histone H3 and cleaved PARP channels to the nuclear mask detected from the Hoechst channel. For both phospho-Histone H3 and cleaved PARP channels, the spot detection is carried out in the same way as the NucView488 channel in the dye-based assay. All phospho-Histone H3 positive cells get assigned as mitotic cells, and then all phospho-Histone H3 negative but cleaved PARP positive cells are classified as apoptotic cells. The rest of the population then gets assigned as interphase cells.
Dose-Response Curve Fitting
All dose-response curves were fitted in Prism 6 (GraphPad Software, La Jolla, CA), using the following three-parameter nonlinear regression model: Y = Emin + (Emax – Emin)/(1 + 10(LogEC50−X)),
where Y is the drug response, mitotic index, or apoptotic index in this case; X is the log of the drug concentration (in µM); Emin is the baseline response in the absence of drug; Emax is the maximum achievable response; and EC50 is the concentration that produces the half-maximal effect.
Results
Comparison of Two HCS Assays for Profiling Antimitotic Drug Responses
We first evaluated the performance of two HCS assays. One relied on antibody staining of fixed cells as has been typical in the HCS literature, the other on fluorescent dyes that stain living cells. The antibody assay used anti–phospho(Ser10) Histone H3 to mark mitosis and anti–cleaved PARP1 to mark apoptosis. The dye assay used LysoTracker-Red to visualize cell morphology and DEVD-NucView488 caspase-3 substrate to mark apoptosis. 12 Both assays used the cell-permeable DNA dye Hoechst 33342 to mark nuclei. To make plate reading less time sensitive, cells were fixed after staining in the dye-based assay, but they were not washed before imaging. LysoTracker-Red is a fluorescent, lipophilic amine that accumulates in acidic compartments. But at high concentration (~1 µM), it stained the whole cell, including acidic compartments and the cytosol. This enabled the identification of rounded-up mitotic cells by their brighter intensity and round morphology compared with interphase cells. Apoptotic cells were also round, but they stained less brightly with LysoTracker, presumably due to compromised plasma membrane integrity or lower adenosine triphosphate (ATP) levels. Major differences between the two assays are listed in Table 1 . In addition to offering the washing-free feature, the dye-based assay is faster and cheaper.
Comparison between Two Imaging Assays That Count Nuclei, Mitotic Cells, and Apoptotic Cells.
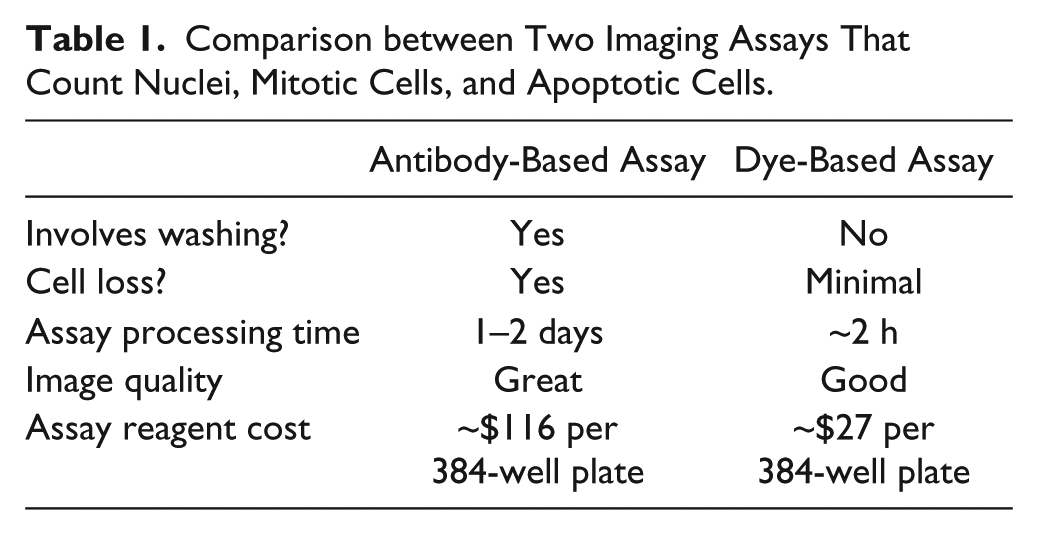
Assay performances were compared using the human bladder tumor cell line 5637 treated with paclitaxel, a representative antimitotic drug. Cells were seeded at t = −24 h (~3000 cells in 30 µL of growth medium/well, 48 replicate wells/treatment). Then, 200 nM paclitaxel or DMSO vehicle (<0.1% final) was added at t = 0. Two HCS assays were run in parallel at 24 and 48 h. Representative images from the two assays are presented in Figure 2A . In the no-drug control arm (left two columns of Fig. 2A ), the two assays gave very similar results in terms of cell density, nucleus morphology, and % mitotic and % apoptotic cells. After 24 h of paclitaxel treatment (right two columns of Fig. 2A ), both assays revealed a strongly elevated percentage of mitotic cells as expected. Mitotic index values were similar between both treatments, reflecting optimized washing conditions (a spin-down after each wash) designed to retain the weakly adherent mitotic cells in the antibody assay ( Fig. 2B ). However, we observed significantly fewer apoptotic cells in the antibody assay compared with the dye-based assay, judged from a lower percentage of cells in the cleaved PARP channel compared with the NucView488 channel ( Fig. 2B ). These data suggested that our wash protocol, even though optimized to retain mitotic cells, was selectively removing apoptotic cells. To confirm this, we tested the effect of washing on the dye-based assay of 5637 cells treated with paclitaxel for 48 h. Cells were imaged first without washing, and the same plate was imaged after three washes with PBS to mimic the wash procedure of the antibody assay. Representative images of the same field of view pre- and postwashing are shown in Figure 2C . The prewashing image has a much higher number of NucView488-positive cells compared with the postwashing image. In addition, the prewashing image contains many objects with round, puffy, blurred Hoechst staining and very weak LysoTracker-Red and NucView488 staining, which are completely missing from the postwashing image (three such cells are indicated by white arrows in Fig. 2C ). Judging from their morphology and accumulation late in the time course, we believe these are late-stage apoptotic cells.
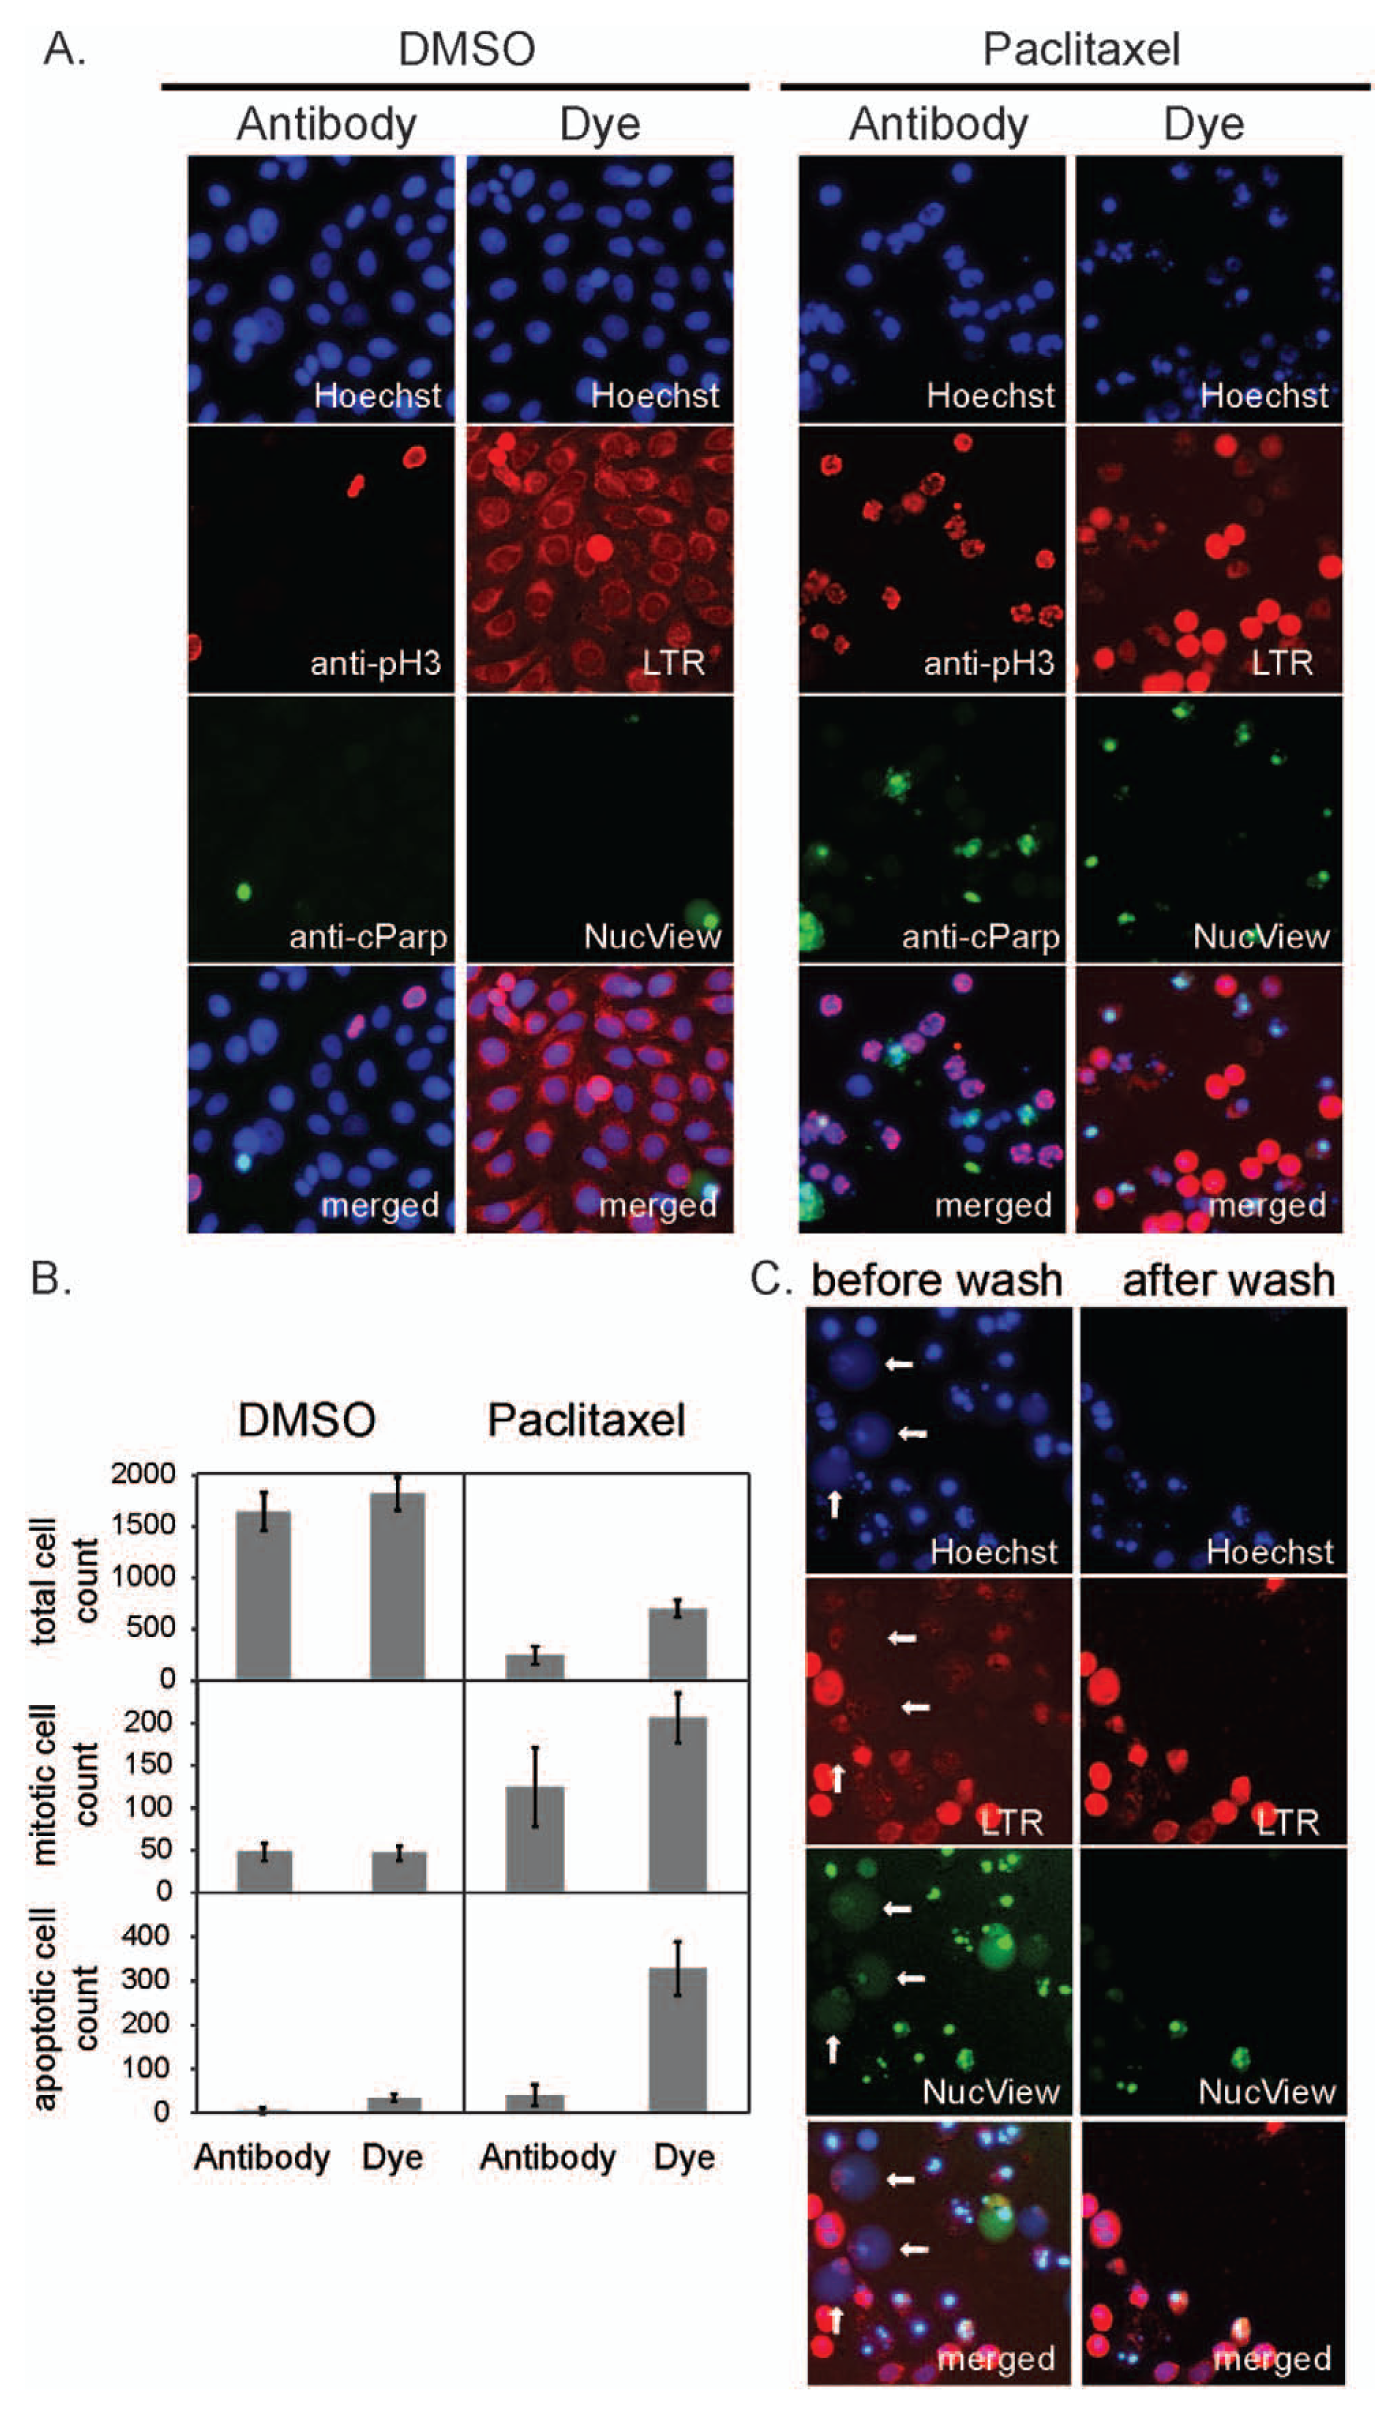
Comparison of antibody-based and dye-based assays using the human bladder tumor cell line 5637. (
Evaluation of Image Analysis Procedures
Having chosen the dye-based HCS assay, we next evaluated the reliability of our automated phenotypic scoring algorithms.
Figure 3A
shows representative images of 5637 cells treated with DMSO alone, 200 nM paclitaxel for 24 h, and 200 nM paclitaxel for 48 h alongside the corresponding segmented images. Different phenotypes are highlighted with different-colored outlines in segmented images: interphase cells in white, mitotic cells in red, early apoptotic cells in green, and late-apoptotic cells in yellow. To evaluate the scoring accuracy of the automated image analysis, we randomly picked 12 images under each treatment condition and manually counted cells of different phenotypes to serve as benchmarks. Results from automated analysis are compared side-by-side with manual scoring in
Figure 3B
for all three treatment conditions. Under all three conditions, the automated analysis gave very similar results to those from the manual scoring. We noted slight overcounting of interphase cells and undercounting of mitotic and apoptotic cells in the automated analysis compared with the manual scoring. We were able to determine the source of these errors (see
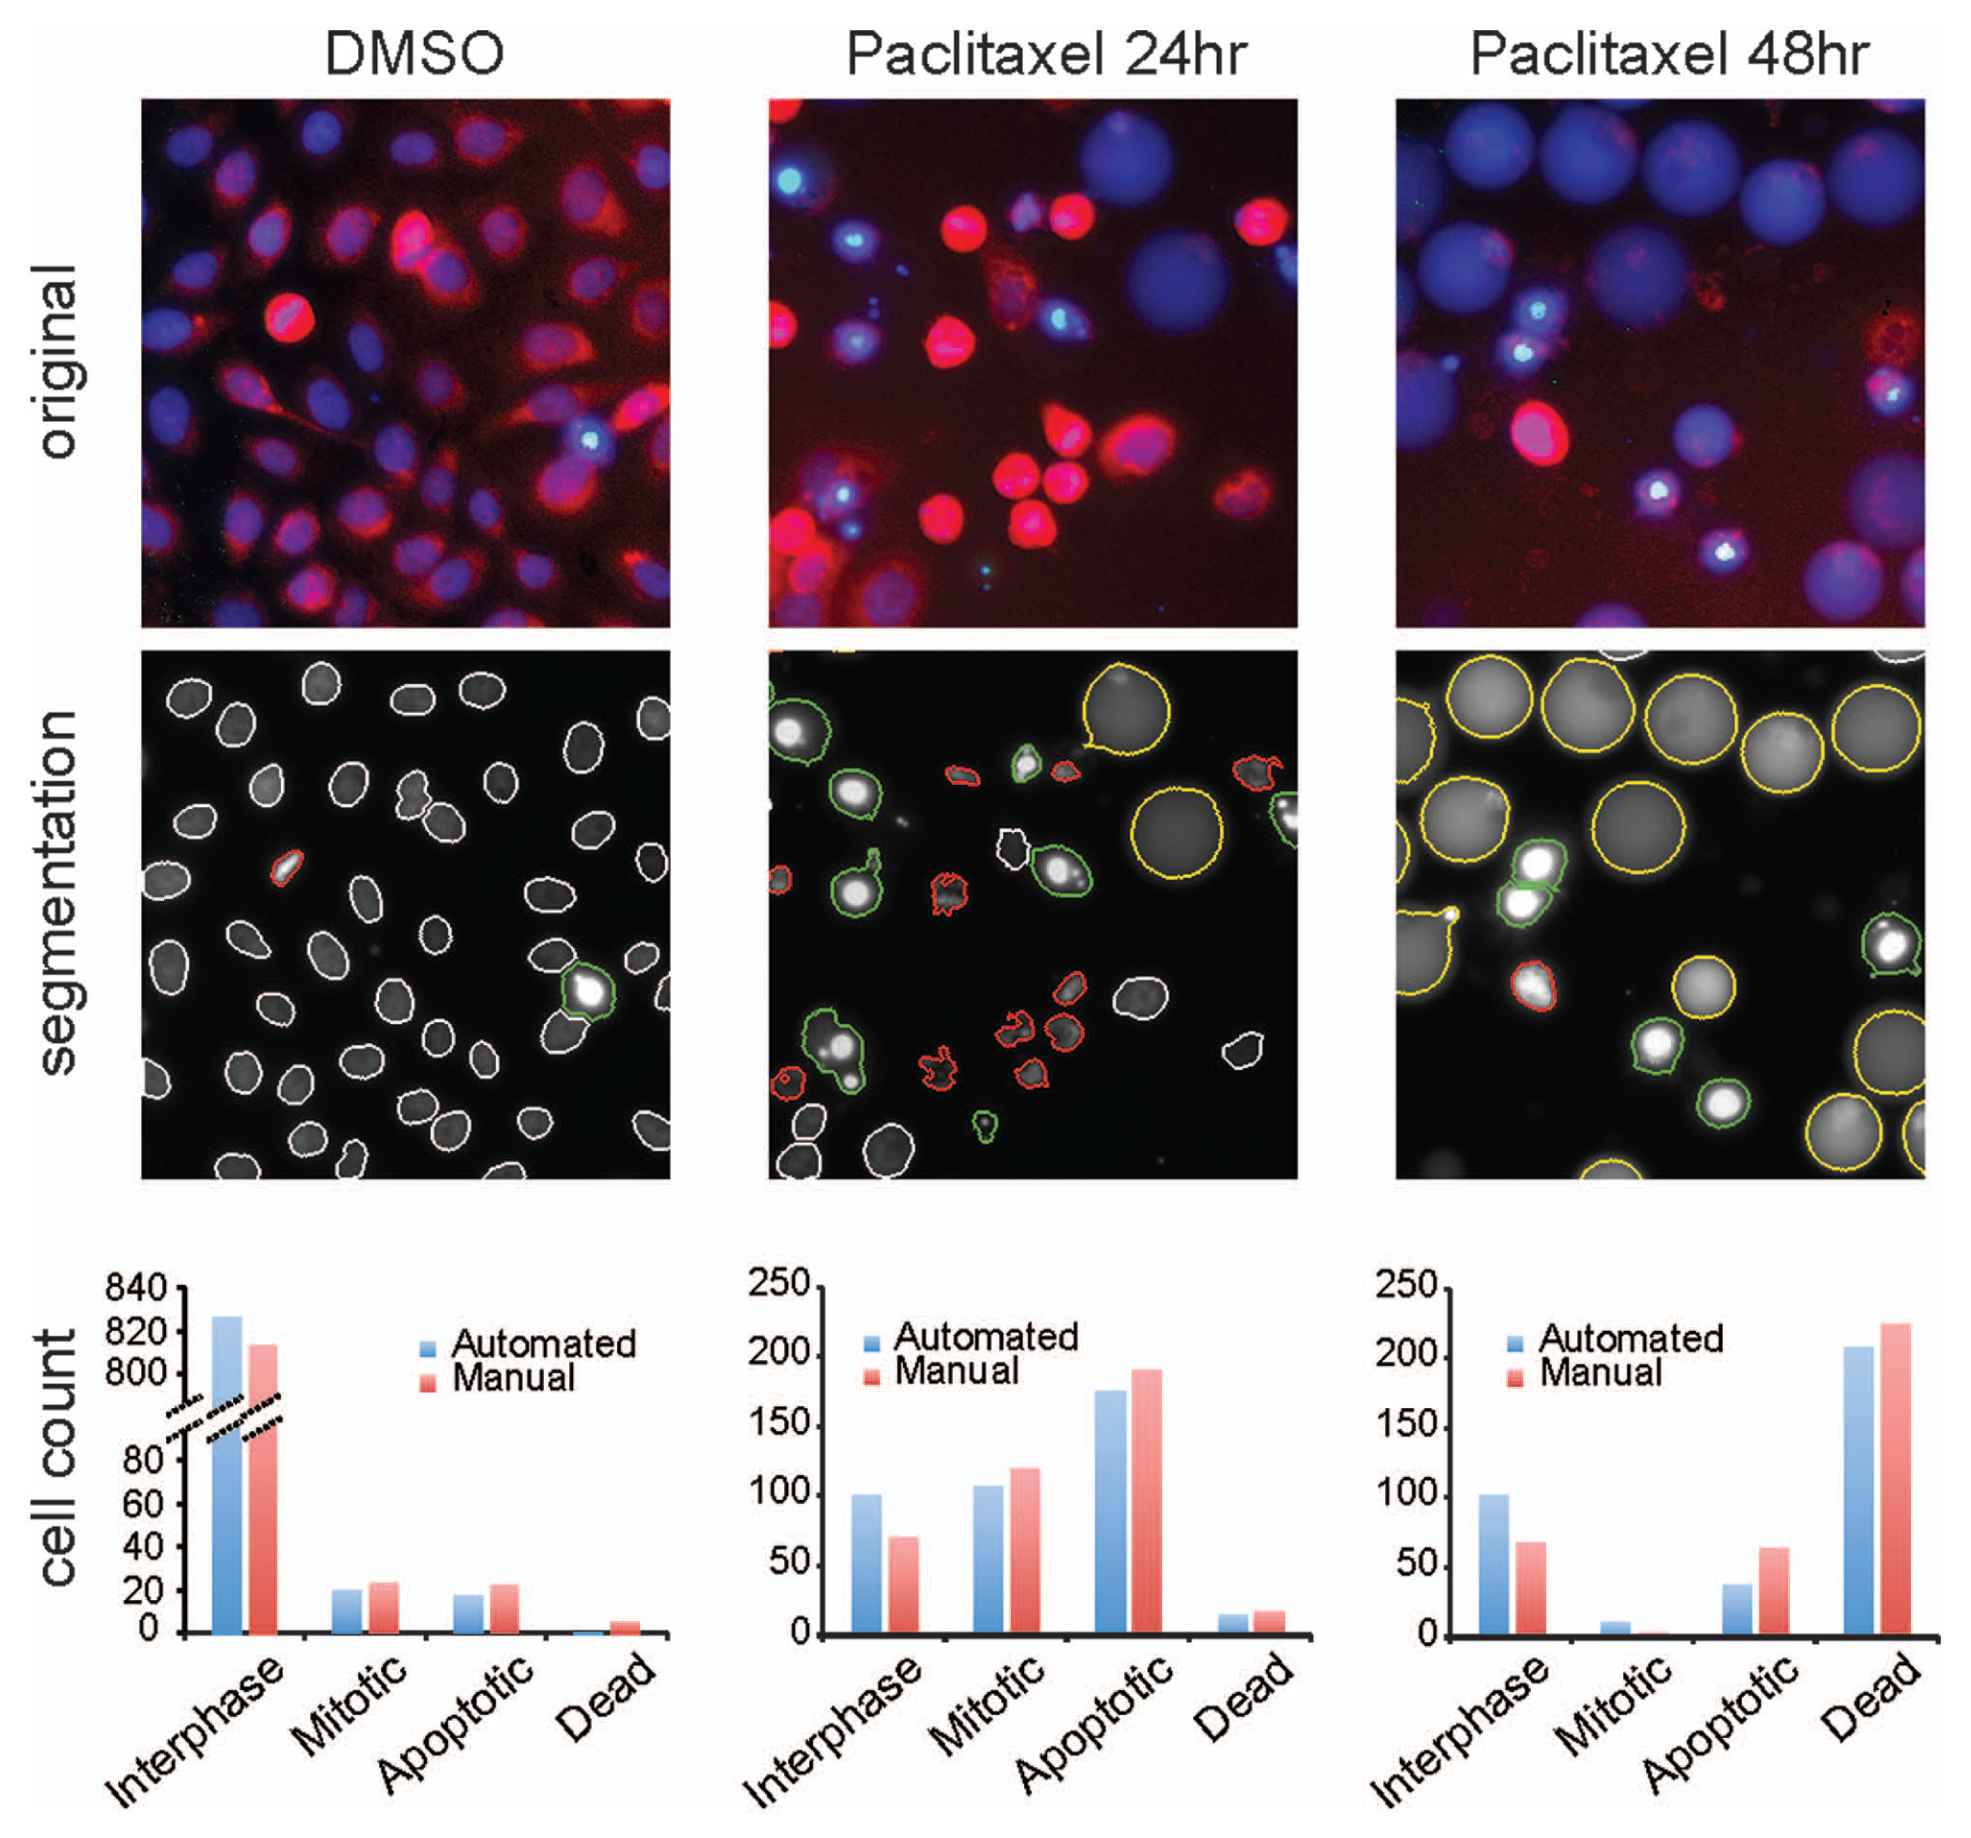
Segmentation results from our customized image analysis of the dye-based assay images. (
Multidimensional Pharmacological Response Profiles of Multiple Cell Lines
Thirty-three cell lines were chosen from the collection of the Center for Molecular Therapeutics at Massachusetts General Hospital
13
on the basis of differential responses to antimitotic drugs in a conventional 3-day survival assay and similar proliferation rates. Proliferation rate is a known determinant of response to antimitotic drugs.
14
We chose to minimize this source of variation in our cell line panel for simplicity. In principle, its contribution could be measured independently and corrected for, if desired, by extending the time course of the response assay for cells that grow slowly to time points longer than the 3-day time points used here. An important criterion in high-content analysis (HCA) is the ease of segmenting individual cells, which is more difficult in lines that tend to grow in clumps. Of the 33 lines initially selected, we were able to accurately score 20 (~60%) using our standard analysis protocol (
Seven antimitotic drugs were selected to represent mechanisms of action currently under clinical trial, including inhibitors of Polo-like and Aurora kinases and of Kinesin 5 (also called KSP). Paclitaxel, which stabilizes microtubules, was included as a reference compound. Cells were treated over a wide range of drug concentrations (0.06 nM−11 µM, 3-fold dilution series) in duplicate and assayed at three time points (24, 48, and 72 h after drug addition). The median doubling time of the lines was 24 h (range, 18–36 h), so the assay duration covers at least two cell cycles. Data for eight drugs across 33 cell lines were deposited in the Library of Integrated Network-based Cellular Signatures (LINCS) database (http://lincs.hms.harvard.edu/) for public download and analysis. In Figures 4 and 5 , we present a small snapshot of these data and discuss some of the interesting pharmacology they reveal.
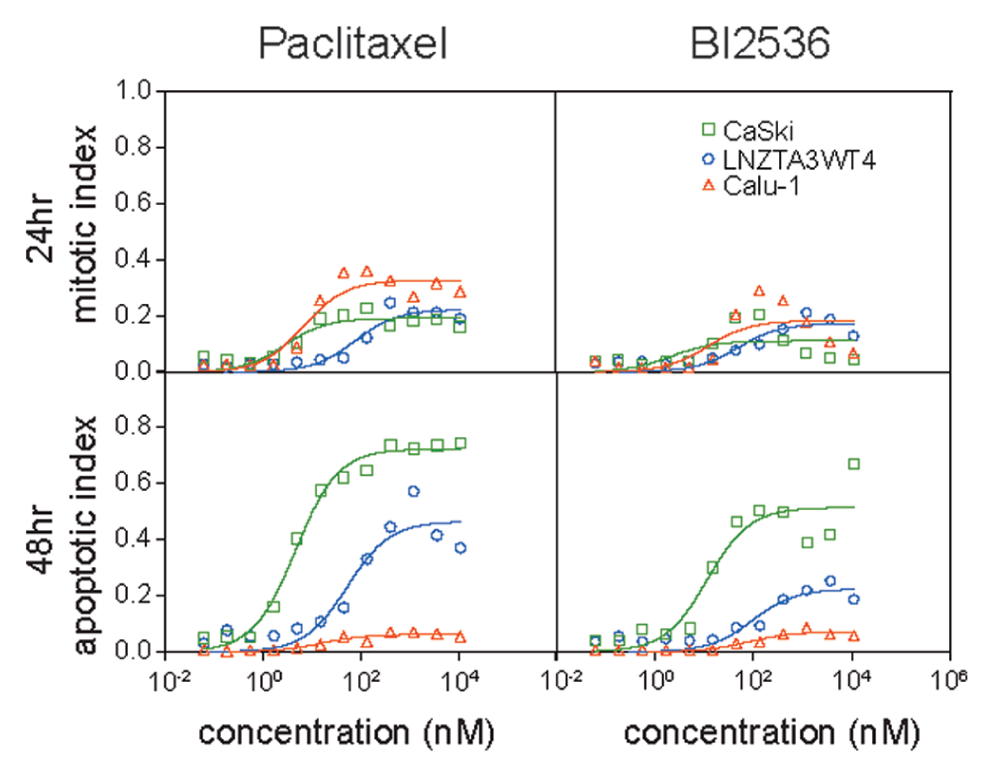
The 24-h mitotic index and 48-h apoptotic index dose-response curves of three cell lines (CaSki, LNZTA3WT4, and Calu-1) against paclitaxel (top) and BI2536 (bottom).
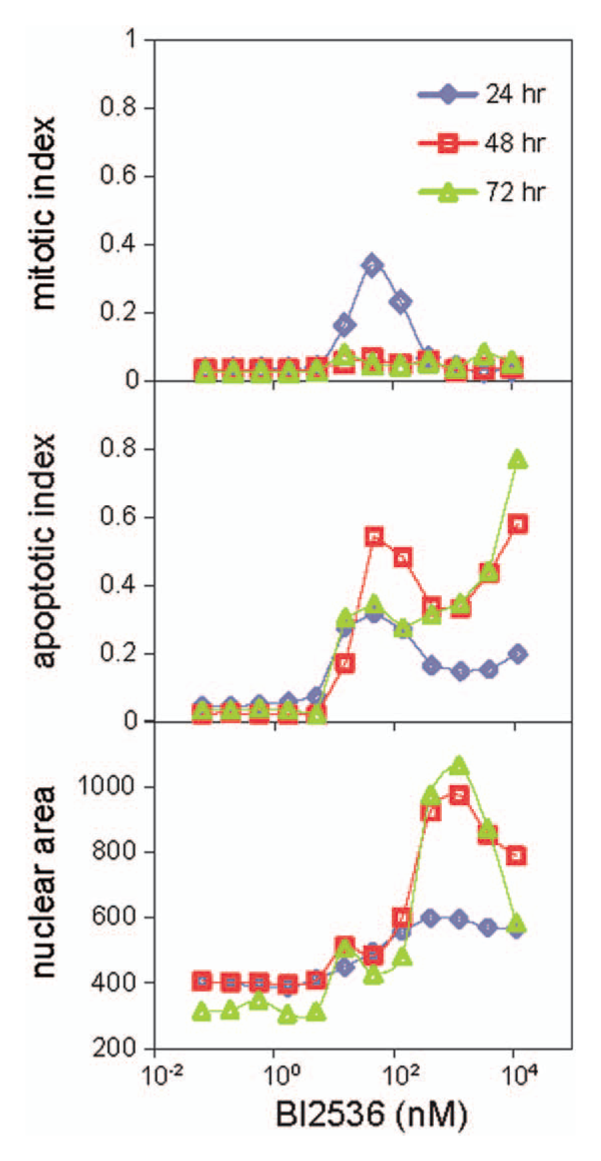
Mitotic index, apoptotic index, and nuclear area dose-response curves of 5637 cells treated with BI2536 for 24, 48, and 72 h.
Alternative Mechanisms of Compromised Drug Sensitivity
Figure 4
shows dose-response data for the 24-h mitotic index and 48-h apoptotic index in three cell lines (CaSki, LNZTA3WT4, and Calu-1) responding to paclitaxel and to BI2536, a potent and specific inhibitor of Plk family kinases.
15
These three cell lines were chosen for their diverse responses. Data were fitted to conventional sigmoid functions (see Materials and Methods), and from these fits we estimated EC50 and Emax values (
Off-target Physiology
Profiling BI2536, which primarily targets Plk1, Plk2, and Plk3,
19
revealed an unexpectedly complex dose response. Plk1 is required for the assembly of normal mitotic spindles, and Plk1 inhibition leads to prolonged mitotic arrest followed by apoptosis.19–21
Figure 5
shows mitotic and apoptotic indices for this drug in 5637 cells at three time points (24, 48, and 72 h). Similar data were seen in other lines (see data deposited at http://lincs.hms.harvard.edu/). These curves look quite different from the conventional sigmoidal-shaped curves. The dose response for the mitotic index at 24 h is strongly bell shaped, with the highest mitotic index at ~50 nM. Apoptotic indices at all three time points also reach a peak at ~50 nM, then decrease as concentration increases, followed by a second rise at the highest two concentrations (3.7 µM and 11.1 µM). From the dose-response curves of mean nuclear areas of interphase cells in
Figure 5
, it appears that within the concentration range between 100 nM and 1 µM, where mitotic and apoptotic indices dip, the nuclear areas of interphase cells increase. To further investigate this unexpected dose-response behavior, we carried out phase-contrast time-lapse imaging on 5637 cells treated with the same concentrations between 10 nM and 1 µM as used in
Figure 5
, along with DMSO control. We manually counted and scored cells that were in interphase, mitosis, and apoptosis at 24- and 48-h time points and plotted the dose-response curves for mitotic and apoptotic indices in
Discussion
Cell-based HCS has gained popularity in drug discovery in recent years due to the rich information it reveals about cellular response and low per-well cost. It is obviously useful for antimitotic drugs, where mitotic arrest provides an activity biomarker upstream of cell death. However, similar upstream biomarkers (DNA damage markers, kinase substrate phosphorylation markers, etc.) could be substituted in protocols assaying cancer drugs with different mechanisms. We compared two marker combinations for profiling antimitotic drug responses, using antibodies versus cell-permeant dyes. The dye-based assay was clearly superior in its ability to quantify apoptosis, due to loss of weakly adherent dead cells during the washes needed for the antibody method. This advantage outweighed the potentially greater molecular specificity of the antibody method for identifying mitotic cells. Cell morphology and staining intensity in the LysoTracker channel were sufficient to accurately identify mitotic cells in all the lines we tested. In addition, LysoTracker-Red enabled scoring of late-stage apoptotic cells. These comprised >30% of the cell population under certain conditions (e.g., CaSki treated with paclitaxel at 137 nM or higher) and would likely be underscored by other methods, particularly any that requires wash steps.
A common challenge to automated image analysis is the clumping or clustering behavior of certain cell lines, which normally results in poor image segmentation and therefore poor statistics. (Images from a typical well-behaved cell line and a clumpy cell line are shown in
Our assay provided far more details on drug response than a conventional 3-day survival assay, as illustrated by the examples in
Figures 4
and
5
. Perhaps the most obvious benefit of this new assay is that it provides information that allows discrimination of different mechanisms of compromised drug sensitivity due to right shifts on the dose-response axis versus lack of apoptosis, despite good response with an upstream biomarker (in our case, mitotic arrest). The former might result from drug efflux pumping, the latter from changes in expression of Bcl2 family members, although many other molecular causes are possible. These are fundamentally different mechanisms, and the steps one might take to combat them in the clinic are quite different. It is possible, in principle, to discriminate these alternative mechanisms that affect drug sensitivity in conventional 3-day cell survival assays by careful measurement of Emax and EC50, as well as testing whether the cell count at 3 days goes below the initial seeding density. In practice, it is difficult to design experiments that robustly monitor these parameters. The key diagnostic for compromised drug sensitivity due to drug efflux or related mechanisms was that all aspects of the response increase in parallel by increasing drug concentration (e.g., LNZTA3WT4 in
Fig. 4
). The key diagnostic of compromised drug sensitivity due to lack of apoptosis is that an upstream biomarker, in this case mitotic arrest, exhibits typical EC50 and Emax values, whereas Emax for apoptosis is drastically depressed (e.g., Calu-1 in
Footnotes
Acknowledgements
We thank the Massachusetts General Hospital Center for Molecular Therapeutics and especially Ah T. Tam for providing cell lines, as well as the ICCB-Longwood Screening Facility at Harvard Medical School for screening supplies and support. We are grateful to the Nikon Imaging Center at Harvard Medical School for providing microscopes and excellent support.
Declaration of Conflicting Interests
The authors declared no potential conflicts of interest with respect to the research, authorship, and/or publication of this article.
Funding
The authors disclosed receipt of the following financial support for the research, authorship, and/or publication of this article: This work was supported by the National Institutes of Health LINCS program, grant 1U54HG006097-01.
References
Supplementary Material
Please find the following supplemental material available below.
For Open Access articles published under a Creative Commons License, all supplemental material carries the same license as the article it is associated with.
For non-Open Access articles published, all supplemental material carries a non-exclusive license, and permission requests for re-use of supplemental material or any part of supplemental material shall be sent directly to the copyright owner as specified in the copyright notice associated with the article.