
Abstract
Small-molecule screens are an integral part of drug discovery. Public domain data in PubChem alone represent more than 158 million measurements, 1.2 million molecules, and 4300 assays. We conducted a global analysis of these data, building a network of assays and connecting the assays if they shared nonpromiscuous active molecules. This network spans both phenotypic and target-based screens, recapitulates known biology, and identifies new polypharmacology. Phenotypic screens are extremely important for drug discovery, contributing to the discovery of a large proportion of new drugs. Connections between phenotypic and biochemical, target-based screens can suggest strategies for repurposing both small-molecule and biologic drugs. For example, a screen for molecules that prevent cell death from a mutated version of superoxide-dismutase is linked with ALOX15. This connection suggests a therapeutic role for ALOX15 inhibitors in amyotrophic lateral sclerosis. An interactive version of the network is available online (http://swami.wustl.edu/flow/assay_network.html).
Keywords
Over the past 10 years, the academic drug discovery landscape has undergone several dramatic changes. One of the most important of these changes is the increase in publicly available data from the early stage of drug discovery. In particular, the availability of small-molecule screening data through PubChem 1 —with data generated from efforts funded by the National Institutes of Health and some industry contributors—is exciting because, together, phenotypic and target-based small-molecule screens are responsible for 90% of recently approved, novel medicines with small-molecule active ingredients. 2
One long-range goal of the academic screening enterprise is to develop novel treatments for human disease. The most advanced of these efforts has discovered a novel, orally available, selective, and potent sphingosine-1-phosphate receptor agonist. This molecule, designated RPC1063, induces lymphopenia in animal models, entered human trials in 2012, and is being investigated as a treatment for multiple sclerosis. 3 Although this example is encouraging, public screening should be evaluated by more than its success in bringing drugs to market.
In addition to academics’ drug discovery projects, the public nature of their data has directly contributed to several advances in screening science. For example, several substructures common to promiscuously active molecules have been identified, placed in the public domain, and are now commonly filtered from hit lists. 4 Likewise, public data enable the direct comparison of competing methods of selecting hits from primary screens. 5 Similarly, it enables academics to propose and test improvements to screening experiment design. 6
Nonetheless, public screening data remain largely untapped for several reasons. First, simple analysis is thwarted by systematic sources of error, such as promiscuously active molecules and other artifacts.4,7 Second, most screens are not cleanly annotated, making it difficult to identify retrospectively interesting screens or place them in appropriate biological context.8,9 Third, there is substantial ascertainment bias in screening data, because assays are often run on substantially different libraries. Fourth, previous efforts have focused on the target-based screens instead of phenotypic screens. In this analysis, we propose a new method for overcoming these barriers and incorporating phenotypic data by using a robust measure of similarity between assays to create a global view of all screening data.
We construct an Assay Network, which plots each screen as a node. Nodes are connected when they are strongly correlated. As we will see, the network elucidates the relationships between a large number of seemingly unrelated screens and organizes them into a global structure covering a large swath of studied chemical biology ( Fig. 1 ).
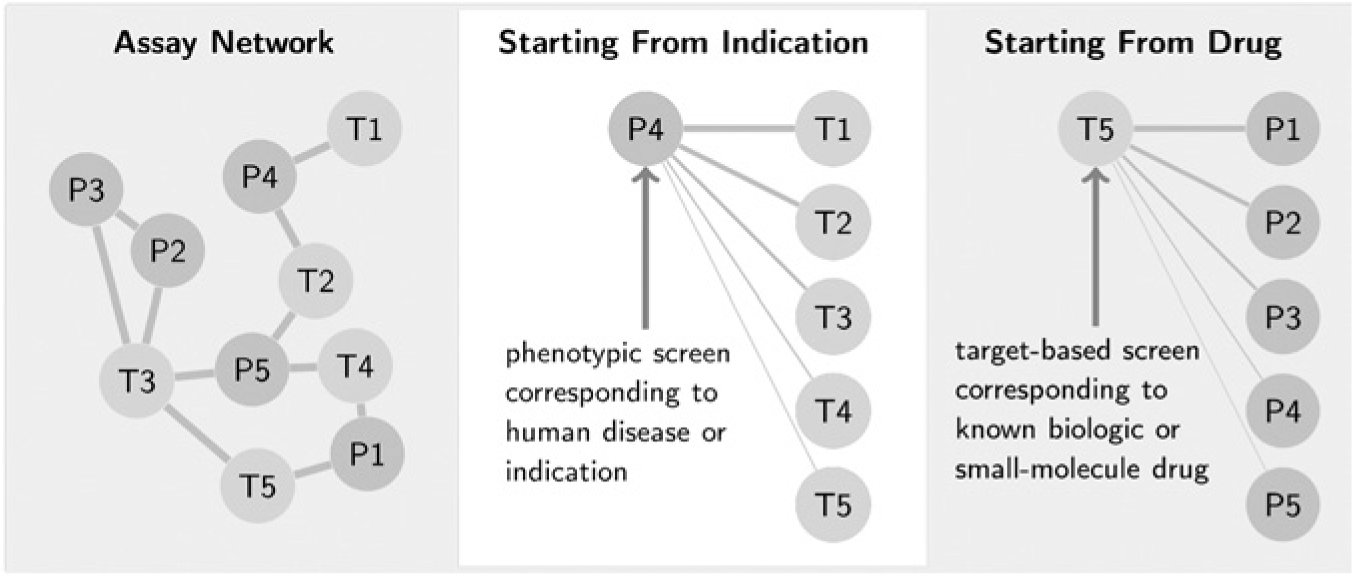
Our approach generates a correlation between all the screens in a database. (
Materials and Methods
Data
In this analysis, we focus on the large screening data sets in PubChem—those that test at least 5000 molecules. This provides 1581 screens with a unique PubChem Assay ID and on average 89,631 molecules tested in each screen.
The data associated with each screen are a table, where each row corresponds to a molecule tested in the screen. Each molecule is associated with two values, the PubChem Outcome and the PubChem Score. The outcome labels molecules as active, inactive, or inconclusive. For our purposes, inconclusive molecules are considered inactive. The score assigns an integer value to each molecule that is supposed to correlate with the assay’s readout. There are on average 1006 actives in each screen.
Considering just these assays, several molecules are promiscuously active, meaning they are labeled as actives in a large fraction of the assays in which they are tested ( Fig. 2 ).
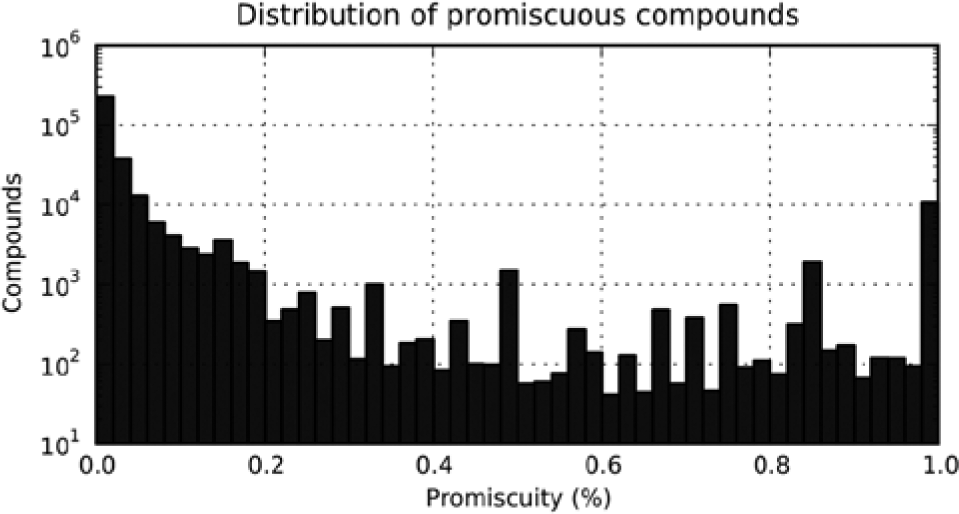
Prevalence of promiscuity. This histogram plots, on a log scale, the distribution of molecules according to their promiscuity on the x axis. Molecules are binned by their promiscuity, the fraction of screens in which they are active. There are tens of thousands of molecules that are promiscuous and active in more than 10% of assays. Appropriate correlations should down-weight or ignore these promiscuous molecules because they do not convey biologically important information about the relationships between screens.
Correlations and Networks
This study measures the similarity between two assays (X and Y). Two assays are similar when the same molecules are active in both assays. Central to this approach is the choice of an appropriate measure of correlation between screens. The idea here is that if two assays tend to give the same readout for a large number of molecules, then there is likely a strong relationship between them. Perhaps both assays are testing for inhibition of similar proteins or are interrogating closely related cellular pathways. We assess two ways of scoring the correlation between screens and also introduce an adjustment that improves both correlations. In all cases, we implemented these scores using the Python programming language.
Pearson Correlation
Some have proposed using Spearman and Pearson correlations to measure the similarity between screens, 10 and we use it in this study as a baseline method against which to compare our work. In our results, Spearman and Pearson correlations produced nearly identical results. In the interest of clarity and brevity, we have included only results from Pearson correlation (PC). Using the activity of molecules in each screen, we can compute the PC between a pair of assays X and Y as
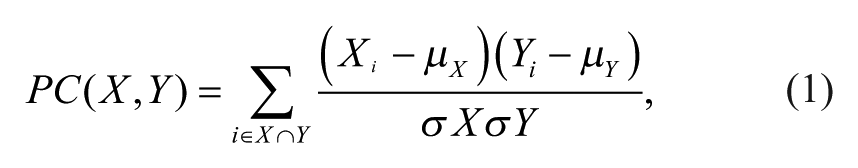
where i iterates over all the molecules that are tested in both X and Y, X i and Y i are the activity of the ith molecule in each screen, µX and µY are the mean activities of the molecules tested in both X and Y, and σX and σY are standard deviations of activities of the molecules tested in both X and Y. The mean and standard deviation terms are computed over all the molecules in common between screens X and Y, so they will be different for every pair of assays. PC is undefined when there are no molecules in common between X and Y.
Promiscuity-Adjusted Correlation
In place of the Pearson correlation, we propose the promiscuity-adjusted correlation (PAC). In contrast with related measures that others have proposed,10–12 PAC accounts for both promiscuously active molecules and ascertainment bias. Furthermore, and in contrast with PC, the PAC focuses on the molecules annotated as actives by the screeners. Relying on the annotated activity focuses the correlation on the most salient information and dampens the influence of artifactual correlations between screens.
Our idea with PAC is to extend the term-frequency inverse-document-frequency (TF-IDF) score, which is frequently used to measure the similarity between text documents, 13 so as to work with assay data.
Using the activity outcome of each molecule (whether it is labeled as active or inactive), we can compute the PAC between assays that down-weights the molecules that are active in several assays. We compute the promiscuity-adjusted weight of each molecule as

where Pi is the promiscuity of the ith molecule, Ti is the number of screens in which it is tested, and Ai is the number of screens in which it is labeled active. The PAC between two assays X and Y is defined as
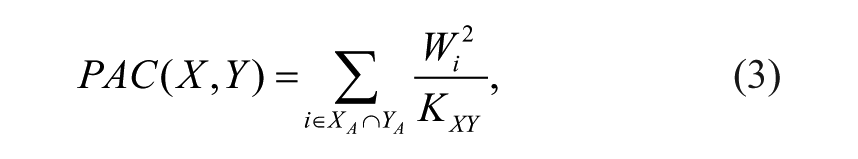
where i ranges over the molecules active in both X and Y designated XA and XB and KXY is a normalization constant that scales PAC to range from 0 to 1. The normalization constant is specific to a pair of screens and is defined as
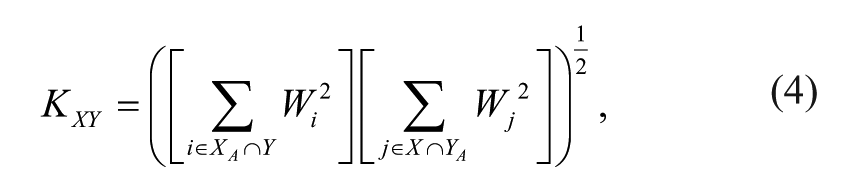
where i ranges over the molecules tested in Y (regardless of the outcome) and found to be active in X, whereas j ranges over the molecules tested in X (regardless of the outcome) and found to be active in Y. PAC is undefined when no active molecules from one assay have been tested in the other.
Neighborhood Adjustment
As an additional filter, we propose using a neighborhood adjustment (NA). A few assays often dominate assay networks constructed using PC and PAC. The effect of these strongly connected assays is reduced by applying a NA to the pairwise correlations computed across the data set. The neighborhood-adjusted correlation between X and Y is defined as the percentile rank of the correlation between X and Y among its neighboring correlations. The neighboring correlations are all the correlations (excluding the undefined correlations) in the full pairwise comparison of the data that include either X or Y. If the adjusted correlation is 1, the unadjusted correlation is the highest correlations of its neighbors. If the adjusted correlation is 0.7, then the unadjusted correlation is greater than 70% of its neighbors. In practice, a cutoff on this correlation can be tuned to generate graphs with the desired edge density, but for the purposes of this study, we use the top 700 edges. The NA can be applied to any correlation, and we use it to generate NA versions of both PC (abbreviated as NA-PC) and PAC (abbreviated as NA-PAC).
Network Construction
We constructed all networks by connecting nodes if their edges correspond to the top 700 most correlated pairs. We considered other methods, all of which produced similar results. Seven hundred was empirically determined to be a reasonable number of edges to use so as to produce intelligible networks across all correlation types. If the number of screens were to increase, we would expect the number of edges required to increase. Optimal selection of the number of edges, however, is beyond the scope of this study and left for future work.
The networks were visualized using the freely available software Cytoscape 2.7.0. Coordinates for visualization were computed using the Organic layout engine. Edges were colored by whether the two assays they connect are in the same project. The project membership of each assay was determined using the method published by Calhoun et al. 8 The width of each edge scales with the number of molecules active in both assays it connects. For clarity, unconnected nodes are removed from the networks displayed in the main document.
Results and Discussion
We assess our assay networks with both qualitative and quantitative studies. Quantitatively, we should see some statistical correspondence between the networks and annotations of the assays in the network (covered in the Quantitative Assessment section). Qualitatively, the assay network should be capable of highlighting connections, which expose important biology that would not otherwise be obvious from the data (covered in the Biological Results section). For reference, the complete pairwise correlation matrices are included in the supplementary information. These matrices are indexed by PubChem Assay ID and in a tab-delimited file.
Biological Results
Assay networks were constructed connecting nodes when they were highly correlated. We considered several different methods of deciding the appropriate cutoff over which to consider edges “highly” correlated. Ultimately, the method that produced the most consistent results was to use the 700 edges with the highest correlation. In the online version of the network (accessible at http://swami.wustl.edu/flow/assay_network.html), networks are colored so that edges between assays in the same screening campaign are colored blue and between those in the different campaigns are red.
Pearson Correlation
This approach ignores several systematic sources of error in screening data. Unsurprisingly, Pearson correlation does not produce a meaningful network of assays ( Fig. 3 ). The network is dominated by a few large clusters of viability and wavelength-specific counterscreens. One of these clusters consists exclusively of viability screens of the National Cancer Institute’s panel of 60 cancer cell lines (NCI60). The NCI60 are, of course, closely related to one another, but in an obvious and noninteresting way. They all identify molecules that are toxic, and they all test the same set of molecules that tend to be toxic.
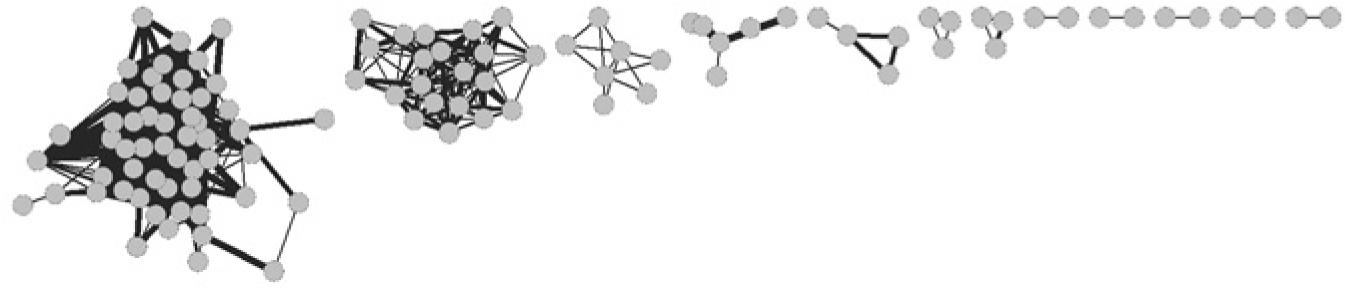
The Assay Network constructed by the Pearson correlation. For clarity, hundreds of unconnected assays are not included in the figure. The largest cluster of assays all test molecules for cytotoxicity against different members of the National Cancer Institute’s panel of 60 cancer cell lines. This grouping is accurate in the sense that these assays are related to one another. However, they are also noninformative because they do not expose any useful biological relationships. In fact, none of the large groups of assays revealed any biology.
Promiscuity-Adjusted Correlation
Encouragingly, PAC does seem to yield a more meaningful network, generating a more informative structure instead of clumping assays into unintelligible balls ( Fig. 4A ). The NCI60 cluster is still present, but it does not entirely dominate the network. As we will see, this network recapitulates known biology and suggests novel hypotheses directly relevant to drug design and development.
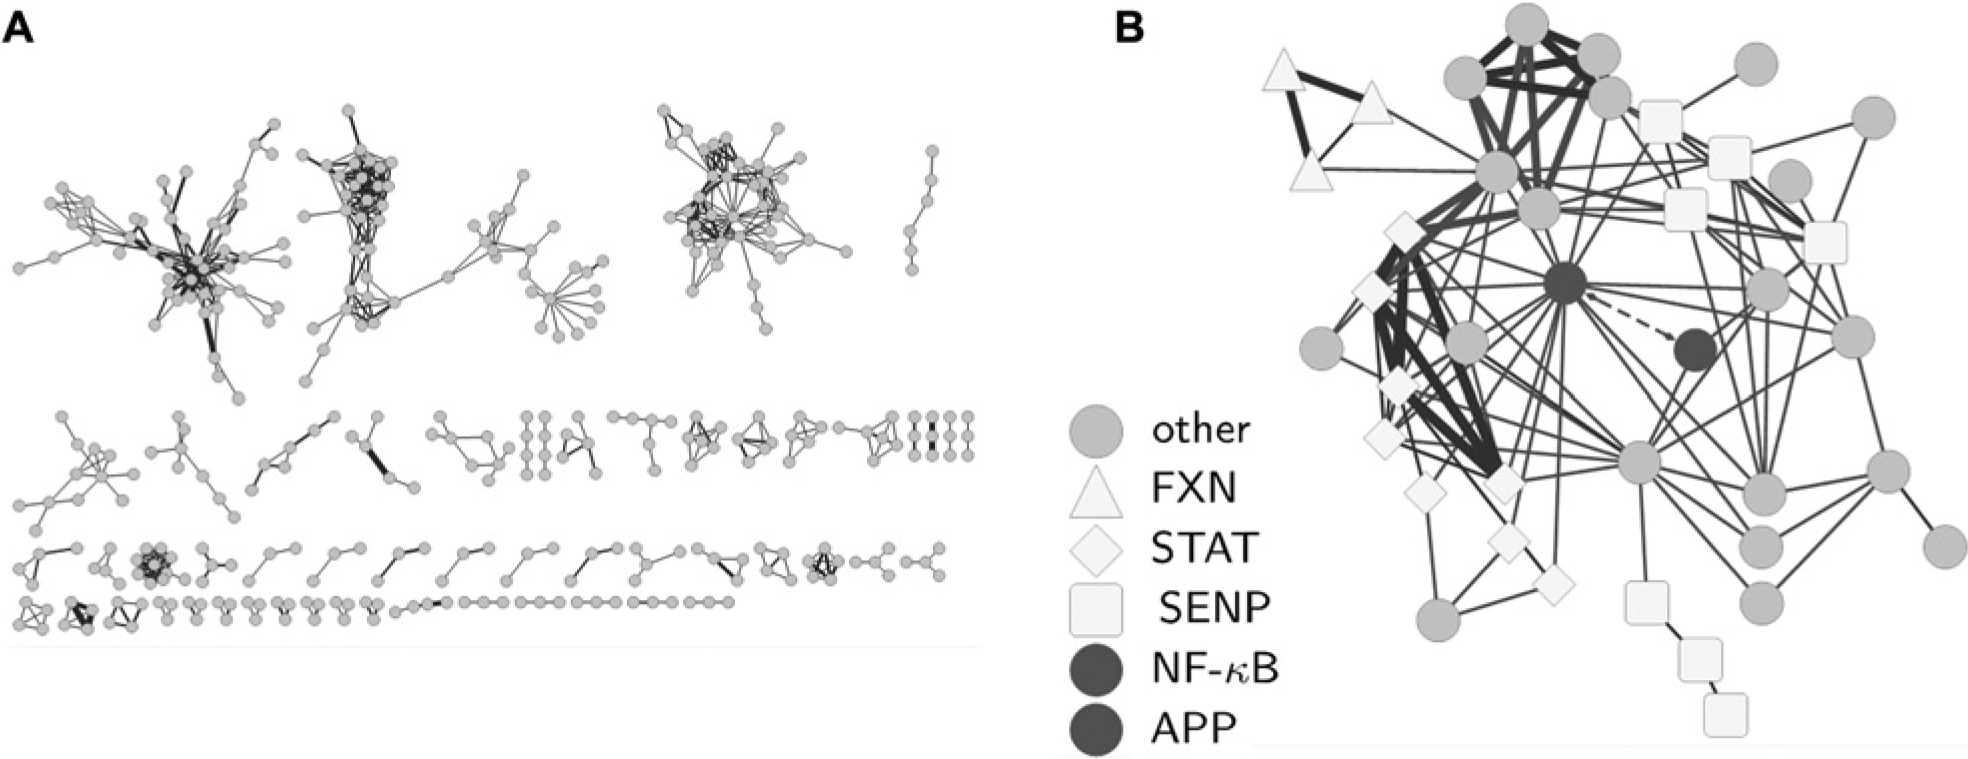
The Assay Network constructed by the promiscuity-adjusted correlation (PAC). (
Specific molecules underlie each connection in the network. For each connection, nonpromiscuous molecules are active in both the assays they connect. This can happen in several biologically important scenarios. First, the connections in the network can identify novel polypharmacology (i.e., the ability of specific classes of molecules to interact simultaneously with multiple proteins). This is because biochemical assays of proteins with structurally similar binding sites will identify some of the same molecules as active and, consequently, will be connected in the network. Isozymes of the same protein have structurally similar binding sites, but sometimes otherwise unrelated proteins also interact with the same molecules.12,14
Second, connections in the network can yield mechanistic insight into phenotypic assays. If, for example, inhibiting a protein in a cellular system appropriately changes the behavior of cells in phenotypic assay, the biochemical assay for inhibitors of the protein can identify the same molecules as the phenotypic assay.
There are, of course, other less interesting reasons why assays are connected. Determining the exact reason for specific connections usually requires additional experimental inquiry. Nonetheless, unexpected connections in the network expose provocative experimental data points that are often missed. The key contribution of this strategy is to bring to the surface these data, so that the most compelling connections can be further investigated.
Confidence in the strength of this approach is built by assessing the plausibility of connections in the network. For example, a subnetwork in the PAC Assay Network links several assays together, many of which are clusters of closely related proteins ( Fig. 4B ). There are several sentrin-specific protease (SENP) isozyme inhibition assays, several frataxin activation assays, and signal transducer and activator of transcription activation assays. First, most assays of the isozymes of the same protein are connected to one another. This is sensible because isozymes of the same protein often have very similar binding pockets.
Second, some of the connections between different protein families can be explained by known biological mechanisms of action. For example, in the center of the subnetwork is a connection between activators of amyloid precursor protein (APP) expression and nuclear factor kappa-light-chain-enhancer (NF-κB) activation, a well-supported relationship from the literature.15–17 Cleaved APP stimulates NF-κB production in cells. So, it is expected that molecules that activate APP production would also activate NF-κB expression. This is exactly what the data show and why the APP and NF-κB assays are connected in the network. There are also reports that link small-ubiquitin-like modifiers—regulated by SENP enzymes—to neurodegeneration and Alzheimer disease.18,19
Another subnetwork links the flap endonuclease 1 (FEN1) and DNA polymerase β (POLB) inhibition assays (not called out in the figure). Most of the molecules that inhibit both proteins are flavonoids, a class of plant-derived molecules already known to inhibit DNA polymerase. 20 This link, therefore, suggests that flavonoids are a class of molecules that can inhibit both POLB and FEN1—two enzymes required for cell proliferation—and dual inhibition of these two enzymes might be the mechanism of some flavonoids’ anticancer activity. 21
Neighborhood Adjustment
To further refine the PAC network by preventing highly related data sets, such as the NCI60, from dominating the network, we also explored using an NA to the computed correlations ( Fig. 5A ). The basic idea is to normalize each correlation to be on the same scale as other correlations nearby in the network. This adjustment connects more nodes to the networks and prevents a few hubs from dominating the view. Encouragingly, the strongly connected NCI60 cluster is entirely absent in both the NA-PAC and N-PC networks, serving as an excellent negative control. Likewise, we observe that NA tends to down-weight counterscreens designed to identify seemingly active molecules that are artifacts of the assay.
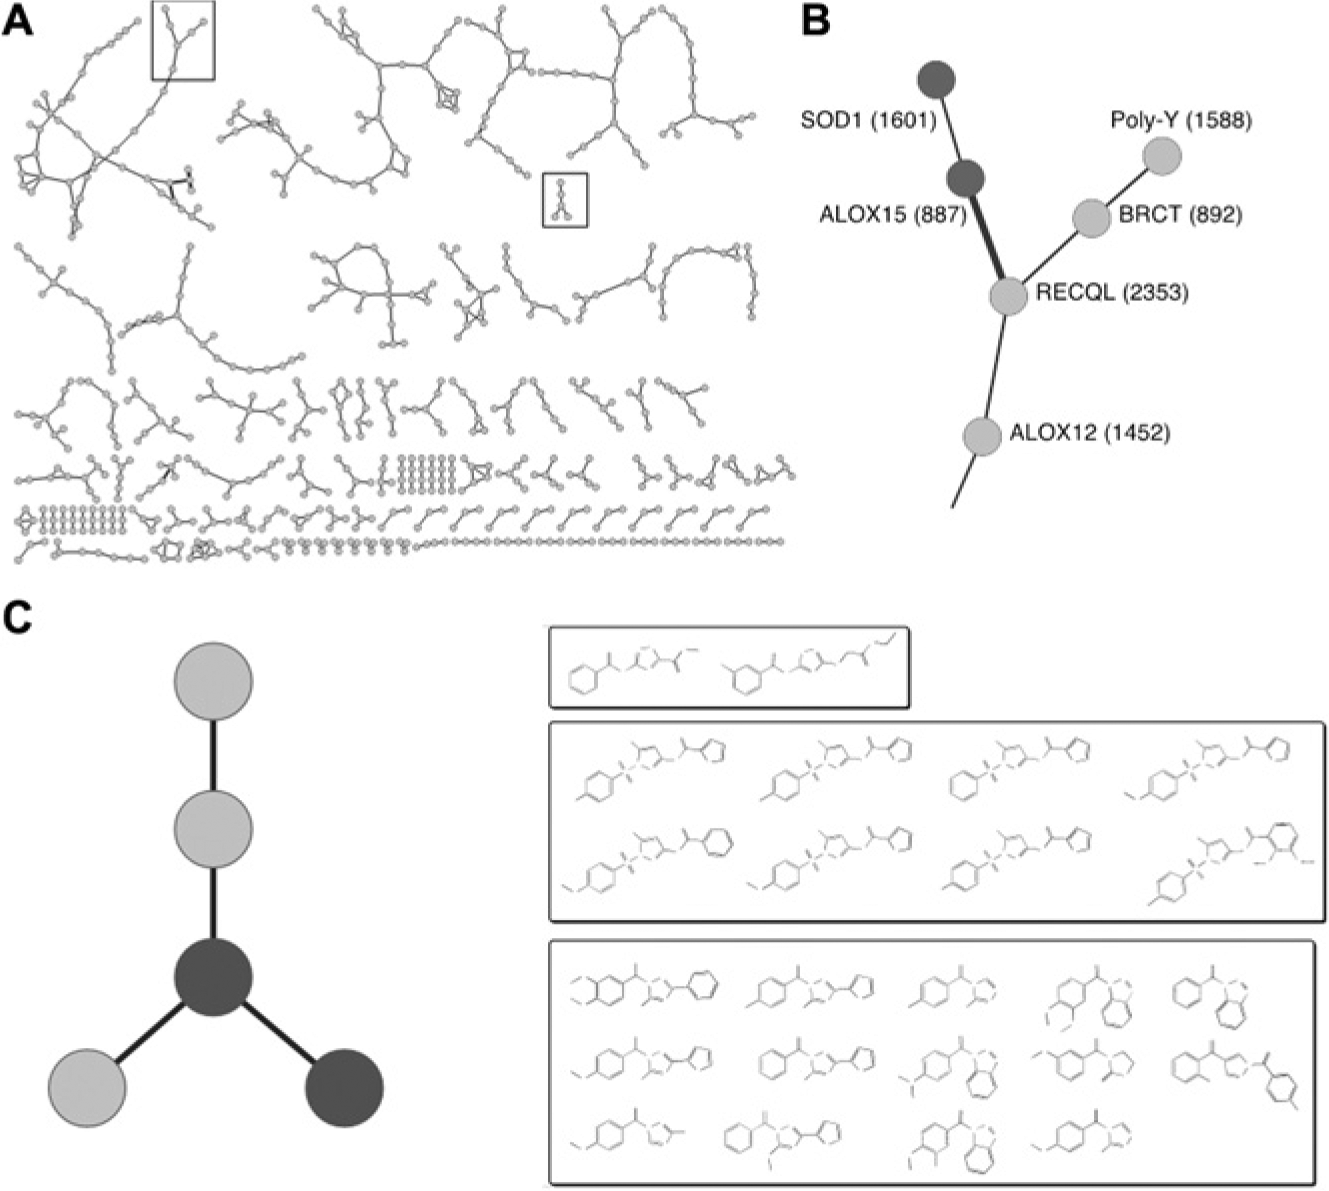
The Assay Network constructed by the neighborhood-adjusted promiscuity-adjusted correlation (NA-PAC). (
This improved network exposes several interesting relationships. For example, a screen for molecules that prevent cell death from a mutated version of superoxide-dismutase 1 (SOD1) is linked with a screen for 15-human lipoxygenase (ALOX15) inhibitors ( Fig. 5B ). This connection suggests a therapeutic role for ALOX15 inhibitors in amyotrophic lateral sclerosis, a condition thought to be caused by SOD1-mediated cell death. Encouragingly, both ALOX15 and SOD1 are connected to free-radical generation and clearance, and at least one animal study using an ALOX15 inhibitor seems to support this hypothesis, 22 and the one molecule active in both of these small screens, geraniol, is structurally very similar to the natural substrates of ALOX15. This connection is made despite only one active molecule, for two reasons. First, only 662 molecules are tested in both screens, and only 32 are found to be active, which is 1 active in common more than the number expected by chance. Second, geraniol is not promiscuous: although tested in hundreds of assays, it is active only in the ALOX15 and SOD1 screens.
Likewise, the network connects an assay for inhibitors of histone deacetylase 3 (HDAC3) with an assay for kallikrein-related peptidase 5 (KLK5) inhibitors ( Fig. 5C ). These are two biochemical screens, and the network highlights the existence of a class of molecules that might simultaneously inhibit both HDAC3 and KLK5 in these assays. Molecules with this property might be therapeutically useful. HDAC inhibitors are being investigated for several purposes, including use as either anti-inflammatory 23 or antineoplastic 24 agents. KLK5 is thought to regulate skin desquamation 25 and also promote tumor metastasis. 26 If this link is not an artifact of the assays, perhaps simultaneously inhibiting HDAC3 and KLK5 with a single molecule would be both feasible and desirable in the setting of some cancers or immune-related desquamation such as psoriasis or eczema.
Our confidence that this is an informative connection increases because the molecules active in the KLK5 and HDAC3 assays share the same molecular scaffolds ( Fig. 5C ). Likewise, molecules that support a connection in the network typically have extremely high structural similarity (data not shown). This similarity supports the belief that a chemical structure–driven mechanism lies beneath many connections. Furthermore, because chemical structure is not used to make connections, this similarity is an independent validation of the network.
Quantitative Assessment
Quantitatively assessing these networks is difficult. There is no gold standard by which the accuracy of connections can be judged. A fundamental problem is that screens are often complex, and the exact details of their assays (which are poorly documented) have a large impact on whether or not it is expected for two screens to share active molecules.
We investigated using GO-term enrichment, KEGG pathways, or protein-interaction data to assess network quality, but it was not feasible. Even though two proteins share the same KEGG pathway or interact with one another, it is entirely possible (even likely) that separate assays based on these proteins’ inhibition or activation will identify different molecules. Common protein annotations do not imply common actives. Rather, we would expect molecules to be active in two assays only if the binding sites of the proteins are similar, a feature not well captured in these annotations.
The complexity of screens is a fundamental barrier to automated assessment. For example, one screen was titled as a phosphodiesterase 4 (PDE4) inhibition screen. The title implies it is a simple enzyme inhibition assay, but this is incorrect. Rather, the free-text description indicates that this screen actually uses a cell-based assay for increased levels of cyclic AMP (cAMP). In this screen, active molecules could interact with PDE4 or any other members of the cAMP pathway. Complexities like this are common across most of PubChem, so deciding a priori if two screens should be connected is difficult, requiring a manual reading of the assay description by biological experts.
We did find one way of assessing networks using campaign groupings. Screening campaigns often execute multiple assays, and assays from the same campaign often have strong, known relationships to one another. For example, they may test molecules against several isozymes of the same protein or a cluster of related phenotypes. Campaign groupings are at best a “bronze standard,” but we can reliably extract them from PubChem, 8 and we expect a good network would connect assays from the same campaign.
One way of quantitating the performance of a scoring metric using campaign groups is with the area under the receiver-operating characteristic (ROC) curve (AUC) metric. ROC curves order all assay pairs in a network by their correlation, plotting the true discovery rate versus the false discovery rate at all possible cutoffs ( Fig. 6 ). Here, connections between assays in the same campaign are considered “true” connections, and connections between assays in different campaigns are considered “false” connections. The PAC (AUC = 0.760) works better than PC (AUC = 0.726). Likewise, NA-PAC (AUC = 0.825) does better than its unadjusted version. The NA-PC (AUC = 0.689) has a lower AUC than PC does. However, the early part of the curve hugs the y axis for longer. In this case, therefore, the AUC is not the best way of quantifying the relative performance of NA-PC to PC. Rather, the NA-PC performs better than PC, just as we would expect.
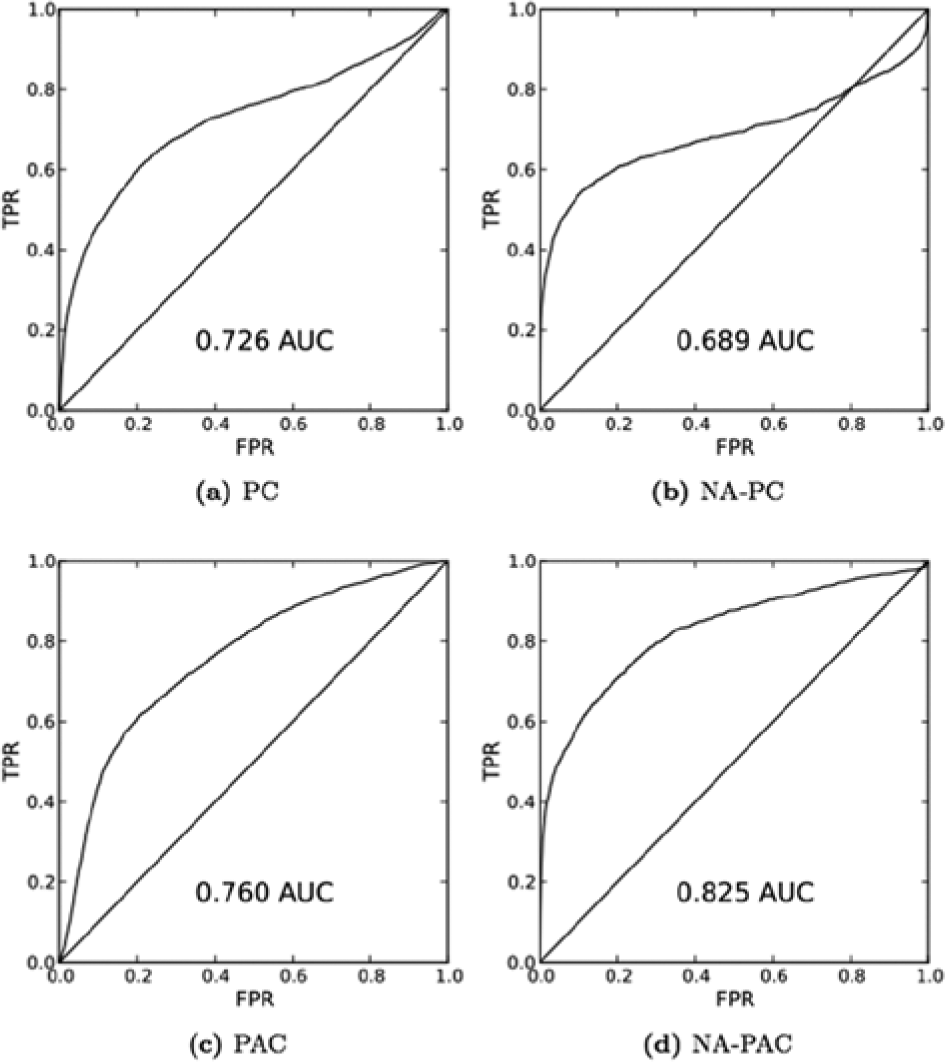
Quantitative performance. These receiver-operating characteristic curves assess how well assays in the same campaign are grouped together by each metric. Assays in the same campaign are often related to one another by biology and assay technology. The in-campaign connections are a useful baseline by which to gauge the quantitative performance of each score. Nonetheless, this is a “bronze standard” assessment, because biologically related screens are not always executed in the same campaign. The area under each curve summarizes each score’s performance. The promiscuity-adjusted correlation metric performs better than Pearson correlation, and the neighborhood-adjusted promiscuity-adjusted correlation metric performs better still.
There are caveats with this approach because campaign groups are not true gold standards. Screening campaigns often include counterscreens to detect molecules that are active for artifactual reasons. A good correlation will down-weight connections to counterscreens, even though they are in the same projects. Nonetheless, this is a useful assessment because a good network would still group campaign-related screens together. The uninteresting relationships, also, are easy to filter out by coloring or excluding edges between assays in the same campaign in the final network.
These quantitative data, although not definitive on their own, still support both the theoretical conclusions and our qualitative analysis. Accounting for promiscuous molecules and also normalizing assay correlations with an NA improves the accuracy and informativeness of our approach.
Discussion
These experiments and examples demonstrate that it is feasible to extract useful information from large repositories of screens that would not be apparent from looking at each campaign in isolation. In particular, the PAC score we introduce has several advantages over other methods that have been used in the literature.
Term-Frequency Inverse-Document-Frequency
The PAC score between two assays is closely related to the TF-IDF score. There are three key differences. First, TF-IDF computes its weight for the ith term (corresponding with the ith molecule in PAC) as 1/logAi rather than Ti/Ai. This difference makes the PAC down-weight promiscuous molecules more strongly than TF-IDF and also account for the ascertainment bias introduced when different molecular libraries are profiled by different numbers of assays. Second, TF-IDF computes the normalization term by summing over all words in the dictionary. In contrast, PAC sums over only those molecules tested in both screens and active in at least one, accounting for the ascertainment bias introduced when assays are applied to different libraries of molecules. Third, PAC ignores the number of times each molecule is determined active in a screen more than once (the term frequency), because replicating an experimental result in a screen is not equivalent to repeating a word several times in a document.
Single Common Active
One group has suggested connecting assays when they share one active molecule in common. 12 This approach is very sensitive to promiscuously active molecules and noise in screening data. It would identify all of the connections found by PAC but would also identify a large number of spurious connections. On a separate but related issue, these authors also decided to use their own cutoff to the activity score to call actives, rather than relying on the depositor-specified annotations for actives. This decision is problematic because their choice of a single cutoff at a PubChem Activity of 90 ignores the scale of each assay readout and the complicated ways in which many depositors have used (and abused) the PubChem Activity data type.
Jaccard Similarity
One group has suggested connecting assays when they share more than 10% of active molecules in common. 11 Although less than the single common active method, this approach is also sensitive to promiscuously active molecules. At the same time, it would miss many of the connections identified by PAC. For example, it would miss the connection between HDAC3 and KLK5. This method is also strongly influenced by ascertainment bias and promiscuous molecules. Assays run on different libraries of molecules will have lower correlations than they should. Conversely, promiscuous molecules will increase the correlation of many assay pairs more than they should. In contrast, PAC is much less influenced by these sources of error.
The score and adjustment we introduce in this study, the PAC and the NA, account for promiscuous actives and ascertainment bias in screens, yielding an assay graph that appears to have biologically meaningful connections. Nonetheless, there are caveats to our method. Some of the connections are based on very few active molecules, and the method relies on activity annotations from different screening groups, which may not be consistent. Perhaps most importantly, the network spans a vast range of biology that will require experts from across this vast range to identify and validate the most interesting connections.
Nonetheless, large repositories of small-molecule screens are an opportunity. Substantial effort was spent generating millions of data points. Assay networks are one way of organizing these data into a coherent view that spans both phenotypic and target-based screens. The PAC and NA-PAC networks expose several connections that are supported by known biology, expose novel polypharmacology, or suggest repurposing strategies. This is just an initial attempt at mining this immensely rich but noisy data. We believe that continued effort toward mining of screening data with more sophisticated methodology will uncover many more interesting connections.
Footnotes
Acknowledgements
We acknowledge the use of Cytoscape 2.7.0 to visualize networks.
Author Contributions
S.J.S. and P.A. conceived the idea and provided project direction. S.J.S. invented the PAC and NA. C.N.S. coded and performed all the virtual experiments. S.J.S., C.N.S., and P.A. wrote and edited the manuscript. M.R.H. provided expert advice and helped edit the manuscript. M.M. made an interactive Web version of the network.
Declaration of Conflicting Interests
The authors declared no potential conflicts of interest with respect to the research, authorship, and/or publication of this article.
Funding
The authors disclosed receipt of the following financial support for the research, authorship, and/or publication of this article. This study was funded by GlaxoSmithKline R&D.
References
Supplementary Material
Please find the following supplemental material available below.
For Open Access articles published under a Creative Commons License, all supplemental material carries the same license as the article it is associated with.
For non-Open Access articles published, all supplemental material carries a non-exclusive license, and permission requests for re-use of supplemental material or any part of supplemental material shall be sent directly to the copyright owner as specified in the copyright notice associated with the article.