
Abstract
Divalent metal ion transporter 1 (DMT1) is a proton-coupled Fe2+ transporter that is essential for iron uptake in enterocytes and for transferrin-associated endosomal iron transport in many other cell types. DMT1 dysfunction is associated with several diseases such as iron overload disorders and neurodegenerative diseases. The main objective of the present work is to develop and validate a fluorescence-based screening assay for DMT1 modulators. We found that Fe2+ or Cd2+ influx could be reliably monitored in calcium 5–loaded DMT1-expressing HEK293 cells using the FLIPR Tetra fluorescence microplate reader. DMT1-mediated metal transport shows saturation kinetics depending on the extracellular substrate concentration, with a K0.5 value of 1.4 µM and 3.5 µM for Fe2+ and Cd2+, respectively. In addition, Cd2+ was used as a substrate for DMT1, and we find a Ki value of 2.1 µM for a compound (2-(3-carbamimidoylsulfanylmethyl-benzyl)-isothiourea) belonging to the benzylisothioureas family, which has been identified as a DMT1 inhibitor. The optimized screening method using this compound as a reference demonstrated a Z′ factor of 0.51. In summary, we developed and validated a sensitive and reproducible cell-based fluorescence assay suitable for the identification of compounds that specifically modulate DMT1 transport activity.
Introduction
Iron is an essential element required for vital functions such as oxidative metabolism, adequate erythropoietic function, and cellular immune responses. Body iron levels depend almost exclusively on its intestinal absorption, since there is no regulated excretory pathway for this metal ion. Iron absorption must be delicately balanced to supply enough iron for the metabolism and to avoid accumulation of excessive, toxic levels. Since in mammals, most of iron is present as hemoglobin, iron recycling following erythrocyte degradation by macrophages constitutes one of the major regulatory mechanisms of iron homeostasis. Oxidative stress and organ damage can result as a consequence of cellular iron overloading, because iron catalyzes the conversion of hydrogen peroxide into hydroxyl radicals by the Fenton/Haber-Weiss reaction cycle. Overproduction of free radicals as a consequence of cellular iron overload results in oxidative stress, a deleterious process that leads to damage of cell structures, including lipids, proteins, and DNA. Appropriate intracellular iron levels are achieved through regulation of its transport, storage, and chelation.
Divalent metal transporter 1 (DMT1/SLC11A2), also known as DCT1 and Nramp2, was cloned in our laboratory from a rat duodenal complementary DNA (cDNA) library using the Xenopus oocytes expression system. 1 DMT1 is ubiquitously expressed and its presence is notably high in the proximal duodenum, immature erythroid cells, brain, and kidney. 2 Enterocytes take up dietary iron in the form of Fe2+ (ferrous iron) across the apical membrane through DMT1 in an H+-coupled manner. 1 This transporter is also involved in the transport of iron from the endocytic vesicles to the cytosol during transferrin receptor (TfR)–associated cellular uptake. 3 After intestinal absorption, iron circulates in the plasma bound to transferrin. Circulating holotransferrin associates with high affinity to a TfR-1 in the plasma membrane of many cell types. Bound holotransferrin is internalized by endocytosis and delivered to endosomes. The acid environment of the endosome lumen causes iron to dissociate from transferrin. The released iron is reduced to ferrous iron and is transported across the endosomal membrane into the cytosol by DMT1.
DMT1 uses an H+ electrochemical gradient as the driving force to transport divalent metal ions such as Fe2+, Mn2+, Cd2+, and others.1,4 Kinetic analysis demonstrated that DMT1 mediates the transport of Fe2+ and H+ in a coupled state with a stoichiometry of 1:1. DMT1 displays high affinity for Fe2+ and H+ with apparent affinities of 1 to 5 µM and 1 µM, respectively. 4
Dysfunction of human DMT1 is associated with iron deficiency anemia,5,6 iron overload disorders,7–9 neurodegenerative diseases (e.g., Parkinson 10 and Alzheimer diseases 11 ), and cancer (colorectal 12 and esophageal adenocarcinoma 13 ). The involvement of DMT1 in these disorders makes this protein a promising target for drug discovery. However, there is scarce information available regarding modulators of DMT1 transport activity. Moreover, specific modulators of DMT1 transport activity could be used as tools to study the structure and the transport mechanism of this transporter as well as its role in iron homeostasis in health and diseases. In the present study, we developed and validated a cell-based fluorescence-based screening (FS) assay to test compounds that potentially modulate DMT1 transport activity using a real-time fluorescent method.
Materials and Methods
Materials
HEK293 cells were obtained from American Type Culture Collection (ATCC, Manassas, VA). Lipofectamine 2000 and geneticin were obtained from Life Technologies (Carlsbad, CA). Cell culture medium, fetal bovine serum (FBS), and cell culture supplements were from Invitrogen (Carlsbad, CA). The calcium 5 assay kit was purchased from Molecular Devices (Sunnyvale, CA). The DC Protein Assay was purchased from Bio-Rad Laboratories (Reinach, Switzerland). All other materials were obtained from Sigma-Aldrich Chemie GmbH (Buchs, Switzerland).
Cell Culture and Generation of a DMT1 Stably Transfected Cell Line
HEK293 cells were plated in Dulbecco’s modified Eagle’s medium (DMEM) supplemented with 10% FBS, 10 mM HEPES, and 1 mM Na-pyruvate at 37 °C. Cells were transfected with pIRES2 (DsRED)–hDMT1 (isoform 1A-IRE(+)) using Lipofectamine 2000, as described in the manufacturer’s protocol. After 24 h, medium was changed to normal growth medium supplemented with 500 mg/mL geneticin. After several days, when most of the nontransfected cells were dead, cells were plated into 96-well plates at a density of 1 cell/well. Stably transfected clones were selected by fluorescence microscopy and tested by functional experiments.
Cell Biotinylation and Western Blotting
Nontransfected and stably transfected clones of hDMT1-expressing HEK293 cells were seeded on a 6-well plate and maintained in supplemented DMEM as described above. Surface proteins were biotinylated with 1.5 mg/mL sulfo-NHS-LC-biotin (Pierce, Reinach, Switzerland) accordingly to the manufacturer’s protocol. Cell were lysed in RIPA lysis buffer (150 mM NaCl, 50 mM Tris [pH 7.4], 5 mM EDTA, 1% Triton X-100, 0.5% sodium deoxycholate, 0.1% sodium dodecyl sulfate [SDS]), and biotinylated surface proteins were isolated using streptavidin agarose beads. The plasma membrane, the total lysate, and the cytosolic fraction were heated to 95 °C for 5 min in 2× Lämmli buffer. Samples were separated using a 6% SDS gel, and proteins were transferred to a PVDF blot membrane. After blocking, the blot was incubated with the primary antibody (mouse monoclonal human DMT1 1:4000; Abnova, Luzern, Switzerland) overnight at 4 °C. Goat horseradish peroxidase (HRP)–conjugated anti-mouse (1:4000; Bio-Rad) was used as the secondary antibody. Immunoreactive bands were visualized using the enhanced chemiluminescence (ECL) method.
Radiolabeled Iron Uptake Assay
Stably transfected clones of hDMT1-expressing HEK293 cells were plated on poly-D-lysine–coated, white 96-well plates at a cell density of 40,000 cells/well. After 24 h, the growth medium was aspirated and cells were washed with the Krebs-Ringer buffer (140 mM NaCl, 4.8 mM KCl, 1 mM MgCl2, 1.2 mM CaCl2, 10 mM D-glucose, 10 mM HEPES, pH 7.4 and osmolarity 290 ± 10 mOsm). To measure iron uptake, the Krebs-Ringer buffer (pH 6.5) was supplemented with 1 mM ascorbic acid and 1 µM radioactive [55Fe] iron. The assay was terminated after 15 min by washing the plates four times with ice-cold Krebs-Ringer buffer. Subsequently, 100 µL of Microscint 20 (PerkinElmer, Waltham, MA) was dispensed into each well and incubated at room temperature (RT) for 1 h under constant agitation. Radioactive [55Fe] iron uptake was measured using a TopCount Microplate Scintillation and Luminescence Counter (PerkinElmer).
Iron Transport Measured by Real-Time Fluorescence Imaging
Nontransfected and stably transfected clones of hDMT1-expressing HEK293 cells were seeded on poly-D-lysine–coated 96-well black-walled, clear-bottom plates at the indicated cell densities. Twenty-four hours later, cells were loaded with calcium 5 dye in Krebs-Ringer buffer according to the manufacturer’s protocol. Briefly, the growth medium was removed and 100 µL dye loading buffer was added to each well and cells were incubated for 1 h at 37 °C. Plates were not washed after dye loading. The dye loading buffer was prepared by diluting 1 mL of the Component A vial mixture in 9 mL of Krebs-Ringer buffer. The Component A vial mixture was prepared by dissolving the content of one vial of calcium 5 dye provided by Molecular Devices (Sunnyvale, CA) in 10 mL of Krebs-Ringer buffer. Fluorescence measurements were carried out using the FLIPR Tetra high-throughput, fluorescence microplate reader (Molecular Devices). Cells were excited using a 470- to 495-nm LED module, and the emitted fluorescence signal was filtered using a 515- to 575-nm emission filter for detection. Fluorescence signals were analyzed using the FLIPR Tetra software (ScreenWorks 3.1.2.002), and DMT1-mediated metal transport activity was evaluated with the following kinetic reduction features of the software: slope of curve, area under the curve, and max-min.
To measure DMT1 transport activity, concentration-response experiments were performed as follows. First, a stable baseline was established for 50 s. Thereafter, 50 µL of Krebs-Ringer buffer containing different concentrations of cadmium (0–500 µM) or iron (0–50 µM) was added to the wells and changes in fluorescence intensities were recorded. The initial rate of DMT1-mediated metal transport was deduced by analyzing the linear increase or decrease of fluorescent signal within the initial 50 or 100 s, following iron or cadmium addition, respectively. In the representative tracings, the time course of fluorescence intensity was normalized to the baseline.
Inhibition assays were performed using the following protocol. A stable baseline was monitored for 50 s. Then, 50-µL aliquots of Krebs-Ringer buffer (pH 6.5) supplemented with the inhibitor 2-(3-carbamimidoylsulfanylmethyl-benzyl)-isothiourea (CISMBI) were added to the wells and changes in fluorescence intensities were monitored for 300 s. Thereafter, a second addition of 50 µL of Krebs-Ringer buffer (pH 6.5) containing different concentrations of Cd2+ was added and changes in fluorescence intensities were followed for another 300 s. To facilitate comparison, multiple determinations of slope of curve obtained with FLIPR Tetra were averaged and normalized to the value obtained with the negative control (i.e., the value of the slope of the curve obtained with the highest concentration of divalent metal tested in the absence of inhibitor).
The dependence of the DMT1-mediated Cd2+ transport on external Mn2+ concentrations was measured by adding 50-µL aliquots of Krebs-Ringer buffer (pH 6.5) containing different concentrations of Mn2+ (0–1000 µM) after monitoring a stable baseline for 50 s. Changes in fluorescence intensities were monitored for 300 s before and after addition of 50 µL Krebs-Ringer buffer (pH 6.5) containing 5 µM Cd2+.
Assay performance was assessed by calculating the Z′ factor value 14 and the coefficient of variation (CV). 15 We determined the Z′ factor using 5 µM Cd2+ as a DMT1 substrate in four experimental plates. Cells on half of the plate were treated with 100 µM CISMBI as positive control for inhibition and the other half without inhibitor as negative control.
Solutions
Cadmium chloride and manganese chloride solutions were prepared by dissolving the cadmium chloride hemi(pentahydrate) and manganese chloride tetrahydrate in distilled water. The final solutions were prepared in Krebs-Ringer buffer by making serial dilutions from the highest concentration tested. Ferrous stock solution (10 mM) was prepared immediately before use by dissolving ferrous iron chloride tetrahydrate in 0.5 mM HCl. A 10-µL aliquot from this stock solution was added to 10 mL of Krebs-Ringer buffer supplemented with 1 mM ascorbic acid. Thereafter, the pH of the solution was adjusted to 6.5 with 1N NaOH. To obtain solutions with the desired iron concentrations (0–50 µM), serial dilutions of the 100-µM solution were made in Krebs-Ringer buffer (pH 6.5) supplemented with 1 mM ascorbic acid. The inhibitor stock solution (500 mM) was prepared by diluting CISMBI di-hydrobromide in DMSO. Final inhibitor solutions (0.5, 2.5, 10, and 25 µM) were prepared by dissolving the appropriate amount of the inhibitor stock solution in Krebs-Ringer buffer (pH 6.5).
Data Analysis
To facilitate comparison, multiple determinations of the initial rate obtained with FLIPR Tetra were averaged and normalized to the value obtained with the highest concentration of divalent metal tested. Relative Cd2+ transport initial rates were plotted against external ion concentrations and the substrate concentration for half-saturation (K0.5) was deduced. The concentration of CISMBI eliciting half-maximal inhibition (Ki) was calculated from the determined Cd2+ apparent K0.5 as it was described. 16 In Mn2+ competition assays, the relative IC50 values were calculated from the resulting sigmoidal concentration-response curves. Curve fitting and parameter estimation were carried out using Sigma Plot 12.0 (Systat Software, Chicago, IL). Data are presented as mean ± SD. Statistical comparisons were made where appropriate using the Student t test.
Results
The expression of hDMT1 was examined in stably transfected cells using biotinylation and Western blot techniques. We found that hDMT1 was well expressed in the plasma membrane of our selected clone, whereas no DMT1 protein was observed in nontransfected HEK293 cells ( Fig. 1A ). To test the functional expression of DMT1 overexpressed in HEK293 cells, we performed a radioactive iron uptake assay. Ferrous [55Fe] iron uptake was 26-fold greater in the hDMT1-expressing HEK293 cells than in nontransfected cells ( Fig. 1B ).
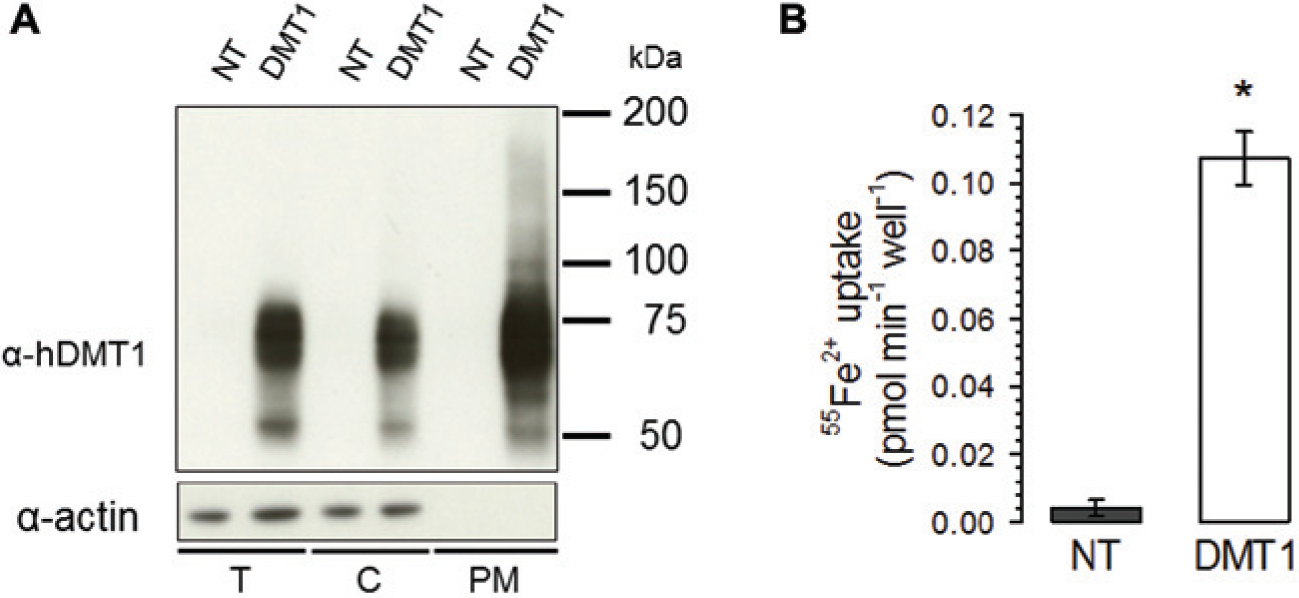
Expression of human DMT1 in HEK293 stably transfected with pIRES-hDMT1. (
Direct transport studies in Xenopus laevis oocytes previously demonstrated that DMT1 is a pH-dependent divalent metal transporter that exhibits high affinity for Cd2+. 17 Recently, we showed that Cd2+ could be used for an influx assay since it induces a robust increase of calcium 5 fluorescence intensity in HEK293 cells that overexpress the epithelial calcium channel TRPV6. 18 As shown in Figure 2A , administration of 50 µM Cd2+ induced a significant increase of fluorescence intensity in hDMT1-expressing HEK293 cells but not in nontransfected cells. We assessed the dependency of the DMT1-mediated metal transport assay on external pH to find the optimal conditions leading to a large assay signal. An increase of the Cd2+-induced signal was observed when reducing the pH of the assay buffer ( Fig. 2B ). Since the greater signal was observed at an external pH of 6.5, we used this buffer condition in the final optimized format of the Cd2+ transport assay.
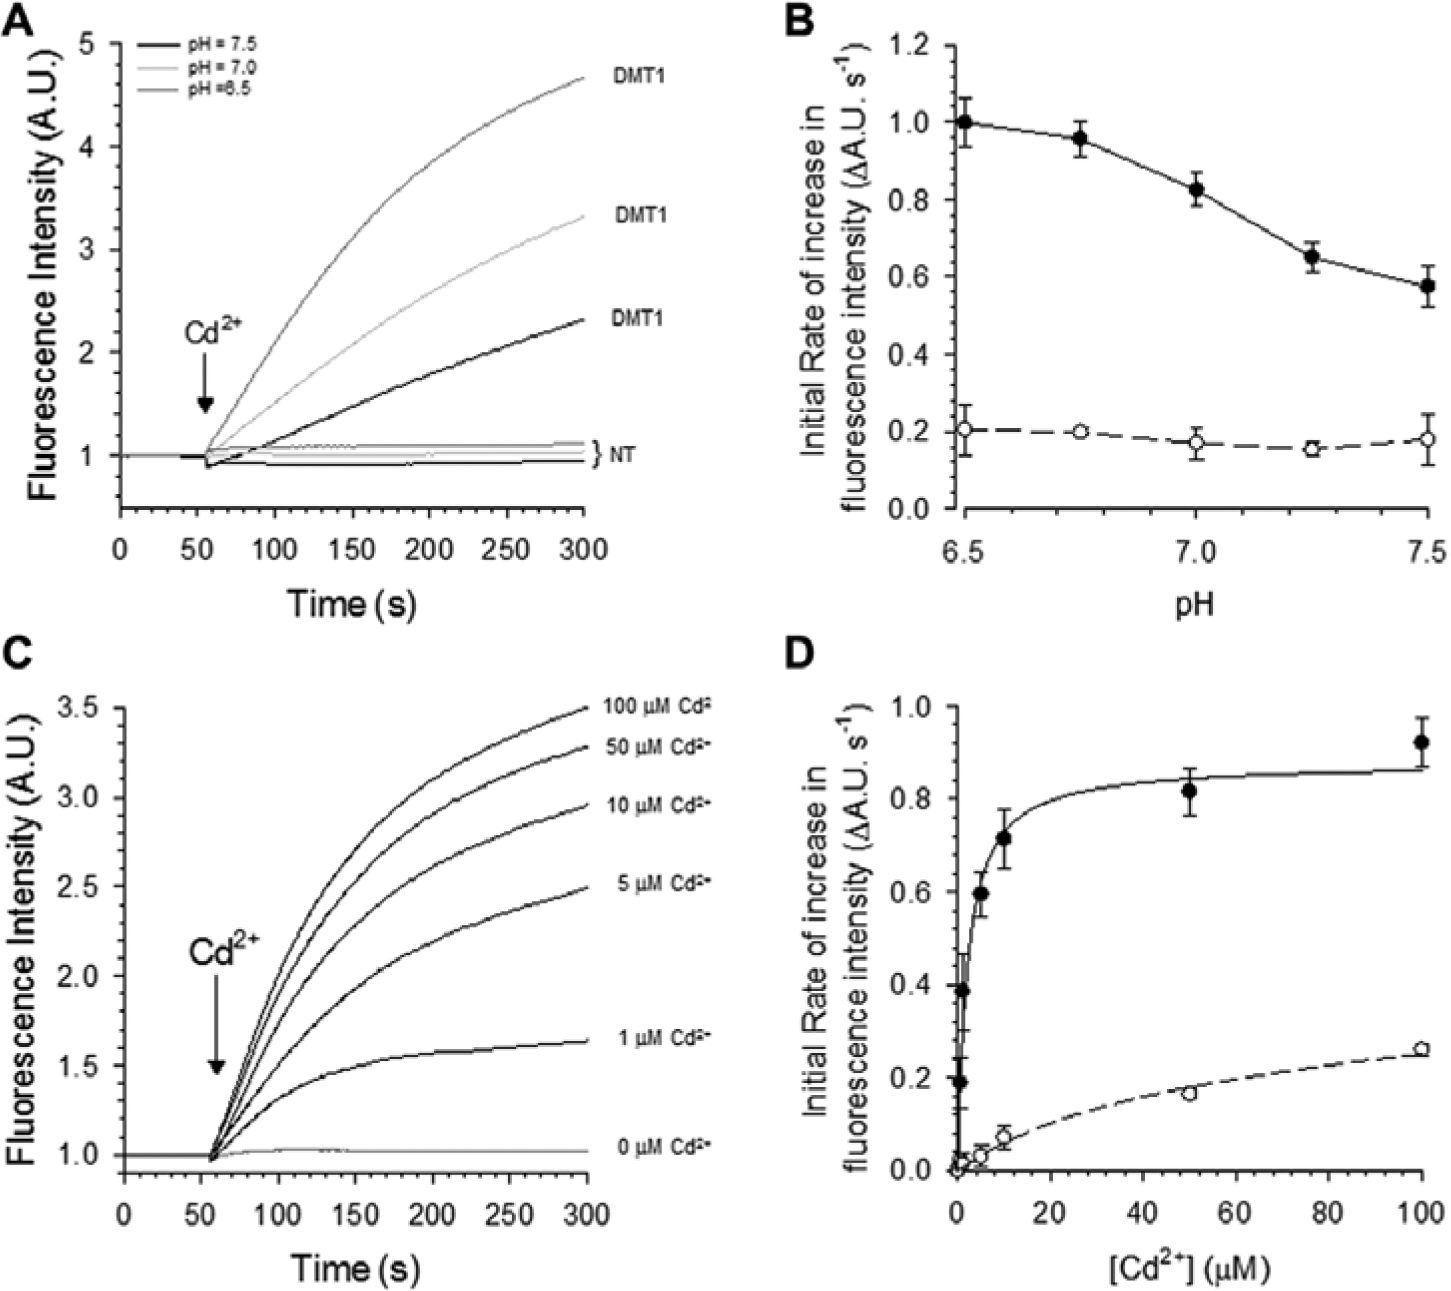
Cadmium transport by the stably hDMT1-expressing HEK293 cells. (
The dependency of the DMT1-mediated Cd2+ transport on external Cd2+ concentration was also assessed. The kinetics of Cd2+ uptake was determined by monitoring the changes in fluorescence intensities in response to different extracellular Cd2+ concentrations ( Fig. 2C ). The relative initial rates of fluorescence increase were plotted against extracellular Cd2+ concentration ( Fig. 2D ). The stably hDMT1-expressing HEK293 clones showed saturation kinetics dependent on the extracellular cadmium concentration, and the calculated affinity of DMT1 for Cd2+ revealed a K0.5 of 3.5 ± 1.5 µM (n = 14).
DMT1 transports a wide range of divalent metals, with Fe2+ as one of the most relevant physiological substrates. We tested if DMT1-mediated Fe2+ influx induces any change on calcium 5 fluorescence intensity. Interestingly, we found that the calcium 5 dye fluorescence is quenched in the presence of iron in a concentration-dependent manner ( Fig. 3A ). To maintain iron in its ferrous form, the assay buffer was supplemented with 1 mM ascorbic acid to maintain reducing conditions. We found that 1 mM ascorbic acid did not affect the signal when tested with Cd2+ as the DMT1 substrate (data not shown). Under these conditions, the dependency of DMT1-mediated Fe2+ transport on the external Fe2+ concentration was assessed. The stably hDMT1-expressing HEK293 cell clone showed saturation kinetics dependent on the extracellular iron concentration with a K0.5 of 1.4 ± 0.5 µM (n = 6; Fig. 3B ).
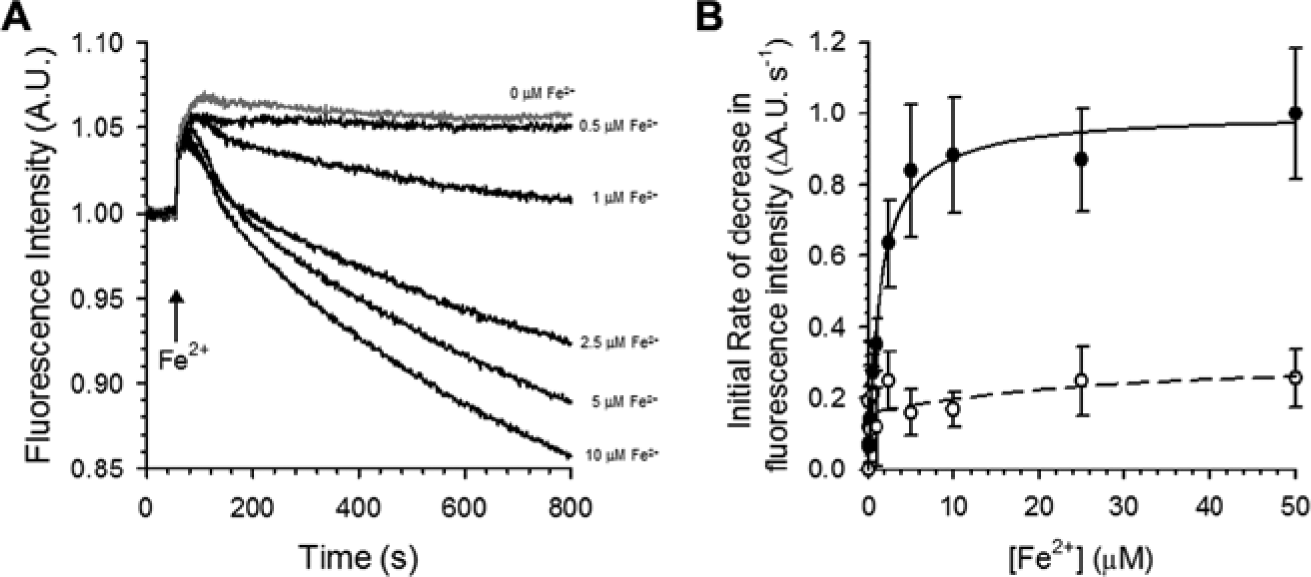
Iron transport by a stably hDMT1-expressing HEK293 cells assessed with the FLIPR Tetra. (
Since Mn2+ is a substrate for DMT1,
1
we evaluated whether DMT1-mediated Mn2+ influx produces any change in calcium 5 fluorescence intensity signal. When the hDMT1-expressing HEK293 cells were treated with 50 µM Mn2+, no significant difference in fluorescence signal was observed compared with nontransfected cells (
One of the most critical points that must be considered in the design of a screening assay is the substrate concentration. The sensitivity of an assay developed to test the effect of different types of inhibitors on a membrane transporter is a function of the ratio between the substrate concentration and the K0.5 value. 19 For this reason, we set the Cd2+ (i.e., substrate) concentration at 5 µM, a concentration that is 50% higher than the calculated K0.5 value. Under these conditions, we varied a number of parameters to optimize assay performance. The first parameter selected for optimization was the cell density. The stably hDMT1-expressing HEK293 cells were seeded at densities of 20,000, 40,000, and 60,000 cells/well. To test the dynamic range of the assay, half of the experimental plate was treated with 5 µM Cd2+ as a positive control and the other half with no substrate as a negative control. As shown in Figure 4A , the highest signal was obtained from the densely seeded wells (60,000 cells/well). However, a higher standard deviation of the signal was also observed under this condition. In contrast, a cell plating density of 40,000 cells/well produced a high signal relative to background with low standard deviation and thus yielded a more consistent assay. These experiments suggest that the optimal conditions for assay performance are found by plating the cells at a density of 40,000 cells/well. Iron transport by DMT1 was shown to be temperature dependent, with a Q10 ~ 2. 4 To experimentally test the influence of temperature on DMT1-mediated Cd2+ influx assay, we performed the measurements at three different temperatures—namely, 25 °C, 30 °C, and 37 °C. We observed that the assay yielded a larger signal when performed at 37 °C without an increase in the background Cd2+ signal in control HEK293 cells ( Fig. 4B ). Setting the assay temperature at 37 °C also has the advantage that the assay will be performed at physiological temperature. Overall, these results confirm that 37 °C is the optimal temperature for the DMT1-mediated Cd2+ influx assay.
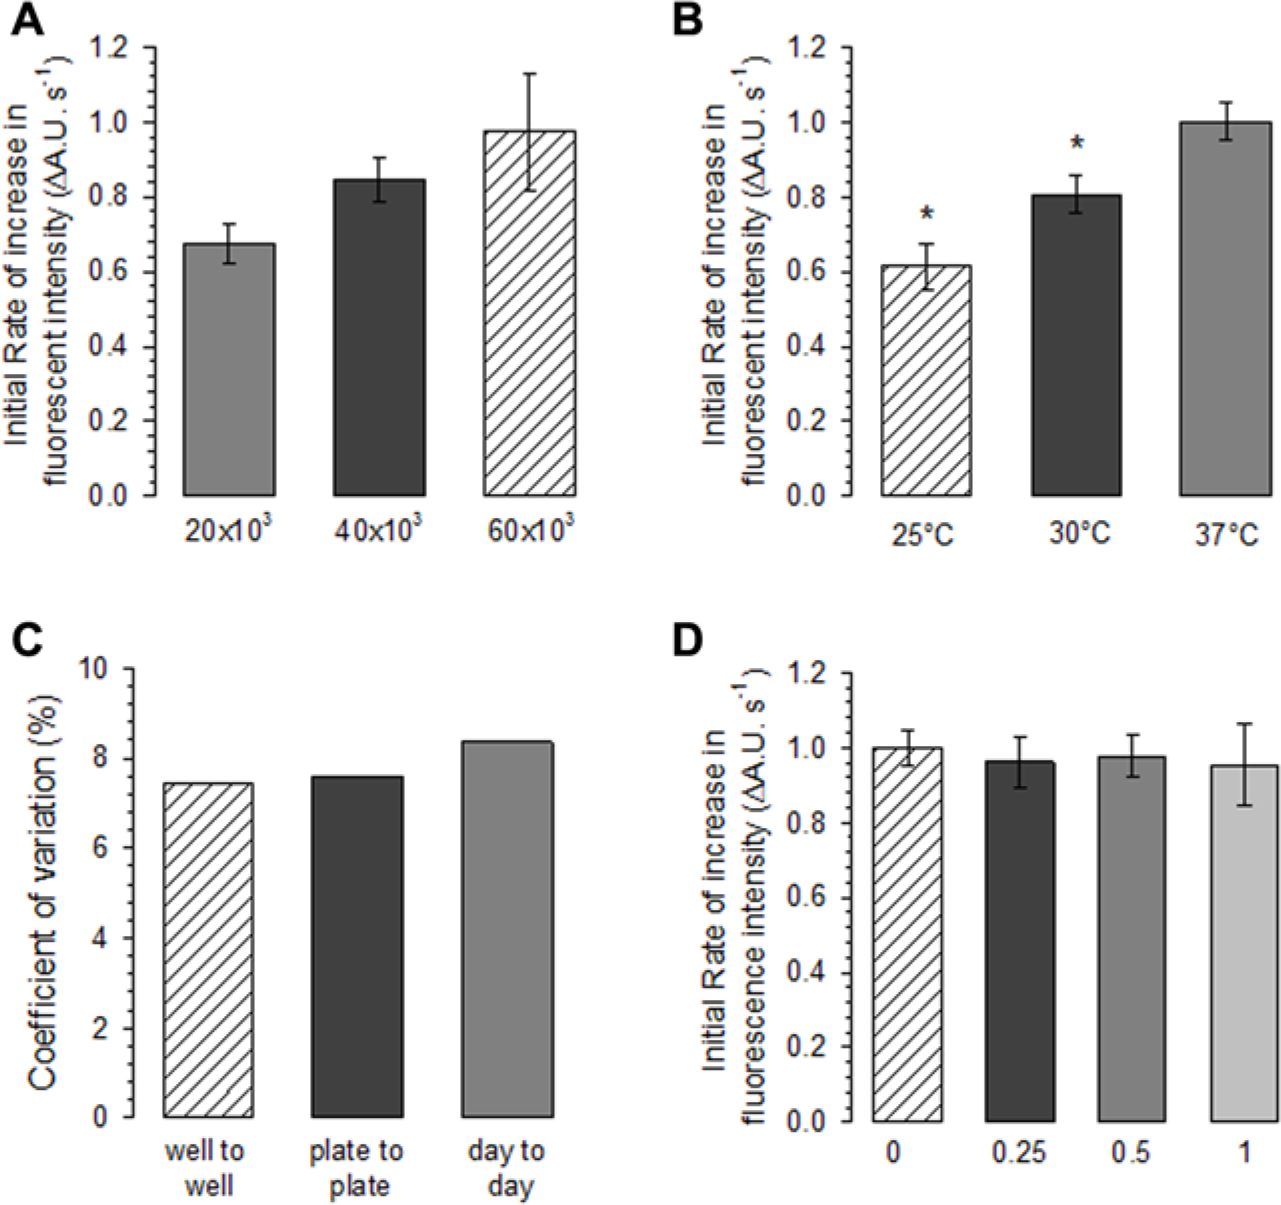
Analysis of assay performance under different experimental conditions. (
Using the optimized conditions, we tested the variability and reproducibility of the assay. We analyzed the different sets of experiments to determine the well-to-well, plate-to-plate, and day-to-day variation. As shown in Figure 4C , a low value of the coefficient of variation was found for all these conditions, indicating a high stability and precision of the assay. Next, we carried out a DMSO tolerance study on the DMT1-mediated Cd2+ influx assay. DMSO was tested at final concentrations ranging from 0.25% to 1% (v/v). As shown in Figure 4D , minimal interference was observed on the Cd2+ influx assay performed in the stably hDMT1-expressing HEK293 cells when DMSO was tested up to 1%. These results indicate that the assay has a high level of stability to varying DMSO concentrations.
Benzylisothioureas have been shown to be inhibitors of DMT1.
20
Here we found that 100 µM CISMBI, a compound that belongs to the benzylisothioureas family, completely inhibits DMT1-mediated cadmium transport without affecting the response of the calcium 5 dye (
Fig. 5A
,
B
). Moreover, DMT1 transport activity was competitively inhibited by this tool compound with a Ki value of 2.1 ± 0.5 µM (
Fig. 5C
,
D
). To validate our fluorescence assay, we determined the Z′ factor using 5 µM Cd2+ as a DMT1 substrate in the presence of 100 µM of the inhibitor as described above (see Materials and Methods). The Z′ factor was 0.51 ± 0.01, demonstrating that the DMT1-mediated Cd2+ influx assay is robust and reproducible (
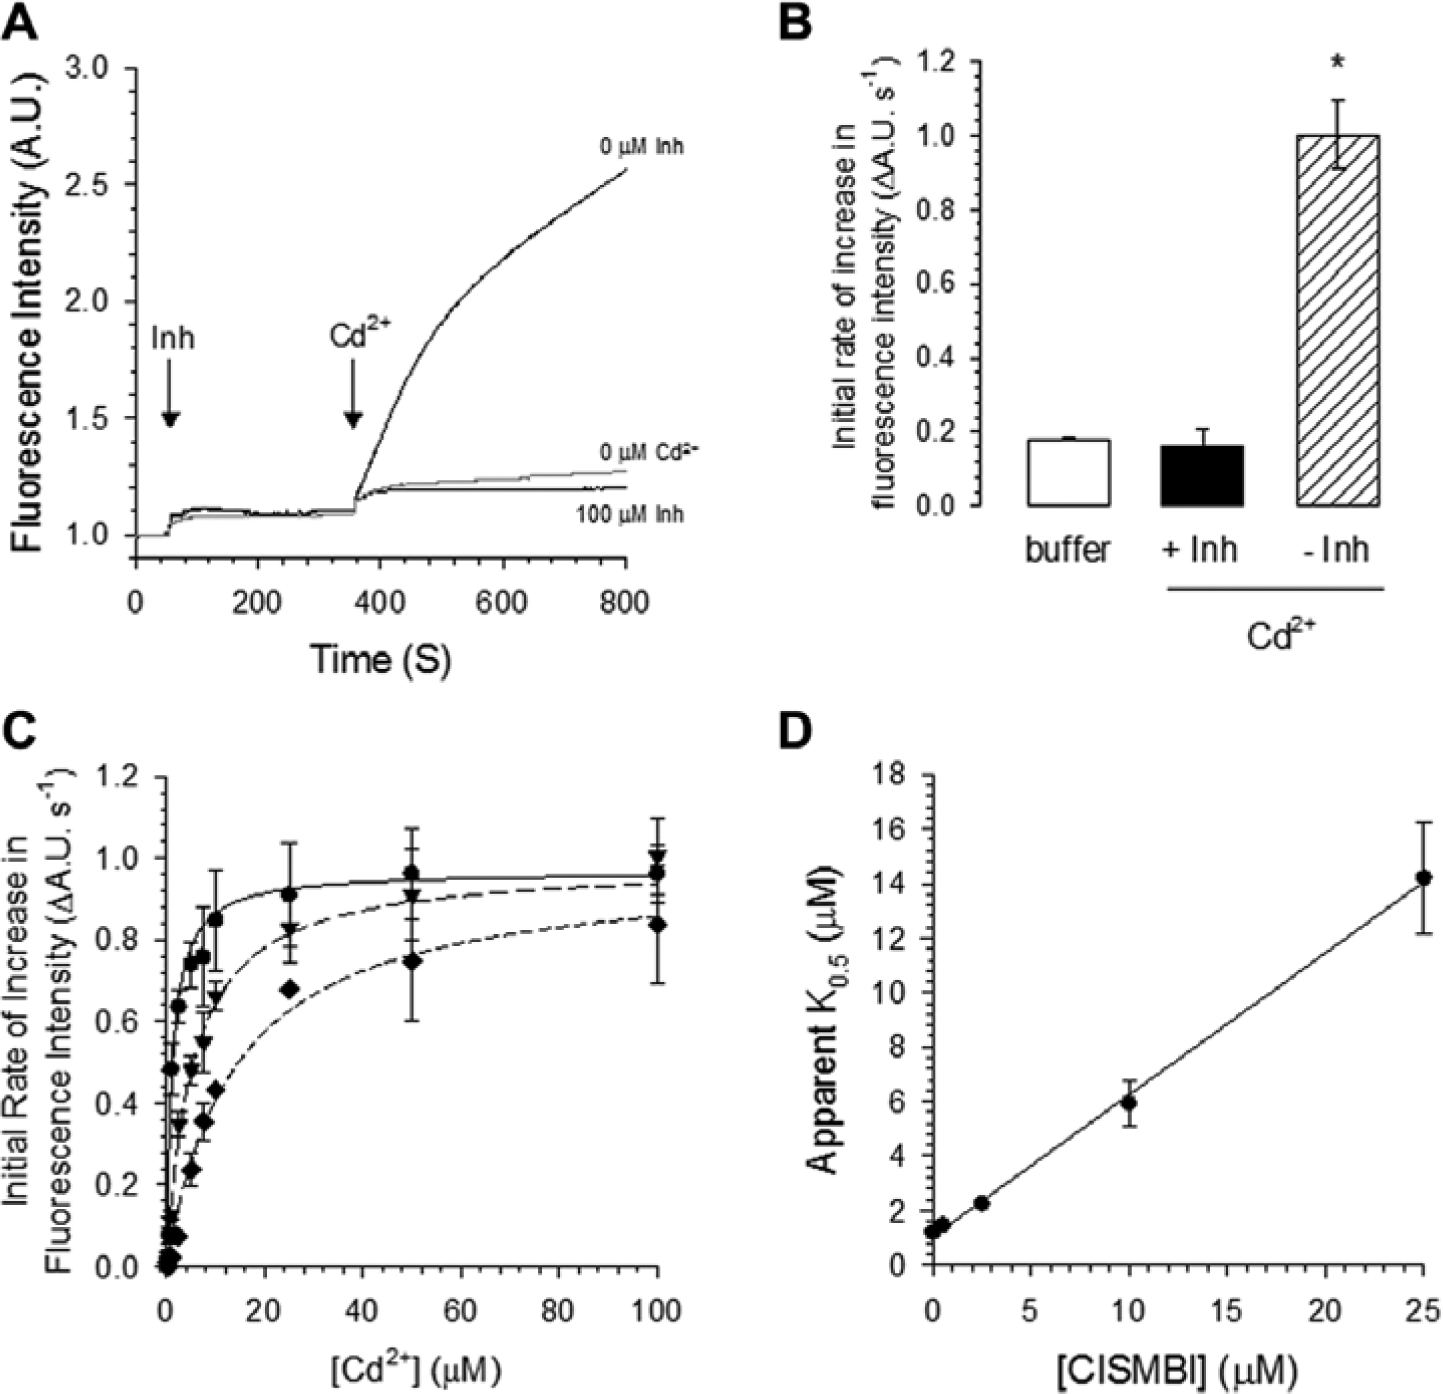
Competitive inhibition of DMT1-mediated Cd2+ transport by 2-(3-carbamimidoylsulfanylmethyl-benzyl)-isothiourea (CISMBI). (
Discussion
Electrophysiological studies in DMT1-expressing Xenopus oocytes revealed that this transporter has a high affinity for Fe2+ with a K0.5 = 2 µM. 4 A similar affinity for Fe2+ was reported when DMT1 was overexpressed in HEK293 cells (K0.5 = 3.9 µM) 21 and in yeast (K0.5 = 1.2 µM). 22 There are only few studies dealing with the affinity of DMT1 for Mn2+ and Cd2+. A K0.5 value of 2 µM was reported using radioactive Mn2+ uptake in DMT1-expressing HEK293 cells. 21 More recently, K0.5 values of 4 and 1 µM were reported for Mn2+ and Cd2+, respectively, when DMT1 was expressed in Xenopus oocytes. 17 In this latter study, Mn2+ was used as competitive inhibitor of DMT1-mediated radioactive Fe2+ iron uptake, showing a Ki value of 10 µM. Moreover, an IC50 of 2.1 µM was reported when [54Mn] radioactive uptake was competitively inhibited by FeSO4. 21 Our results are in close agreement with the previously reported values of DMT1 affinity for Fe2+, Mn2+, and Cd2+. Using real-time fluorescence measurements with the calcium 5 assay kit, we determined that DMT1 has high affinity for Fe2+, Cd2+, and Mn2+ when overexpressed in HEK293 cells. These results demonstrate that our assay can be readily used to study the pharmacology and transport properties of DMT1.
In the present study, we found that the fluorescence of calcium 5 is quenched in the presence of Fe2+. When Fe2+ was added to the medium, calcium 5 fluorescence intensity decreased progressively and finally leveled off, suggesting that a steady-state level was reached. The decrease of calcium 5 fluorescence signal intensity was dependent on the extracellular Fe2+ concentration with a K0.5 value of 1.4 µM, a value in agreement with the previously reported ones.1,4 A similar quenching effect of iron was observed on the fluorescence intensity of different fluorescent metal indicators such as Calcein, 23 Phen Green SK, 24 and BDP-Cy-Tpy. 25 Our results show that DMT1-mediated transport of Fe2+ can be directly measured using the calcium 5 dye but with a lower sensitivity compared with the values obtained with Cd2+. The Z′ factor value obtained with this assay was lower than 0.5 when using 2.5 µM Fe2+ as a substrate for DMT1 (data not shown). Therefore, Fe2+ would not be a suitable substrate for the development of a reliable screening assay using the calcium 5 method. Big effort has been made to improve the sensitivity of Fe2+ fluorescent probes.25,26 However, the applicability of these novel Fe2+-selective dyes in a screening assay needs to be validated.
Voltage-clamp analysis of DMT1-mediated iron transport in Xenopus oocytes indicated a pH-dependent electrogenic process.1,4 Here we found that the maximal fluorescence signal evoked by Cd2+ influx was confined to acidic pH. The higher dynamic range was observed with the assay buffer of pH 6.5. We found a 1.2-fold increase in the fluorescent signal due to DMT1 transport activity by changing extracellular pH from 7.0 to 6.5 ( Fig. 2B ). Similar results were reported when the pH-dependence of DMT1 transport activity was assessed with an electrophysiological technique. A 1.6-fold increase in the Fe2+-evoked current was observed by changing the extracellular pH from 7 to 6.5. 4 Thus, our results on the pH dependence of DMT1-mediated metal transport are in close agreement with previous reports.
According to our findings, we established a standard assay protocol using Cd2+ as a substrate for DMT1 in an assay buffer of pH 6.5 to obtain the highest signal for the screening assay. In addition, in our screening assay, we used a substrate concentration of 5 µM Cd2+, which gives an [S] to K0.5 ratio of ~1.5. This ratio provides a high dynamic range to ensure that hits could be easily discovered in a high-throughput campaign. Other standard assay conditions include a cell plating density of 40,000 cells/well and 37 °C as the optimal assay temperature. Under these conditions, we calculated a Z′ factor consistently higher than the commonly accepted threshold of 0.5
14
when the assay performance was evaluated using the initial rate (i.e., slope of the curve), area under the curve or maximum-minimum of the fluorescence intensity signal (
Two groups developed and validated fluorescence-based high-throughout screening (HTS) assays for DMT1, leading to the identification of small-molecule inhibitors of DMT127,28 and other potent blockers of this transporter such as pyrazoles 29 and benzylisothioureas. 20 Both groups used similar assays based on the property of Fe2+ to quench the fluorescence signal of Calcein. In addition, there are commonly use nonfluorescent methods to measure intracellular iron such as atomic absoption spectroscopy 30 and ferrozine-based colorimetric assay, 31 which could be compatible with HTS. In comparison to the other existing methods to measure intracellular Fe2+ listed above, we have developed a highly sensitive, fast, and homogeneous assay since less experimental steps (no washing steps) and lower incubation times are required.
In summary, we have developed and validated a fast, homogeneous, and reliable cell-based fluorescence assay that can be easily employed to find modulators of DMT1 transport activity. The identification of such modulators will be promising from a pharmaceutical point of view, given the involvement of DMT1 in a variety of disorders.
Footnotes
Declaration of Conflicting Interests
The authors declared no potential conflicts of interest with respect to the research, authorship, and/or publication of this article.
References
Supplementary Material
Please find the following supplemental material available below.
For Open Access articles published under a Creative Commons License, all supplemental material carries the same license as the article it is associated with.
For non-Open Access articles published, all supplemental material carries a non-exclusive license, and permission requests for re-use of supplemental material or any part of supplemental material shall be sent directly to the copyright owner as specified in the copyright notice associated with the article.