
Abstract
High-throughput screening allows rapid identification of new candidate compounds for biological probe or drug development. Here, we describe a principled method to generate “assay performance profiles” for individual compounds that can serve as a basis for similarity searches and cluster analyses. Our method overcomes three challenges associated with generating robust assay performance profiles: (1) we transform data, allowing us to build profiles from assays having diverse dynamic ranges and variability; (2) we apply appropriate mathematical principles to handle missing data; and (3) we mitigate the fact that loss-of-signal assay measurements may not distinguish between multiple mechanisms that can lead to certain phenotypes (e.g., cell death). Our method connected compounds with similar mechanisms of action, enabling prediction of new targets and mechanisms both for known bioactives and for compounds emerging from new screens. Furthermore, we used Bayesian modeling of promiscuous compounds to distinguish between broadly bioactive and narrowly bioactive compound communities. Several examples illustrate the utility of our method to support mechanism-of-action studies in probe development and target identification projects.
Introduction
There are two fundamental approaches to identify new candidate biological probe or drug lead compounds. Biochemical assays are used to discover compounds with well-defined activities against desired targets, but such compounds are susceptible to failure in downstream investigations due to poor performance in cells, off-target activities, or poor pharmacokinetic properties. Cell-based assays circumvent some of these problems but pose a different challenge—discovering the mechanisms of action (and target proteins) of compounds with a desired cellular activity. Modern probe and drug discovery efforts have relied on each of these approaches to produce quality candidates. 1
There are multiple experimental and computational approaches to tackle the target-identification problem, 2 including various affinity and profiling methods. Affinity methods involve immobilizing a compound on solid support, incubating with protein extracts, and de-convoluting the remaining attached proteins using mass spectrometry or suitable antibodies. In small-molecule profiling methods, profiles generated for a compound of interest are compared with profiles of compounds with known biological activities, from which one can generate hypotheses about similar or related mechanisms of action. While gene expression is the most prevalent profiling method used for target identification,3,4 profiles based on other kinds of experimental data have been successfully used, including cellular sensitivity measurements, 5 image-based profiling, 6 parallel measurements of cellular metabolism, 7 and profiles generated by compound co-treatments. 8 Chemical similarity,9,10 predictive modeling, 11 and network analysis methods 12 can also be used to relate compounds and their targets.
In this study, we focus on small-molecule profiling based on historical, single-concentration, high-throughput screening data, typically performed in duplicate. Over time, compound collections within a particular screening facility become annotated with the results of multiple assays, but in our experience, this information is not always used by project teams performing new screens in the same facility. Nevertheless, it is natural to expect that compounds modulating the same protein(s) or biological pathway(s) will have similar performance across many cell-based assays and that using profiles built over multiple assays, particularly those using different assay and detection methods, can help overcome problems of interpretation associated with high false-positive rates in any given assay. Assay performance profiling can be particularly useful when one of the compared compounds has preexisting biological annotation available, allowing attachment of this annotation to a new compound as an inferred hypothesis. Besides mechanism-of-action determination, assay performance profiling can be also used to investigate synthetic chemistry decisions 13 or assist with the design of screening library subsets. 14
Small-molecule profiling using multiple parallel assays has been applied successfully in several contexts.7,15–18 However, these methods were applied intentionally by one set of investigators, relied on having known binders or inhibitors, 15 collected dose-response data sets,7,17,18 or were performed on a common instrument platform. 17 One recent approach, termed high-throughput screening fingerprints (HTS-FP), 14 offers a nice approach for mining historical HTS data, defining scores for similarity searches asymmetrically (probe vs. test compounds), and using a correction factor for shared assay number proportional to the number of shared assays.
Similarly, our method seeks to make efficient use of noisy primary screening data, making as few assumptions as possible about the compound collection being surveyed or the assays being performed. The use of primary screening data has a central challenge: due to the evolution of screening libraries and cost limitations of some assays, results are not available for all compound-assay combinations. This sparseness of data requires altering analysis methods so they handle missing data without introducing bias into similarity calculations. In particular, we developed a symmetric similarity scoring system that takes into account the nonlinear statistical behavior of the correlation coefficient across different numbers of shared assays. In addition, in comparison to other profiling methods (e.g., gene expression), loss-of-signal assay measurements may not distinguish between the multiple mechanisms that can lead to certain phenotypes (e.g., cell death). We sought a method that could be applied across multiple investigators, biological motivations, and instrument platforms. Therefore, our approach can function purely as a data-mining activity when using one or more public small-molecule activity databases as source material.
In this study, we describe a principled computation of assay performance profile similarity, including the data sets we used and the preprocessing methods we applied. To derive appropriate thresholds for similarities between compounds, we relate assay performance profile similarity to chemical structure similarity. We use a local community detection algorithm to group bioactive compounds into communities according to their mechanisms of action. Bayesian modeling of cross-reactive compounds allows us to distinguish between broadly bioactive and narrowly bioactive compound communities. We present several applications of our method to target identification, identification of new compounds, and screening “hit” prioritization. Such profiles can assist with identifying protein targets and mechanisms of action for molecules discovered in cell-based or biochemical assays.
Methods
Data Sets
Computing biological profiles for small-molecule modulators in cell-based phenotypic profiling experiments requires normalization of measurements beyond what is required to choose compounds for follow-up from a single high-throughput screen. Our strategy is to compare each measurement of a small-molecule perturbation with an appropriate negative-control distribution that best reflects biological and technical noise inherent in the assay. We use this distribution to compute a dimensionless score, intuitively similar to a z score, which for each compound treatment relates measured values to the likelihood that a measurement can be explained by noise. We applied a variation of this approach to raw, single-concentration, high-throughput screening data in ChemBank
19
as well as data in CBIP (Chemical Biology Informatics Platform), an internal HTS database at the Broad Institute. From ChemBank, we extracted a total of 8.36 million normalized assay measurements, including both compound and control well data. We excluded assay development experiments, measurements of compound autofluorescence in the absence of a biological sample, and measurements from which other included measurements (e.g., differences and ratios) were derived. These data represent exposure of 1212 distinct compound stock plates to 1015 distinct biological assay conditions differing in at least one of biological sample, compound exposure time, concentration, or assay readout. These data are very sparse, with an average coverage of the potential stock plate × assay space of 2.16% (26,511 of 1,228,968 possible stock plate × assay combinations). From CBIP, we extracted more than 6.1 million results for 83 observations in 24 high-throughput screens. We combined these results in a custom database (
Normalization of Assay Results
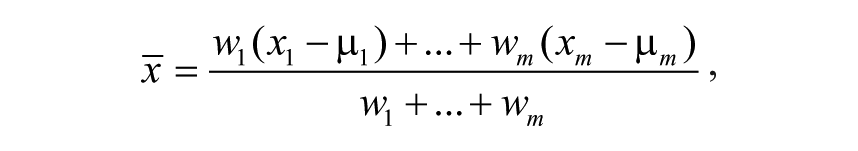
We expressed HTS measurements as a dimensionless score D representing a normalized weighted average of deviations from appropriate negative-control distributions ( Fig. 1 ). Let x1, . . ., xm be all measurements for a single compound in one concentration and one assay outcome (we distinguish between assay and assay outcome, as some assays involve multiple measurements). We required that all measurements were obtained in the presence of negative (DMSO-treatment) controls and assumed that these controls behave according to a normal distribution. To accommodate run-to-run (or batch-to-batch) variability, for each measurement xp, p = 1, . . ., m, we considered a normal distribution with mean µ l and standard deviation σ l for negative controls in the run (or batch) corresponding to xl. We aggregated assay measurements into a weighted average of background-subtracted values,
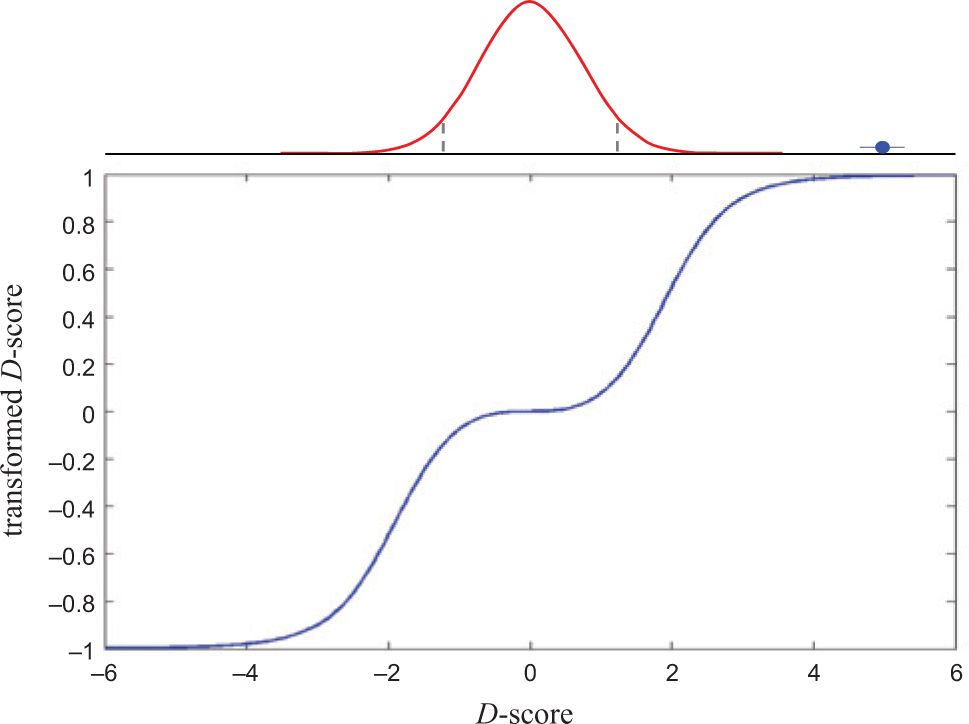
Data preprocessing reduces bias in assay performance profiles. Double-sigmoid transformation (blue trace) of compounds scored relative to appropriate DMSO-control distribution (red trace) is performed to suppress activity differences among measurements in the noise and to normalize the contributions of assays with different dynamic ranges.
where the weights wp, p = 1, . . ., m, are inversely proportional to the variance of the measurement and vary across plates and runs. We scaled this weighted average by an estimate of the uncertainty in the distance between the weighted average and the negative-control distribution to obtain D:

where
We conceptualize assay results as a large (sparse) matrix with rows corresponding to compounds and columns corresponding to assays. To be more precise, since a single assay may provide multiple measurements, columns correspond to individual assay outcomes, and therefore a single assay may be represented by multiple columns. For mining primary high-throughput assay data, we assumed that for a given assay, all compounds were tested at an appropriate single concentration. Let {c1, c2, . . ., cn} be a set of compounds for which we would like to determine biological similarities based on performance. Let A = {A1, A2, . . ., AN} be a set of applicable high-throughput biological assay outcomes. For an assay outcome Ai and a compound cj, we have activity aij = Ai(cj). Because of the sparse nature of the data matrix, for some assays and compounds, the activities aij are undefined. For compounds tested in multiple concentrations, we use the most extreme value of D.
Assay Performance Profile Similarity
We wished to avoid some assays dominating similarity scores due to differences in assay dynamic range. D scores can be arbitrarily large or small, which can have adverse effects on the accuracy of profile correlation. Specifically, assays with larger dynamic ranges will receive greater weight if D score variability is not considered. Moreover, we wished to avoid assigning importance to similarities between compounds because they both fail to score in the same assay. Therefore, we applied a double-sigmoid transformation that, intuitively, will give values near 1 (or −1) to “active” compounds and values near zero to “inactive” compounds ( Fig. 1 ). The transformed values bij are given by

where the parameter α controls the width of the central flat region and the (odd) integer parameter K controls the slope. In our analysis, we use K = 3 and α = 2.3538, the latter selected in such manner that the central 95th percentile interval of the negative-control distribution is transformed into the bij interval (−0.5, 0.5).
To compute assay performance profile similarity for a pair of compounds cj and ck, we find all assays Ai such that both aij = Ai(cj) and aik = Ai(ck) are defined, and collect them into a subset A′
The z score formula implies that two compounds must have at least four common assays to get a valid value. However, if one of the compounds has only “inactive” results, that noise may appear correlated to the real signal of the other compound. Since the values b′
ij
are bounded, we can circumvent such a false correlation by requiring that the two compounds are “active” in at least one common assay. Formally, we let H′ = H′(cj, ck) be the number of coordinates i in vectors
Significance Thresholds
To determine what levels of transformed correlations represent meaningful similarities, we used the familiar chemical similarity principle: chemically similar compounds will often have similar biological behavior. The relationship between assay performance profile similarity and chemical similarity can be expressed as enrichment of chemically similar compounds among biologically similar compounds, and we can determine when such enrichment is maximal. We also explored how N′ and H′ (the number of common assays and the number of assays in which both compounds were called active) affect the enrichment.
Due to the large size of the overall compound collection (more than 400,000 compounds), it is not practical to compute all pairwise chemical structure similarities. We randomly selected more than 3 × 10⁷ random pairs of compounds (satisfying N′ > 3 and H′ > 0) and computed their chemical structure and assay performance profile similarities. For chemical structure similarity, we used a Tanimoto similarity score between nonfolded extended connectivity fingerprints with maximum bond-distance 6 (ECFP6). 21 For a given Tanimoto similarity threshold TC and a variable assay performance profile similarity threshold TB, we can construct a receiver operating characteristic (ROC) curve by plotting the true-positive rate (TPR) against the false-positive rate (FPR), where TPR = TP/(TP + FN), FPR = FP/(FP + TN); TP = compounds similar by both measures, FN = compounds similar by structure only, FP = compounds similar by performance only, and TN = compounds similar by neither measure. ROC curves are routinely used to evaluate the quality of predictive models. 22 Our situation is slightly different since we do not expect similarity of biological activity to be perfectly explained by chemical structure similarity. Nevertheless, we can compare ROC curves using an area under the curve (AUC) that increases with higher enrichment of chemically similar compounds among biologically similar compounds.
Clearly, the more assays two compounds have in common, the more reliable a prediction of a common mechanism of action will be. Therefore, we explored what effect the values of N′ and H′ have on the ROC curve (
To determine the optimal threshold TB for assay performance profile similarity, we compute precision, the proportion of TP among all pairs with transformed correlations above TB; precision = TP/(TP + FP) as a function of TB ( Fig. 2 ). We fit a polynomial of degree 3 to the precision values and found its local maximum at TB = 10.0442. Thus, in practice, we take correlation scores zjk > 10 to be those most likely to be significant when considering compounds with chemical structure information but no prior biological annotation.
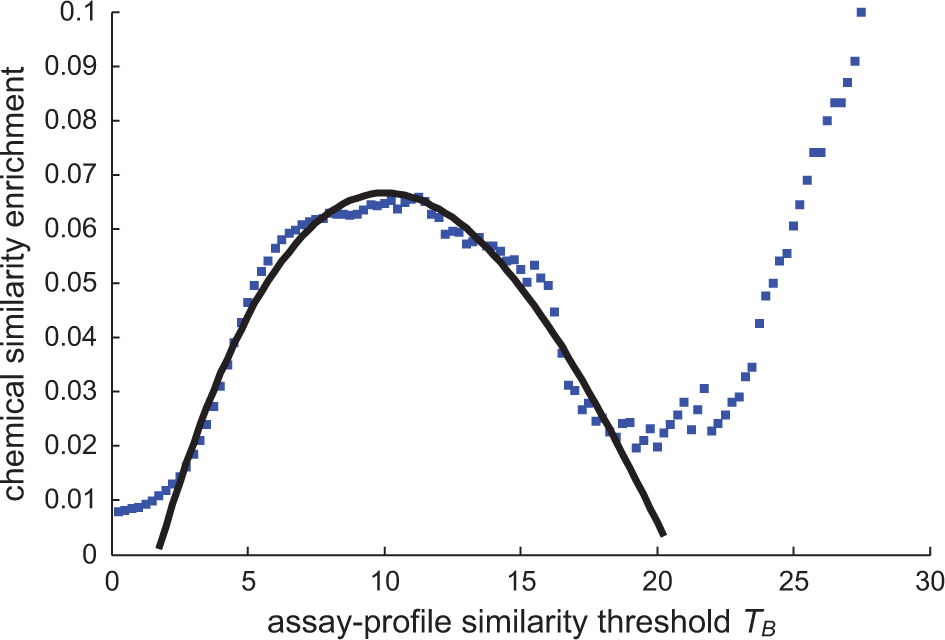
Chemical similarity enrichment provides guidance to select thresholds for assay performance profiling. We use precision, the ratio of “true” positives to all positives, to measure the enrichment of chemically similar compounds among compounds with assay performance profile similarity. Maximal chemical similarity enrichment was achieved for TB ~10. A third-degree polynomial y = 0.00001873 x3 − 0.001363 x2 + 0.02171 x − 0.03292 has the best fit (R2 = 0.9655) to precision values in the desired range.
Bayesian Modeling of Cross-Reactive Compounds
Cross-reactive (“promiscuous”) compounds are frequently reported as hits in assays due to various biological and chemical artifacts rather than genuine biological activity.23,24 While the “hit ratio” between the number of assays in which a compound was active and the number in which it was tested is a good measure of compound cross-reactivity, it has the drawback of not properly accounting for the number of measurements. Intuitively, 1/4 and 100/400 do not carry the same weight of evidence, even though they have the same hit ratio. We address this shortcoming with a Bayesian approach to cross-reactivity analysis.
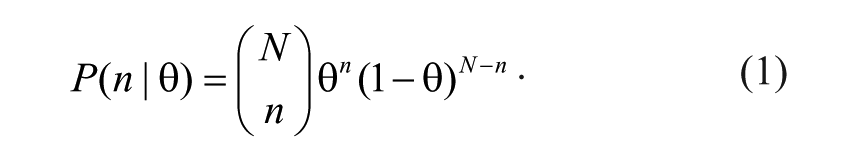
Let θ be the probability that a particular compound will be a hit in a new assay, let N be the number of assays in which the compound was tested, and let n be the number of assays in which the compound was already called a hit, so that we have n/N → θ as N → ∞. Let θ0 be the level at which compounds are qualitatively considered cross-reactive (based on experience we chose θ0 = 0.25). Let us fix the number, N, of assays in which the compound was tested. For a given θ, we can assume that n has a binomial distribution,
However, in our case, we know values for n and N and we need to assess how likely it is that θ is larger than θ0. We can write
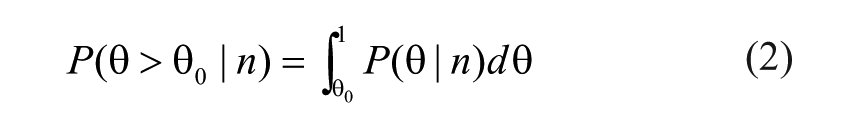
and use Bayes’s formula to express
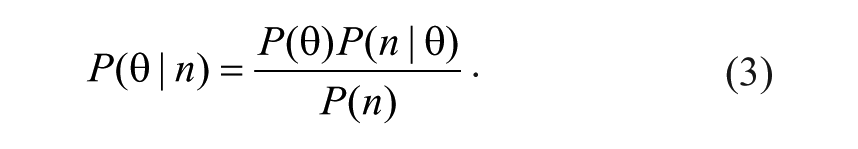
A natural choice for the prior
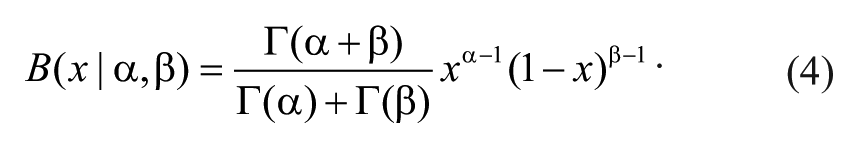
It can be shown that combining binomial distribution equation (1) and prior beta distribution equation (4) with Bayes’s formula equation (2) produces a posterior probability
We turned to historical screening data to determine appropriate values of the parameters α and β for the prior beta distribution. We selected all compounds that were tested in at least 20 assays, determined their hit ratios, and computed the average (0.126) and the standard deviation (0.0115) of the hit ratio distribution. Expressions for the mean and the variance of the beta distribution,
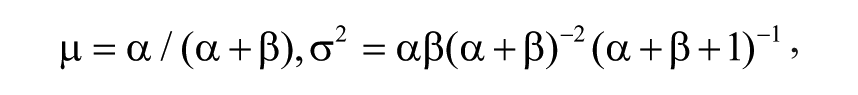
allow us to compute values for α and β. The resulting beta distribution accurately approximates the empirical hit ratio distribution (
Bayesian Promiscuity (Cross-Reactivity) Probabilities.
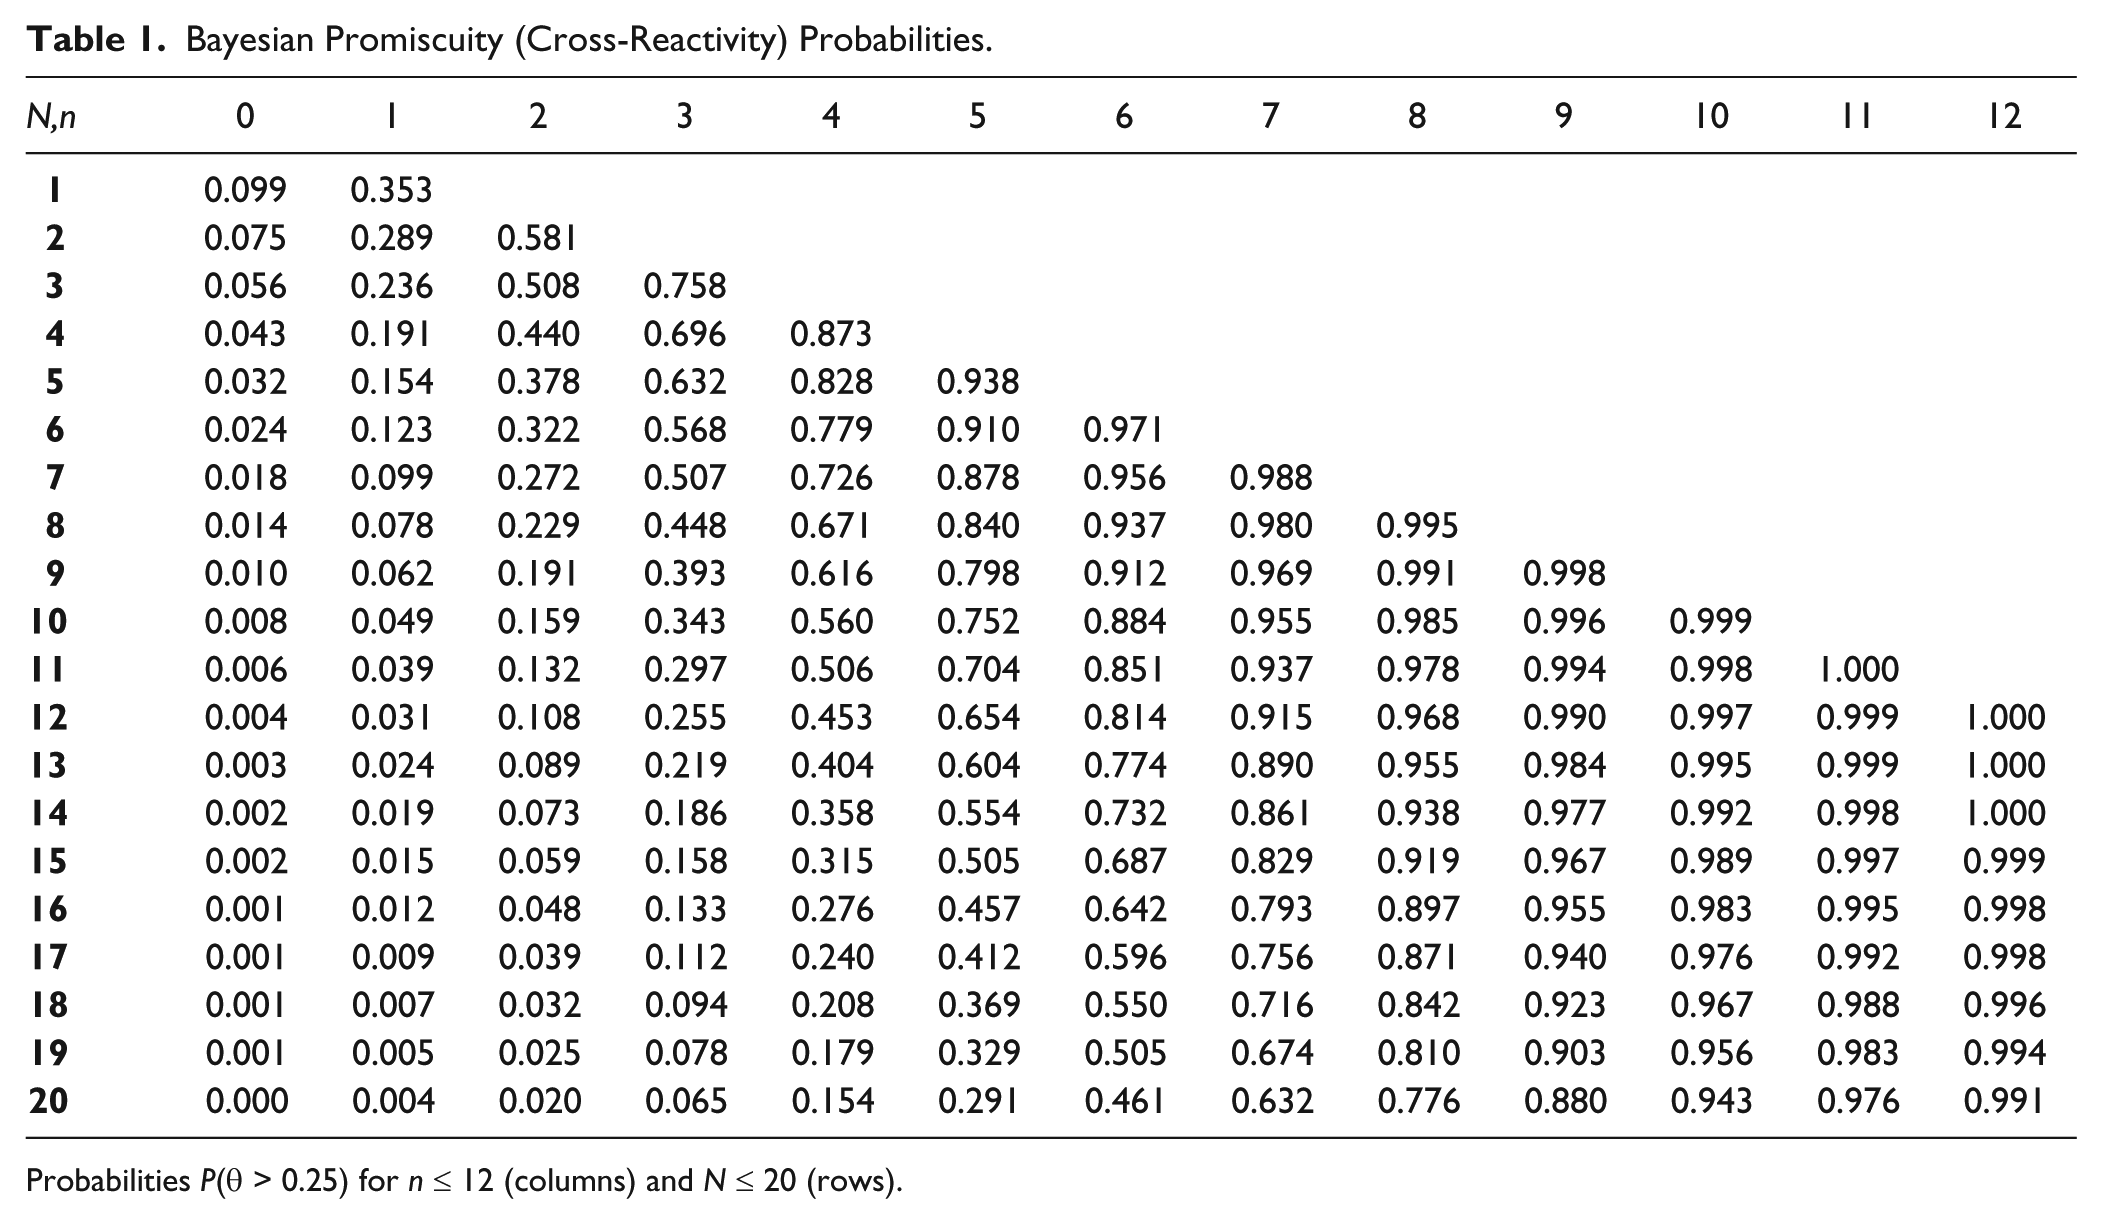
Probabilities P(θ > 0.25) for n ≤ 12 (columns) and N ≤ 20 (rows).
We also want to distinguish whether two compounds that connect to each other do so simply because they are each cross-reactive individually. Assume that two compounds with hit ratios θ and ρ were tested in N′ common assays and each was a hit in H′ of them; the overlap enrichment score, E, of the compound pair can be quantified as a ratio of actual and expected hit counts,

Connected cross-reactive compounds tend to have lower overlap enrichment scores with values below 3, and connected selective compounds have overlap enrichment scores above 3.
Results
While HTS for small molecules using cell-based assays can quickly yield compounds with desired effects, the determination of their mode of action can be more difficult. 2 Solving this problem was a major motivation in the development of assay performance profile similarity as a measure of the biological relatedness of any two compounds. Compounds with the same or similar modes of action are likely to exhibit similar behavior across multiple assays; therefore, high similarities in assay performance profiles may suggest that compounds target the same protein, or at least proteins in the same pathway. While compounds with known biological activity are a small portion of our compound collection, they can, with assay performance profile similarity, provide valuable insights into mechanisms of action for novel screening hits. For many bioactive compounds in our collection, we have high-quality annotations, including compound names and synonyms, target proteins and pathways, and disease indications. In the following applications, we use the annotations, among other interpretations, to demonstrate the role that assay performance profiling can play in discovery efforts.
Comparison of Bioactive Compounds
We selected a set of 2222 bioactive compounds from our HTS collection and explored whether historical screening data can be used to provide additional insights into their activities. For each pair of compounds, we computed an assay performance profile similarity score and filtered out pairs that did not achieve the significance threshold. We were left with 5996 connections among 934 compounds and used Cytoscape to visualize them ( Fig. 3 ). We turned to a method using random graphs with given expected degrees 26 to detect compound communities—sets of compounds with relatively dense connections with other nodes in the community and relatively sparse connections to nodes outside the community. We used the algorithm of Farutin et al. 27 that starts from each single connection and grows a community until no additional compound can improve its community score. By its nature, this algorithm produces overlapping communities and also determines community structures within larger communities. Whenever an overlap was sufficiently large, we manually merged two communities to reduce the resulting number of communities to consider. Finally, any unassigned compound that was connected to only one community was assigned to that community.
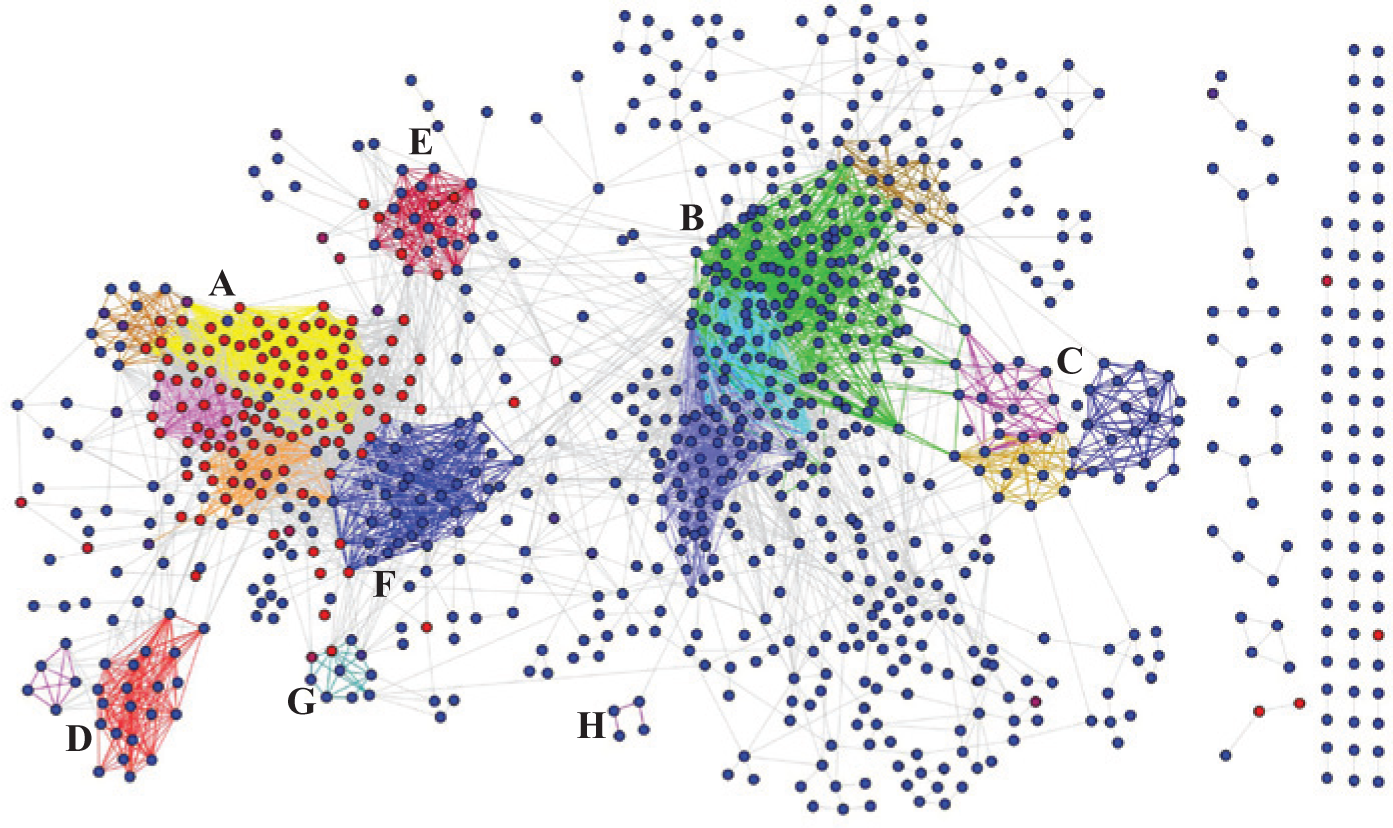
Assay performance profiling distinguishes broadly and narrowly bioactive communities of compounds. Network graph showing connections between compounds (nodes), including cross-reactive compounds (red nodes; p ≈ 1) and non–cross-reactive compounds (blue nodes; p ≈ 0). Eight communities of similar assay performance (A–H) are discussed in the text; edges are colored by membership in these communities.
We used Bayesian modeling of cross-reactive compounds to examine the potential mechanisms of action for compounds within highly connected communities. In general, some bioactive compounds can be thought of as “broadly bioactive” ( Fig. 3 , community A, average overlap enrichment score 2.15, and, partially, communities E, F, and G, with average overlap enrichment scores between 2.8 and 3.15), meaning they score in a high fraction of assays and tend to connect to other such compounds. On the other hand, compounds that tend to score in fewer assays can be thought of as “narrowly bioactive” ( Fig. 3 , communities B–D and H, overlap enrichment scores above 4). We observed that some of these latter compounds segregate into communities based on their annotated mechanism of action.
Community A contains many compounds that are toxic at screening concentrations, including anticancer drugs. Community B corresponds to bioactive compounds that do not appear to be toxic and contains, for example, pain relievers, anti-inflammatory agents, and cardiovascular drugs. Evaluation of medium-sized communities revealed remarkable clustering of certain classes of small molecules. For example, community C is composed of antibiotics that work by a variety of mechanisms, including cephalosporins, fluoroquinolones, and tetracyclines. Furthermore, we observed a distinct subcommunity within C, containing mostly sulfonamide antibiotic compounds. Notably, almost all assays with significant hit-rate enrichment among members of community C were microbial assays. Community D consists entirely of steroids, such as hydrocortisone and dexamethasone. Community E contains a set of compounds that are narrowly bioactive but mildly promiscuous, in the sense that they exhibit relatively higher hit ratios, but not at the level that would classify them as promiscuous according to our Bayesian promiscuity model. Many compounds from this community scored highly in a collection of profiling assays using genetically related cell lines. Community F contains several central nervous system (CNS) drugs as well as antihistamines. Community G is enriched for azole antifungal compounds, which we also previously identified as inducers of OXPHOS transcription in muscle cells. 28 We also observed clustering of close chemical analogues, or even independent instances of the same compound, in the smaller clusters. For example, community H has four compounds, all of which contain long hydrocarbon chains: three polyunsaturated fatty acids and farnesylthioacetic acid. These results demonstrate that historical screening data, even when focused on disparate areas of biology, can be used to reassemble known mechanisms of action and suggest new compound connections.
Target Identification
We applied our methodology to BRD7389, a small molecule we reported to induce insulin in murine pancreatic alpha cells. 29 In that study, we compared the assay performance profile for BRD7389 with profiles of 9995 bioactive compounds across 32 assays. We used the list of the top 50 compounds for decision making, since the analysis was performed before we derived a threshold for zjk. We observed multiple kinase inhibitors among bioactive compounds with high similarity to BRD7389, leading us to hypothesize that BRD7389 also targets protein kinases. We verified this hypothesis through biochemical profiling of a panel of 219 human kinases. In particular, BRD7389 potently inhibited the family of p90Rsk kinases, and knockdown of these kinases increased insulin expression in the αTC cell line.
Identifying New Compounds
In the previous example, we compared a novel compound with a set of known bioactive compounds. We also applied this method to the reverse situation, in which we started with a few manually selected compounds with desired behavior and looked for novel compounds that exhibit similar assay performance profiles. We used two bioactive compounds: the mitochondrial uncoupler trifluorocarbonylcyanide phenylhydrazone (FCCP) and the natural product piperlongumine, which was recently shown to selectively target cancer cells by elevating reactive oxygen species (ROS) levels. 30 In the case of FCCP, we had previously profiled a collection of bioactive molecules for mitochondrial activity in muscle cells 28 and were interested in identifying additional mitochondrially active compounds. Assay performance profiling of FCCP revealed an expected anticorrelation with the mitochondrial complex I inhibitor rotenone. Accordingly, measurement of the mitochondrial membrane potential in U2-OS osteosarcoma cells using rotenone and the related uncoupler CCCP reflected these profiling results ( Fig. 4a ). Interestingly, piperlongumine was strongly anticorrelated with CCCP, also reflected experimentally. Although the nuclear factor kappa-B (NFκB) inhibitor parthenolide was connected to FCCP, it did not alter the mitochondrial membrane potential (data not shown).
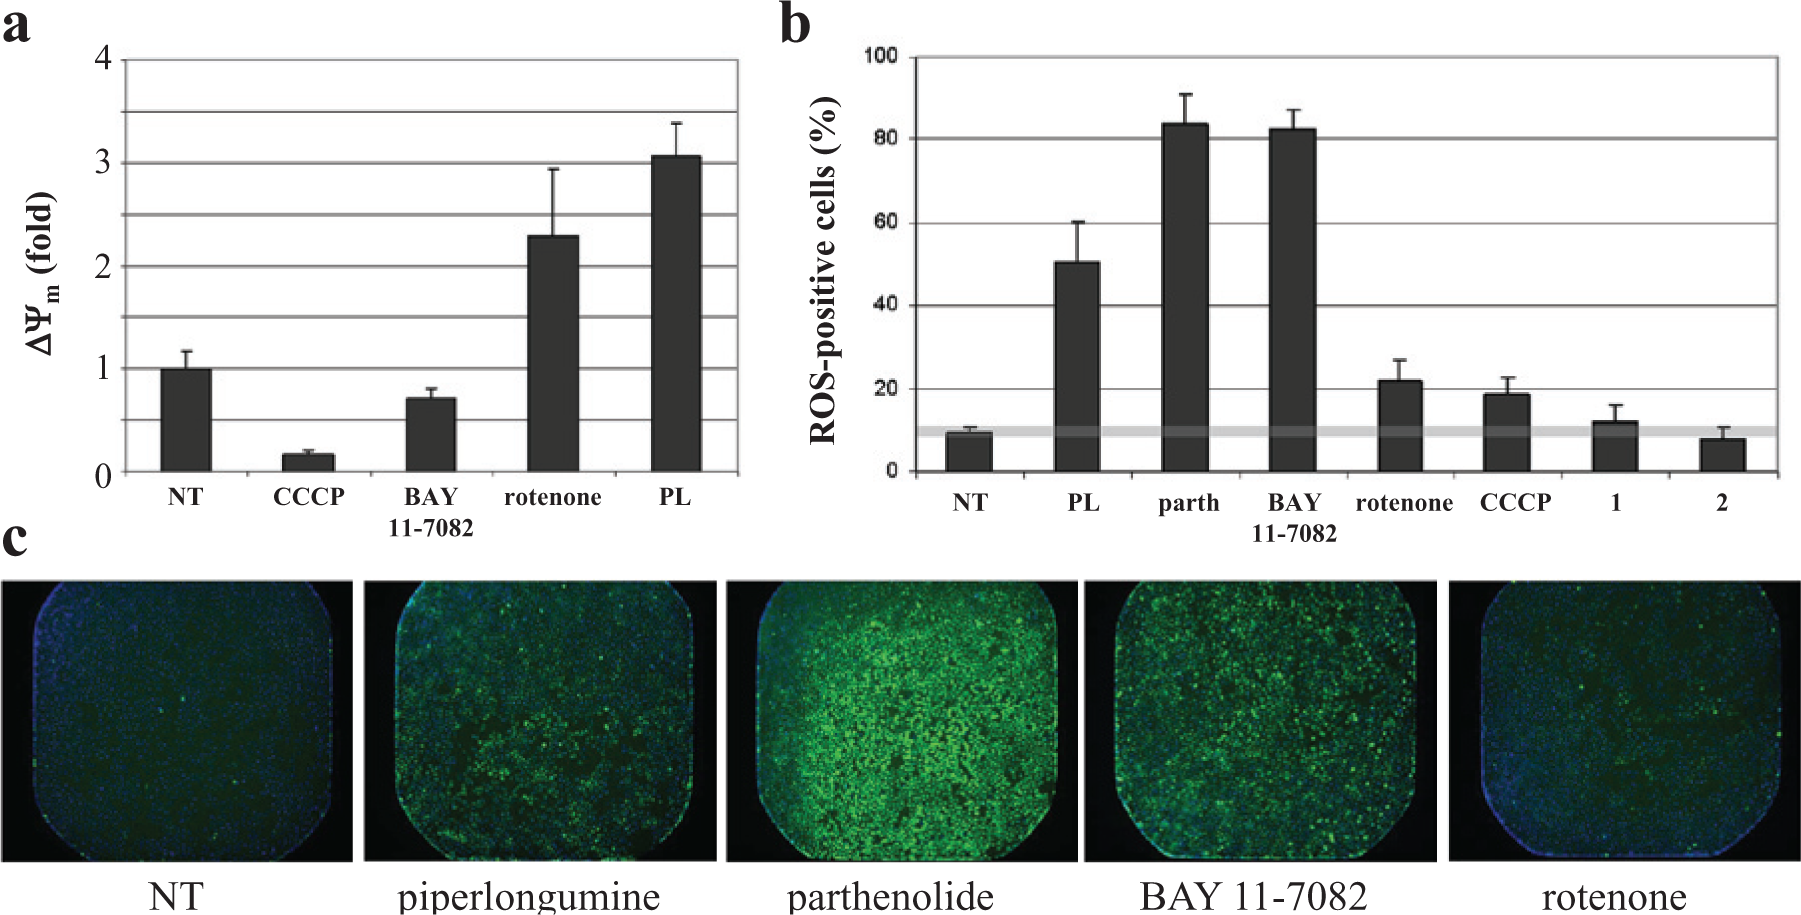
Assay performance profiling connects new compounds to compounds of interest. (
Piperlongumine is an electrophilic compound reported to display selective toxicity to cancer cells relative to normal cells. Piperlongumine causes several phenotypes associated with oxidative stress, including ROS and protein glutathionylation. We sought to identify additional compounds with cellular activities similar to piperlongumine using assay performance profiling. To that end, we compared the assay performance profile of piperlongumine with other compounds in the Broad Institute screening collection to identify a set of similar compounds that was then tested for ROS levels in U2-OS cells. The connected compounds included two electrophilic compounds, parthenolide and BAY 11-7082, that were shown to be strong inducers of ROS levels ( Fig. 4b , c ), consistent with literature reports.31,32 In this case, rotenone and CCCP, which also had similar profiles to piperlongumine, each increased ROS levels as well.
Screening Hit Prioritization
Assay performance profile comparisons can be used to prioritize HTS hits. The search for compounds chemically similar to HTS hits is a routine step in the analysis of HTS results. Assay performance profile similarity allows us to add an additional dimension by connecting compounds that potentially have the same or similar mode of action but may be different in chemical structure. That is, we anticipate that assay performance profile similarity will reveal connections not available through structure analysis alone. We computed pairwise assay performance profile similarities for a collection of HTS hits from a leukemic stem cell (LSC) HTS assay 33 and used them as a basis for hierarchical clustering ( Fig. 5a ). We further combined biological and chemical similarities to build a network of interactions ( Fig. 5b ) that revealed one large and four small clusters of related compounds.
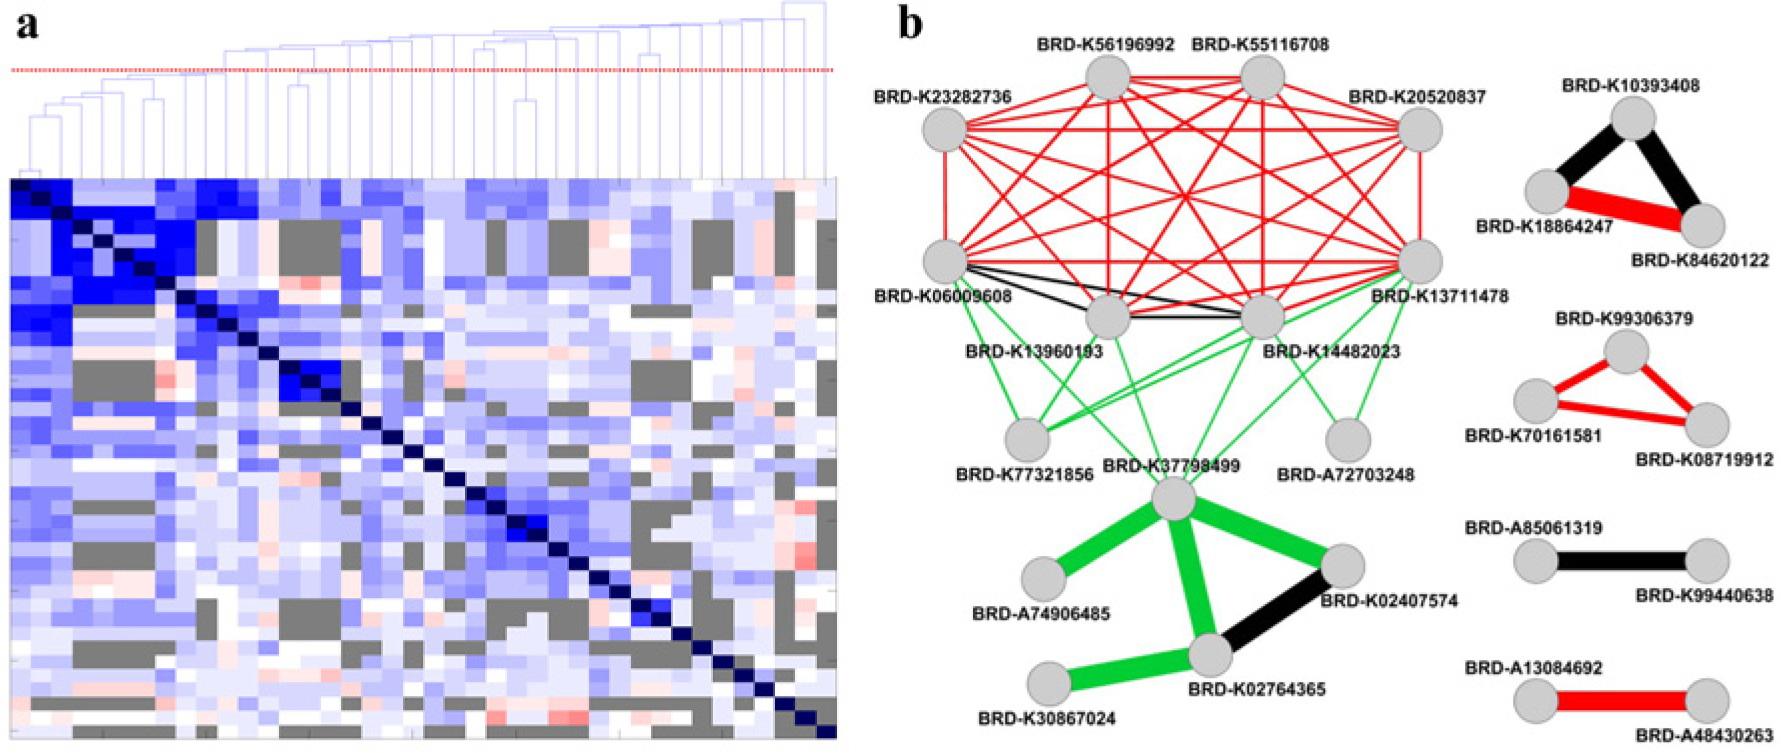
Assay performance profiling aids in prioritization of new high-throughput screening (HTS) hits. (
Discussion
Comparison of compound profiles, including gene expression, image-based, nutrient or metabolite, and assay performance profiles, can provide valuable insights into the effects of small molecules on cells. In this study, motivated by the target identification problem, we developed a compound similarity measure based on profiles of assay measurements and demonstrated the utility of this measure to detect biologically similar compounds. We anticipate this method will help identify protein targets, explore mechanisms of action for newly discovered molecules, and isolate potential off-target effects for molecules discovered in cell-based or biochemical assays. One might argue that large-scale screening is a complicated and expensive way to make connections between compounds that can readily be made using chemical structure alone. However, we assert that connecting compounds with similar activities and different structures (“lead hopping”) is an important goal in many applications, and numerous examples of such situations from other phenotypic profiling experiments are available (e.g., Lamb et al. 4 ). Furthermore, it is important to remember that the screening data used in our study were, in general, not collected with the intention of performing profiling or for the purpose of our present data-mining study. Rather, screening data such as these are collected over time in the normal course of operation of our (or any) HTS center. In all but a few cases (cf. Petrone et al. 14 ), these data accumulate but go unused for global analysis. In fact, our method is specifically useful for prioritizing new screening hits within the context of a screening facility (or shared compound collection) for which historical HTS data exist on many or most compounds. The National Institutes of Health (NIH) Molecular Libraries Program, for example, has screened a shared collection of more than 300,000 compounds across many centers over a 10-year period 34 ; these methods would be well suited to mine such data.
In contrast to earlier methods, our method of assay performance profile similarity reflects the nonuniform variance of the correlation coefficient and its nonlinear dependence on the number of observations (common assays). The symmetric nature of our similarity score allows pairwise comparisons that can be used to detect communities of compounds with similar mechanisms of action. Pairwise comparisons can be done on a global scale or among a limited number of compounds active in an assay of interest. In this study, the enrichment of chemically similar compounds was used to select a threshold for assay performance profile similarity. Since the primary data we considered were single-concentration data, we did not explicitly consider differences in connections that might arise due to testing compounds at different concentrations. Under other circumstances, where additional information is available (such as concentration-response data, biological annotations, or fusion with other profiling techniques 35 ), different thresholds for connecting compounds might be applied.
In earlier work on HTS-FP,
14
the authors assert that “it is only relevant to examine the subset of assays that both compounds share.” Our method, similarly, uses only shared assays for initial similarity calculation, but during interpretation of similarity results, we go beyond the shared assays. When two compounds that are each cross-reactive individually connect to each other in a large number of assays, this connection might be a function of their cross-reactivity, rather than due to sharing mechanistic information. On the other hand, connections involving a large number of assays among compounds with otherwise low hit ratios are likely to be phenotypically or mechanistically significant. In this study, we used this additional information to classify connected communities of compounds into broadly bioactive or narrowly bioactive communities. Comparison of our method with HTS-FP provides similar results for pairs of compounds with many shared assays. However, these two methods are different for compounds with fewer than 50 common assays, with our method more aggressively controlling for the number of observations (
Community detection, together with cross-reactivity information, allowed us to categorize compounds into narrowly bioactive and broadly bioactive communities. Inspection of broadly bioactive community A reveals many toxic agents, such as ouabain and puromycin, and anticancer drugs like doxorubicin. Flagging a compound as broadly bioactive can be useful when prioritizing hits; however, we note that in some cases, broadly bioactive compounds can be useful, especially when used at appropriate concentrations (e.g., piperlongumine). In light of these observations, one proposal might be to reduce initial screening concentrations of broadly bioactive compounds in future uses of the screening collection. In any case, full characterization of new screening hits in follow-up experiments should be performed as concentration-response experiments.
The set of biologically active compounds presented in this study is one of the most tested compound collections from our screening library. We carefully annotated these compounds with information about the nature of their biological activity, which gives us the ability to transfer such annotation (as an inferred hypothesis) to novel compounds detected by HTS. Our method of measuring assay performance profile similarity is one of many possible such measures. For example, here we consider all assays equally important and independent, a simplifying assumption that does not reflect the reality of the set of assays. Future studies of this kind should aim to use structured information about assay relationships19,34 to inform or weight similarity calculations. In the future, we plan to explore additional ways of measuring biological similarity, study their relationships, and relate them to chemical similarity.
Footnotes
Acknowledgements
We thank Dr. Monica Schenone for many valuable discussions about target identification and mechanism-of-action studies and Prof. Stuart Schreiber for helpful discussions about narrowly versus broadly bioactive small molecules.
Declaration of Conflicting Interests
The authors declared no potential conflicts of interest with respect to the research, authorship, and/or publication of this article.
Funding
The authors disclosed receipt of the following financial support for the research, authorship, and/or publication of this article: V.D. and P.A.C. were supported in part by US National Institutes of Health Genomics Based Drug Discovery—Target ID Project grant RL1HG004671 (awarded to Prof. Schreiber), which is administratively linked to the US National Institutes of Health grants RL1CA133834, RL1GM084437, and UL1RR024924. This work was also supported by Ernst Schering Research Foundation and European Union FP7 Marie Curie Grant PIOF-GA-2008-221135 (to S.T.K.); a Molecules, Cells, and Organisms Training Grant from Harvard University (to D.F.-Y.); Type 1 Diabetes Pathfinder Award DP2-DK083048 from the National Institute of Diabetes and Digestive and Kidney Diseases (to B.K.W.); and JDRF grant 17-2008-1030 (to B.K.W. and Prof. Schreiber).
References
Supplementary Material
Please find the following supplemental material available below.
For Open Access articles published under a Creative Commons License, all supplemental material carries the same license as the article it is associated with.
For non-Open Access articles published, all supplemental material carries a non-exclusive license, and permission requests for re-use of supplemental material or any part of supplemental material shall be sent directly to the copyright owner as specified in the copyright notice associated with the article.