
Abstract
Cell-based, phenotypic screening of small molecules often identifies compounds with provocative biological properties. However, determining the cellular target(s) and/or mechanism of action (MoA) of lead compounds remains an extremely challenging and time-consuming exercise. To provide insights into a compound's cellular action and greatly reduce the time required for MoA determination, we have developed a screening platform consisting of an extensive series of reporter gene assays (RGAs). A collection of > 11,000 compounds of known MoA (e.g., World Drug Index entries) were screened against the entire panel. The output provided evidence that an RGA signature could be ascribed to numerous, biologically diverse MoAs. The reference database generated suggested novel biological activity for particular compounds. For example, the profiling data led to the prediction that the cellular target of the natural product terprenin was dihydroorotate dehydrogenase (DHODH), which was confirmed experimentally. The screening methodology developed for this endeavor renders it amenable to the future examination of compounds with unknown MoA, in an automated, inexpensive, and time-efficient manner.

Introduction
The primary application of high-throughput screening (HTS) technologies is the identification of small molecules for drug development. However, additional applications of HTS platforms have been developed in recent years. For example, HTS systems that are capable of performing cell-based, “phenotypic” assays have been used to identify small molecules with notable biological properties; such as an effector of a particular signal transduction pathway. 1 2 The lead compounds identified from such screens are subsequently used as tools to recognize the relevant cellular target or mechanism of action (MoA). In turn, these findings are used to provide insights into novel strategies for therapeutic intervention for a particular disease.
The most conspicuous bottleneck in this type of screening project is the identification of the cellular target and/or the cellular MoA of the lead small molecule. 2 Systematic approaches for MoA determination of small molecules, epitomized by compound affinity chromatography by means of the small molecule physically tethered to a resin, tend to be resource intensive and time consuming. 3 Therefore, we have made a concerted effort to evaluate and develop novel technologies that are able to reduce the time and increase the success rate related to small-molecule MoA determination. The uses of such platforms would include providing the project leader with a data set that would help to eliminate lead compounds with undesirable MoAs (“fail-early”). For molecules that survive this process, the goal would be to present information useful in generating a hypothesis as to their MoA that quickly could be confirmed experimentally.
In this report, we describe a platform for MoA determination for small molecules that uses reporter gene assays (RGAs). RGAs are popular for HTS applications due to their low cost, ease of use, and amenability to high throughput (i.e., 1536-well) formats. Another conspicuous attribute of RGAs is the number of diverse reporter constructs that are available from a variety of sources, including commercial vendors. These features of RGAs meant that our application of their use toward small-molecule MoA determination involved no appreciable technological development; we were able to adapt internal reagents, facilities, and expertise toward the quick initialization of the screening effort described below. Also, large number of compounds were evaluated simultaneously and inexpensively, which are features not associated with many other compound profiling platforms. 2
The main goal of the project was the development of a reference compound profile database consisting of the activity profiles of an extensive collection of compounds where MoA annotation was available (e.g., World Drug Index entries). In theory, this database could be used to align activity profiles of compounds with known and unknown MoA and provide a testable hypothesis as to cellular activity of lead compounds identified during the course of an HTS. An inherent component of this effort would be the development of analytical tools that would be able to process and analyze the screening data and readily identify such compounds with similar activity profiles. A secondary goal was to design the platform in such a manner that a complete analysis of smaller number of compounds (100–1000) would be able to be obtained in a short manner of time and with minimal resources required. This report focuses on the steps involved in the development of the reference compound profile database and describes strategies that we intend to use for future routine profiling efforts. Also, we provide examples of activity profiles that have common MoAs and our ability to correctly determine the MoA of a compound based upon its activity profile.
Platform Design
Screening System
At the outset of this project, we anticipated that we would perform two replicates of 40 assays, whereby each assay would be composed of four readings of 100 1536-well assay plates. Therefore, we estimated that >49 million data points would be acquired over the course of these screens. To accomplish this prodigious screening effort, the HTS equipment would have to complete successfully all the required steps in the absence of human operation after the initiation of cell dispense. The HTS systems used for this project were designed and manufactured by the Genomics Institute of the Novartis Research Foundation (GNF) in San Diego, CA (available through GNF Systems, San Diego, CA). An extensive description of the design aspects of a unit essentially identical to the ones used in this study has been published recently, including the experiences of the authors with unattended operation. 4
Compound Collection
The compound collection used in these screens was prepared at GNF. A search of the compound archive at GNF identified a number of compounds where annotation related to their MoA was available thorough publically available resources or proprietary internal databases. 5 Also, commercially available focused compound libraries were purchased including the Tocriscreen Complete Collection (Tocris Bioscience, Ellisville, MO) and LOPAC (Sigma-Aldrich Company, St. Louis, MO). In total, 11,435 unique compound structures were screened. All compounds were arrayed in a dose—response format with the vast majority of compounds screened using a 2-μM final top assay concentration followed by seven half-log dilutions. Approximately 1.5% of the compounds were arrayed in a 12 dose—response curve with a 20-μM top assay concentration.
Reporter Gene Constructs
Reporter gene constructs, consisting of a specific and well-characterized promoter element that regulates the expression of a readily assayable marker, such as firefly luciferase, have been a popular HTS approach for many years.
6
The RGAs selected for our platform were based on several factors including (1) coverage of a wide range of biological space, (2) initial assessment of screening characteristics (dynamic range,
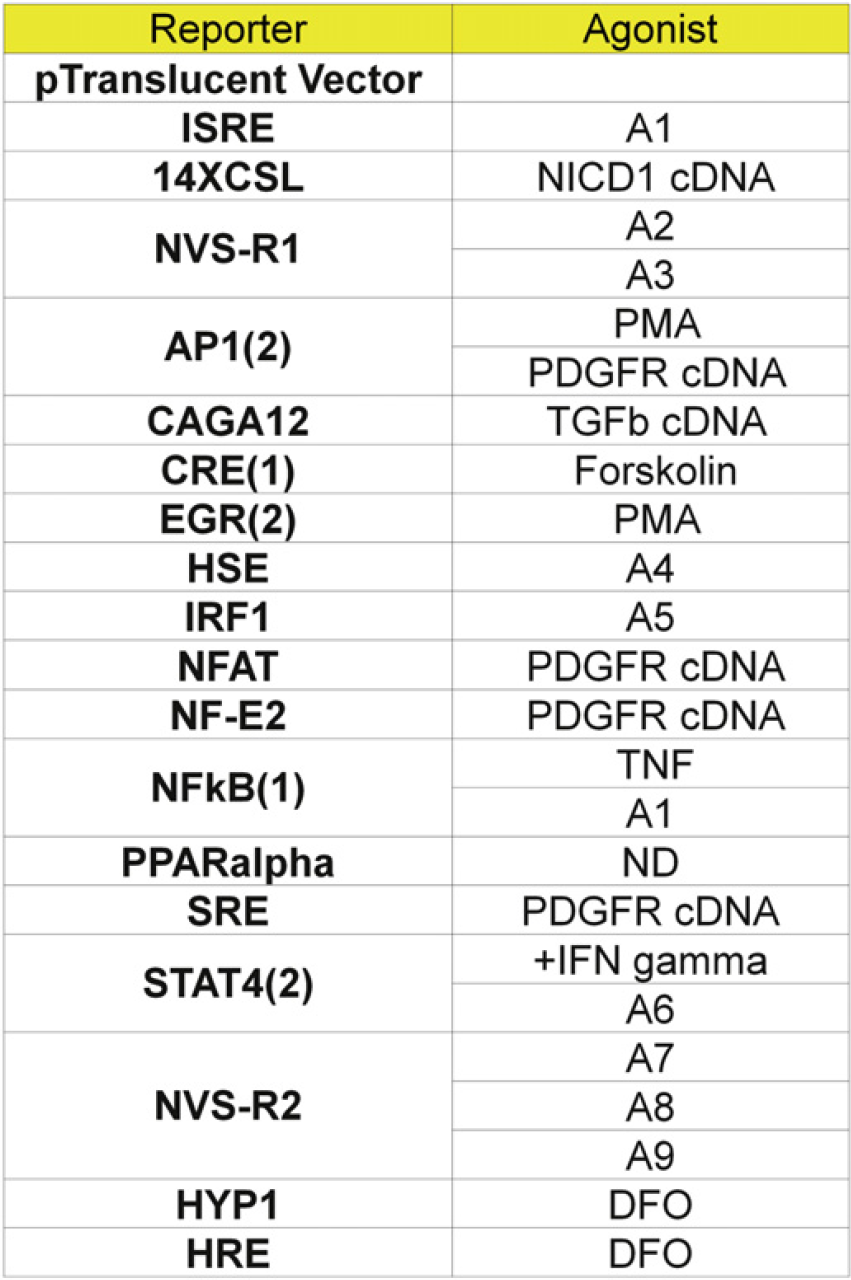
Reporter gene constructs used for the panel. Most of the reporter constructs described were obtained from Panomics (Fremont, CA), except for HYP1 (SwitchGear Genomics, Menlo Park, CA) and NVS-R1 and NVS-R2 (proprietary reporter constructs). The cDNA agonists listed used the human homolog of the genes indicated. A1-A9 are proprietary agonists. Chemical agonists, Phorbol 12-Myristate 13-Acetate (PMA), Tumor Necrosis Factor (TNF), Deferoxamine mesylate (DFO), and Forskolin were purchased from Sigma-Aldrich Company, St. Louis, MO and Interferon (IFN) gamma was purchased from R&D Systems (Minneapolis, MN). ND = Not done.
All assays were performed by transiently transfecting an individual reporter construct into HEK293T cells (ATCC, Manassas, VA). The primary advantage of performing assays using transiently transfected cells versus using a stably transfected cell line for each reporter construct was the ability to reduce the tissue culture effort required for rapid screening of the entire RGA panel (see Discussion). The “bulk” transfection mixture, consisting of a plasmid to Fugene 6 (Roche Diagnostics, Indianapolis, IN) ratio of 1:3, was added to the trypsinized cells (resuspended at a concentration of 4 × 10⁵ cells/mL in phenol-red free Dulbecco's Modified Eagle Medium [Hyclone Laboratories, Logan, UT] with 2% fetal bovine serum [Hyclone Laboratories, Logan, UT]). d-Luciferin (Promega Corporation, Madison, WI) was added to the cellular preparation to a final concentration of 50 μM (see below), and the mixture was dispensed into 1536-well plates (5 μL/well, Greiner Bio-One, Monroe, NC).
“Agonist” assays involved transfection of reporter gene constructs alone (looking for compounds that induced reporter activity); “antagonist” assays included the additional supplementation of an appropriate stimulus (looking for compounds that imparted activity inhibition). In total, the entire panel comprised 43 unique assays. Generally speaking, the cost of the consumables used for each assay ranged from $0.0075 to $0.01 per well, with the more costly assays using relatively expensive chemical agonists. To limit future screening costs and simplify the assay protocols, cDNA agonists were evaluated and used wherever possible.
Results
Evaluation of Luciferase Activity in Viable Cells
Detection of intracellular firefly luciferase is accomplished by coincubation with its substrate, d-luciferin, resulting in the formation of oxyluciferin and light. 10 The ability for luciferin to cross the cellular membrane of mammalian cells is inefficient. 11 Consequently, commonly used protocols for the detection of luciferase levels within cultured cells include a detergent for cellular lyses that accompanies the addition of the luciferin substrate. 10 However, the requirement for cellular lyses is not absolute; visualization of intact luciferase-bearing cells in viable animals that have been injected with d-luciferin is a well-established technique. 12
For our RGA platform, we opted to supplement our cellular preparations with 50-μM d-Luciferin coincident with the addition of the transfection mixture to the trypsinized cells. This was followed immediately by the dispense of the cellular preparation into assay plates. There were two main advantages of this approach: (1) the cost of d-luciferin is dramatically lower than the analogous quantity of an end-point detection reagent and (2) we were able to acquire readings of the same assay plate at multiple time points over the course of the assay, thereby obtaining increased quantities of data for no appreciable additional expenditure.
An important consideration of coincubation of luciferin with the RGAs was the ability of luciferin to provide a robust signal during the entire course of a typical assay. To assess the stability of the luciferin, a RGA was dispensed into assay plates and the cells were incubated for 24 h. Next, an appropriate stimulus was added to the assay plate and the signal was evaluated every 2 h for the next 3 days (Fig. 2A). The luciferase activity peaked 44–54 h posttransfection (20–30 h poststimulus) followed by a slow signal decay. This would suggest that the stability of the luciferin was sufficient to allow evaluation of luciferase activity to be determined for at least 48 h posttransfection and possibly longer. To put it another way, the permanence of the transfected plasmids was likely the rate limiting step for signal detection, not the luciferin stability. Some of the RGAs listed in Figure 1 showed extremely robust activity, yet we did not encounter a situation where it appeared that the luciferin was depleted within the standard 48 h assay (data not shown). However, our ability to obtain routinely good quality data after 48 h varied from screen to screen. Therefore, the standard assay was terminated 48 h after the cell dispense.
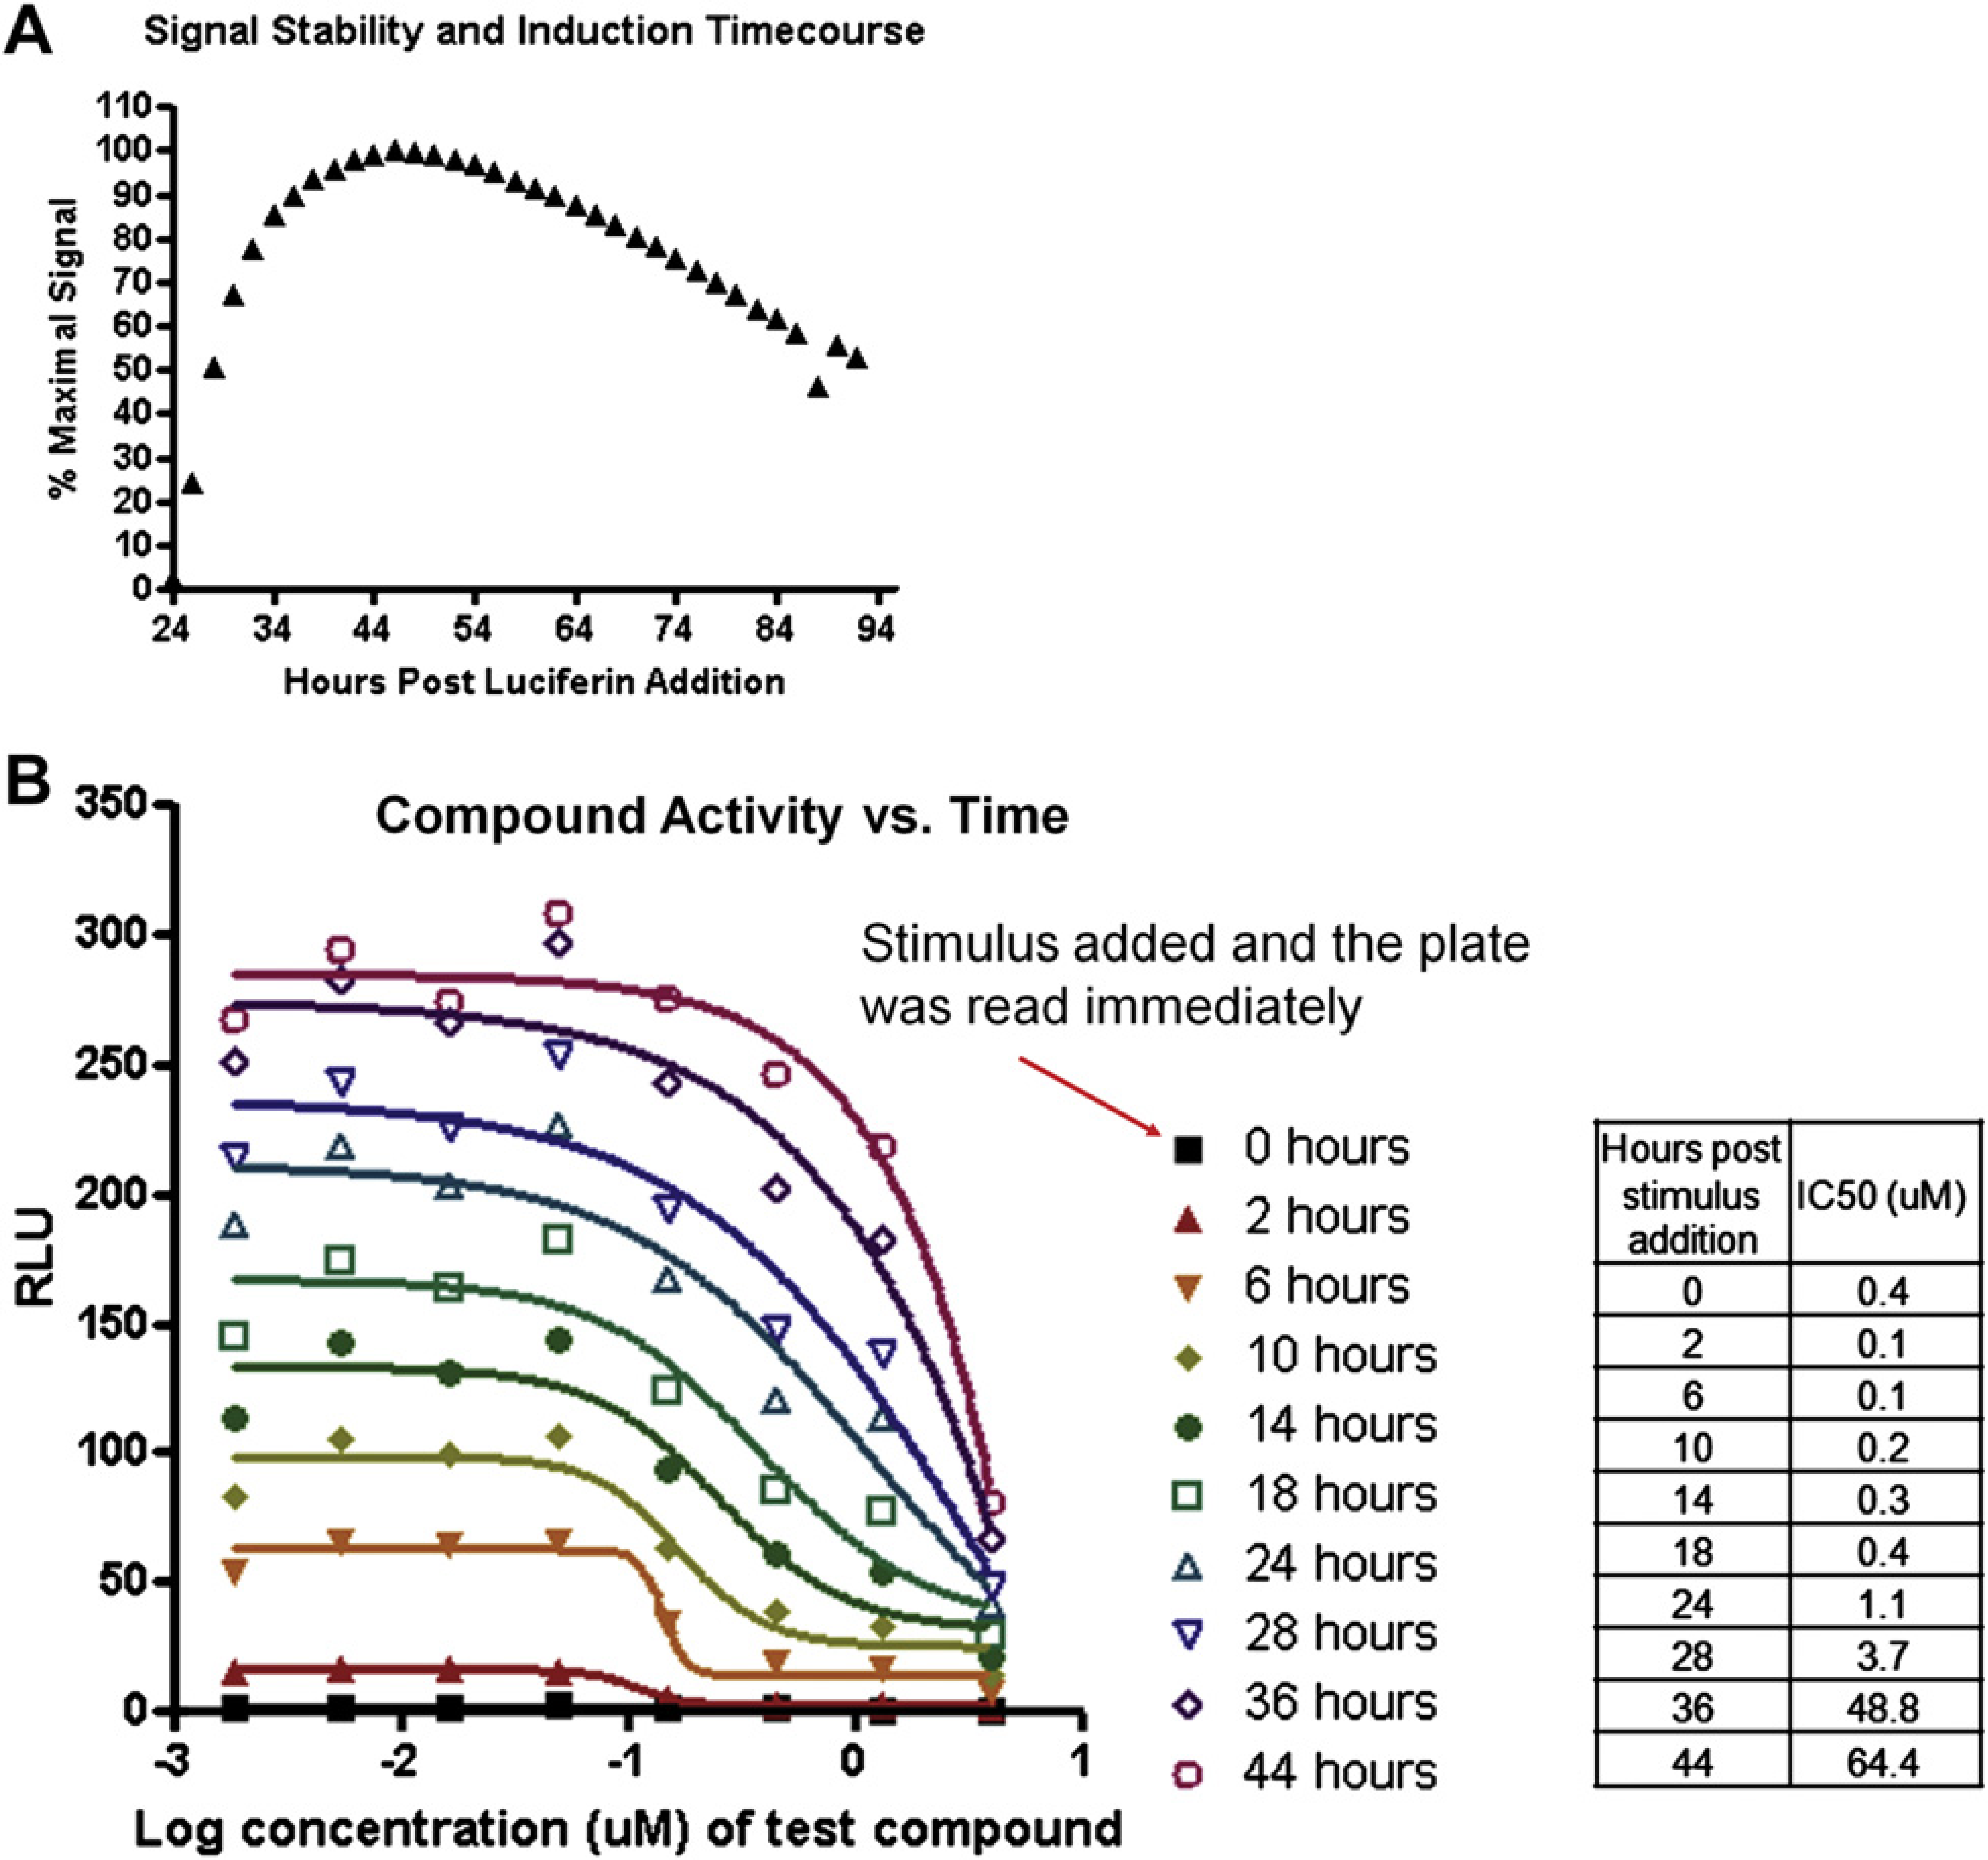
Dynamic analysis of intracellular luciferase activity by coincubation of the cells with luciferin. (A) d-Luciferin (50-μM, final concentration) was added to the cells transiently transfected with a reporter gene construct and then the cellular preparation was dispensed into assay plates. Twenty four hours later, an appropriate agonist for the particular reporter construct was added to the assay plates. The luciferase activity was evaluated at 2-h intervals. (B) The luciferase activity associated with a test compound was determined at the times indicated. How the IC50 values (Prism, GraphPad Software, La Jolla, CA) varied for each time point is summarized. RLU = Relative Luminescence Units.
We performed an initial analysis of ∼1,000 compounds against six RGAs in order to evaluate the optimal number and nature of the time points that would maximize the amount of useful information while maintaining acceptable throughput. Our analyses determined that a small number of compounds displayed a range of activity that was time dependent. For example, the IC50 determined for one compound ranged 100-fold depending upon the time point used to perform the IC50 calculation (Fig. 2B). Although these types of findings were intriguing, they appeared to be fairly rare.
After several time course studies, we determined that acquiring four readings of each assay plate would achieve a proper balance between obtaining nonredundant data for purposes of developing activity profiles and maximizing the number of RGAs and compounds that could be assayed per given time (Fig. 3). The readings taken at 12 and 24 h (Read 3 and Read 4, respectively) after compound addition were intended to evaluate the activity of the compound in relation to the particular reporter being interrogated. Two additional readings were taken that were intended to be used to assist in the interpretation of the data acquired at the 12- and 24-h time points. The first plate reading (Pre-read) was taken 20 h after the cell dispense and before the addition of compound. By that time, there tended to be sufficient basal luciferase activity that a 40-s exposure on the Viewlux (Perkin Elmer, Waltham, MA) provided an evaluation of the uniformity of the cell dispense across each assay plate. The second reading (Read 2) was acquired 10 minutes after compound addition. Presumably, this is insufficient time for the compound to affect a signal transduction pathway and alter luciferase protein levels. Therefore, it is postulated that the values obtained at this time point reflected an evaluation of how the test compounds affected the luciferase enzymatic reaction, either by influencing luciferase directly or one of the other factors that regulate luciferase's generation of oxyluciferin. 10 A surprisingly large number of compounds demonstrated some type of change in luciferase signal after this 10 minute incubation (Fig. 3). Many of these signals dissipated by the 12 h read (Read 3), yet a subset persisted for the entire 24 h incubation (Read 4; Fig. 3 and data not shown). The activity associated with 10 minutes of compound incubation appeared to be a general phenomenon with all of the RGAs used and not assay specific (data not shown).
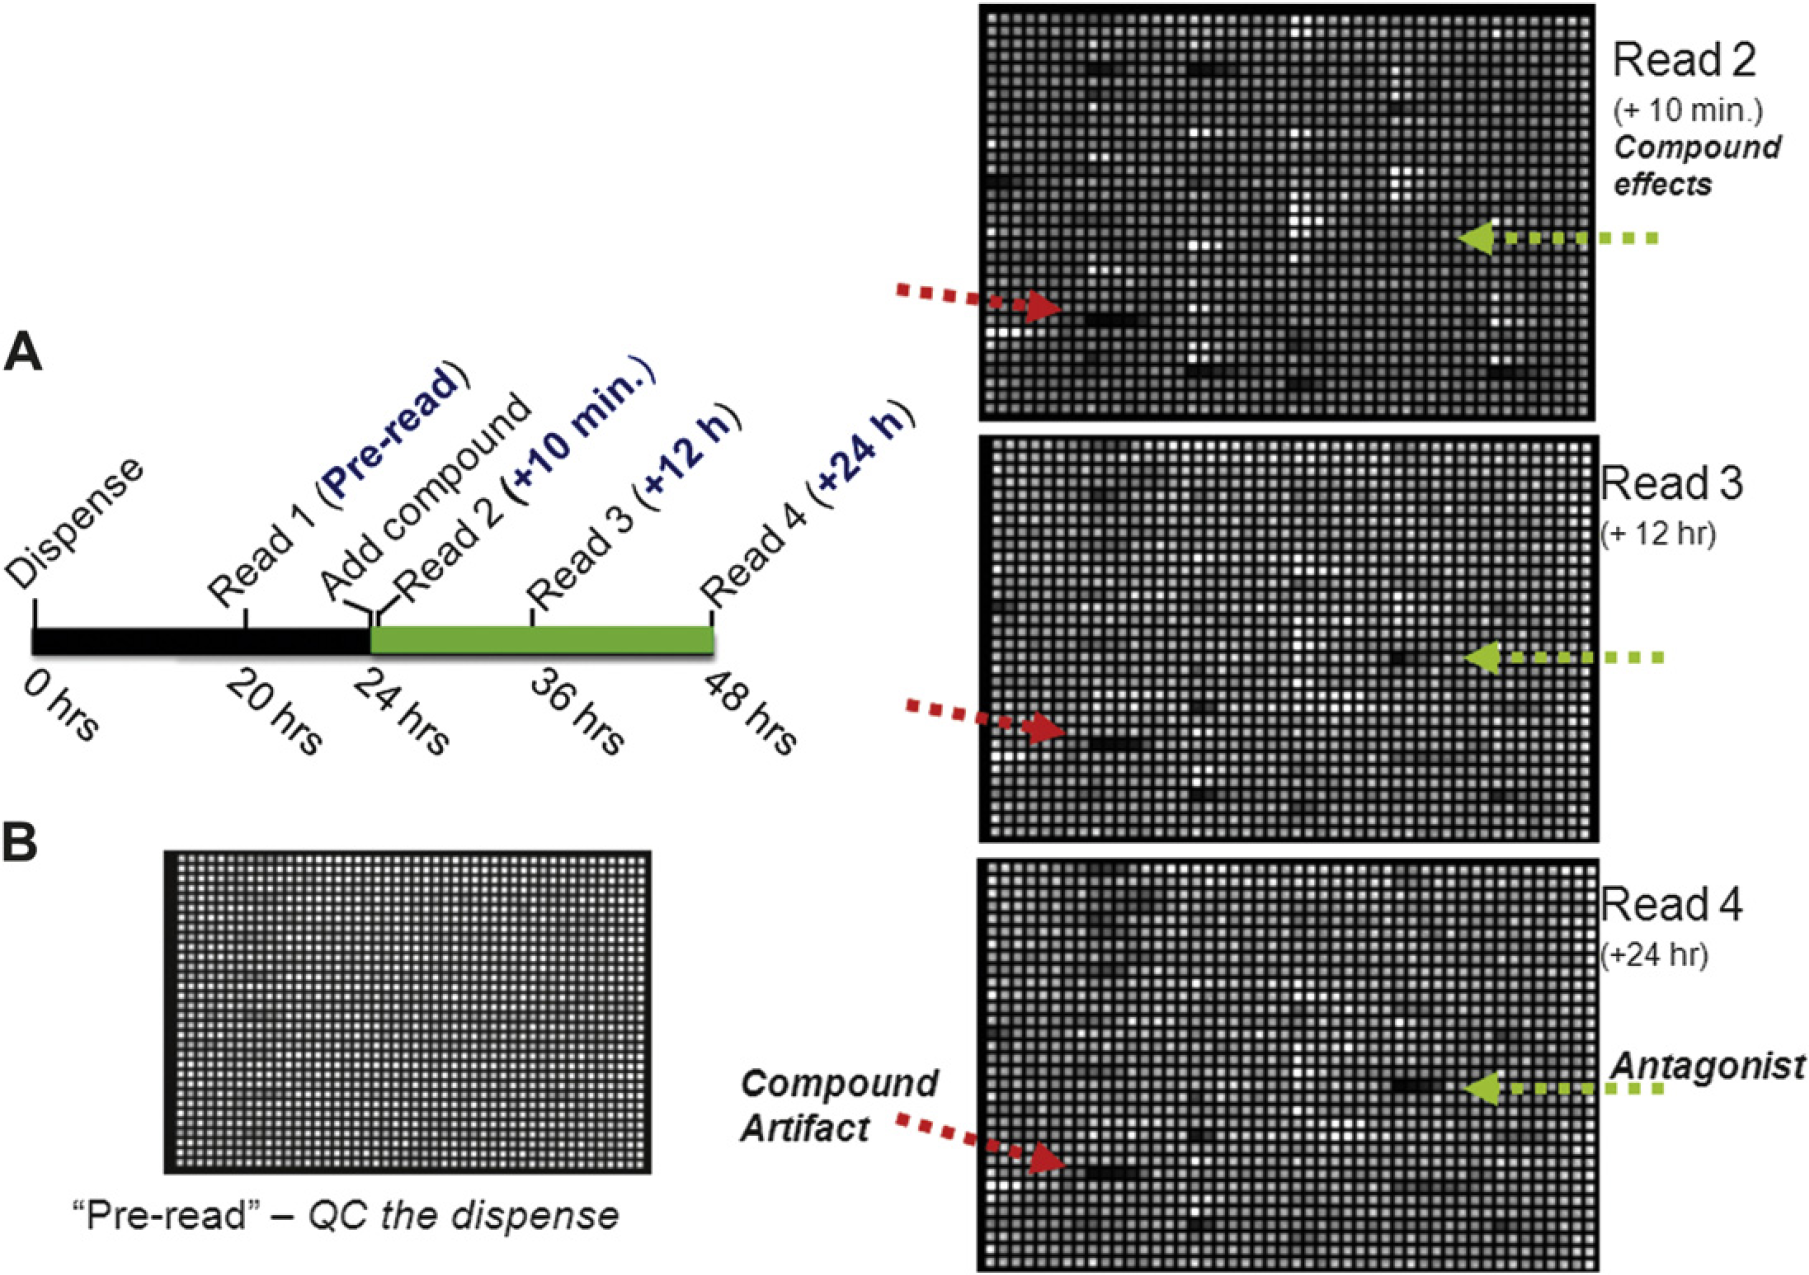
Time points used for data acquisition and subsequent analysis. (A) An overview of the timing of certain steps of the typical assay. (B) Viewlux (Perkin Elmer, Waltham, MA) images of a single assay plate that depict the signal variation at different stages of the assay. Each image is the result of a 40 s exposure, and high (white) and low (black) signals are scaled for each reading independently. The red arrow points to a compound where apparent activity is detectable after 10 minutes of compound incubation and has no visual signal change over time. The green arrow notes a compound where the activity does alter over the course of the assay.
Using this protocol, the rate limiting step of the assay was determined to be the readings of the assay plates; ∼25 plates were able to be processed per hour using a Viewlux (Perkin Elmer, Waltham, MA) and a 40-s exposure. Consequently, a typical screen of 100 assay plates took 4 h for the entire set to be analyzed for a single time point. Still, we were able to superimpose two such screens on a single day by staggering the second cell dispense by 8 h. Using this approach, we have been able to screen successfully up to 600 assay plates per week with an HTS system that has a single Viewlux.
Data Processing
All assay plates were subjected to data quality analysis using the readings from the 24 h time point (see below). The data associated with obvious artifacts (e.g., evaporation, clogged dispensing tip) were removed from subsequent analysis. The data points from each assay plate were normalized in a systematic fashion using the mean values from wells that received the lowest concentration of test compounds. As a surrogate to IC50/EC50 determination for each compound, we calculated a “DR50” for each compound and time point (Fig. 4). The DR50 for each compound was calculated as follows: was somewhat arbitrary. However, the numbers selected successfully evaluated relatively “noisy” screening data, as determined by compounds with no clear activity trending toward zero. DR50 values were determined for replicates individually and then were averaged. A separate DR50 determination was performed for each time point. The DR50 values obtained were the basis for further analysis, particularly, hierarchical clustering that was performed in Spotfire DecisionSite (TIBCO Software Incorporated, Palo Alto, CA), using complete linkage and Pearson correlation as the similarity measure. The clustering analyses were based on the activity associated with the 12 h and 24 h time points.
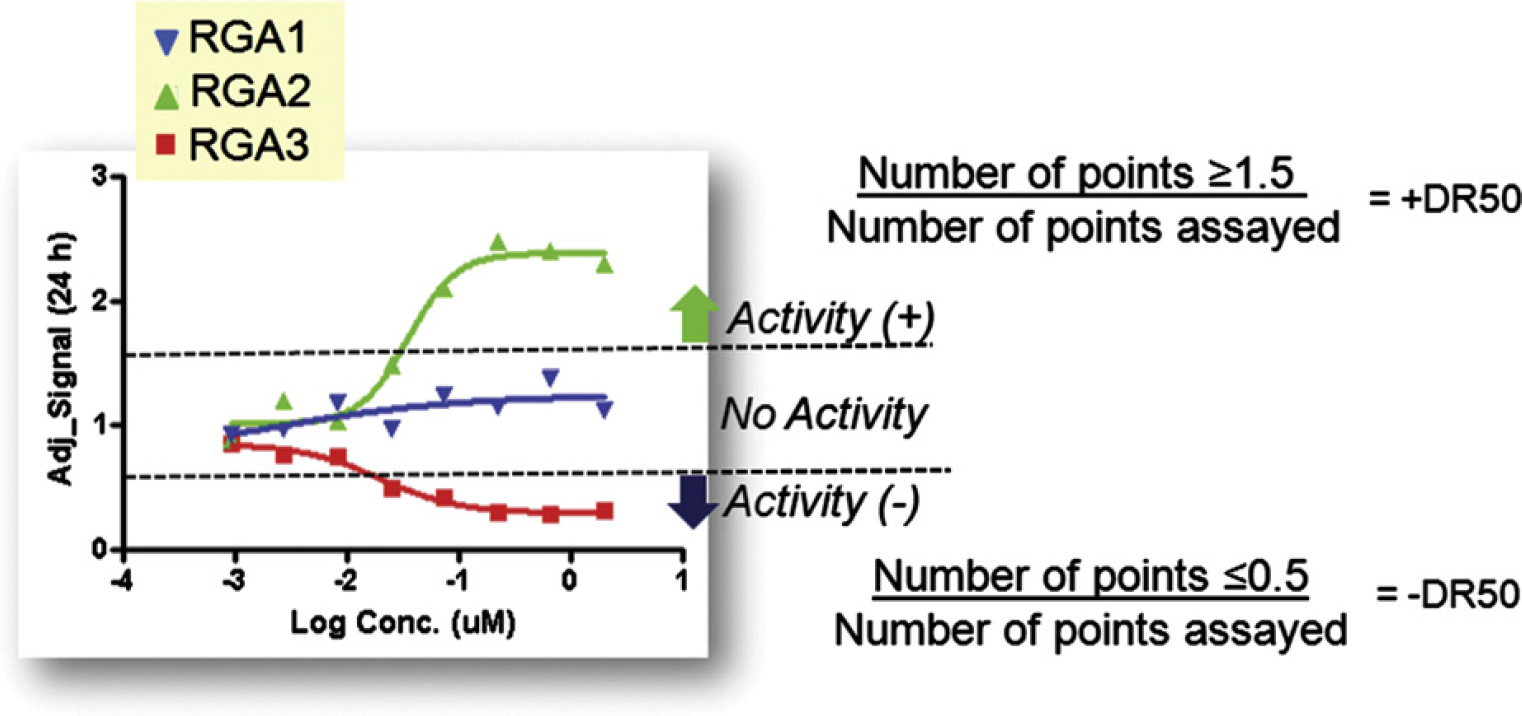
DR50 calculation. The methodology used to calculate DR50 values is depicted with an example of a compound that had a +DR50, -DR50, and DR50 = 0 value from three different RGAs.

DR50 values ranged from −1 (a potent antagonist) to +1 (a potent agonist), with inactive compounds falling near zero. This measure had a number of advantages over traditional curve fitting—based measures, including ease of interpretation and the ability to be calculated in a fully automated fashion. The selection of the DR50 cutoff values (Fig. 4)
Evaluation of RGAs and Agonists
We evaluated several different general assay strategies to identify the minimum number of RGAs that would provide the maximum amount of informative data. For example, we screened multiple reporter gene constructs (AP-1/luc, NFAT/luc, NF-E2/luc, SRE-luc) using the same stimulus (a cDNA encoding the kinase domain of human PDGF-Rα [Fig. 1]). The results from these screens tended to provide redundant information (data not shown). Compounds that showed activity differences between these screens did so due to dynamic range issues that were reflected in a compound's efficacy and resulting DR50 calculation. In contrast, using assays that used the same reporter but different agonists provided notable differences that were valuable for providing activity profiles that appeared useful for defining particular compound MoAs (Fig. 4 and data not shown).
The success of this platform was linked to the determination that a significant subset of the test compounds would show activity in at least one but not all of the RGAs. To estimate the percentage of the compound collection that showed activity in one or more assays, we calculated the absolute DR50 value for each compound at the 12 h and 24 h time points. As most compounds are arrayed in an eight-point dilution series, a compound that showed an absolute DR50 value of 0.125 or more would have activity associated with at least one compound dilution and this activity would be observed during all replicate screenings of the compound. This estimation excluded the small number of compounds where 1 out of 12 concentrations showed activity. We then determined the sum of the absolute DR50 values for each compound across all RGAs at these two time points and expressed these results as a histogram (Fig. 5A). The results indicated that 85% of the compounds demonstrated a DR50 value of at least 0.125 in one or more of the RGAs. In general, most of the compounds screened (58%) gave absolute DR50 values ranging between 0.125 and 1.
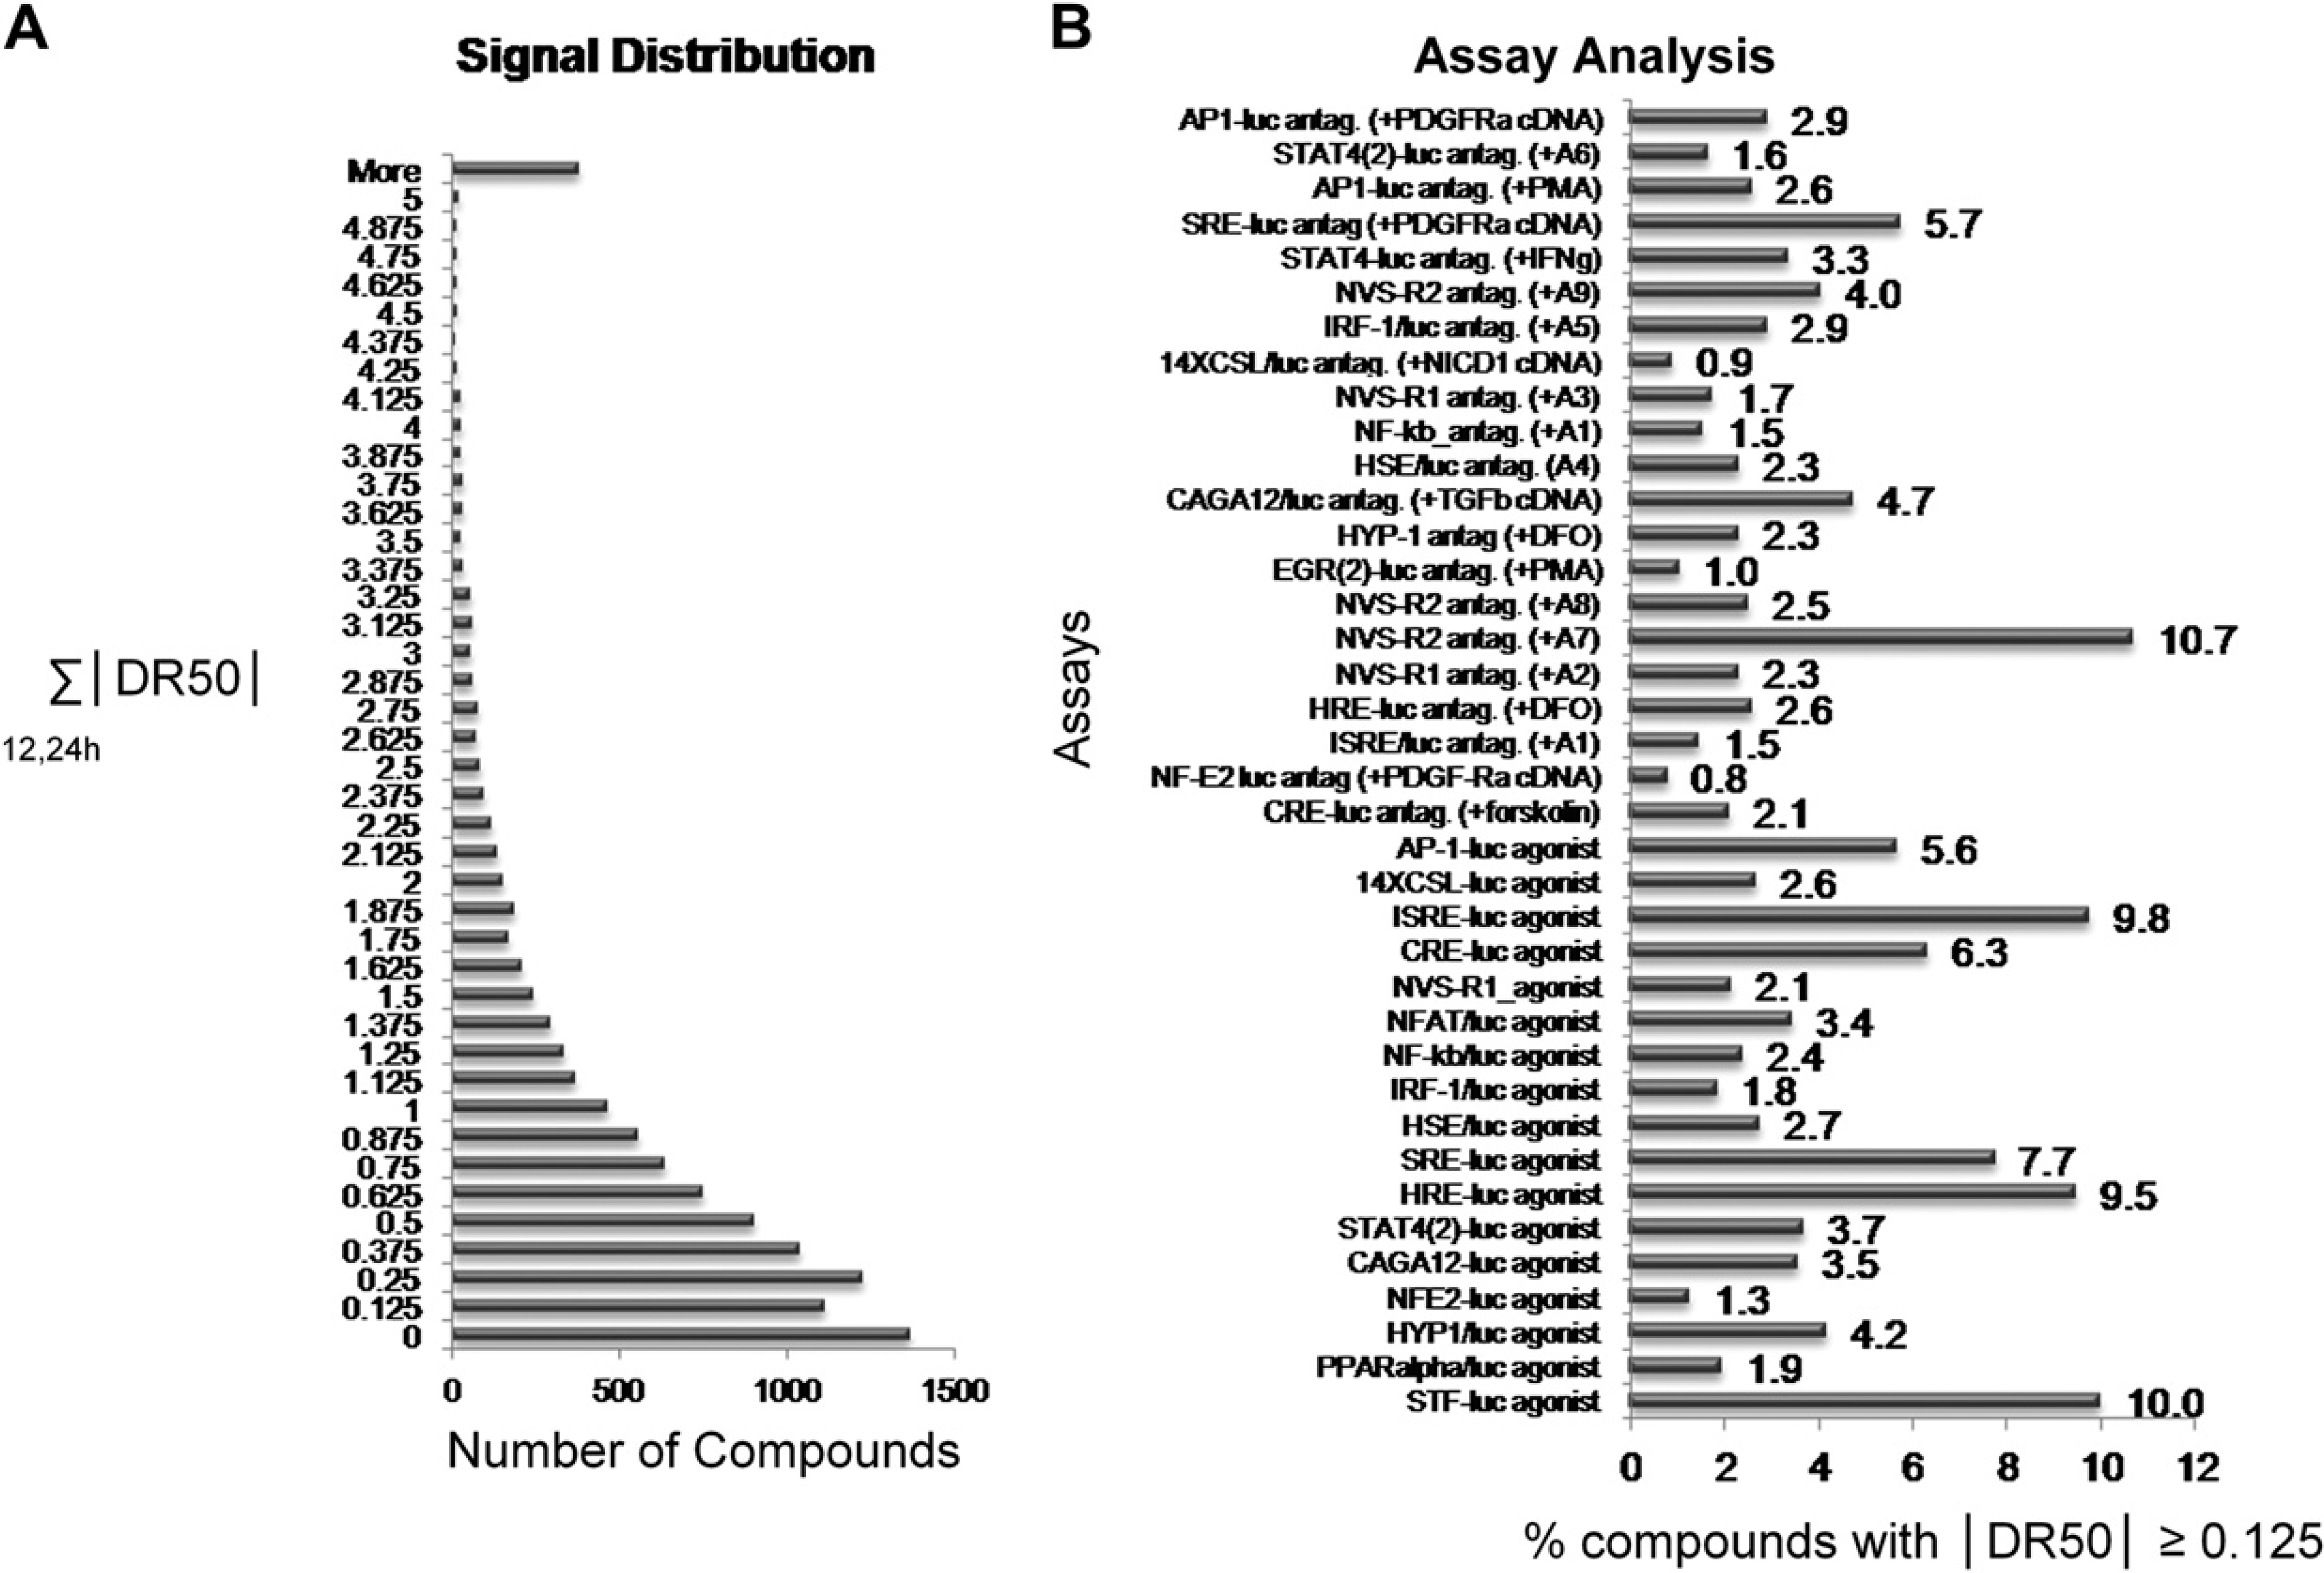
Evaluation of the reporter gene assay (RGA) panel. (A) The absolute values of the DR50 values from the 12 h and 24 h time points obtained from the entire RGA panel were summed for each compound and displayed in a histogram. (B) The percentage of compounds that gave an absolute DR50 value ≥0.125 for each screen is noted. See the legend for Figure 1 for abbreviations. Assays that are labeled as “agonist” have a reporter construct alone; the screen is intended to identify compound agonists.
A second evaluation of the RGA panel was performed to determine the percentage of compounds for each assay with absolute DR50 values ≥ 0.125. This would identify the assays where it was relatively likely or unlikely to find a compound with activity. The results showed that the compounds with activity ranged from 0.8% to 10.7% across the RGA panel (Fig. 5B). This usefulness of these results for evaluation of the RGA panel is guarded. Certain classes of compounds may show activity with a limited number of specific assays and this may be crucial to their clustering. Further analysis will need to be performed before it is clear that certain assays can be eliminated from the panel without impacting the downstream analysis. Still, these two results together suggest that RGAs are a useful methodology for obtaining activity profiles for the purpose of characterizing small molecules.
Application—Relating Activity Profiles to Cellular MoAs
The initial motivation for the development of this platform was linked to the hypothesis that the activity profiles obtained from the RGA panel would be reflective of a compound's MoA. To evaluate this supposition, the DR50 values were used to build activity profiles for each compound, which were then subjected to hierarchal clustering analyses using Spotfire DecisionSite (TIBCO Software Incorporated, Palo Alto, CA). The resulting dendrogram provided numerous examples where compounds with similar MoA formed identifiable clusters (Fig. 6 and data not shown). Compounds that demonstrated activity across a wide range of RGAs included protein synthesis inhibitors and cardioglycosides. It is likely that the profile associated with protein synthesis inhibitors is linked to impeding the translation of luciferase mRNA. In contrast, cardioglycosides are well-known activators of apoptosis and the activity observed may be due to cellular cytotoxicity. 13 14 Even still, a small number of assays and time points registered different activities, providing a means of distinguishing these two classes of compounds. Other compounds with MoAs known to affect cellular viability (e.g., microtubule effectors) exemplified a very different profile than cardioglycosides (Fig. 6). Particular kinase inhibitors demonstrated nonzero DR50 values in just one or two assays, yet this was sufficient activity to successfully cluster these compounds.
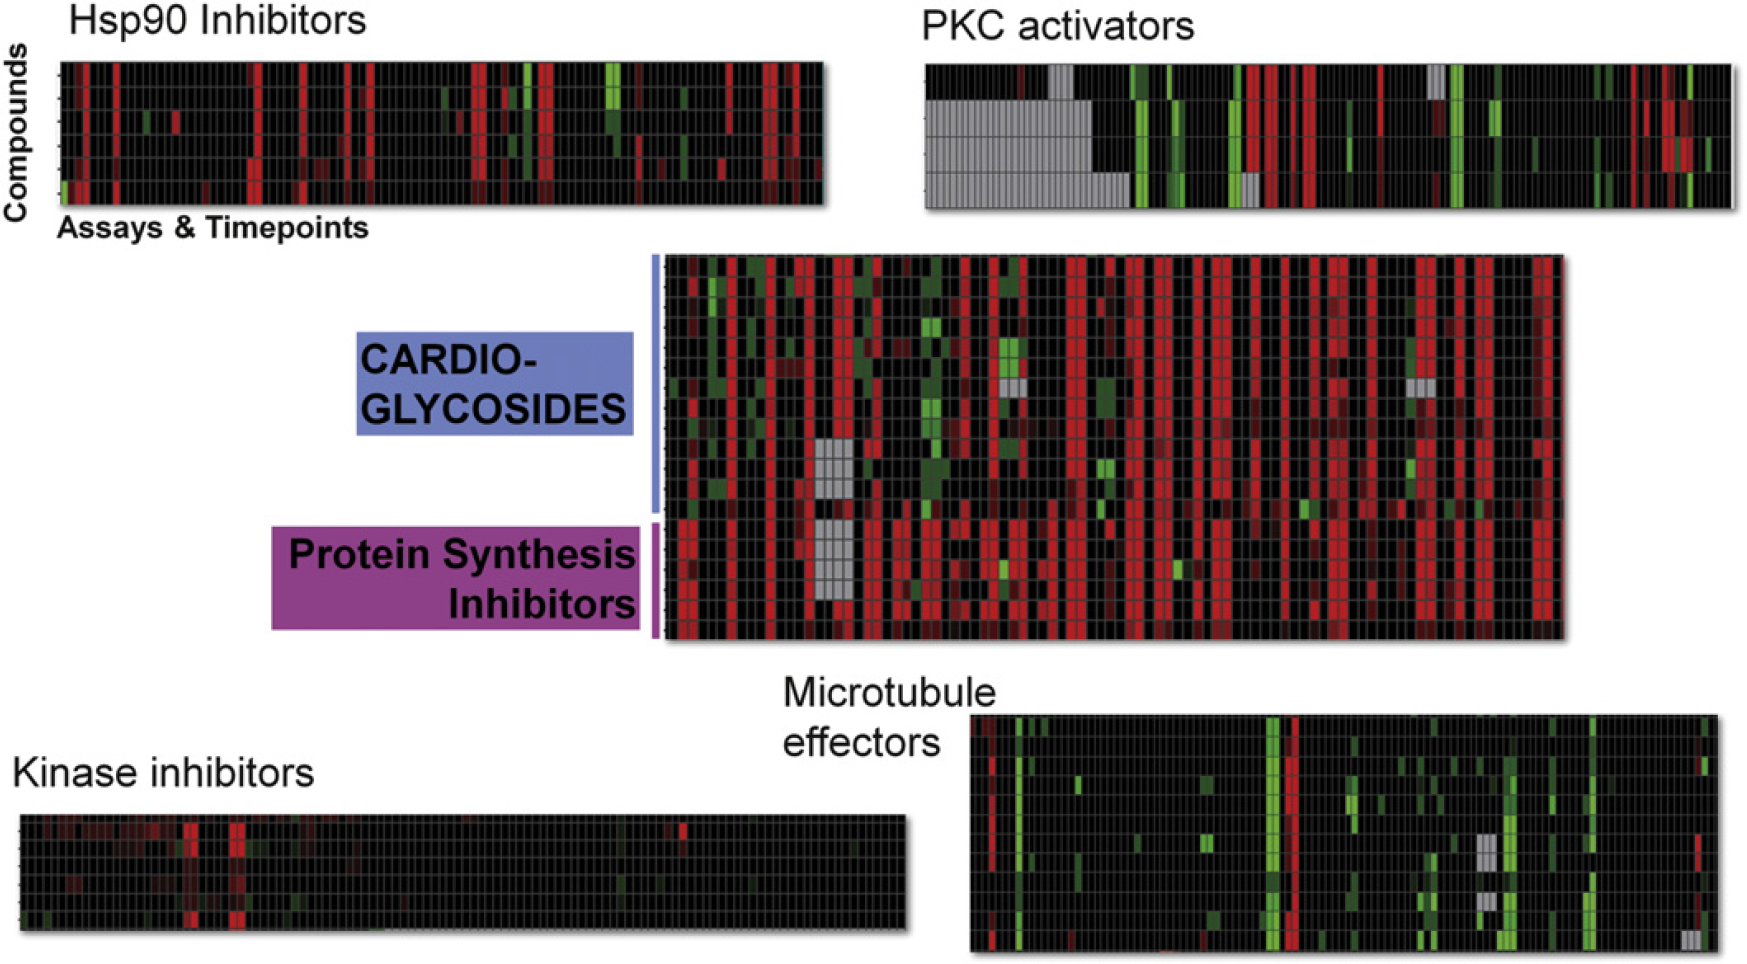
Compounds with similar mechanism of action (MoA) have related RGA activity profiles. Compounds with similar MoAs (noted in the headings) gave activity profiles that clustered together. The assays and time points are arranged across the X-axis. Time points for each assay are grouped together and kept in ascending order. Color key = Grey = no data; Green = +DR50; Red = - DR50; Black = DR50 = 0.
Within the compound set, there were members that had poorly defined MoAs (e.g., “cytostatic” or “immunosuppressive”). We identified several examples of compounds with limited associated annotation where the activity profile had notable similarity with other compounds that had a more detailed MoA description. For example, brequinar is an inhibitor of dihydrooratate dehydrogenase (DHODH), an enzyme component of the
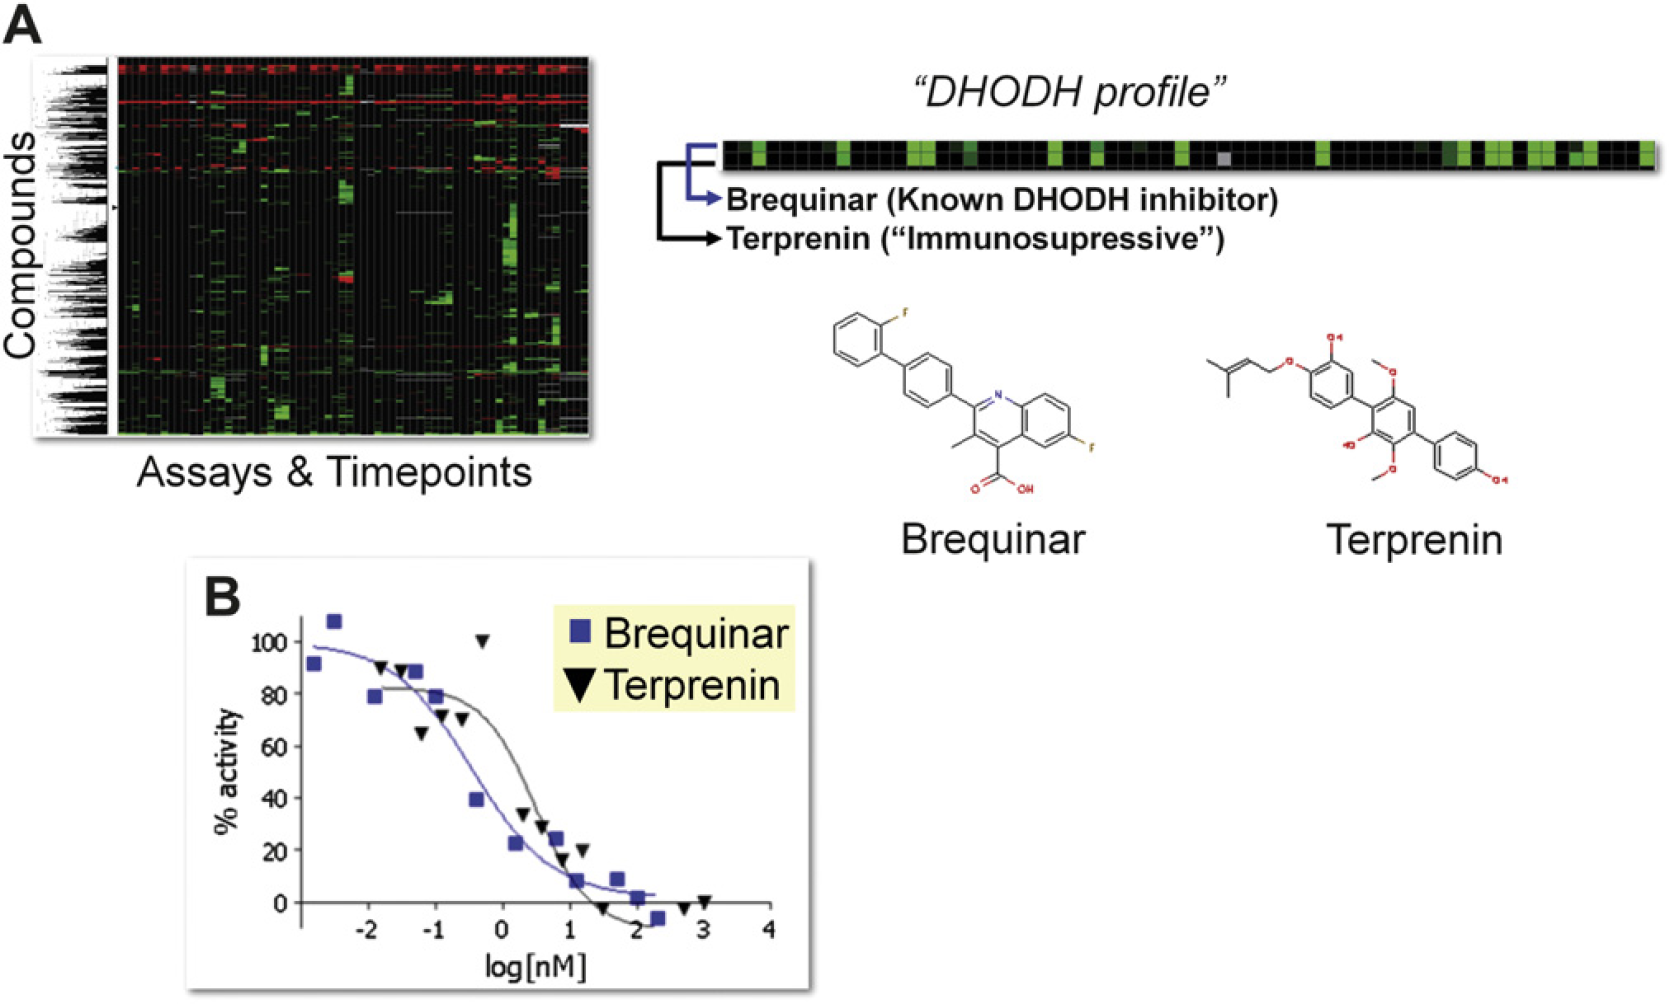
The cellular target of terprenin is dihydoorotate dehydrogenase (DHODH). (A) The activity profiles for brequinar and terprenin are displayed. Hierarchical clustering analysis aligned these two compounds together. (B) An enzymatic assay confirmed that terprenin is a DHODH inhibitor.
Discussion
We have screened a substantial collection of compounds with known MoA against a series of RGAs and used the data to determine activity profiles for each compound. Based on our estimation that 85% of the compound collection had activity in at least one RGA, we conclude that our current RGA panel captures a large expanse of biological activity. The original selection criteria for the members of the RGA panel was fairly arbitrary, but was based loosely on covering signal transduction pathways that had been implicated in human disease. We have been intrigued by the observation that almost all of the members of our RGA panel provide non redundant results; almost every assay has contributed unique data that has been useful in clustering analyses.
A large number of the compounds in the collection previously have been shown to be an inhibitor of a particular RGA and these results generally were recapitulated in our screens. However, there were numerous examples where compound activity was unexpected and, for the most part, the biological significance of these results eludes us at this time. Therefore, the utility of the data set may expand beyond the scope of MoA determination and develop into a generalized biological tool to investigate the interaction between cells and small molecules.
The vast majority of the screening effort thus far has been focused on the development of a reference database consisting of the activity profiles of a large number of compounds that have publically available annotation as to their MoA. Consequently, many of the more interesting results we have observed thus far can be described as “drug repositioning,” as epitomized by the determination of the cellular target of terprenin to be DHODH. 19 Our future interests lie in adapting the platform to being able to screen smaller numbers of compounds with unknown MoA quickly (less than 1 month for a complete analysis). To this end, we have had successful experience with screening 600 assay plates in a single week. This would suggest that 15 assay plates (up to 2880 compounds in an eight-point dilution series on a 1536 well plate) could be screened against 40 RGAs within the same amount of time. The ability to evaluate lead compounds rapidly and inexpensively would have a substantial impact to the acceptance of chemical genomic approaches to drug discovery.
Acknowledgment
We are grateful to Paul Anderson, Michael Garcia, and Jason Matzen for excellent automation support.