
Abstract
Recent genetic evidence suggests that the diacylglycerol lipase (DAGL-α) isoform is the major biosynthetic enzyme for the most abundant endocannabinoid, 2-arachidonoyl-glycerol (2-AG), in the central nervous system. Revelation of its essential role in regulating retrograde synaptic plasticity and adult neurogenesis has made it an attractive therapeutic target. Therefore, it has become apparent that selective inhibition of DAGL-α enzyme activity with a small molecule could be a strategy for the development of novel therapies for the treatment of disease indications such as depression, anxiety, pain, and cognition. In this report, the authors present the identification of small-molecule inhibitor chemotypes of DAGL-α, which were selective (≥10-fold) against two other lipases, pancreatic lipase and monoacylglycerol lipase, via high-throughput screening of a diverse compound collection. Seven chemotypes of interest from a list of 185 structural clusters, which included 132 singletons, were initially selected for evaluation and characterization. Selection was based on potency, selectivity, and chemical tractability. One of the chemotypes, the glycine sulfonamide series, was prioritized as an initial lead for further medicinal chemistry optimization.
Introduction
Diacylglycerol lipase (DAGL) catalyzes the hydrolysis of sn-1-acyl-2-arachidonoyl-glycerol (DAG) to free fatty acid and 2-arachidonoyl-glycerol (2-AG). 2-AG is the most abundant of the two endocannabinoids (eCB) in tissues, and its effects are mediated through CB1 and CB2 G protein–coupled receptors (GPCRs). Whereas 2-AG acts as a full agonist at these receptors, the second ligand, anandamide, acts as a partial agonist. Two isoforms of diacylglycerol lipase, DAGL-α (120 kDa) and DAGL-β (70 kDa), have been cloned and characterized. 1 The authors reported that these two isozymes were equally sensitive to serine/cystein hydrolase inhibitors and a drug that blocks 2-AG formation from intact cells. In addition, it does appear that these isozymes belong to the serine lipase family, because based on structural homology with other serine lipases, they contain two of the three amino acids (serine 443 and aspartic acid 495) that usually constitute the catalytic triad of these enzymes. Substitution of these amino acids with alanine abolished DAGL activity. Interestingly, the α- and β-isoforms are preferentially, although not exclusively, expressed in the adult and developing brain, respectively. Both enzymes experience a shift in their cellular localization during brain development. 2 It was shown that these isozymes are located on axons during development and postsynaptically in adult neurons. Recent genetic evidence suggests that the DAGL-α isoform is the major biosynthetic enzyme for 2-AG in the nervous system and reveals its essential role in regulating retrograde synaptic plasticity and adult neurogenesis. 3 2-AG is formed from arachidonic acid–containing membrane phospholipids such as inositol phospholipids through the combined actions of phospholipase C and diacylglycerol lipase or through the combined actions of phospholipase A1 and phospholipase C in various tissues and cells upon stimulation. 4 Rapid enzymatic conversion of arachidonic acid–containing lysophosphatidic acid to 2-AG in rat brain homogenate has also been described. 5 The physiological roles of 2-AG as a messenger molecule in the nervous, immune, cardiovascular, ocular, and gastrointestinal systems and oncology have been reviewed. 6 As a result, 2-AG, through its interaction with cannabinoid receptors, has been implicated in the pathogenesis of a variety of neurological, psychiatric, immunological, cardiovascular, and eating disorders. Thus, cannabinoid receptor antagonists and inhibitors of the biosynthesis and/or degradation of 2-AG may become useful therapeutic tools for certain human diseases. 5 The identification of DAGL-α as the major biosynthetic enzyme for 2-AG and the observation that DAGL-α knockout mice results in retrograde signal suppression3,7 makes it an attractive therapeutic target. The aforementioned data suggest that inhibition of DAGL-α enzyme activity with a small molecule could be a strategy for the development of novel therapies for the treatment of disease indications such as depression, anxiety, pain, and cognition. To identify small-molecule inhibitors of DAGL-α, we designed a high-throughput, low-volume 384-well assay using the artificial fluorogenic substrate, 6,8-difluoro-4-methylumbelliferyl octanoate (DiFMU-octanoate). 8 Briefly, the assay involves DAGL-α catalyzed hydrolysis of the acyl moiety of the fluorogenic substrate to form the C10 fatty acid, octanoic acid, and the blue-fluorescent adduct, DiFMU products. The resulting fluorescence was kinetically monitored at 360-nm excitation and 450-nm emission wavelengths ( Fig. 1 ). In this report, we describe the design of the low-volume 384-well high-throughput assay and its use to screen a subset of a diverse compound collection for DAGL-α selective inhibitors. We identified several unique DAGL-α inhibitor chemotypes that were selective against two other lipases, monoacylglycerol lipase (MAGL) and pancreatic lipase (PL).
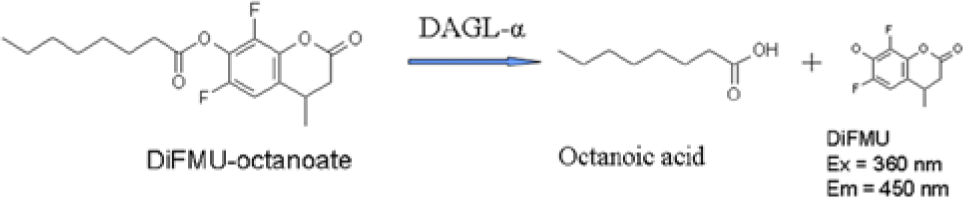
Principles of the diacylglycerol lipase–α (DAGL-α) fluorescence assay. The assay involves DAGL-α catalyzed hydrolysis of the acyl moiety of the artificial fluorogenic substrate, 6,8-Difluoro-4-methylumbelliferyl octanoate (DiFMU-octanoate), to form the C10 fatty acid, octanoic acid, and the blue-fluorescent adduct, DiFMU products. The resulting fluorescence was kinetically monitored at 360-nm excitation and 450-nm emission wavelengths.
Materials and Methods
Reagents
DiFMU-octanoate was purchased from Invitrogen/Life Technologies (Carlsbad, CA). Porcine pancreatic lipase type II was purchased from Worthington (Lakewood, NJ). 1,2-O-Dilauryl-rac-glycero-3-glutaric acid-(6-methylresorufin) ester (DGGR) was a custom synthesis from Roche (Indianapolis, IN). Fetal bovine serum (FBS), HEPES, modified Eagle’s media (MEM), Opti-MEM, Lipofectamine LTX and Plus reagent, and Hank’s balanced salt solution (HBSS) containing calcium and magnesium were obtained from Invitrogen/Life Technologies. Unless otherwise specified, sodium deoxycholate, taurocholate, colipase, p-nitrophenyl acetate (PNP-acetate), and all other standard chemicals were purchased from Sigma-Aldrich (St. Louis, MO).
Expression and Preparation of Human DAGL-α and MAGL Membranes
HEK293 cells were transiently transfected with human DAGL-α or human MAGL (monacylglycerol lipase) using the Lipofectamine LTX and Plus protocol (Invitrogen/Life Technologies). The HEK293 cells were cultured in MEM supplemented with 10% FBS. Prior to transfections, the cells were plated at 12 × 106 in T175 flasks and incubated at 37 °C/5% CO2 for 24 h, at which time the medium was changed to Opti-MEM. The cells were transfected with 12 µg DNA using 40 µL Plus reagent and 60 µL Lipofectamine per flask. The cells were allowed to incubate (Forma, Thermo Scientific, Waltham, MA, 37 °C/5% CO2) in the transfection mix for 6 h and subsequently fed with growth medium. After a 48-h expression, the cells were washed with 15 mL phosphate-buffered saline (PBS) and followed by the addition of 5 mL Versene. Cells were incubated (Forma, 37 °C/5% CO2) for approximately 15 min and dislodged from the flask. The cell suspension was aspirated from the flask and the cells harvested by centrifugation (2000 rpm for 5 min; Beckman Coulter, Brea, CA). Batches of the cell pellets were stored at −80 °C. Cell membranes were prepared as follows: DAGL-α cell pellets were resuspended in lysis buffer (2 mL/flask) consisting of 20 mM HEPES (pH 7.0), 2 mM dithiothreitol (DTT), 0.25M sucrose, 10 µg/mL leupeptin and pepstatin, and 1 mM phenylmethylsulfonyl fluoride (PMSF). However, MAGL cell pellets were resuspended in lysis buffer consisting of 20 mM HEPES (pH 7.0) and 1 mM EDTA. Cells were lysed by Polytron (Brinkmann Instruments, Westbury, NY; two cycles of 7 s, 6000 rpm) on ice. DAGL-α and MAGL membranes were harvested by ultracentrifugation (Sorvall 70.Ti, Thermo Scientific Waltham, MA, 92,465 g, 1 h, 4 °C) and resuspended in their respective lysis buffer (2 mL/flask) using Polytron. It should be noted that the lysis buffer used for resupension of the DAGL-α membrane was sucrose free. Aliquots of the prepared membrane were stored at −80 °C.
DAGL-α Titration and Reaction Progress Curve
Various concentrations of DAGL-α enzyme membranes, ranging 0.0015 to 0.096 µg/µL final concentration, were prepared in 50 mM MES (pH 6.5) buffer without any additives. These were prepared as 2× concentrations and 5 µL transferred into low-volume 384-well black plates (Corning, Kennebunk, ME). DAGL-α naive vector membranes were also prepared in the same concentration range and included as negative control in separate wells. The reactions were initiated with the addition of 5 µL of 20 µM DiFMU-octanoate mix for a final substrate concentration of 10 µM in a 10-µL total reaction volume. Stock DiFMU-octanoate was prepared as a 10-mM solution in DMSO and stored at −80 °C in 500-µL aliquots. Reaction progress was followed by kinetically measuring (30-s intervals) the fluorescence intensity at 360 nm excitation and 450 nm emission on a ViewLux imager (PerkinElmer, Waltham MA) for 30 min at room temperature (~23 °C). The initial rate of the reaction (ADU/min) at the various membrane concentrations was determined from the slopes of the linear portions of the progress curves by linear regression. The enzyme titration time courses and the initial rate replots were plotted using Microsoft Excel (Microsoft, Seattle, WA).
DiFMU-Octanoate Substrate Titration and Km Determination
The apparent Km was determined by measuring the initial rate of the reaction as a function of DiFMU-octanoate substrate concentrations, ranging from 1.56 to 100 µM final in a 7-point 1:2 serial dilution at two DAGL-α membrane concentrations (0.006 and 0.012 µg/µL). These were prepared 2× concentrated in assay buffer to achieve the aforementioned concentrations upon dilution with an equal volume of DAGL-α membranes. Replicate sets of the above substrate concentrations (5 µL each) were transferred into their respective wells of the low-volume 384-well black plate. The reactions were initiated by the addition of 5 µL DAGL-α membranes and the plate was immediately transferred onto the ViewLux Imager to kinetically read (30-s intervals) the fluorescence signal at 360 nm excitation and 450 nm emission at room temperature (23 °C). DAGL-α naive vector membranes were included as negative control in separate wells. The initial rates of the reactions (ADU/min) were measured from the slopes of the linear portions (first 10 min) of the reaction progress curves by linear regression to determine the apparent Km of the DiFMU-octanoate substrate and Vmax of the reaction. The values of the apparent Km and Vmax were generated by nonlinear fit to the Michaelis-Menton equation using Prism 4.0 (GraphPad Software, La Jolla, CA).
High-Throughput Screening Assay
It was observed during the automated screen validation that the DiFMU-octanoate substrate, when diluted in assay buffer, was not stable for an extended period. Therefore, the final high-throughput assay conditions were reconfigured to enable the direct transfer of the substrate mix in 100% DMSO. As a result, the enzyme (1.1× in assay buffer, 50 mM MES, pH 6.5) and substrate (10× in DMSO) mixes were prepared accordingly to achieve a 1× final concentration when 9 µL and 1 µL were added respectively to initiate the reaction. This ensured that the total reaction volume of 10 µL for the high-throughput screening (HTS) and assay design were consistent. The final HTS assay was performed by transferring 60 nL of a 2-mM compound (in 100% DSMO) into the black 384-well assay plates using an Echo 550 acoustic dispenser (Labcyte, Sunnyvale, CA). This was followed by the addition 9 µL of DAGL-α enzyme membranes and preincubated at room temperature (RT) for 10 min. The reaction was initiated by the addition of 1 µL of a 100-µM DiFMU-octanoate substrate. The final compound, enzyme, and substrate concentrations achieved were 12 µM, 0.012 µg/µL, and 10 µM, respectively. The overall DMSO concentration per reaction was 10.5% (v/v). The assay plate was immediately transferred to the ViewLux Imager upon substrate addition to kinetically monitor (30-s intervals) the fluorescence signal at 360 nm excitation and 450 nm emission for 5 min at RT. Linear regression of the fluorescence intensity values of the 5-min kinetic read was used to calculate the initial rate (slope) of the reaction. The slopes were generated as the readout and used to calculate % inhibition values of the compounds screened. The enzyme and substrate were dispensed using a MultiDrop Combi (Thermo Scientific, Waltham, MA) bulk reagent dispenser.
Selectivity Assays Optimization
Selectivity assays were optimized for two other lipases, MAGL and PL, in standard 384-well formats.
The MAGL assay was run in a buffer consisting of 50 mM MES (pH 6.5) and 1 mM EDTA. To determine the assay linearity and reaction progress curve, an 8-point 2-fold serial dilution (0.0004–0.045 µg/µL final) of MAGL membrane was prepared and 20 µL transferred into a 384-well clear plate (Corning). The reaction was initiated by adding 20 µL of 500 µM PNP-acetate to achieve a final concentration of 250 µM. MAGL naive vector membranes were also prepared in the same concentration range and included as a negative control in separate wells. The total well volumes were 40 µL. The absorbance at 405 nm was measured kinetically (30-s intervals) at RT on the SpectraMax microplate reader (Molecular Devices, Sunnyvale, CA). To determine the MAGL apparent Km for the substrate, PNP-acetate, a 10-point 1:2 serial dilution was prepared (final concentration range, 1.9–1000 µM) and 20 µL transferred into the assay plate. The reaction was initiated by the addition of 20 µL of 0.0046 µg/µL MAGL membrane (final concentration, 0.0023 µg/µL) and the absorbance at 405 nm monitored kinetically at 30-min intervals on the SpectraMax microplate reader (Molecular Devices). The initial rate, measured as the slope of the linear portion of the reaction progress curve, for each substrate concentration was used to estimate the apparent Km and Vmax. The values of the apparent Km and Vmax were generated by nonlinear fit to the Michaelis-Menten equation using Prism 4.0 (GraphPad Software, La Jolla, CA).
The PL assay was modified as described by Panteghini et al. 9 for a regular 384-well format (40 µL total volume). Briefly, the assay buffer consisted of 50 mM Tris (pH 8.0), 5 mM CaCl2, 1.8 mM sodium deoxycholate, 7.2 mM sodium taurodeoxycholate, and 1 µg/mL colipase. For the enzyme titration, 20 µL of varying concentrations (0.31−80 mU/mL final in 1:2 serial dilution) were prepared and transferred into the assay plate and the reaction initiated with the addition of 20 µL DGGR substrate (25 µM final). The absorbance at 580 nm was measured kinetically (30-s interval) at RT on the SpectraMax microplate reader. The apparent Km of PL for the DGGR substrate was also determined by incubating 20 µL of varying concentrations (1.56–200 µM final in 1:2 serial dilution) with 5 mU/mL PL. Assay buffer was used as negative control wells. The absorbance at 580 nm was monitored kinetically at 30-min intervals on the SpectraMax microplate reader. The initial rate, measured as the slope of the linear portion of the reaction progress curve, for each substrate concentration was used to estimate the apparent Km and Vmax. The values of the apparent Km and Vmax were generated by nonlinear fit to the Michaelis-Menten equation using Prism 4.0 (GraphPad).
HTS Data Analysis
The readouts, for the various assays described above, from the ViewLux imager and SpectraMax were integrated with an automated HTS data management system developed internally. This system enables data analysis and quality control monitoring of the HTS campaign in real-time. Each plate was read 10 times, and the initial rate (slope) of the fluorescence (DAGL-α) or absorbance (MAGL/PL) measurement was generated as the readout. The high (plus enzyme/membrane) and low (no enzyme/vector membrane) signal controls on the plate were used to calculate Z′ values 10 during the screen to monitor assay robustness. The percent inhibition of enzyme activity was calculated according to the following equation:
The values of S sample , S high , and S low in the equation refer to the fluorescence or absorbance of the sample, high control wells, and low control wells, respectively. To determine inhibitor IC50 values, % inhibition of the CRCs (concentration response curves) was fitted to the standard single-site four-parameter logistic equation.
Results and Discussion
DAGL-α Assay Optimization
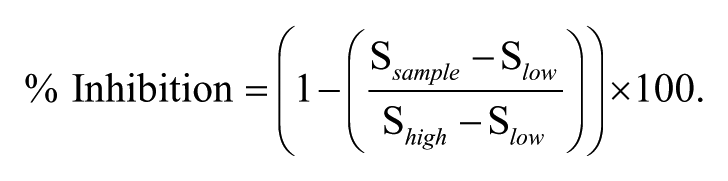
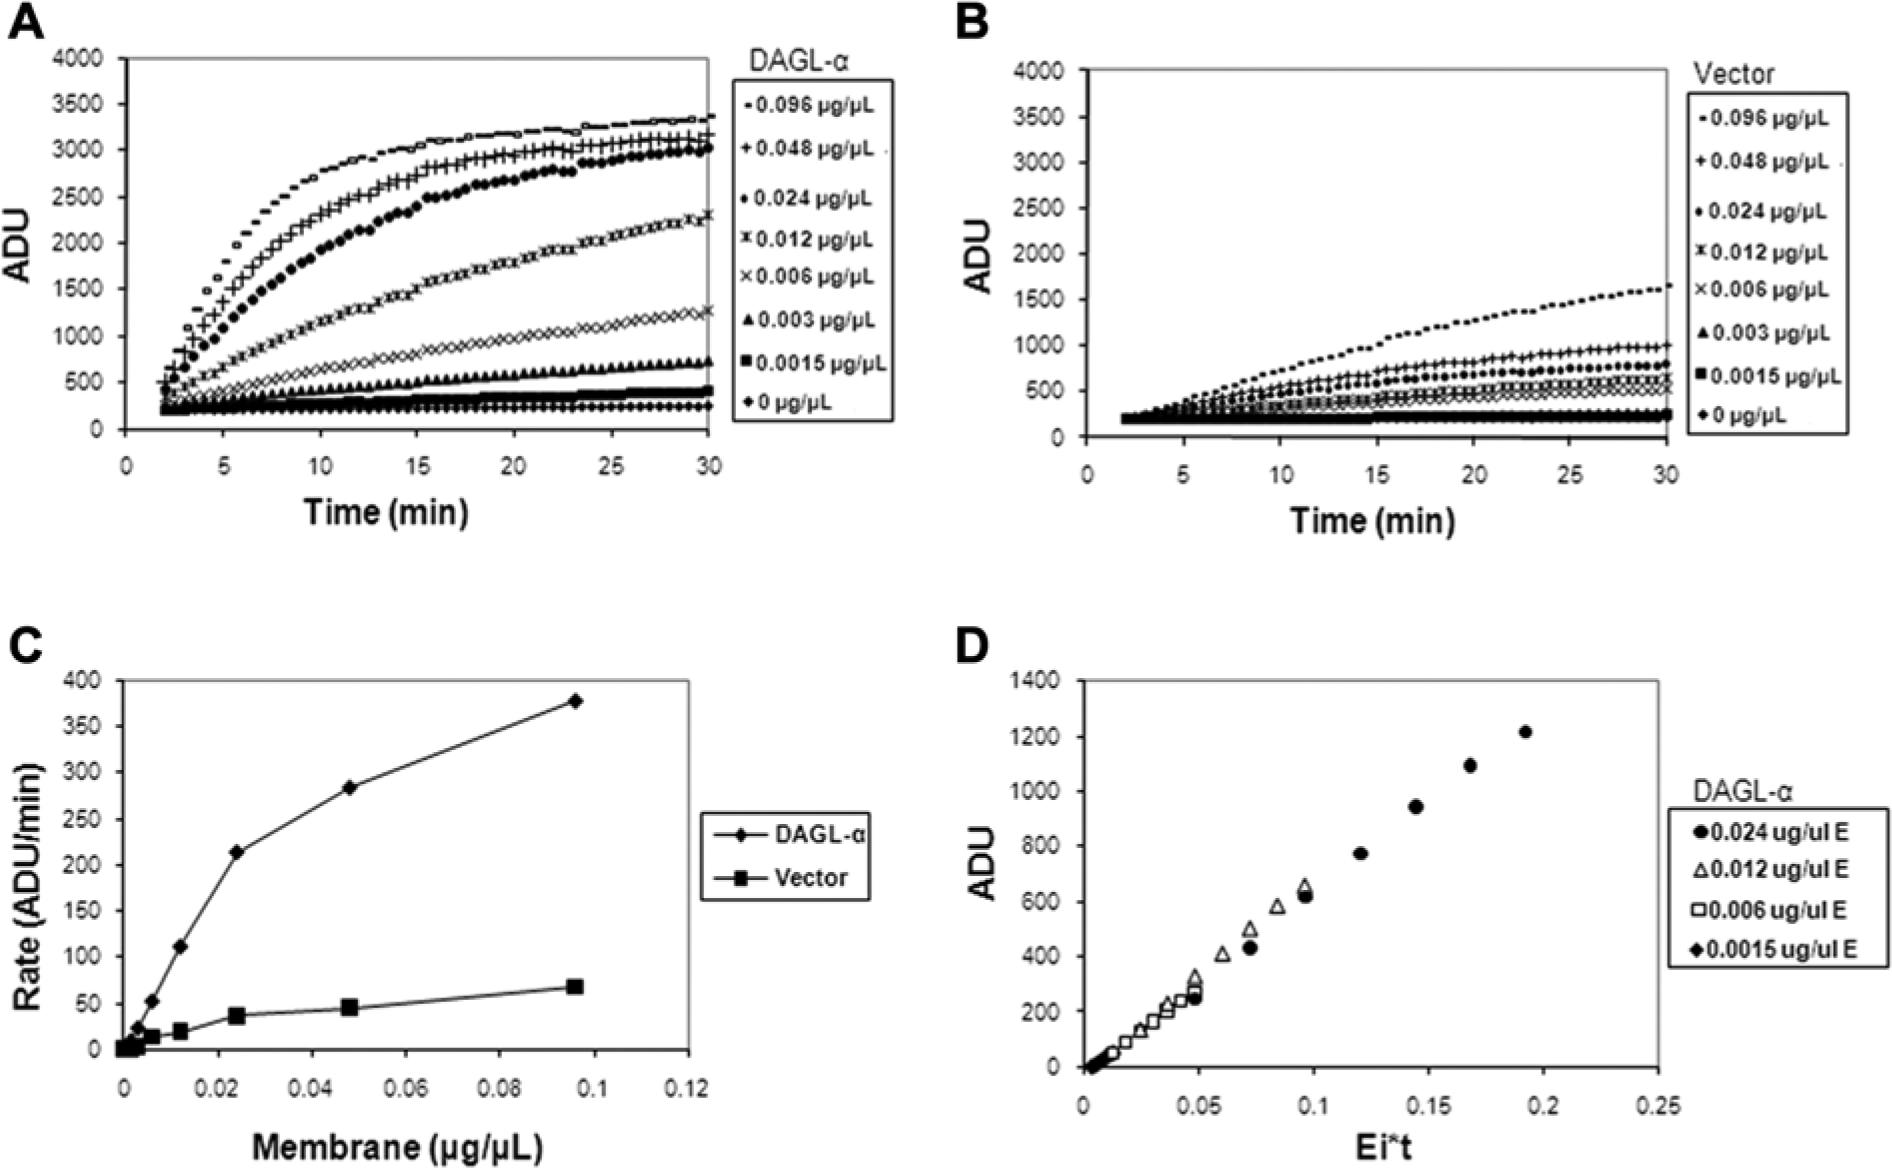
To determine linearity of substrate utilization and the appropriate amount of DAGL-α enzyme that would enable an initial rate measurement, both the enzyme and the control vector membranes were titrated in a 7-point 2-fold serial dilution in the presence of 10 µM DiFMU-octanoate. The corresponding reaction progress curves are shown in Figure 2A , B . It was observed that with the exception of the two highest DAGL-α enzyme concentrations (0.096 µg/µL and 0.048 µg/µL), the reaction was linear up to approximately 10 min. Also, the control vector membrane showed some constitutive DAGL-α activity, but it was comparatively lower than the DAGL-α membrane. A replot of the reaction rates (slopes) generated from the linear regression of the first 5 min of the enzyme titration is shown in Figure 2C . The reaction rate was linear up to 0.024 µg/µL DAGL-α membrane. As a result, 0.012 µg/µL DAGL-α membrane and a 5-min kinetic read were chosen as optimal for the assay. This ensured that the enzyme concentration was in the linear range of the titration curve and the measured rate of the reaction approximately followed first-order kinetics. To ensure that the occurrence of slight nonlinearity of the reaction after 10 min was not the result of enzyme inactivation during the course of the reaction, a Selwyn plot 11 ( Fig. 2D ) was constructed. In this analysis, if the total enzyme is constant at each concentration (i.e., no significant inactivation during the course of the reaction), then plots of the accumulated product versus time multiplied by the total enzyme (Ei*t) should yield points that are superimposable irrespective of the initial enzyme concentration. The results of the Selwyn test in this experiment indicate that there was no appreciable enzyme inactivation for the four DAGL-α concentrations considered, since the product versus Ei*t plots were virtually superimposable. The apparent Km for the substrate, DiFMU-octanoate, was determined by deriving the initial reaction rates of the progress curves from a 7-point titration in the presence of 0.012 µg/µL DAGL-α membranes ( Fig. 3A ). The apparent Km and Vmax were estimated to be 12.06 ± 2.8 µM and 167.4 ± 12.1 ADU/min, respectively; data are mean ± SEM. The values of these kinetic parameters were generated by nonlinear fit to the Michaelis-Menten equation. The DiFMU-octanoate substrate concentration used in the final HTS was 10 µM (~apparent Km). It was desirable to screen at a substrate concentration that is approximately the apparent Km to provide an optimal condition to identify diverse types of inhibitors, since preference for a particular mode of inhibition was not made a priori. In addition, those parameters were sufficient to achieve a good signal-to-background (S/B) ratio and acceptable Z′ values.
Diacylglycerol lipase–α (DAGL-α) enzyme titration and reaction progress curves. A 7-point 2-fold serial dilution of DAGL-α and naive vector control membranes was prepared in assay buffer in a low-volume 384-well plate and the reaction initiated with 6,8-Difluoro-4-methylumbelliferyl octanoate (DiFMU-octanoate) substrate (10 µM final). Reaction progress was followed by kinetically measuring (30-s intervals) the fluorescence intensity at 360 nm excitation and 450 nm emission on the ViewLux imager for 30 min at room temperature (~23 °C). (
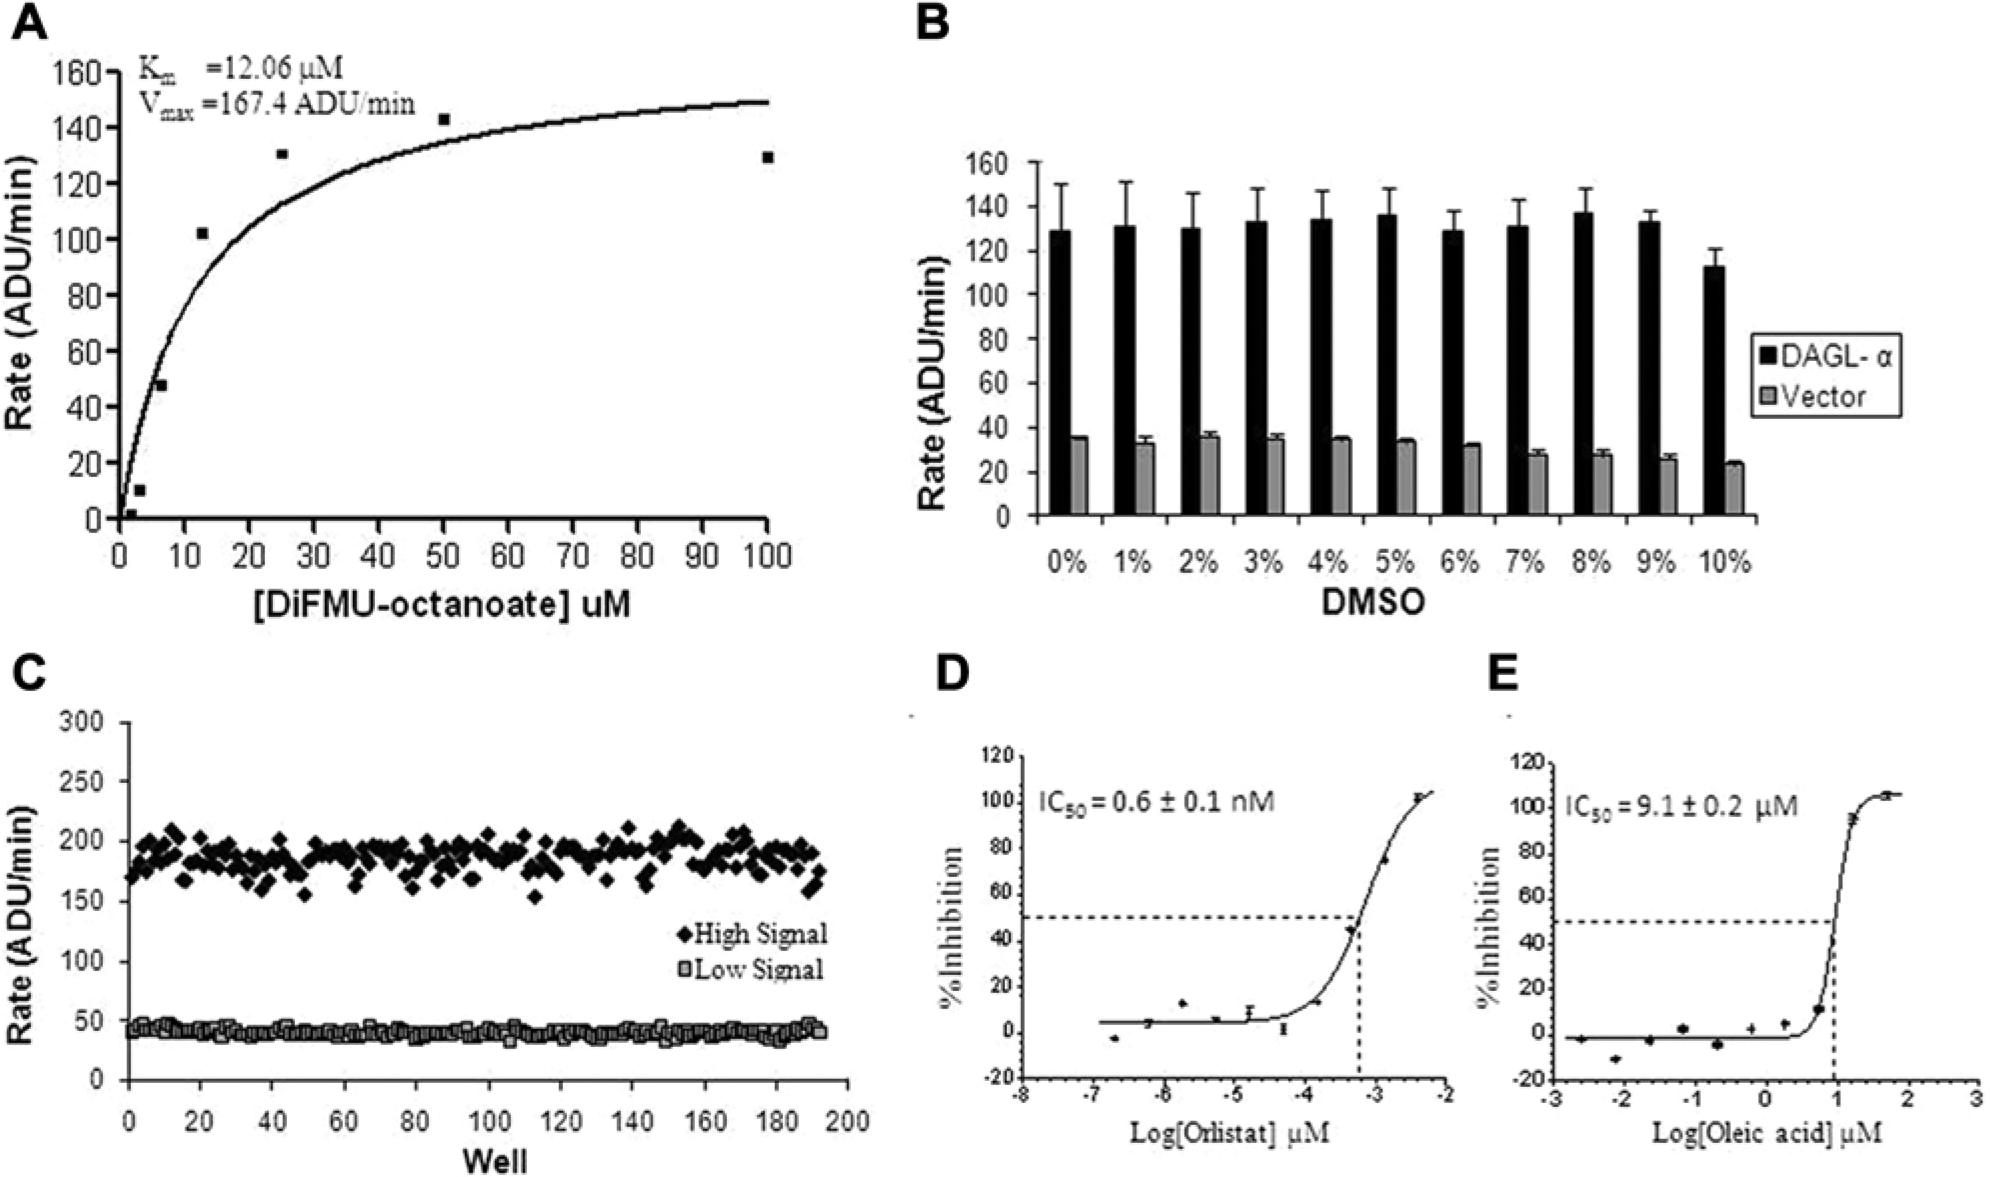
Apparent Km determination and assay performance validation. (
Effect of DMSO and Assay Reagent Stability
Using the optimized HTS assay parameters, the effect of DMSO was evaluated by measuring the initial rate of the reaction in the presence of varying concentrations from 1% to 10% upon substrate addition. Assay buffer was included as 0% DMSO control. As shown in Figure 3B , the assay generally tolerated varying concentrations of DMSO up to 10% (v/v) with minimal loss of signal. In addition, we observed that DiFMU-octanoate substrate undergoes spontaneous hydrolysis at pH >6.5, resulting in the loss of signal; thus, HTS was conducted at pH 6.5. To evaluate the stability of the assay reagent mixes for a 24-h automated screening cycle, we evaluated prepared reagents in assay buffer stored at either 4 °C or room temperature and monitored performance over time. It was observed that when the bulk reagent was prepared in the assay buffer, DiFMU-octanoate was not stable for an extended period (data not shown). There was appreciable loss of signal within the first hour of preparing the substrate. Furthermore, lower pH (5.5) or changes in ionic strength did not alleviate the problem. The loss in signal could not be attributed to the enzyme due to the observation that freshly prepared DiFMU-octanoate substrate restored assay signal irrespective of the time lapse after the enzyme membrane mix preparation (data not shown). On the other hand, stability was restored and maintained for a 24-h screening cycle when DiFMU-octanoate mix was prepared in DMSO (data not shown). As a result, the assay volumes were reconfigured to deliver the DiFMU-octanoate substrate directly from DMSO. Given the observed DMSO tolerance, we were able to deliver the substrate from a 100% working solution in a volume that yielded 10.5% (v/v) final (DMSO) in the assay.
Assay Validation for HTS
To ensure consistent assay performance and to evaluate assay reproducibility on the automated system, two plates of high (with DAGL-α membranes) and low (with vector membranes) signal reactions, as well as two reference lipase inhibitors, orlistat (tetrahydrolipstatin) and oleic acid, were run over 3 consecutive days. The final optimized HTS assay conditions used in this exercise were 0.012 µg/µL DAGL-α membranes, 10 µM DiFMU-octanoate, and a 5-min kinetic read. The reference inhibitors were titrated in a 10-point dilution series and 60 nL transferred into the assay plates with the Echo acoustic dispenser. A typical distribution of activity of the high and low signal reactions is shown in Figure 3C . We obtained a consistent signal to background of between 5 and 8 and Z′ values of ~0.7 over the 3 days. The coefficients of variation (CVs) achieved with the high and low signal measurements were approximately 5%. The overall assay window and performance statistics indicated a robust assay for inhibitor identification. Representative concentration-response curves of the two reference lipase inhibitors are shown in Figure 3D , E . The IC50 values obtained for orlistat and oleic acid were 0.6 ± 0.1 µM (n = 4) and 9.1 ± 0.2 µM (n = 4), respectively, and these values were consistent over the 3 consecutive days. It is noteworthy that olistat potently inhibited DAGL-α in cell homogenates with an IC50 of 60 nM. 1 Titrations of these inhibitors were included in the HTS as quality control (QC) compounds and their IC50 values were tracked to monitor the integrity of the screen on a daily basis.
Selectivity Assays
To characterize the kinetic parameters and optimize the selectivity assays, we measured the dependence of the reaction rate on substrate concentration under conditions that approximate steady state. To determine the MAGL assay reaction progress profile and the enzyme concentration that would generate a linear response to substrate utilization, the MAGL membrane was titrated in an 8-point serial dilution (1:2) in the presence of 250 µM PNP-acetate substrate. The results ( Fig. 4A ) show a 2-fold increase in signal with doubling of the MAGL enzyme membrane. At the lower membrane concentrations (<0.0225 µg/µL), the reaction time course shows linearity for at least 1 h. A replot of the initial rate, generated from the linear regression of the first 5 min of the reaction, versus MAGL membrane concentration ( Fig. 4B ) shows enzyme linearity up to 0.0225 µg/µL. As expected, the vector control membrane did not show any appreciable activity. Membrane concentration of 0.0045 µg/µL was chosen for the final assay. Two-fold PNP-acetate substrate titration (0.0004–0.045 µg/µL) in the presence of 0.0023 µg/µL MAGL enzyme membrane was also carried out to estimate the apparent Km ( Fig. 4C ). The observed apparent Km for the substrate and Vmax of the reaction were 271.2 ± 29.4 µM and 4.4 ± 0.2 mOD/min, respectively; data are mean ± SEM. We chose 250 µM PNP-acetate (~apparent Km) substrate for the final assay. We further evaluated the effect of DMSO on the MAGL assay using the optimized enzyme and substrate concentrations. Unlike the DAGL-α assay, there was a general decline in the initial rate of the reaction with increasing DMSO concentration such that an approximately 50% loss in activity was observed at 11% DMSO (v/v) ( Fig. 4D ). MAGL activity was inhibited by oleic acid and RHC-80267, a drug that blocks 2-AG formation from intact cells12,13 with an IC50 of 1.4 ± .3 µM (n = 4) and 19.4 ± 0.8 µM (n = 4), respectively (data not shown).
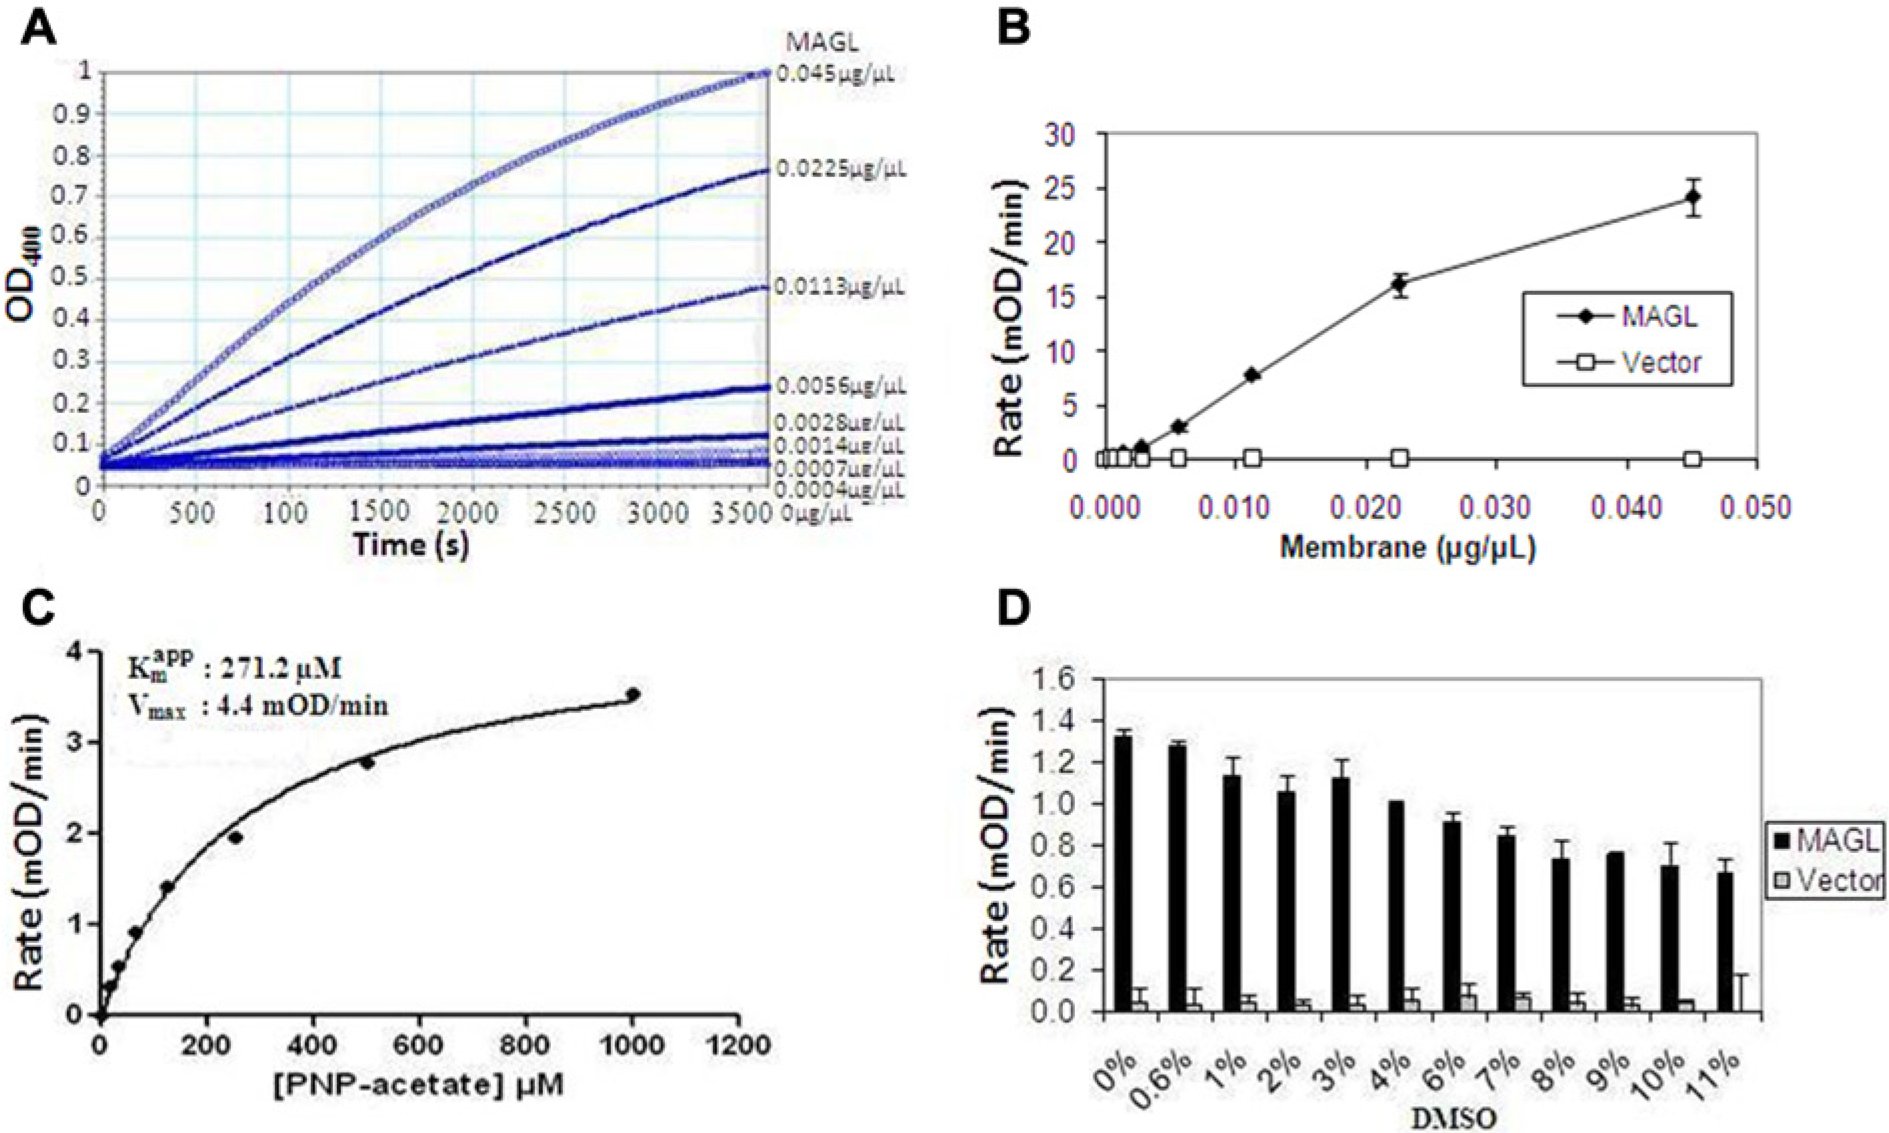
Monoacylglycerol lipase (MAGL) selectivity assay optimization. (
Similarly, to optimize the PL assay and characterize its kinetic parameters, we measured the dependence of the reaction rate on the enzyme and substrate concentration under conditions that approximate steady state. Figure 5A shows the reaction progress profiles at the various concentrations of PL enzyme (0.34−80 mU/mL) in the presence of 25 µM DGGR substrate. At the lower enzyme concentrations (<10 mU/mL), the assay was linear for about 10 min after a slight initial lag. A replot of the initial rate, generated from the linear regression of the first 5 min of the reaction, versus PL enzyme concentration ( Fig. 5B ) shows linearity up to about 10 mU/mL. We chose 5 mU/mL PL enzyme for the final assay. The apparent Km for the DGGR substrate was subsequently determined by 2-fold titration (1.56–200 mU/mL) measuring the initial rates of the first 5 min of the reaction in the presence of 5 mU/mL PL enzyme ( Fig. 5C ). The observed apparent Km for the DGGR substrate and Vmax of the reaction were 25 ± 3.1 µM and 22.5 ± 0.9 mOD/min, respectively; data are mean ± SEM. The final DGGR substrate concentration in the assay was kept at 25 µM (apparent Km). It should be noted that a colipase concentration of 1 µg/mL was used for the initial experiments; however, using the optimized enzyme and substrate concentration, 0.25 µg/mL, was found to be optimal based on titration (data not shown). Therefore, a colipase concentration of 0.25 µg/mL was used for all subsequent experiments. Finally, unlike the MAGL assay, the PL assay was compatible with a relatively high concentration of DMSO, as shown in Figure 5D . In the presence of orlistat, potent inhibition of PL activity was observed with an IC50 of 2.5 ± 0.3 nM (n = 4), while RHC-80267 was much less active with an IC50 of 56.1 ± 11.4 µM (n = 4) (data not shown). However, oleic acid did not show any detectable inhibitory effects on PL activity (data not shown).
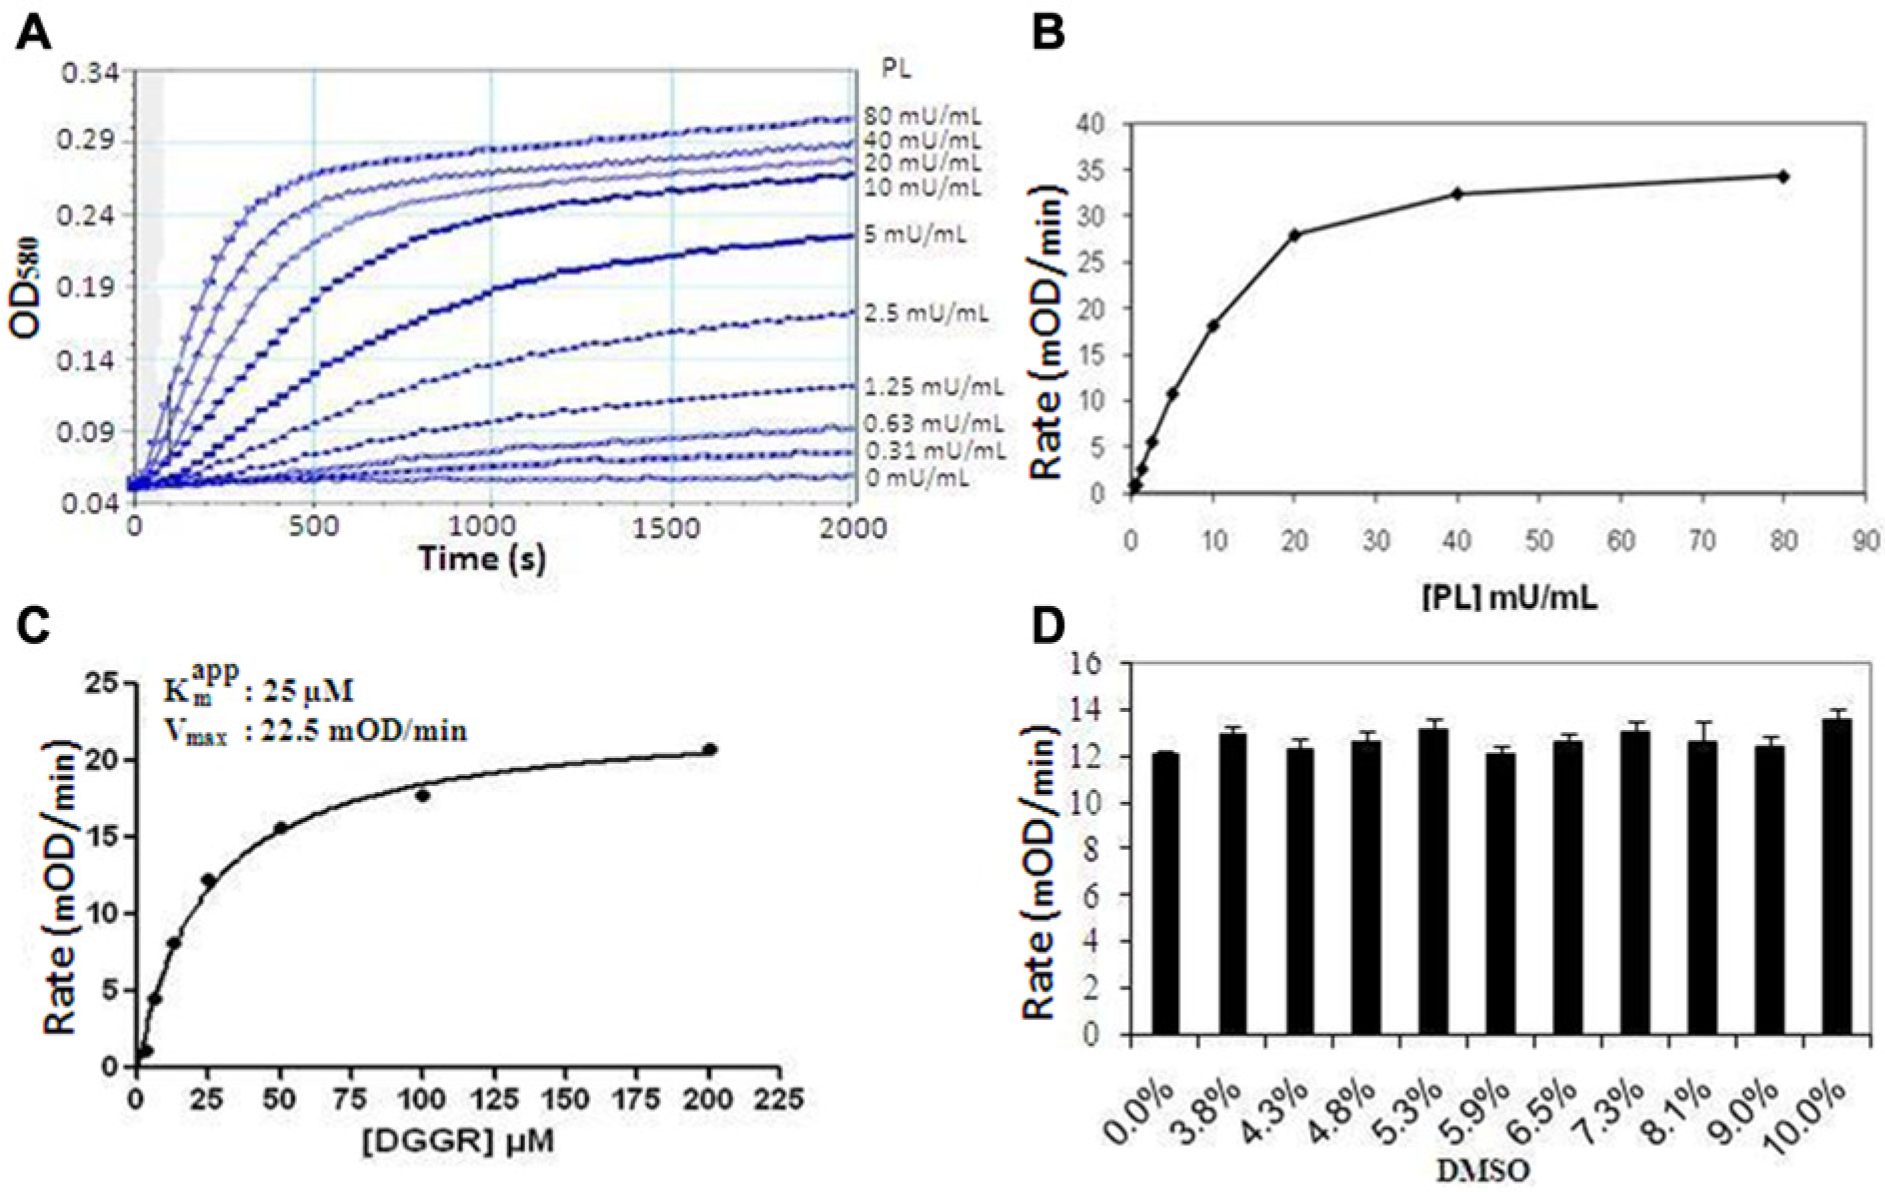
Pancreatic lipase (PL) assay optimization. (
HTS and Hit Identification
To assess the DAGL-α assay performance and validate the screen under fully automated conditions prior to conducting the large-scale HTS, we screened a random set of 29,490 compounds at 12 µM concentration. This pilot screen enabled the assessment of screening data reproducibility and robustness using the liquid-handling devices on the automated system. The observed hit rate at 65% inhibition threshold was 0.5% (166 compounds), and the mean Z′ value of the high and low plate controls was 0.60 ± 0.05. The hit rate and the Z′ values obtained in this exercise were within the limits of a robust HTS campaign. Subsequent to the screen validation, an HTS of over a million diverse set of compounds from our internal collection was prosecuted in a low-volume 384-well format. Final assay conditions were as follows: 0.012 µg/µL DGAL-α membranes, 10 µM DiFMU-octanoate substrate, and 12 µM compound (see Materials and Methods for details). The mean daily Z′ value calculated from the high (DAGL-α membranes) and low (vector membranes) signal controls of each plate is shown in Figure 6A . We achieved a robust HTS with an overall mean Z′ value of 0.60 ± 0.04 across the entire screen. All other screen reliability statistics evaluated (number of hits per well, number of hits per plate, well average % inhibition, and plate average % inhibition) were consistent with a robust screen (data not shown). The scatterplot of the compound % inhibition values for the entire screen is shown in Figure 6B . Consistent with a typical HTS, most compounds were inactive with a distribution of % inhibition values centered on 5.5%. At a 65% inhibition threshold, 13,300 compounds were selected as actives (hit rate of 1.3%). This hit rate was slightly higher than that of the validation screen, which was 0.5%. In addition, 10,894 compounds selected by virtual screening were tested in duplicate and resulted in 372 actives (3.4% hit rate). These compounds were selected from our internal compound inventory by computational docking studies based on a DAGL-α homology model. A homology model of the DAGL-α lipase was made using the 1TIB (Humicola lanuginosa lipase) and 1YS1 (Burkholderia cepacia lipase) crystal structures identified from a BLAST (basic local alignment search tool) search. The model was constructed using Schrodinger’s Prime (Schrödinger, LLC, New York, NY) modeling software. The catalytic triad residues S433, D495, and H650 were identified through mutation experiments 8 and aligned to 1TIB. A docking protocol was created using Schrodinger’s Glide and the homology model. The set of 10,894 molecules were selected for screening based on their Glide gscores.
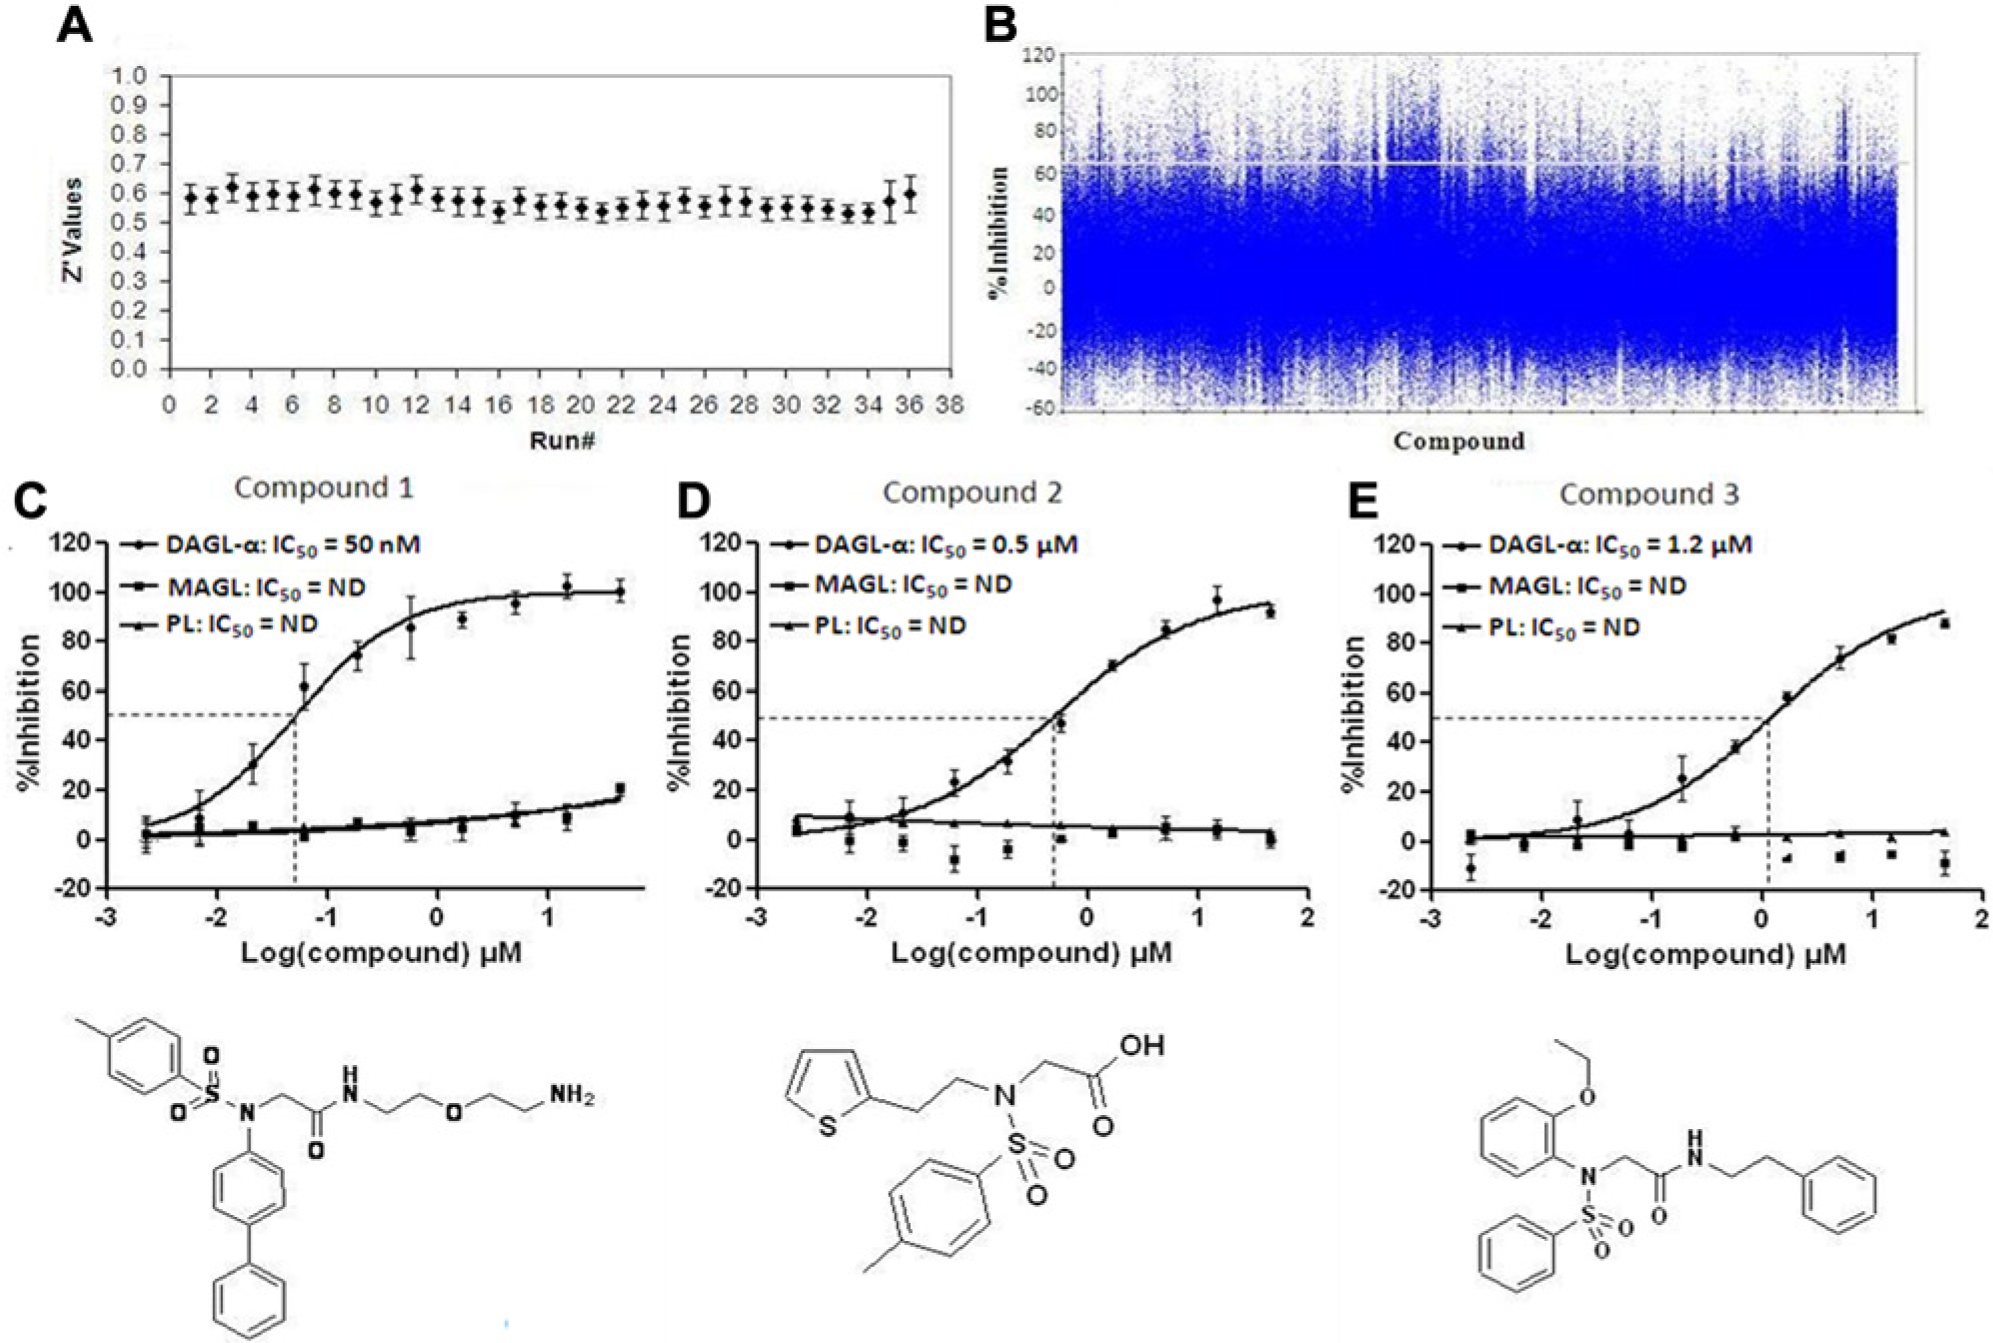
Primary screen results and representative concentration-response curves and structures of compounds from the sulfonamide lead chemotype series identified in the high-throughput screening. (
From the list of primary screen actives, 12,491 compounds were made available for confirmation testing in triplicate at 12 µM and 2.5 µM. To ensure that no active compound was prematurely deprioritized, the threshold for hit selection was lowered to 50% (6956 compounds) and 40% (1695 compounds) inhibition for compounds retested at 12 µM and 2.5 µM, respectively. A list of 7328 compounds consisting of 372 virtual and 6956 primary screen-confirmed actives at 12 µM were triaged and clustered. Functional group and property filters (MW, cLogP, H-bond donor, H-bond acceptor, rotatable bonds) were applied to remove compounds that were large, lipophilic, reactive, and potentially promiscuous (identified as active in seven historic assays). 14 The remaining 6535 compounds were clustered using a structurally discriminating algorithm to understand structure-activity relationship (SAR) patterns. In all, 2467 clusters and 1445 singletons were obtained. The most active compounds in a cluster were selected as well as singletons that were active at the 2.5-µM concentration. Finally, 1956 compounds were selected for IC50 determination to evaluate potency and selectivity.
A 10-point CRC was generated in triplicate to determine the IC50 value of each compound in the DAGL-α assay, as well as the MAGL and PL selectivity assays. Approximately 89% of the compounds showed activity in a concentration-dependent manner in the DAGL-α assay with a broad range of potencies (1100 compounds with IC50 ≤10 µM). Compounds with IC50 values ≤10 µM and greater than 10-fold selectivity for DAGL-α over MAGL or PL were chosen for further evaluation. Compounds with very low or high Hill slopes were deprioritized. Following an initial mechanistic assessment (beyond the scope of this article) on the selected compounds, 314 were recommended as candidates for additional triage and clustering. These were categorized into 185 structural clusters, with 132 of those being singletons. Chemotypes identified as chemically intractable were withdrawn from further consideration. In all, seven chemotypes of interest were identified and given initial priority for further medicinal chemistry optimization. A number of second-tier chemotypes were also identified. Figure 6C – E shows the structure and concentration-response curves of three compounds from one of the initial lead chemotypes (glycine sulfonamide series). Compound 1, compound 2, and compound 3 selectively inhibited DAG-α activity in the presence of the surrogate substrate, DiFMU-octanoate, with IC50 values of 50 nM, 0.5 µM, and 1.2 µM, respectively. These compounds did not show inhibitory activities against MAGL and PL; as a result, no IC50 values were generated. The activities of these three compounds against DAGL-α were subsequently confirmed using the native substrate, DAG, via 2-AG detection by liquid chromatography/mass spectrometry. 8 The potencies (EC50 values) of compound 1 (28 nM), compound 2 (0.3 µM), and compound 3 (0.3 µM) were comparable to those observed using the DiFMU-octanoate substrate. It is worthy to note that the primary structure (Clustal-W2 search) of the human DAGL-α and MAGL shared 11.7% sequence identity. Similarly, human DAGL-α and PL were 11.9% identical, while human MAGL and PL shared 19.2% sequence identity.
In summary, evidence suggests that selective inhibition of DAGL-α activity by a small molecule could be a potential therapeutic strategy for the discovery of novel drugs for the treatment of depression, anxiety, pain, and cognition. To identify compounds that inhibit DAGL-α activity, we conducted a large-scale HTS assay that employs the artificial fluorogenic substrate, DiFMU-octanoate, as a surrogate for the native DAGL-α substrate, sn-1-acyl-2-arachidonoyl-glycerol, due to the low-throughput nature of 2-AG detection. It is common practice in hit identification to use artificial surrogate substrates to develop assays that are cost-effective, robust, sensitive, and high throughput when the use of the native substrate is not amenable to HTS. The screening assay was designed and optimized to identify mechanistically diverse chemotypes (substrate concentration that approximates the apparent Km) since preference for a particular mode of inhibition was not made a priori. It should be noted that the interaction of lipases with their lipophilic substrates does not fully conform to Michaelis-Menten kinetics. It has been postulated that lipases bind to the lipid-water interface, resulting in the displacement of the active site lid, which enables migration of the substrate into the active site for lipolysis—a phenomenon described as interfacial activation.15–17 It does appear that the DiFMU-octanoate substrate, which consists of the lipophilic octyl ester moiety, partitions into the membrane bilayer from where it is sampled. Thus, it is not clear whether the apparent saturation observed in the DiFMU-octanoate titration was the result of saturation of the enzyme active site (where true Km is achieved) or simply a limitation of substrate integration into the membrane.
Taken together, the primary HTS yielded several active compounds at the screening concentrations of 12 µM and 2.5 µM upon retest. Compounds were triaged based on physicochemical properties, such as large molecular weight, lipophilic, reactive, and promiscuous, and viewed as intractable by applying functional group and property filters (MW, clogP, H-bond donor, H-bond acceptor, rotatable bonds, etc.). To further reduce the list of actives to a manageable size for concentration response and IC50 determination, the remaining compounds were clustered based on their structural similarities and preliminary SAR patterns. As a result of this exercise, 1956 compounds, representing the most potent in a cluster and singletons that were active at both 12-µM and 2.5-µM concentrations, were selected for potency and selectivity evaluation. Following potency and selectivity evaluation, as well as initial mechanistic assessment, 314 compounds with ≥10-fold selectivity for DAGL-α over MAGL and PL were recommended for additional triage and clustering. The HTS identified seven lead chemotypes, of which the glycine sulfonamide series was prioritized as initial lead for medicinal chemistry optimization.
Footnotes
Acknowledgements
We thank the BMS Core Automation group for HTS support, Compound Management for preparing the compound plates for the screen, and Research Informatics for data analysis support. We also thank Dr. John Watson and Dr. Sanjay Saldanha for critical reading of this manuscript.
Declaration of Conflicting Interests
The authors declared no potential conflicts of interest with respect to the research, authorship, and/or publication of this article.
Funding
The authors received no financial support for the research, authorship, and/or publication of this article.