PARP inhibitors are an exciting new class of antineoplastic drugs that have been proven to be efficacious as single agents in cancer settings with inherent DNA repair defects, as well as in combination with DNA-damaging chemotherapeutics. Currently, they are designed to target the catalytic domain of PARP-1, the most studied member of the family, with a key role in the DNA-damage repair process. Because PARP inhibitors are substrate (NAD+) competitors, there is a need for a deeper understanding of their cross-reactivity. This is particularly relevant for PARP-2, the PARP-1 closest homologue, for which an embryonic lethal phenotype has been observed in double knockout mice. In this study, we describe the development and validation of binding assays based on fluorescence polarization (FP) and surface plasmon resonance (SPR) techniques. PARP-1, PARP-2, PARP-3, and TNKS-1 FP displacement assays are set up by employing ad hoc synthesized probes. These assays are suitable for high-throughput screening (HTS) and selectivity profiling, thus allowing the identification of NAD+ binding site selective inhibitors. The PARP-1 and PARP-2 complementary SPR binding assays confirm displacement data and the in-depth inhibitor characterization. Moreover, these formats have the potential to be broadly applicable to other members of the PARP family.
ADP-ribosylation is a posttranslational modification catalyzed by diphtheria toxin-like ADP-ribosyltransferases (ARTDs, aka PARPs), which transfer ADP-ribose units from NAD+ to specific amino acid residues of substrate proteins, thus affecting a wide range of cellular processes.1 PARP-1 plays an essential role in DNA repair processes such as base excision repair (BER) and single-strand break repair (SSBR).2 PARP-2, the PARP-1 closest homologue, shows unique functions in spermatogenesis, adipogenesis, and T-cell development and some overlapping functions with PARP-1 such as SSBR.2 PARP-3 cooperates in double-strand DNA repair, even though its role remains to be fully understood.3 Tankyrases (TNKS-1 and -2) are also emerging as drug targets in oncology, but for most of the other PARPs, the precise biological functions remain largely unclear.3,4
As the clinical trials with PARP inhibitors are in progress, the interest in understanding the extent of their cross-reactivity with other members of the ARTD family increases, especially in view of long-term therapies.5,6 PARP inhibitors are generally designed to compete with NAD+ at the enzyme active site; therefore, they have the potential to inhibit different members of the ARTD family or other enzymes that use NAD+ as substrate.6 Indeed, the most advanced inhibitors are highly potent on both PARP-1 and PARP-2, due to the high structural homology of their catalytic domains (69% sequence similarity). Because it has been demonstrated that PARP-1 siRNA is sufficient to prevent the growth of BRCA-deficient ovarian cancer cells, inhibiting both PARPs could enhance toxicity.2
Although different experimental methods have been developed to detect PARP activity, a comprehensive quantitative approach to define inhibitor selectivity is an unmet need. This may be ascribed to the lack of suitable substrates, the poor definition of the enzymatic activity of some ARTD family members, the use of different enzyme sources and/or assay formats that may lead to discrepancies in potency and selectivity evaluation.1,6 The binding specificity of PARP inhibitors was recently addressed using differential scanning fluorimetry, a broadly applicable but not quantitative approach.7
This work describes the set up and validation of homogeneous fluorescence polarization (FP) assays for four distinct enzymes of the ARTD family (PARP-1/-3 and TNKS-1). These assays were implemented using human recombinant proteins and originally designed NAD+ binding site competitive fluorescent probes. In addition, they proved to be suitable for high-throughput screening (HTS). We also developed and validated a complementary surface plasmon resonance (SPR)–based binding assay for PARP-1 and PARP-2 to further support the FP displacement data, define the potency of highly active inhibitors, and characterize their binding kinetics. Overall, our studies demonstrate the feasibility of quantitative and reliable binding assays for inhibitor identification and selectivity evaluation.
Materials and Methods
PARP Inhibitors and Fluorescent Probes
Probes 1, 2, 3, and 4 (
Fig. 1
) were synthesized as reported in the Supporting Information. Compounds 5, 8, 9, 21 (
Fig. 1
), PND (18), 22, 23 (
Fig. 2
) were synthesized as reported in the Supporting Information. PJ-34 (6), 3-AB (7), olaparib (10), veliparib (11), iniparib (12), compounds 15 and 16 (
Fig. 2
), NU-1025 (17), XAV-939 (19) (
Fig. 1
), compound 24 (
Fig. 2
), and EB-47 (25) are commercially available. Compounds 13 and 14 (
Fig. 2
) were synthesized according to Ishida et al.8
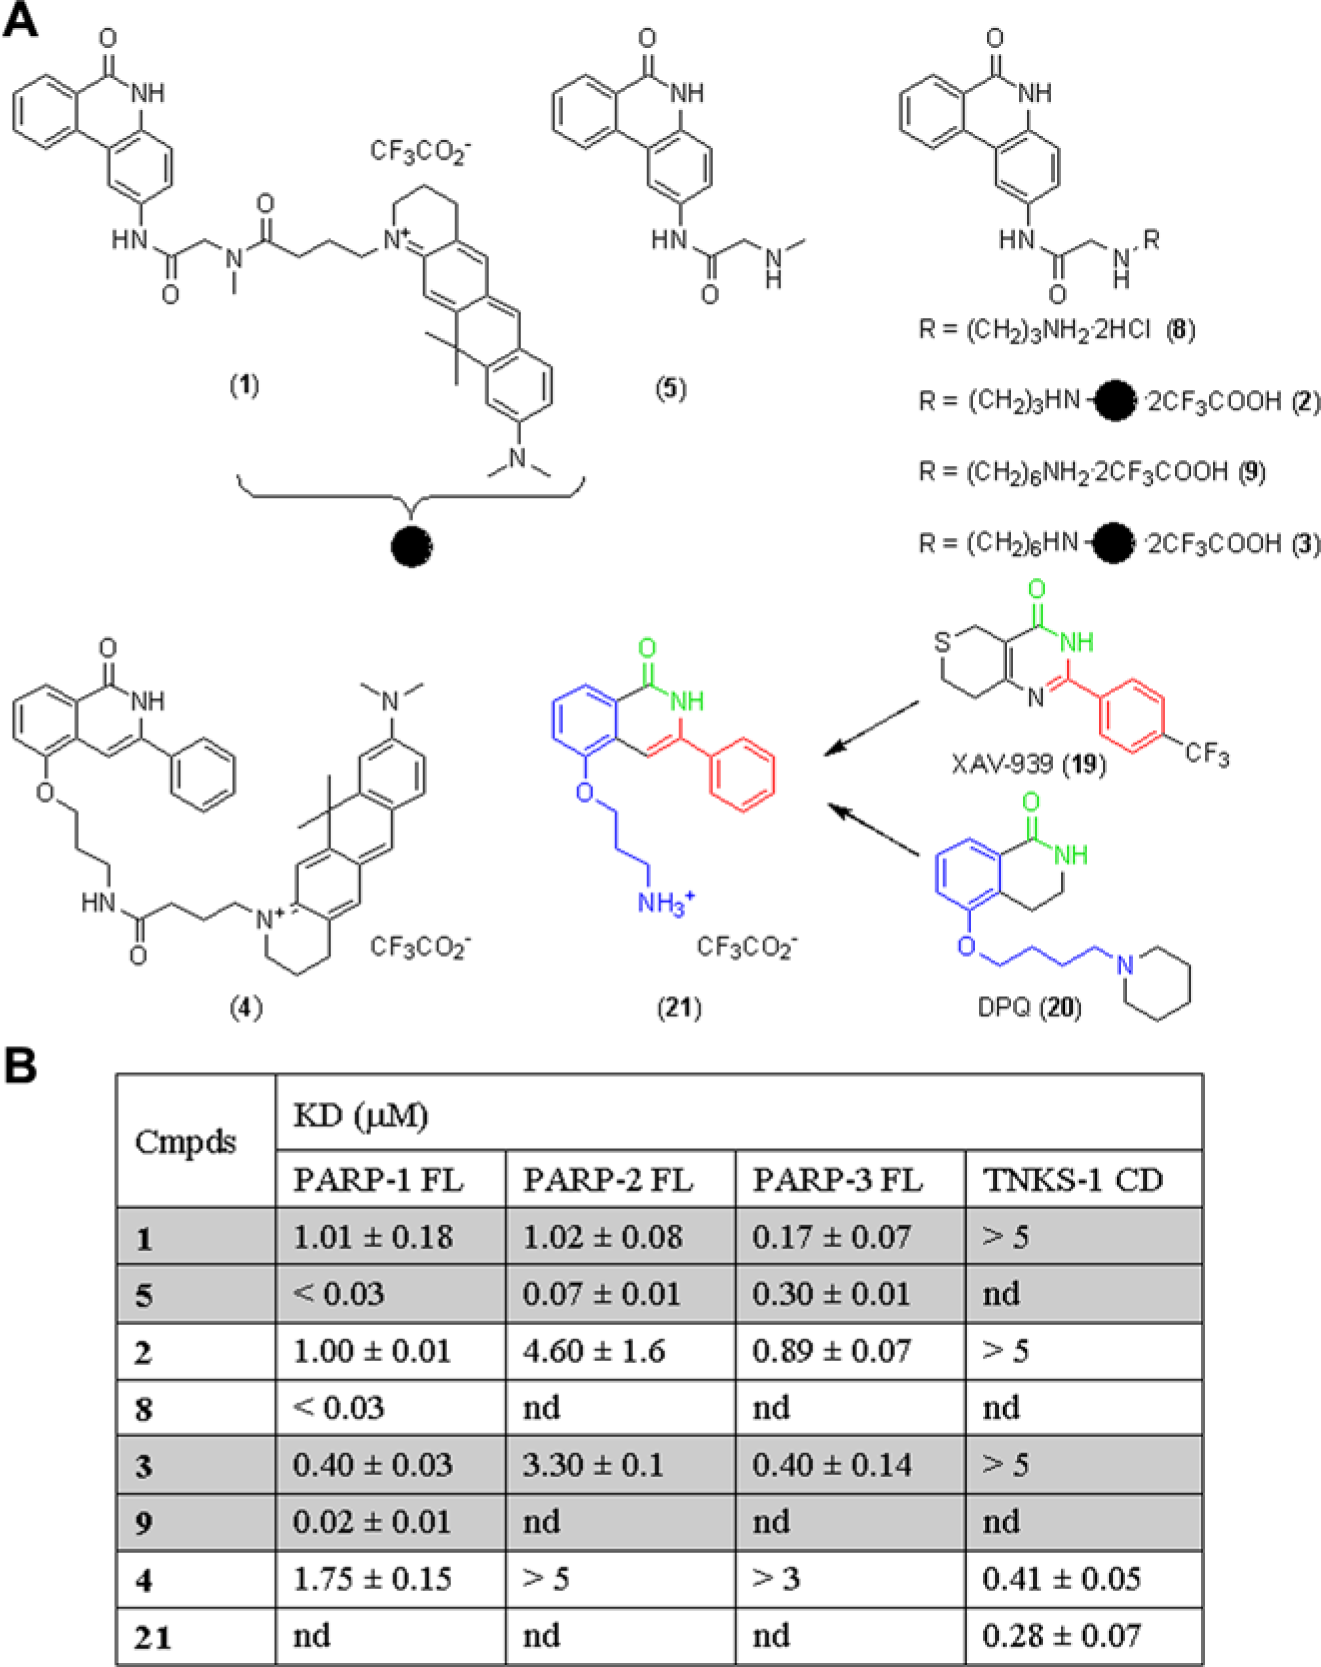
(A) Structures of phenanthridinone-derived probes (1, 2, and 3) and their unlabeled precursors (5, 8, and 9) and rational design of a TNKS-1 binding probe (4) and its precursor (21). (B) Probes and probe precursors affinities for PARP-1, -2, -3 and TNKS-1 measured by fluorescence polarization binding assays in the presence of 1% DMSO. KD values were calculated with Dynafit from three independent experiments, performed in duplicate, as reported in the experimental section. nd = not determined.
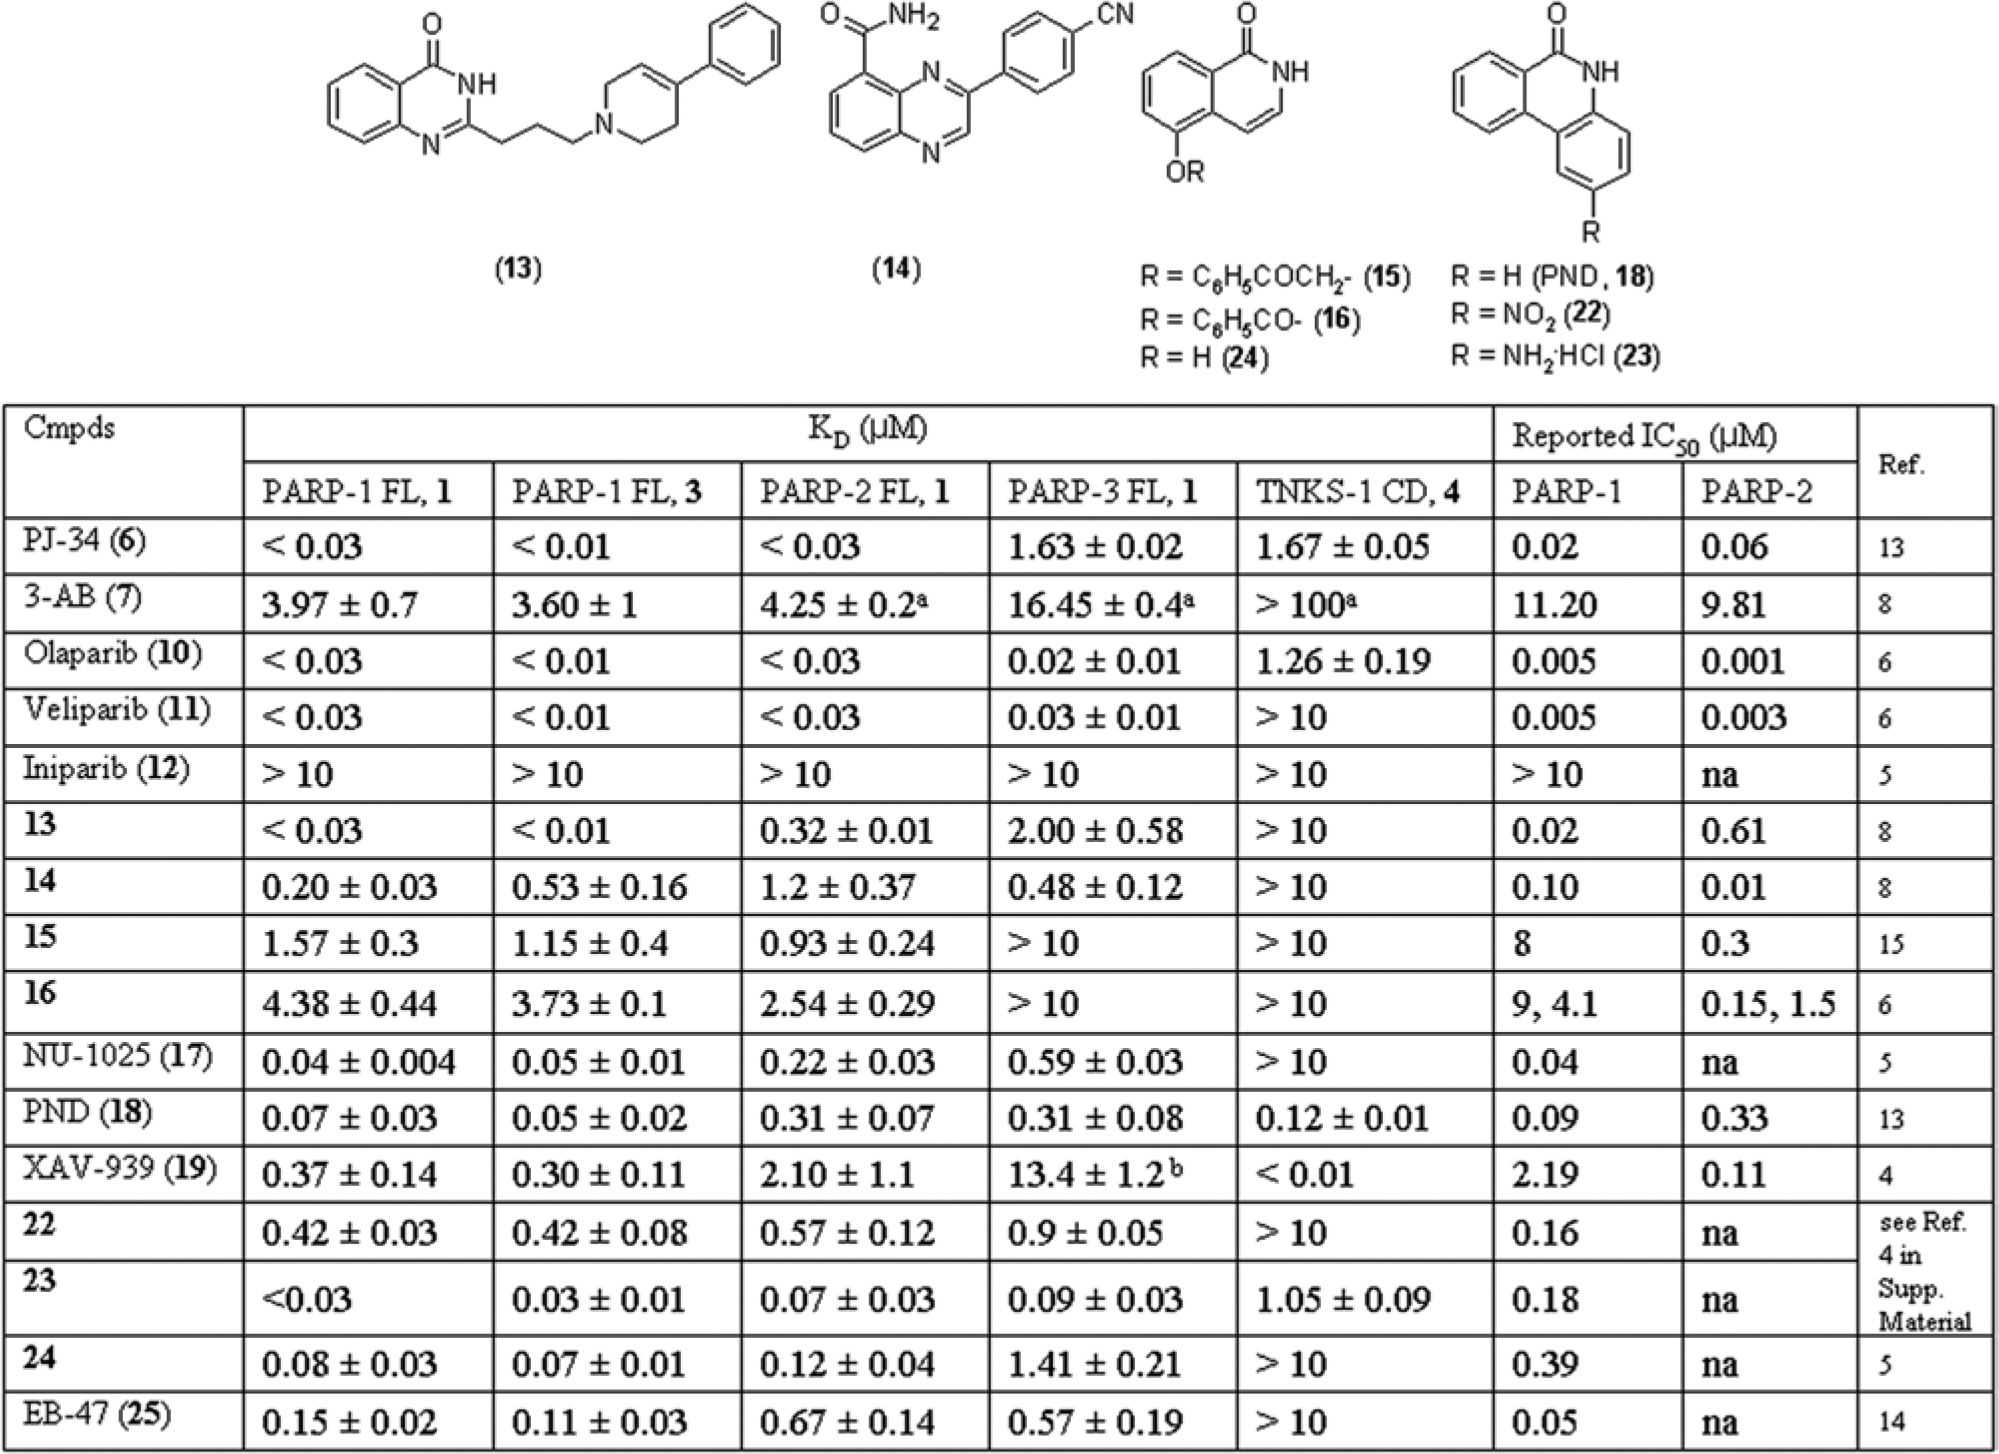
KD values for PARP-1, -2, -3 and TNKS-1 measured by fluorescence polarization displacement assays in the presence of 1% DMSO and comparison with published IC50 values on PARP-1 and -2. Data were analyzed with Dynafit using a competitive model to obtain KD values, which are the average of three independent experiments, performed in duplicate. aCompound highest concentration was 100 µM. na = not available.
Protein Cloning and Purification
Recombinant human PARP-1 FL, PARP-2 FL, PARP-3 FL, and TNKS-1 CD and HisGST tagged PARP-1 and PARP-2 CD were produced as reported in the Supporting Information.
FP Assays
FP experiments were carried out at room temperature using no-binding black 384-well microplates (Corning, NY). Unless differently specified, FP assays were performed in 50 mM Tris HCl, pH 8, 150 mM NaCl, 10 mM MgCl2, 0.001% Triton X-100 (assay buffer), in a final volume of 21 µL. The plate reader was a Tecan Saphire2 (Tecan U.S. Inc.). Polarization values were read using excitation and emission wavelengths of 590 and 630 nm, respectively. All FP values are expressed as mP units.9 Titration experiments were performed by adding serial dilutions of PARP proteins as indicated (e.g., from 0.104 µM to 6 µM, dilution steps 1:1.5) to a constant concentration of fluorescently labeled probes (0.05 µM for 1, 2, and 3; 0.02 µM for 4) in assay buffer and 1% DMSO with or without nicked DNA (Trevigen, Gaithersburg, MD). Displacement experiments were carried out at a constant concentration of probe (0.05 µM for 1 and 3; 0.02 µM for 4) and proteins, typically equal to one-quarter of PARP affinity for its probe, unless differently specified. Compounds were serially diluted in 100% DMSO, followed by an intermediate dilution step in water to reach 1% DMSO and 10 µM compound final concentration, unless differently specified. For each assay, high controls (equivalent to 0% displacement) contain probe, PARPs, and 1% DMSO, whereas low controls (equivalent to 100% displacement) contain only probe and 1% DMSO. Experimental data were analyzed using Dynafit software (BioKin Ltd, Watertown, MA).10 In particular, titration experiments were analyzed using a script file describing a 1:1 binding, whereas displacement data were analyzed using a script file describing a competitive mechanism. Fittings with associated errors less than 30% were considered accurate. Reported values, unless differently specified, represent the average and corresponding standard deviation of at least three independent experiments.
High-Throughput Assay
The screening was performed in no-binding black 384-well microplates (Corning) using the Biocube liquid dispenser (Protedyne, Windsor, CT). The assay was started with a 14 µL addition of a 1.5× master mix containing 0.075 µM probe 1 and 0.375 µM PARP-1 to all the wells except for 16 of them, in which the master mix contained 0.075 µM probe 1 alone. The plate was previously prepared with compounds or only DMSO as following: 7 µL of 3% DMSO were dispensed into the 16 wells to be used for probe 1 alone (low controls) and into 12 wells to be used for probe 1 and PARP-1 (high controls). Seven microliters of 1.2 µM or 0.3 µM solution of the parent compound (5) in 3% DMSO was added as duplicates in four wells as standard inhibitor for the HTS. In the remaining wells, 7 µL of a 30 µM test compound solution in 3% DMSO was dispensed, resulting in a final concentration of 0.05 µM probe 1, 0.25 µM PARP-1, 10 µM of the compound to be tested, and 1% DMSO. The plates were read using a ViewLux Imaging System (PerkinElmer, Waltham, MA). Assay performance was defined by evaluating the Z′ factor and signal-to-background (S/B) ratios.11
SPR Binding Assay
PARP-ligand binding affinities were determined with a Biacore T-100 (GE Healthcare, Fairfield, CT) using a GST-capture approach (GST capture kit; GE Healthcare). Goat anti-GST antibody was immobilized onto a CM5 sensor chip (flow cell 1 and 2) by standard amine coupling according to manufacturer instructions. Antibody high-affinity sites were blocked with recombinant GST according to the GST capture kit procedure. Capturing of the purified HisGST tagged PARP-1 or PARP-2 CD on flow cell 2 was performed by injecting 15 µg/mL of protein solution for 30 min at 10 µL/min flow rate in running buffer (50 mM Tris pH 8.0, 150 mM NaCl, 0.05% P20, 10 mM MgCl2), thus reaching about 2000 RU for both proteins. The flow cell 1 was used as a reference (no PARP-1 or PARP-2) to subtract for nonspecific binding, drift, and bulk refractive index. Samples were dissolved in water, and their concentrations were evaluated at 254 nm and normalized with respect to the same samples dissolved in 100% DMSO. Compounds were injected in running buffer over the immobilized HisGST PARP CDs according to the multicycle or single-cycle approach. For the multicycle analysis, a fivefold dilution series of compounds were injected for a 60 s association phase followed by a 60 s dissociation phase at a 30 µL/min flow rate. Each sample concentration was run in a separate cycle. Reference surface and zero concentration sample subtractions were used for double referencing of the binding data. The corrected data were fitted using BiaEvaluation software (GE Healthcare) using a 1:1 bimolecular model. For the single-cycle analysis, a fourfold dilution series of compounds were sequentially injected over immobilized HisGST PARP CDs within a single cycle. In particular, an association phase of 60 s was followed by a 60 s dissociation phase after each injection and by a 600 s dissociation phase after the last injection (flow rate 30 µL/min). Data were analyzed using a kinetic titration 1:1 interaction model, set up in BiaEvaluation software (GE Healthcare).12 Reported values, unless differently specified, represent the average and corresponding standard deviation of three independent experiments.
Results and Discussion
PARP-1 FP Displacement Assay Development and Validation
FP-based displacement assays are widely used for the identification of small molecules that bind to biological targets.9 We hypothesized that a nicotinamide analogue would represent a suitable probe for a NAD+ binding site–dependent displacement assay. After careful inspection of known PARP inhibitors, PJ-34 (6) was envisioned to possess all the features for the construction of a fluorescent probe as it is a potent, unselective, nicotinamide-like PARP inhibitor.13 Moreover, its synthesis is straightforward, and the terminal dimethylaminoacetamido group can be properly modified to anchor a dye. Thus, compound 5 was prepared and linked to ATTO 610 to deliver probe 1 (
Fig. 1A
).
Probe 1 affinity for PARP-1 FL was determined in a titration experiments working at a probe concentration of 0.05 µM. This concentration was selected because the fluorescence intensity signal is within a linear range, and it is 10-fold above the buffer background (data not shown). Affinities determined in the absence or presence of 2 µg/mL salmon sperm nicked DNA were 1.01 ± 0.18 µM and 1.2 ± 0.19 µM, respectively (
Fig. 3A
; Suppl. Table S1), indicating that DNA, commonly used to stimulate PARP-1 catalytic activity, does not affect PARP-1 affinity for probe 1. As expected, the same KD values were obtained with PARP-1 CD that lacks the DNA binding site (Suppl. Table S1). Experimental data were analyzed with the program Dynafit using a script file describing a 1:1 binding. No significant variations of polarization values over time were observed (data not shown).
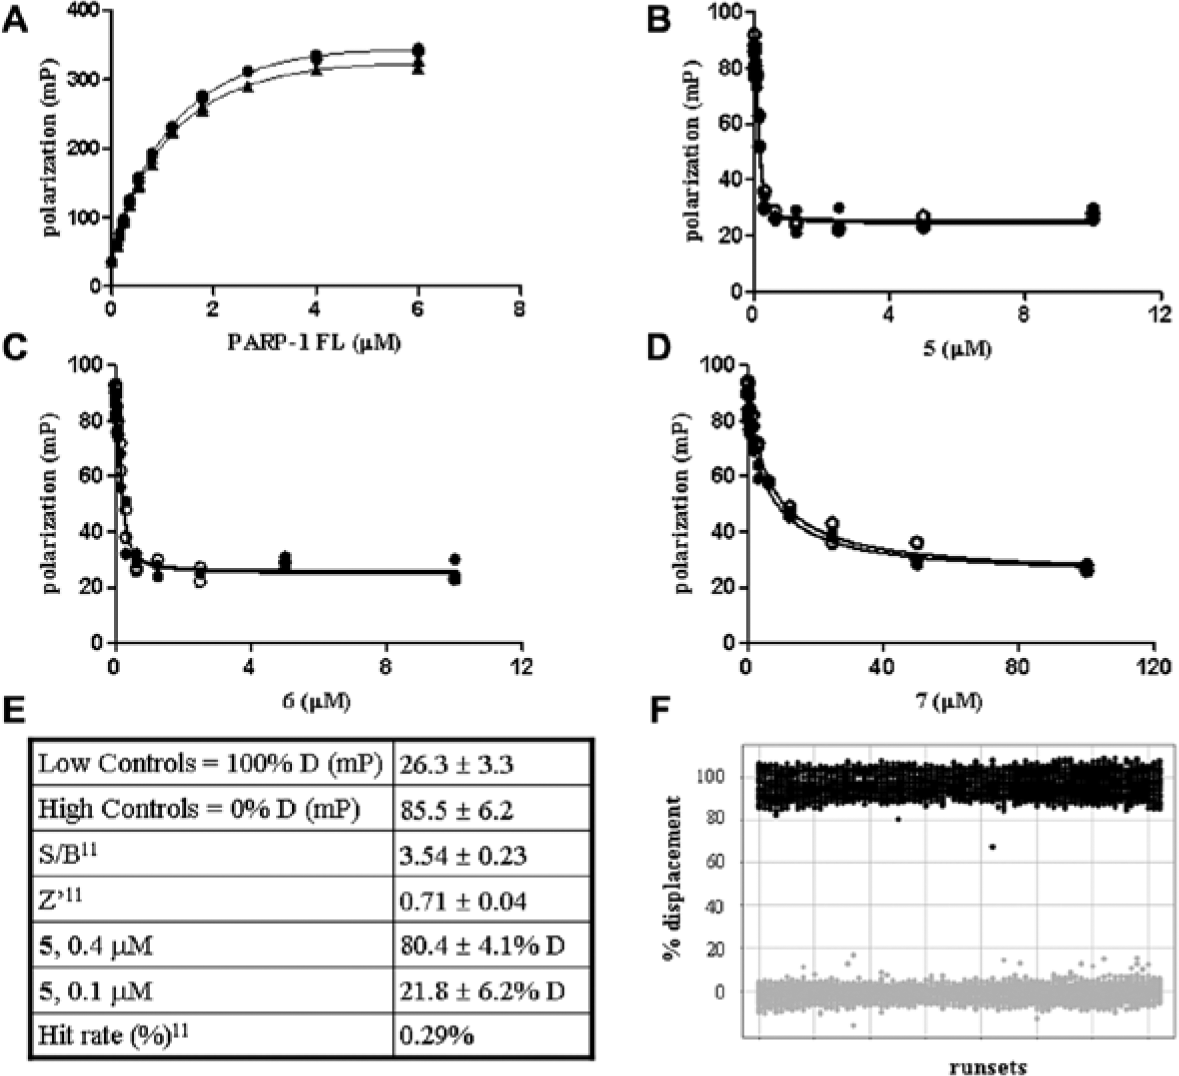
(A) Probe 1 titration with FL PARP-1 and affinity determination. Probe 1 (0.05 µM) was incubated with increasing concentrations of PARP-1 FL in assay buffer alone (•) or in the presence of 2 µg/mL DNA (▲). The fluorescence polarization (FP) signal (in mP units) was read in a Saphire2 microplate reader. KD values, calculated with Dynafit using a 1:1 binding model, are 1.01 ± 0.18 µM (•) and 1.2 ± 0.19 µM (▲), respectively. (B–D) Probe 1 displacement from PARP-1 FL. Varying concentrations of 5 (C), 6 (D), and 7 (E) were added to 0.05 µM probe 1 and 0.25 µM PARP-1, in the absence (•) or in the presence (○) of 2 µg/mL DNA. KD values, calculated with Dynafit and a competitive model, are <0.03 µM for 5 and 6 in both experimental conditions. Affinity of 7 is of 3.97 ± 0.7 µM and 4.92 ± 0.6 µM in the absence or in the presence of DNA, respectively. Results are the average of three independent experiments as reported in the experimental section. Each binding data set was performed in duplicate. (E) Performance of the miniaturized PARP-1 FL displacement assay in high-throughput screening (HTS). (F) Scatterplot of high controls (0% displacement, gray) and low controls (100% displacement, black) values from the HTS run sets.
To validate probe binding, we initially established two FP-based assays with or without 2 µg/mL nicked DNA, both in the presence of 1% DMSO. By setting protein and probe 1 concentrations at 0.25 µM and 0.05 µM, respectively, the assays proved to be robust and FP signals stable over time for at least 4 h (Z′ = 0.7). Subsequently, compounds 5, 6 and 3-AB (7) (
Fig. 3B
–
D
) were used to compete with probe binding. KD values were determined with the Dynafit program using a script file describing a competitive mechanism. All the compounds fully displaced the probe, indicating that its binding is specific. In particular, 5 and 6 affinities were below the assay detection limit, which was about 0.03 µM, as highlighted by the evaluation of a panel of inhibitors (
Fig. 2
). The affinity of 7 was in the micromolar range, as expected.8 Similar results were obtained with 2 µg/mL salmon sperm nicked DNA (Suppl. Table S2). The difference in affinities among compounds 5, 6 and probe 1 can be ascribed to an increase in the molecular bulkiness of the latter caused by the appendance of the fluorescence label and/or the lack of the side chain basic nitrogen atom supposed to contribute to the inhibitory potency of 6.14 Moreover, because the enzyme active site corresponds to 82% of the protein concentration, we ruled out an impact due to a largely inactive PARP-1 in the assay (Suppl. Fig. S1). The assay validation was then extended to several known PARP inhibitors tested in the presence or in the absence of nicked DNA (
Fig. 2
; Suppl. Table S2). Overall, we observed a good correlation with published IC50 values, and we confirmed that nicked DNA does not affect the binding of compounds. These data show that we were able to identify a newly designed fluorescence probe that efficiently binds in the NAD+ binding pocket of PARP-1 and is suitable to support a displacement FP assay.
PARP-1 FP HTS Assay Performance
The assay was fully automated on the Biocube robotic system working with 0.05 µM of probe 1 and 0.25 µM of PARP-1 FL. The well-to-well and plate-to-plate variability of the automated assay is minimal and the assay robust with Z′ factors ranging from 0.73 to 0.76 (Suppl. Table S3A). To further validate the assay performance, 50 compounds, including 10 among the already evaluated inhibitors, were tested at 10 µM in three different test plates, retrieving the expected percentage of displacement (Suppl. Table S3B). Subsequently, a collection of about 250,000 compounds was screened at a final concentration of 10 µM. The HTS assay performance was satisfactory and 5, selected as the standard for the HTS campaign, gave the expected percentage of displacement (% D,
Fig. 3E
,
F
). Potential interferences were monitored by evaluating the fluorescence intensity signals of samples containing the probe alone with respect to samples containing also the tested compounds. The hit rate was 0.29% using 3σ as the hit selection criterion (
Fig. 3E
).11
PARP-1 FP Displacement Assay Optimization
To improve the PARP-1 assay detection limit toward extremely potent inhibitors, we explored the possibility of improving the features of the probe. The attachment of an aminopropyl spacer to the tricyclic core (8) did not ameliorate the corresponding probe 2 affinity for PARP-1 (
Fig. 1
). This observation allowed inferring that the difference in potency among probes and their precursors can be mainly ascribed to steric effects. Thus, a longer linker was explored. Gratifyingly, a six-carbon unit spacer (3) allowed reaching a KD for PARP-1 of 0.4 ± 0.03 µM (
Fig. 1
; Suppl. Fig. S2A). Using a 0.05 µM solution of probe 3 and a protein concentration of 0.1 µM, we set up an FP-based displacement assay with a Z′ of 0.8 in the presence of 1% DMSO, with the FP signal stable over time (data not shown). To validate the FP displacement assay, a dose-response experiment was performed with the parent unlabeled compound 9. Complete displacement was observed, indicating that probe 3 binding is specific (Suppl. Fig. S2B). Compound 9 showed a KD of 0.02 ± 0.01 µM, thus proving that although the overall affinity for PARP-1 is increased, the bulkiness of the fluorescent label still affects the binding to the protein (
Fig. 1
). The assay was further validated with the PARP inhibitors previously tested. A good correlation between the two PARP-1 FP assays on less potent compounds was observed, whereas for several of the most active inhibitors, a more accurate determination of their potencies was achieved, with KD values up to 0.01 µM. In conclusion, by increasing the distance between the nicotinamide-like pharmacophore and the dye through a six-methylene unit spacer, a higher-affinity probe was identified. This allows for improvement of the assay detection limits and lowering of protein consumption.
PARP-2 Selectivity Assay Setup and Validation
We subsequently evaluated probes 1, 2, and 3 affinities toward the human recombinant PARP-2 FL following the same experimental procedure described for PARP-1 FL (
Fig. 1B
; Suppl. Table S1; Suppl. Fig. S2A). Probe 1 binds PARP-2 with the same affinity we found for PARP-1 and, also in this case, with no impact of nicked DNA. Because probes 2 and 3, despite their minimal structural modifications, showed poorer affinities toward PARP-2 (
Fig. 1B
), the displacement assay was set up and validated with probe 1. Under the same experimental conditions described for PARP-1, the assay was robust, the FP signal stable over time (Z′ of 0.75, data not shown), and probe binding specificity confirmed (Suppl. Fig. S1; Suppl. Fig. S3B, C). Subsequently, compounds already evaluated on PARP-1 were also tested on the PARP-2 assay (
Fig. 2
). As expected, olaparib (10),6 veliparib (11),6 and 6 were among the most active compounds on both targets, whereas iniparib (12)5 was inactive. The reported PARP-1 selective quinazolinone (13;
Fig. 2
) was confirmed to be more potent on PARP-1.8 Inhibitors 14, 15, and 16 (
Fig. 2
) resulted in being almost equally potent on both targets. These compounds were initially claimed to be more active on PARP-2 than PARP-1.8,15 Subsequently, 16 and a close analogue of 14 were demonstrated to be equally potent against both isoforms, in agreement with our data.6 These discrepancies in published data on selectivity may arise from the different enzyme sources and/or the assays employed.6 To further consolidate the obtained profiling data with an independent assay format, we decided to set up a direct binding assay for both PARP-1 and PARP-2.
PARP-1 and PARP-2 Direct Binding Assay Setup
A complementary SPR-based secondary assay was developed both for PARP-1 and PARP-2 on a Biacore T-100.12 For the SPR-based assays, a GST capture approach was used, which allows an oriented stable immobilization of the GST-protein over an anti-GST antibody surface, covalently bound to the sensor chip. Moreover, the anti-GST surface can be regenerated by injecting a glycine hydrochloride solution (pH = 2.2) that removes the captured fusion protein, thus facilitating multiple experiments on a single anti-GST surface. Because GST PARP-1 FL was poorly expressed both in insect cells and Escherichia coli, we produced and immobilized human recombinant HisGST PARP-1 and PARP-2 CDs. In the FP assay, the two proteins show the same behavior as the corresponding FL (Suppl. Tables S1 and S4). Among the already tested compounds, a subset of six inhibitors was selected and tested according to the standard or kinetic titration methods (
Table 1
; Suppl. Figure S4; Suppl. Table S5).
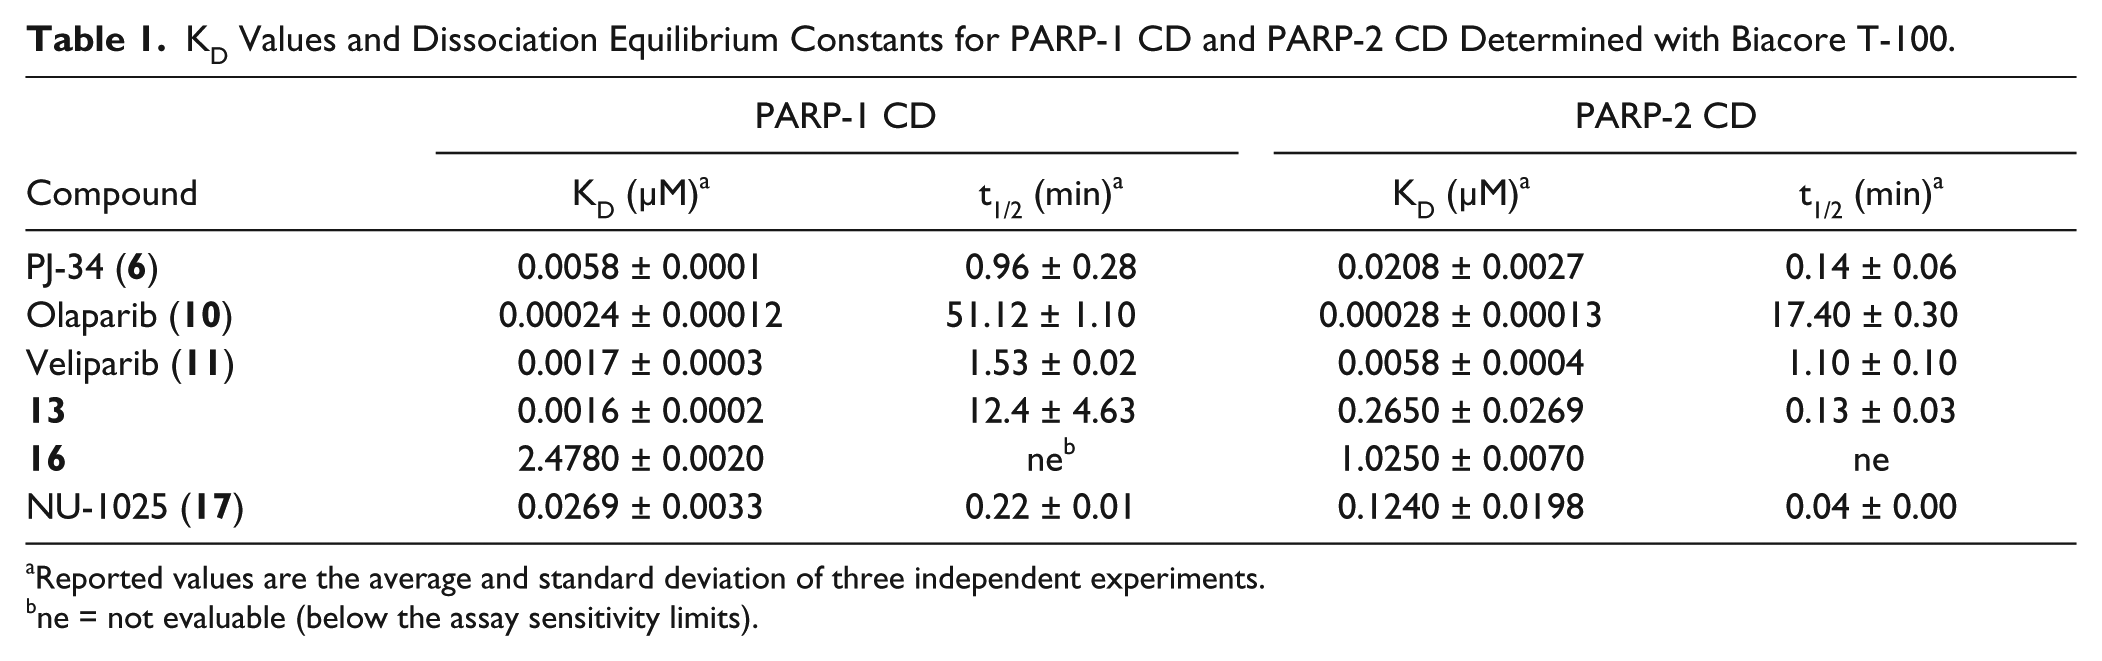
KD Values and Dissociation Equilibrium Constants for PARP-1 CD and PARP-2 CD Determined with Biacore T-100.
Reported values are the average and standard deviation of three independent experiments.
ne = not evaluable (below the assay sensitivity limits).
The resulting KD values for inhibitors 16 and NU-1025 (17) are in agreement with FP-based displacement data. In particular, the isoquinolinone 16 was confirmed to be almost equally potent on both PARP-1 and PARP-2, thus consolidating the already obtained results. Moreover, the SPR-based approach allowed measuring the affinity of inhibitors such as 6, 10, 11, and 13 with potencies below the FP displacement assay sensitivity limits. Among the evaluated compounds, olaparib (10) is the most active on both enzymes, whereas 13 was confirmed to be a PARP-1 selective inhibitor.8 Furthermore, all of the evaluated inhibitors were characterized in terms of binding kinetics, and olaparib (10) shows the longest dissociation time on both targets. The claimed PARP-2 selective inhibitor (16) showed a dissociation time below the instrument sensitivity limit, and for this reason, KD values were calculated by steady-state analysis (Suppl. Fig. S4E; Suppl. Table S5). Thus, the SPR-based assay for PARP-1 and PARP-2 represent a complementary secondary assay format that consolidate and integrate the FP-based displacement assay data.
Selectivity Assay Setup and Validation for PARP-3 and TNKS-1
After setting up the aforementioned assays for PARP-1/-2, we then explored the chance to further implement the selectivity profiling of PARP inhibitors by building up the corresponding FP displacement assays for PARP-3 and TNKS-1. PARP-3 shares with PARP-1/-2 a regulatory domain (PRD), an α-helical domain that closely interacts with the catalytic domain and defines the binding pocket. Indeed, probe 1 efficiently binds to human recombinant PARP-3 FL with a KD value of 0.17 ± 0.07 µM (
Fig. 1B
; Suppl. Fig. S5). Also, in this case, the assay is robust, the FP signal is stable over time (Z′ = 0.9), and the binding is specific, as shown by the complete probe displacement achieved at increasing concentrations of 5 (Suppl. Fig. S5). Differently from what is observed for PARP-1/-2, PARP-3 affinity for probe 1 and 5 is in the same range, indicating that the pharmacophore affinity is not affected by the conjugation of the fluorescent label (
Fig. 1B
). This difference may be ascribed to the reduced length of the PARP-3 D-loop that makes the binding pocket between the donor site and the regulatory domain (PRD) slightly more open.7 On the other hand, the TNKS-1 catalytic site lacks the aforementioned PRD domain, and its D-loop shows low sequence conservation with the other PARPs.4 Indeed, the available phenanthridinone-derived probes (1, 2, and 3) did not efficiently bind to TNKS-1 (
Fig. 1B
). To overcome this issue, a rational design of a structurally dissimilar core was then undertaken. A careful inspection of known nicotinamide-mimic TNKS-1 inhibitors, such as XAV-939 (19) and DPQ (20)13 (
Fig. 1
), allowed for the assembly of a chimerical isoquinolinone (21), which upon tagging with ATTO 610, delivered 4 (
Fig. 1A
). Probe 4 efficiently binds to TNKS-1 with an affinity of 0.41 ± 0.05 µM (
Fig. 1B
). Validation was performed with the parent unlabeled compound 21 that fully displaced the probe and proved to possess an affinity of 0.28 ± 0.07 µM, close to that of the corresponding probe (Suppl. Fig. S6). Working with a 0.1 µM solution of human recombinant TNKS-1 CD, a Z′ of 0.76 was calculated with a signal stable up to 4 h (data not shown). Both assays were subsequently used to profile the already evaluated PARP inhibitors (
Fig. 2
). With the exception of PND (18), which is equally potent on all ARTDs under scrutiny, most of the inhibitors do not significantly cross-react with TNKS-1. This is in agreement with the fact that the TNKS-1 catalytic domain proved to be heavily different from the other ARTDs. Thus, XAV-939 (19), a selective TNKS-1 inhibitor, does not bind to PARP-1/-3.4 The PARP-1 selective quinazolinone (13) and PJ-34 (6) do not efficiently bind to PARP-3 (
Fig. 2
; Suppl. Fig. S5), whereas iniparib (12)5 does not interact with any of the proteins evaluated. Overall, the observed affinities of the probes and inhibitors are consistent with the known differences in the NAD+ binding pocket among the tested isoforms and the qualitative ranking based on the thermal stabilization published by Wahlberg et al.7 Notably, these results suggest that biological effects of PARP inhibitors should be reevaluated, in particular when unselective compounds are used as chemical tools to investigate PARP biological activities.6
In summary, quantitative binding assays were developed for four distinct ARTD family members (PARP-1/-3 and TNKS-1). The robustness of these assays allows them to be used both for HTS campaigns and the detailed characterization of inhibitors. More importantly, they permit a comparison, in a quantitative fashion, of the inhibitors’ selectivity profile. Moreover, both FP and SPR assays have the potential of being applicable to other ARTDs, providing an efficient tool for a broader, quantitative cross-reactivity evaluation of PARP inhibitors. Selective inhibitors could serve not only to identify chemical tools to better delimit the biology of a given isoform but also to potentially minimize clinical side effects arising from unselective PARP inhibition.
Footnotes
Acknowledgements
The authors deeply acknowledge the contributions of Franco Ciprandi (high-performance liquid chromatography purification of fluorescent probes 1–4), Barbara Forte (synthesis of fluorescent probe 2), Raffaella Grimaldi (PARP-1 CD displacement assay), Ornella Milani (SPR direct binding assay characterization of compounds 6, 13, 16, 17), Claudia Perrera (PARP-1, -2, -3 protein characterization), Laura Riceputi (synthesis of compound 21), Sonia Troiani (TNKS-1 protein characterization), and Fabio Zuccotto (molecular modeling suggestions).
Supplementary material for this article is available on the Journal of Biomolecular Screening Web site at .
Declaration of Conflicting Interests
The authors declared no potential conflicts of interest with respect to the research, authorship, and/or publication of this article.
Funding
The authors received no financial support for the research, authorship, and/or publication of this article.
References
1.
HottigerM. O.HassaP. O.LuscherB.. Toward a Unified Nomenclature for Mammalian ADP-Ribosyltransferases. Trends Biochem. Sci. 2010, 35, 208–219.
2.
YelamosJ.FarresJ.LlacunaL.. PARP-1 and PARP-2: New Players in Tumour Development. Am. J. Cancer Res. 2011, 1, 328–346.
3.
KarlbergT.LangelierM. F.PascalJ. M.. Structural Biology of the Writers, Readers, and Erasers in Mono- and Poly(ADP-ribose) Mediated Signaling. Mol. Aspects Med. 2013, 34, 1088–1108.
4.
LehtiöL.ChiN. W.KraussS.Tankyrases as Drug Targets. FEBS J. 2013, 280, 3576–3593.
5.
CurtinN. J.SzaboC.Therapeutic Applications of PARP Inhibitors: Anticancer Therapy and Beyond. Mol. Aspects Med. 2013, 34, 1217–1256.
6.
LiscioP.CamaioniE.CarottiA.. From Polypharmacology to Target Specificity: The Case of PARP Inhibitors. Curr. Top. Med. Chem. 2013, 13, 2939–2954.
7.
WahlbergE.KarlbergT.KouznetsovaE.. Family-Wide Chemical Profiling and Structural Analysis of PARP and Tankyrase Inhibitors. Nat. Biotechnol. 2012, 30, 283–288.
8.
IshidaJ.YamamotoH.KidoY.. Discovery of Potent and Selective PARP-1 and PARP-2 Inhibitors: SBDD Analysis via a Combination of X-Ray Structural Study and Homology Modeling. Bioorg. Med. Chem. 2006, 14, 1378–1390.
9.
OwickiJ. C.Fluorescence Polarization and Anisotropy in High Throughput Screening: Perspectives and Primer. J. Biomol. Screen. 2000, 5, 297–306.
10.
KuzmicP.Program DYNAFIT for the Analysis of Enzyme Kinetic Data: Application to HIV Proteinase. Anal. Biochem. 1996, 237, 260–273.
11.
ZhangJ. H.ChungT. D.OldenburgK. R.A Simple Statistical Parameter for Use in Evaluation and Validation of High Throughput Screening Assays. J. Biomol. Screen. 1999, 4, 67–73.
12.
KarlssonR.KatsambaP. S.NordinH.. Analyzing a Kinetic Titration Series Using Affinity Biosensors. Anal. Biochem. 2006, 349, 136–147.
13.
EltzeT.BoerR.WagnerT.. Imidazoquinolinone, Imidazopyridine, and Isoquinolindione Derivatives as Novel and Potent Inhibitors of the Poly(ADP-ribose) Polymerase (PARP): A Comparison with Standard PARP Inhibitors. Mol. Pharmacol. 2008, 74, 1587–1598.
14.
FerrarisD. V.Evolution of Poly(ADP-ribose) Polymerase-1 (PARP-1) Inhibitors: From Concept to Clinic. J. Med. Chem. 2010, 53, 4561–4584.
15.
PellicciariR.CamaioniE.CostantinoG.. On the Way to Selective PARP-2 Inhibitors: Design, Synthesis, and Preliminary Evaluation of a Series of Isoquinolinone Derivatives. ChemMedChem. 2008, 3, 914–923.
Supplementary Material
Please find the following supplemental material available below.
For Open Access articles published under a Creative Commons License, all supplemental material carries the same license as the article it is associated with.
For non-Open Access articles published, all supplemental material carries a non-exclusive license, and permission requests for re-use of supplemental material or any part of supplemental material shall be sent directly to the copyright owner as specified in the copyright notice associated with the article.