
Abstract
How many hits from a high-throughput screen should be sent for confirmatory experiments? Analytical answers to this question are derived from statistics alone and aim to fix, for example, the false discovery rate at a predetermined tolerance. These methods, however, neglect local economic context and consequently lead to irrational experimental strategies. In contrast, the authors argue that this question is essentially economic, not statistical, and is amenable to an economic analysis that admits an optimal solution. This solution, in turn, suggests a novel tool for deciding the number of hits to confirm and the marginal cost of discovery, which meaningfully quantifies the local economic trade-off between true and false positives, yielding an economically optimal experimental strategy. Validated with retrospective simulations and prospective experiments, this strategy identified 157 additional actives that had been erroneously labeled inactive in at least one real-world screening experiment.
Keywords
Introduction
D
Many screeners arbitrarily pick the number of hits to experimentally confirm. There are, however, rigorous statistical methods for selecting the number of compounds to test by carefully considering each compound’s screening activity in relation to all compounds tested 3,4 or the distribution of negative (e.g., dimethyl sulfoxide treatment) controls. 5 In either case, a p-value is associated with each screened compound, and a multitest correction is used to decide the number of hits to send for confirmatory testing. One of the oldest and most conservative of these corrections is the Bonferroni correction, a type of family-wise error rate (FWER) correction that tests the hypothesis that all hits are true actives with high probability. 6,7 More commonly, false discovery rate (FDR) methods are used to fix the confirmatory experiment’s failure rate at a predetermined proportion. 8,9 Although more principled than ad hoc methods, all multitest correction strategies require the screener to arbitrarily choose an error tolerance without much theoretical guidance.
These methods, which balance global statistical trade-offs based on arbitrarily chosen parameters, are not sensible in the context of high-throughput screening (HTS). In a 2-stage experiment—a large screen followed by fewer confirmatory experiments—global statements about the statistical confidence of hits based on the screen alone are less useful because confirmatory tests can establish the activity (or inactivity) of any hit with high certainty, are much less expensive than the total screening costs, and are required for publication. The experimental design itself implies an economic constraint; resource limitations are the only reason all compounds are not tested for dose-response behavior. We argue, therefore, that the real task facing a screener is better defined as an economic optimization rather than a statistical trade-off.
Tasks like this, deciding the optimal quantity of “goods” to “produce,” have a rich history and form the basis of economic optimization. 10 This optimization aims to maximize the utility minus the cost: the surplus. One of the most important results from analyzing this optimization is that the globally optimal point at which to stop attempting to confirm additional hits can be located by iteratively quantifying whether the local trade-off between true positives and false positives is sensible. A local analysis admits a globally optimal solution. This result motivates our framework.
Methods
Our economic framework is defined by 3 modular components: (1) a utility model for different outcomes of dose-response experiments, (2) a cost model of obtaining the dose-response data for a particular molecule, and (3) a predictive model for forecasting how particular compounds will behave in the dose-response experiment. After each dose-response plate is tested, the predictive model is trained on the results of all confirmatory experiments performed thus far. This trained model is then used to compute the probability that each unconfirmed hit will be determined to be a true hit if tested. Using the utility model and cost model in conjunction with these probabilities, the contents of the next dose-response plate is selected to maximize the expected surplus (expected utility minus expected cost) of the new plate, and the plate is run only if its expected surplus is greater than zero.
This framework maps directly to an economic analysis. From basic calculus, it can be derived that the point at which a pair of supply and demand curves intersect corresponds to the point that maximizes total surplus. This point of intersection is also the last dose-response plate with a marginal surplus greater than zero. The utility model quantifies how the screener values different outcomes of the confirmatory study. This information is used to define a demand curve: the marginal utility as a function of the number of successfully confirmed actives so far. The cost model exposes the cost of obtaining a particular dose-response curve and is expressed in the same units as the utility. The predictive model forecasts the outcome of future confirmatory experiments and, together with the cost model, is used to define a supply curve: the marginal cost of discovery (MCD) as a function of the number of actives successfully confirmed as actives.
Explicitly computing the expected surplus to determine an optimal stop point is critically dependent on modeling a screener’s utility function with mathematical formulas, a daunting task that requires in-depth surveys or substantial historical data in addition to assumptions about the screener’s response to risk. 11-13 However, in practice, the expected surplus need not be explicitly computed to solve this problem. We can access the relevant summary of the screener’s preferences by repeatedly asking whether he or she is willing to pay the required amount to successfully confirm one more active. Iteratively exposing the MCD to the screener is like placing a price tag on the next unit of discovery, and interrogating the screener is equivalent to computing whether the marginal surplus is greater than zero. For illustration purposes, however, we do use mathematical utility functions to show that simple predictive models, which map screening activity to the dose-response outcome, can be constructed and these models admit near-optimal economic decisions. To our knowledge, this is the first time formal economic analysis has informed an HTS protocol.
High-throughput screen
The technical details of the assay and subsequent analysis can be found in PubChem (PubChem AIDs 1832 and 1833). For approximately 300,000 small molecules screened in duplicate, activity is defined as the mean of final, corrected percent inhibition. After molecules with autofluorescence and those without additional material readily available were filtered out, 1323 with at least one activity greater than 25% were labeled “hits” and tested for dose-response behavior in the first batch. Of these tested compounds, 839 yielded data consistent with inhibitory activity. Each hit was considered a “successfully confirmed active” if the effective concentration at half-maximal activity (EC50) was less than or equal to 20 µM. Using this criterion, 411 molecules were determined to be active.
Utility model
In this study, 1 unit of discovery is defined as a single successfully confirmed active. The utility model is defined as a function of the number of confirmed actives obtained so far, n. We consider 2 utility models. First, in the fixed-return model (
Cost model
We use a fixed-cost model where each plate costs the same amount of money, C(p(n))= $(400 p(n)), where p(n) is the total number of plates required to confirm actives. Allowing for 12 positive and 12 negative controls on each plate and measuring 6 concentrations in duplicate, 30 dose-response curves can be tested on a single 384-well plate; these parameters can easily be modified to suit other formats. We assume the first such plate tests the 30 hits with highest activity in the original screen. Subsequent plates are filled to maximize expected surplus as described in the Introduction.
Clearly, in many scenarios, it is not easy or meaningful to place a dollar value on the cost of doing a confirmatory experiment. In these cases, we recommend expressing the cost function in more general units: the number of confirmatory tests (NCTs) required. In our example, this is equivalent to using the cost model defined as C(p(n)) = (30 p(n)) NCT. This amounts to a negligible change in the downstream analysis, which only changes the y-axis of the resulting supply and demand curves without affecting their shapes. An example of how this strategy functions in practice is included in the Results section.
Predictive model
We consider 2 predictive models: a logistic regressor (
Ordering hits for confirmation
Any combination of either of the 2 predictive models (
Experimental yield and marginal cost of discovery
Most experiments compute the expected MCD by dividing the cost of the next plate by the number of confirmed actives expected to be found within it, using either
Results
Relationship between potency and screen activity
For illustration, we use the data from a florescence polarization screen for binding inhibitors of the Caenorhabditis elegans protein MEX-5 to the tcr2 element of its cognate target, glp-1. 16 Additional details are included in the Methods section. As would be expected in any successful screen, potency and screening activity are correlated ( Fig. 1a ; n = 839 and R = 0.3656 with p < 0.0001). Similarly, actives and inactives are associated with different distributions that are not separable, overlapping substantially ( Fig. 1b ; actives having n = 411 with 47.60 mean and 20.48 SD compared with inactives having n = 912 with 31.70 mean and 16.80 SD).
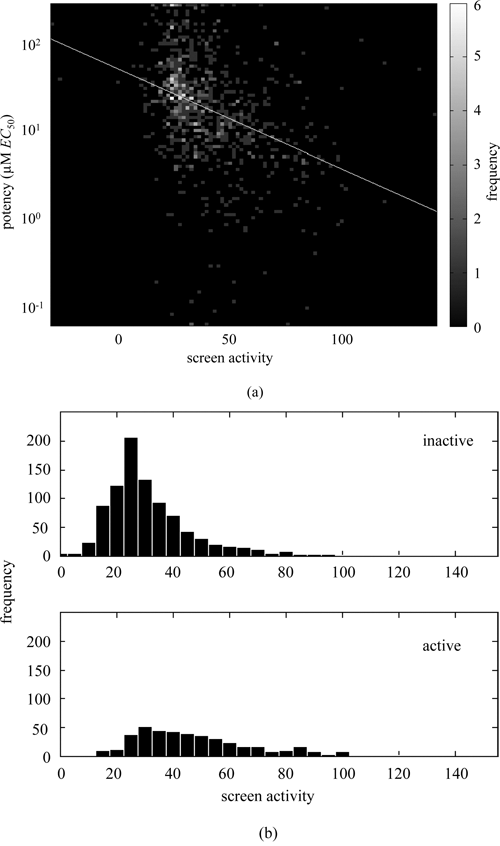
Relationship between potency and activity. (
Feasibility of forecasting experimental yield
One critical test of our method’s feasibility is to confirm that simple predictive models can accurately forecast the number of successfully confirmed actives in future experiments. The predictive model must extrapolate predictions on data outside the range of the training inputs. We expect that the simplest models, such as
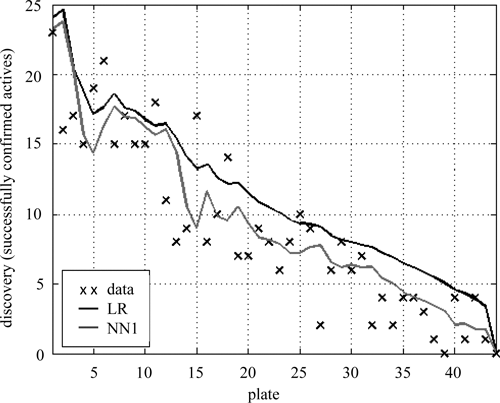
Forecast confirmation rate. The observed and predicted (
Prospective supply curve
We can also evaluate this framework by considering the shape of forecast supply curves (
Fig. 3
). Unsurprisingly,
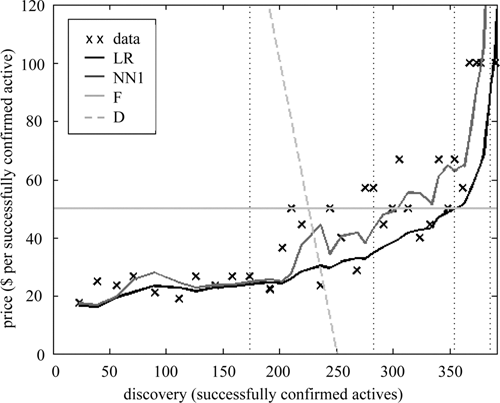
Supply and demand. The predicted supply curves (
Economic optimality of stop points
Predicted stop points can be evaluated by comparing them to the optimal stop points, those empirically found to yield the highest surplus. The surplus varies with the number of compounds tested, has several nearly equivalent plates for
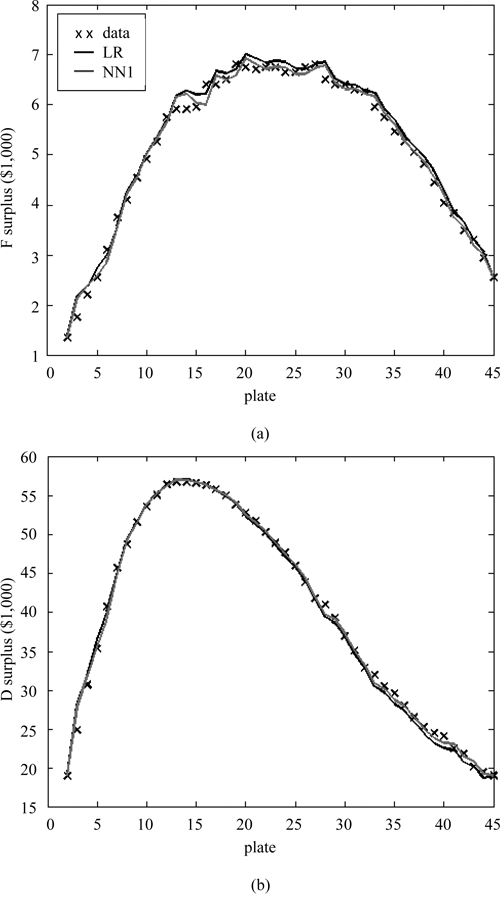
Surplus as a function of stop point for both the (
It is interesting to note that, with
Prospective validation
We further validated our methodology by presenting the MCD of the next batch of compounds to the team running the screening experiment. The MCD was presented in terms of NCT in this scenario, amounting to a simple change of units.
Predictive models were trained on the 1323 dose-response experiments performed so far; these models were then used to forecast the number of successfully confirmed actives we would expect to find by testing the next batch of compounds. The next batch of 462 compounds ranged from 19.52 to 100.25 screen activity, over a larger window than expected because 213 of the best hits became available, although they were initially unavailable when compounds for the first batch of confirmation experiments were being ordered. This batch of confirmations was predicted by
As a result of this analysis, which surprised the scientists involved, the screening team decided to obtain and test for dose-response behavior an additional batch of compounds. Of these 157 compounds, which were previously assumed to be inactive, were found to be active with about 30% higher yield than predicted. This analysis proved useful to the team running the HTS experiment because they had capacity to test additional compounds and did not expect that additional actives could be retrieved at this yield. Although not as accurate as forecasts on smaller batches, these forecasts provided enough information to appropriately justify testing additional compounds. In this experiment, therefore, the MCD provided the rationale to discover 157 additional actives that would not have otherwise been discovered. We suspect this scenario is not atypical. In HTS experiments, the cost of testing hits is low compared to the overall cost of the screen. In many cases, screeners might send more compounds for confirmatory testing with our analysis.
Comparison with FDR
It is tempting to directly compare statistical methods of error control with MCD. This comparison, however, is not straightforward because there is no correspondence between global and local error rates. However, in the context of fixed-assay cost, our fixed-utility model,
Comparison with local FDR
An uncommonly used statistical method attempts to estimate the “local” FDR from the p-values of each hit with respect to the distribution of the negative controls.
18,19
Local FDR is defined as the proportion of false positives at a particular point in the prioritized list and can function as the predictive model in our framework. In the case of
Discussion
The experiments presented here demonstrate the feasibility and power of our economic approach. For clarity, only the simplest variations have been presented. Several extensions are imaginable for each module: utility, cost, and predictive. These extensions explore how our economic analysis functions as a unified framework to quantitatively address several disparate concerns in HTS experiments.
First, more useful utility models can be derived that more accurately model the real value of screening results. As we have seen, the exact utility model can dramatically affect the economically optimal stop point, so this is a critical concern. Although the utility function of screeners remains challenging to mathematically specify, better models of the inputs into the utility function are potentially useful. For example, more meaningful definitions of a “unit of discovery” are important because they can suggest attempting to confirm hits in different orders and increase yield even when only a fixed number of hits are to be tested. This is equivalent to changing the units of the x-axis of the supply and demand curve graphs. One variation would be to define a diversity-oriented utility that measures discovery as the number of scaffolds with at least 1 confirmed active. Related models have been proposed in the cheminformatics literature. 20 Even more complex utility models might consider the potential of improving a downstream classifier. 21 We favor a “clique”-oriented utility function that counts each clique of at least 3 or 4 confirmed actives with a shared scaffold as a single unit of discovery. This models the behavior of medicinal chemists who are often only willing to optimize a lead if other confirmed actives share its scaffold. We will explore the algorithm necessary for these variations in a future study.
Second, more complex cost models can be derived that could, for example, encode the extra overhead of running smaller batch sizes. Other variations could encode the acquisition cost or the intellectual property encumbrance of particular molecules. Furthermore, in some circumstances, it may be more useful to measure cost in units of time instead of money.
Third, better predictive models are possible, including neural networks with several hidden nodes, estimates of the local FDR computed from p-values, 18,19 analytic formulas based on mathematical properties of the system, 22 and predictors that take chemical information into account. 23,24 Many of these methods, however, make strong assumptions about the underlying data. In contrast, our simple models make fewer assumptions and could, therefore, be more broadly applicable. Even within the structure of our simple models, there are some important improvements possible. For example, adding a well-designed Bayesian prior to the logistic regressor would enable it to work appropriately even when confirmatory experiments yield no true actives, an important boundary case often encountered in HTS.
In addition to continuing to admit economically optimal experimental strategies, these extensions expose several advantages of MCD and our economic analysis over p-value-based statistical methods designed to control the FDR or FWER. First, more complex predictive or utility models can reorder hits to improve the yield from confirmatory experiments, whereas statistical methods will always prioritize compounds in the order of their screen activity. Second, the supply curve traced by MCD can be fed into higher order models to direct more complex experimental designs, whereas statistical methods do not yield this information. Third, MCD does not require negative or positive controls or make normality assumptions, enabling its application to data sets where calculating accurate p-values is problematic.
Finally, the immediate application of the MCD to practical HTS scenarios is straightforward, even when adaptive HTS, with plate-by-plate confirmatory experiments, is not possible. At any point after confirmatory experiments have been run, the following protocol can be applied: (1) train a predictive model on the confirmatory experiments obtained so far, (2) use this model to pick the contents of the next batch of compounds to be tested, (3) compute the MCD of this batch in terms of NCT as the number of compounds in the next batch divided by the sum of the predictive model’s output for each of these compounds, and (4) obtain and test these compounds if the screener believes that this MCD is an acceptable price for more confirmed actives. This analysis can even be done on publicly available HTS data sets from PubChem to discover active compounds that have yet to be discovered.
We have outlined an economic framework—from which we have derived the MCD—that has applications throughout both science and medicine; prime candidates for its application include any experimental design in which a large screen is followed up with more costly confirmatory experiments. By encoding local cost structure, MCD provides a richer, more informative analysis than statistical methods alone can provide and yields a unified analytic framework to address several disparate tasks embedded in screening experiments.
Footnotes
Acknowledgements
We thank the Physician Scientist Training Program of the Washington University Pathology Department for supporting SJS; NEB and PAC are supported in part by NCI’s Initiative for Chemical Genetics (N01-CO-12400) and NIH Molecular Libraries Network (U54-HG005032), and SPR is supported by the NIH (NS-059380). We also thank Paul Swamidass and Richard Ahn for their helpful comments on the manuscript.
Author contributions: SJS conceived the ideas in this article, performed the virtual experiments, and wrote the initial manuscript. JAB and SPR performed the MEX-5 HTS experiment and the dose-response confirmations. NEB downloaded and pre-processed the data for analysis, and prepared manuscript figures. PAC provided project guidance, helpful comments, and substantial revisions to the manuscript.
Competing interests: The authors declare that they have no competing financial interests.