
Abstract
Inhibition of adenylyl cyclase (AC) activity is frequently used to measure µ-opioid receptor (MOR) activation. We sought to develop a simple, rapid assay of AC activity in whole cells that could be used to study MOR signaling. Chinese hamster ovary cells expressing human MOR (CHO-MOR cells) were grown in 96-well plates and loaded with membrane potential–sensitive fluorescent dye. CHO-MOR cells were treated with the AC activator forskolin (FSK), with or without simultaneous application of MOR agonists, and the resulting change in fluorescence was measured. CHO-MOR cells hyperpolarized in response to application of FSK (pEC50, 7.3) or calcitonin (pEC50, 9.4). A submaximally effective concentration of FSK (300 nM) caused a 52% ± 2% decrease in fluorescence. Simultaneous application of the opioids DAMGO (pEC50, 7.4; Emax, 56%), morphine (pEC50, 7.0; Emax, 61%); and buprenorphine (pEC50, 8.6; Emax, 24%) inhibited the FSK response in a dose-dependent manner while having no effect by themselves. The effects of DAMGO were blocked by pertussis toxin. This assay represents a simple, robust method for real-time observation of AC inhibition by MOR in CHO cells. It represents an appealing alternative to end-point assays that rely on cAMP accumulation and can avoid potential confounds associated with rapid desensitization of MOR signaling.
Introduction
Opioid analgesics are the most widely prescribed drugs in the treatment of moderate to severe pain. Despite their powerful analgesic effects, the use of opioids is limited due to the number of associated adverse affects such as respiratory depression, sedation, constipation, and nausea, as well as the development of tolerance. Over time, the development of opioid tolerance and physical or psychological dependence may require 10-fold escalations in dose to maintain adequate pain relief. 1 Both the analgesic and adverse effects of opioid analgesics are mediated via the µ-opioid receptor (MOR) subtype. 2 MORs mediate their effects via downstream mechanisms, including inhibition of adenylyl cyclase (AC) activity via Gαi/o subunits, inhibition or activation of ion channels via Gβγ subunits, and activation of mitogen-activated protein kinase (MAPK) signaling via β-arrestin. 3
One of the hallmarks of MOR activation is the inhibition of AC activity, leading to a decrease in the production of cAMP. Changes in cAMP-dependent signaling are also hallmarks of processes associated with chronic opioid receptor activation.4,5 cAMP is an important cellular second messenger, mediating a diverse range of physiological processes via activation of cAMP-dependent protein kinase A (PKA), an exchange protein directly regulated by cAMP (EPAC), as well as directly via cAMP-gated ion channels.6,7 The measurement of cAMP accumulation is frequently used as a sensitive end-point assay in studies of both acute and chronic MOR signaling. A number of techniques have been developed for quantifying cAMP accumulation in recent years, particularly in the rapidly growing field of high-throughput screening (HTS). AC activity can be measured in a number of ways, including measurement of the accumulation of [3H]-cAMP, by [3H]-cAMP binding displacement assays, by reporter gene assays using cAMP-dependent transcription factors, by enzyme-linked immunosorbent assays (ELISAs) that measure cAMP-like immunoreactivity, and through measurements of cAMP-dependent protein-protein interactions using fluorescence resonance energy transfer (FRET). 8 These assays often require cell lysis, are usually single time point, and require the addition of multiple reagents or transfection of reporter constructs. Importantly, many assays of AC activity require significant incubation times to allow appropriate cAMP accumulation.9,10 In studies of MOR signaling, prolonged incubation times can pose a significant and underappreciated problem as MOR signaling undergoes rapid desensitization followed by receptor internalization during agonist exposures as short as 5 to 10 min. 11 As the incubation periods in most cAMP assays are at least 10 to 20 min, during which time opioid exposure is sustained, these assays are likely to be measuring the combined effects of receptor activation, desensitization, internalization, and even resensitization.11,12
In this study, we sought to develop a simple, rapid assay of AC modulation. Here we report an assay of MOR inhibition of AC in intact Chinese hamster ovary (CHO) cells using a proprietary membrane potential–sensitive dye. The assay is rapid, real time, and robust, and it requires minimal preparation. This assay should also obviate the problem of MOR desensitization during baseline measurements of AC inhibition.
Materials and Methods
MOR Transfection and Cell Culture
Flp-In T-Rex CHO cells were created as follows. CHO Flp-In cells were grown in minimal essential medium α (Invitrogen, Melbourne, Australia) containing 5% fetal bovine serum (FBS) and 100 µg/mL zeocin. They were transfected with pcDNA6TR (tet-repressor plasmid) using Fugene 6 reagent (Promega, Alexandria, Australia) and selected with 10 µg/mL blasticidin and 100 µg/mL zeocin. Six individual clones were isolated and transiently transfected with the plasmid pcDNA5-FRT-TRPV1, which encodes the transient receptor potential vanilloid 1 receptor (TRPV1) under control of a tetracycline-sensitive repressor. Clones were then tested for successful induction with 1 µg/mL tetracycline using a plated-based calcium assay of TRPV1 receptor activation. 13 One CHO-FRT-TR cell line was chosen and stably transfected with a pcDNA5 construct encoding the hemagglutinin (HA)–tagged human µ-opioid receptor complementary DNA (cDNA) together with the pOG44 (Flp recombinase plasmid) using the transfectant Fugene (Promega). The HA-tagged human µ-opioid receptor was synthesized by Genscript (Piscataway, NJ). Cells expressing MOR were selected using hygromycin B (500 µg/mL) and grown to confluency. The selected cells were then cultured in Dulbecco’s modified Eagle’s medium (DMEM) containing 10% FBS, 100 U penicillin/streptomycin, and 500 µg/mL hygromycin B up to passage 5. Hygromycin concentration was reduced to 200 µg/mL beyond passage 5. Cells were passaged at 80% confluency as required. Assays were carried out on cells up to 30 passages. Cells for assays were grown in 75-cm2 flasks and used at greater than 80% confluence. The day before the assay, cells were detached from the flask with trypsin/EDTA (Sigma-Aldrich, Castle Hill, Australia) and resuspended in 10 mL of Leibovitz’s L-15 media supplemented with 1% FBS, 100 U penicillin/streptomycin, and 15 mM glucose. Human MOR (hMOR) receptor expression was induced with 2 µg/mL tetracyclin 20 h prior to the assay. The cells were plated in a volume of 90 µL in black-walled, clear-bottomed 96-well microplates (Corning, Corning, NY) and incubated overnight at 37 °C in ambient CO2.
Membrane Potential Assay
Membrane potential was measured using a FLIPR Membrane Potential Assay kit (blue) from Molecular Devices (Sunnyvale, CA). The dye was reconstituted with assay buffer containing (in mM) NaCl 145, HEPES 22, Na2HPO4 0.338, NaHCO3 4.17, KH2PO4 0.441, MgSO4 0.407, MgCl2 0.493, CaCl2 1.26, and glucose 5.56 (pH 7.4; osmolarity 315 ± 5). Prior to the assay, cells were loaded with 90 µL/well of the dye solution without removal of the L-15, giving an initial assay volume of 180 µL/well. Plates were then incubated at 37 °C at ambient CO2 for 60 min. Fluorescence was measured using a FlexStation 3 (Molecular Devices) microplate reader with cells excited at a wavelength of 530 nm and emission measured at 565 nm. Baseline readings were taken every 2 s for at least 2 min, at which time either drug or vehicle was added in a volume of 20 µL. Further additions were made in volumes of 20 µL, as indicated. The background fluorescence of cells without dye or dye without cells was negligible. Changes in fluorescence were expressed as a percentage of baseline fluorescence after subtraction of the changes produced by vehicle addition. The final concentration of DMSO was not more than 0.1%, and this concentration did not produce a signal in the assay.
Drugs and Chemicals
Unless otherwise noted, tissue culture reagents and buffer salts were from Invitrogen or Sigma-Aldrich. Tyr-
Data
Unless otherwise noted, data are expressed as mean ± SEM of at least five determinations made in duplicate or triplicate. Concentration-response curves were fit with a four-parameter logistic equation using GraphPad Prism (GraphPad Software, La Jolla, CA). Statistical comparisons were made with an unpaired Student t test, unless otherwise noted. p < 0.05 was considered significant. All channel and receptor nomenclature is consistent with the British Journal of Pharmacology guide to receptors and channels. 14
To calculate Z′, a measure of the robustness of the assay and indication of its suitability for HTS, the assay was performed on three separate occasions using assay buffer as the minimum response and either 300 nM FSK or 300 nM FSK with 3 µM DAMGO as the maximum response in 96-well plates. The Z′ factor was calculated as outlined in Zhang et al. 15
Results
Hyperpolarization of CHO Cells by Calcitonin and Forskolin
CHO cells express calcitonin receptors, Gs-coupled G protein–coupled receptors (GPCRs) that stimulate AC. 16 In CHO-MOR cells loaded with the proprietary membrane potential dye, addition of rat calcitonin produced an immediate decrease in fluorescence, consistent with hyperpolarization of the cells ( Fig. 1A ). The fluorescent signal continued to slowly decrease for 10 min after the addition of calcitonin, after which fluorescent signals remained stable for the remainder of the assay. The decrease in fluorescence was concentration dependent, with Emax of 46% ± 3% and pEC50 of 9.4 ± 0.1 (n = 5; Fig. 1B ). Addition of forskolin (FSK) to CHO cells loaded with membrane potential dye produced a similar decrease in fluorescence to that observed with calcitonin, with the fluorescent signal stabilizing 5 min after the addition of FSK ( Fig. 1A ). The decrease in fluorescence for FSK was concentration dependent, with a maximal effect (Emax) of 52% ± 2% and pEC50 of 7.3 ± 0.1 (n = 6; Fig. 1B ).
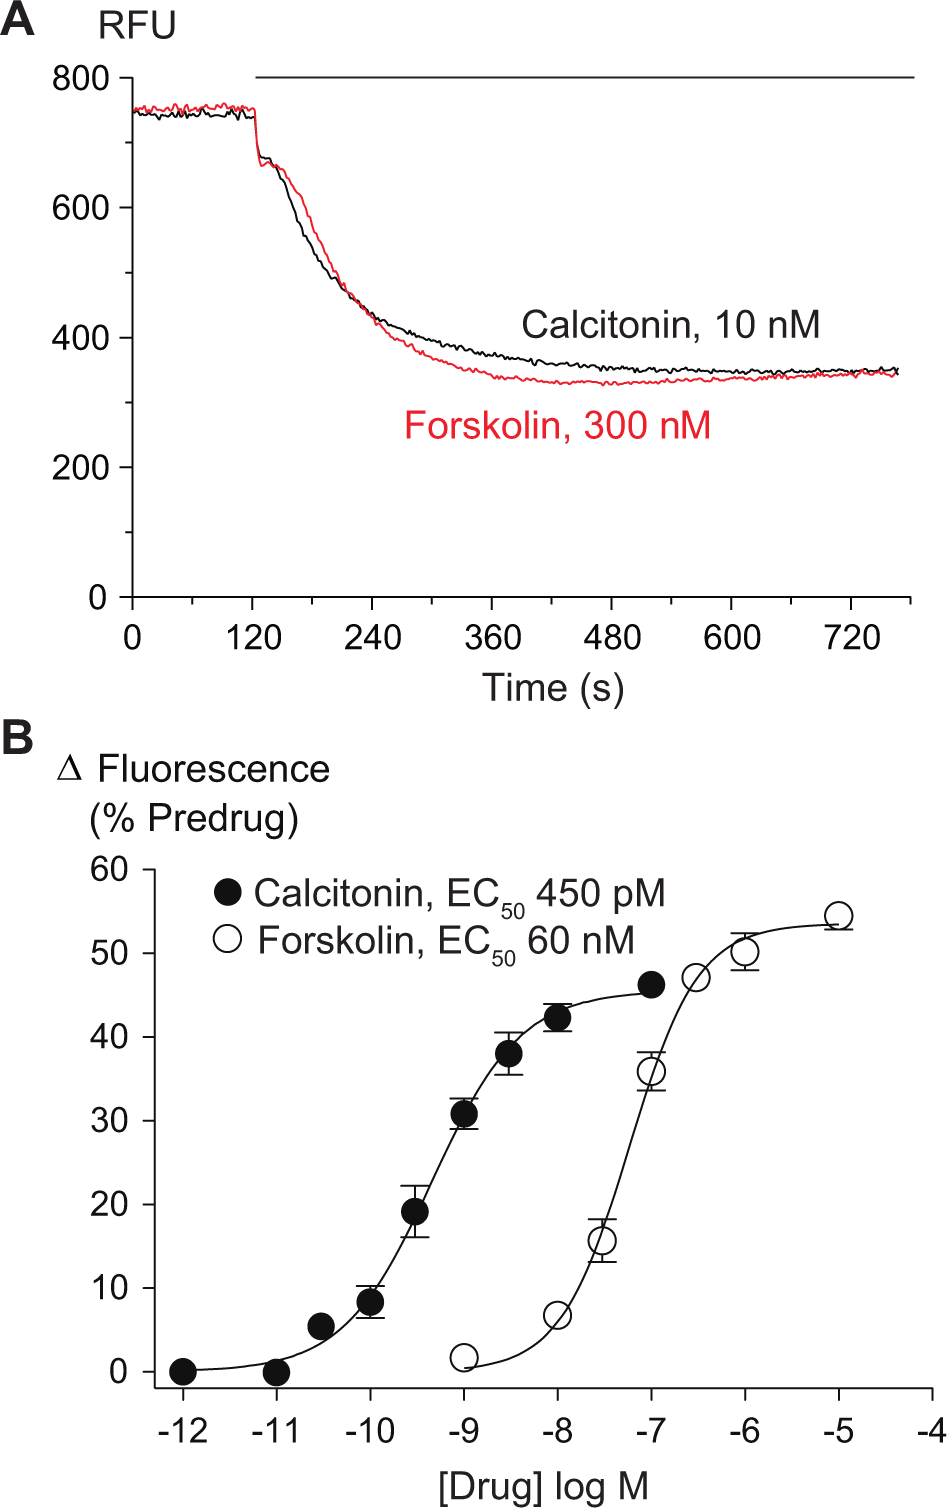
Stimulating adenylyl cyclase hyperpolarizes Chinese hamster ovary (CHO) cells. The membrane potential of CHO cells was determined as outlined in the Materials and Methods. Both calcitonin and forskolin hyperpolarize CHO–µ-opioid receptor (MOR) cells in a concentration-dependent manner. (
Opioid Inhibition of Adenylyl Cyclase
Application of opioids alone did not affect the membrane potential of CHO-MOR cells. However, when the MOR agonist DAMGO was added together with a submaximally effective concentration of FSK (300 nM), DAMGO inhibited FSK-induced membrane hyperpolarization in a concentration-dependent manner, consistent with inhibition of cAMP generation ( Fig. 2A ). This response was blocked by naloxone (1 µM) ( Fig. 2A ). We measured the effects of opioids on the FSK-induced hyperpolarization 5 min after coapplication of the drugs. DAMGO inhibited the FSK-induced hyperpolarization with a pEC50 of 7.4 ± 0.1 with a maximum inhibition of 56% ± 3%. Maximum DAMGO inhibition of FSK-induced hyperpolarization was reduced to 40% ± 2% (p < 0.02) when measured 10 min after FSK addition, while the potency was unchanged. Pretreatment of cells overnight with pertussis toxin (200 ng/mL) significantly reduced the inhibition of the FSK response by DAMGO (1 µM); inhibition was 81% ± 12% in control and 11% ± 0.5% after PTX treatment (p < 0.01; n = 3). The change in fluorescence produced by FSK was unaffected by PTX treatment (46% ± 2% in control and 45% ± 5% after PTX; p = 0.73). FSK-induced hyperpolarization was observed in CHO-MOR cells where MOR expression had not been induced by tetracycline, but the hyperpolarization was not inhibited by opioids (data not shown). DAMGO (1 µM) also reduced membrane hyperpolarization produced by 10 nM calcitonin from 40% ± 1.6% to 23% ± 1.2% (p < 0.01).
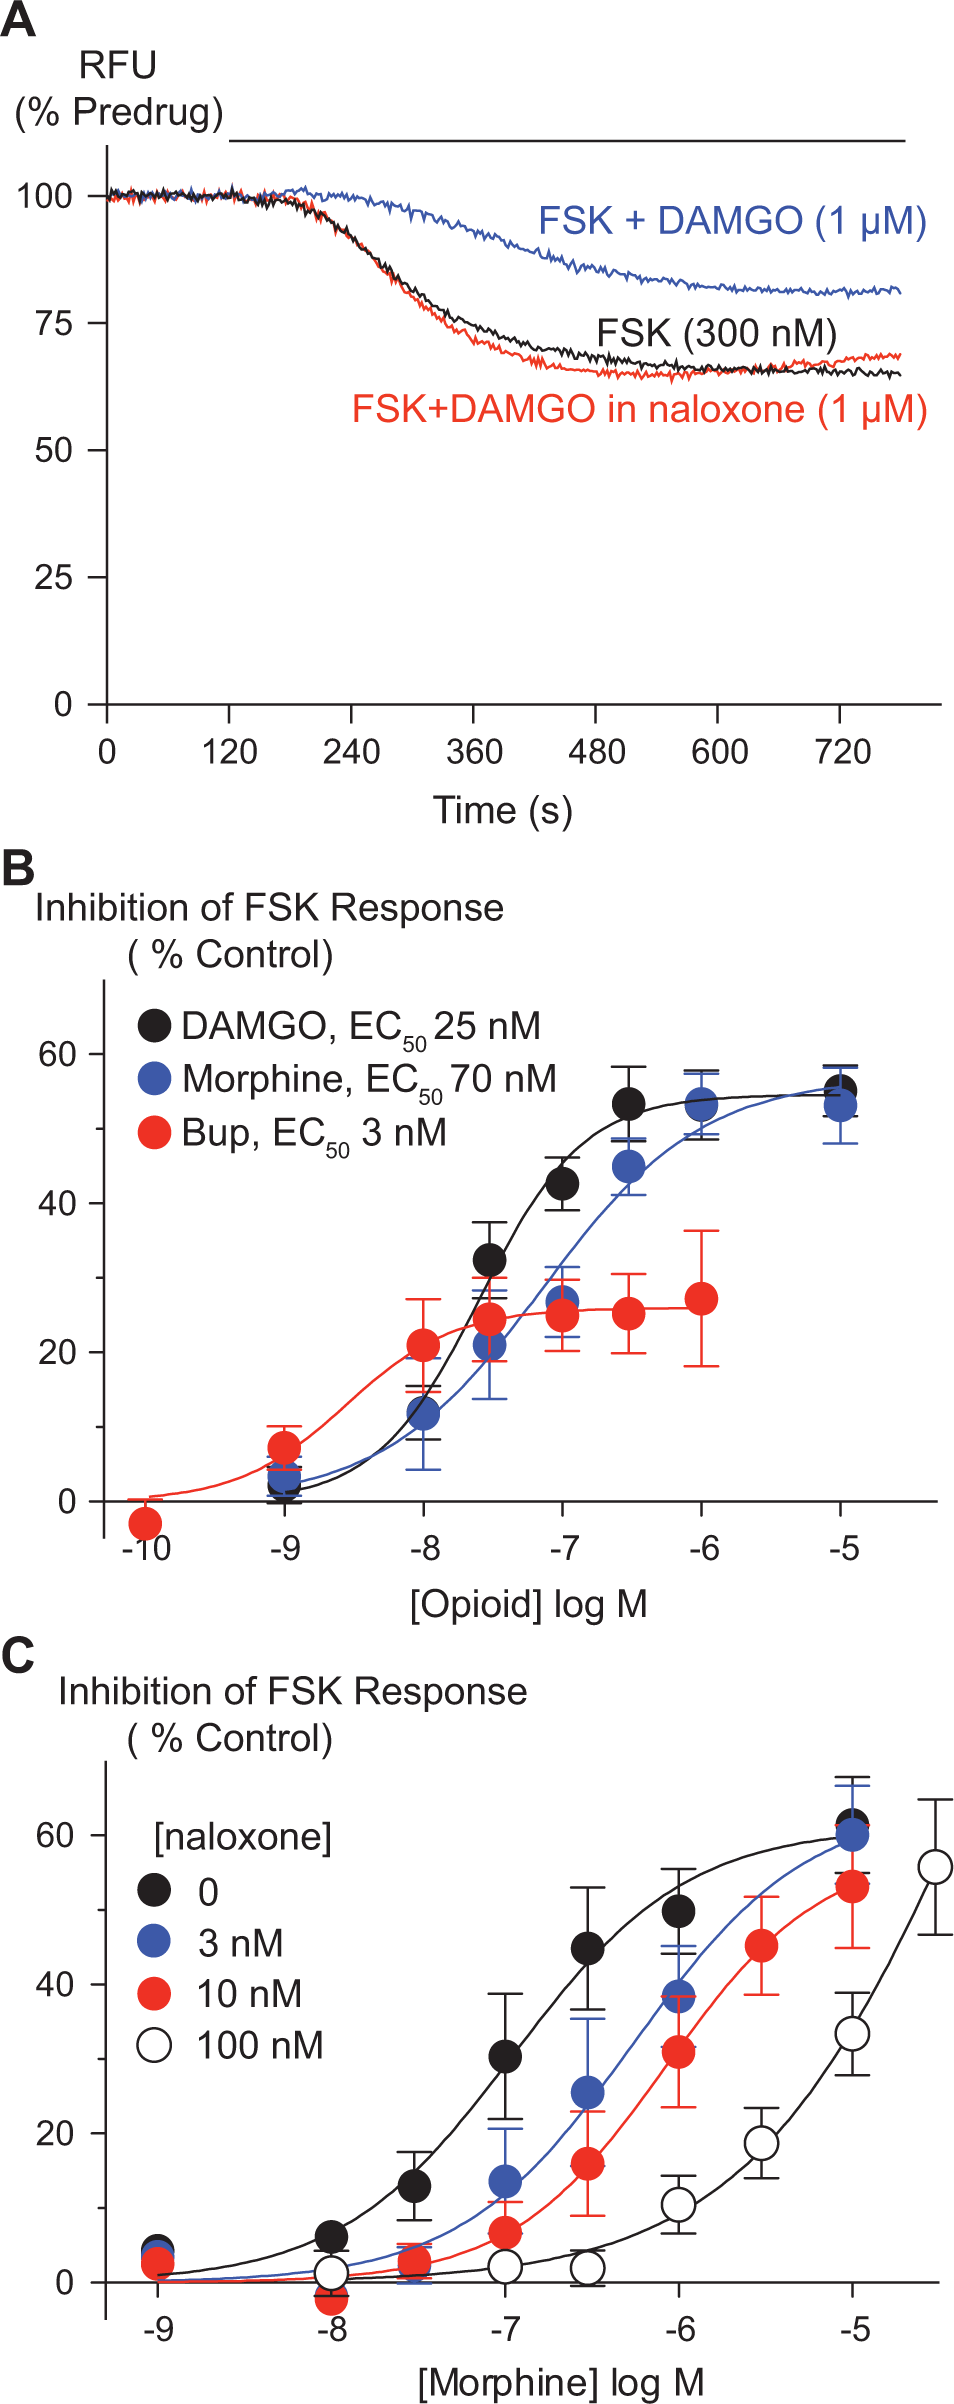
Opioids inhibit forskolin-stimulated membrane hyperpolarization in Chinese hamster ovary (CHO) cells. The membrane potential of CHO–µ-opioid receptor (MOR) cells was determined as outlined in the Materials and Methods. (
We assessed the capacity of this assay to reliably detect agonists of differing efficacy by examining the effects of morphine and buprenorphine ( Fig. 2B ). Morphine and buprenorphine have previously been shown to have partial agonist activity at MOR.17,18 Both agonists inhibited FSK-stimulated AC activation. Morphine had a similar efficacy as DAMGO, with an Emax of 61% ± 7% and pEC50 of 7.0 ± 0.2. Buprenorphine showed lower efficacy, with an Emax of 24% ± 4% and pEC50 of 8.6 ± 0.5. Addition of increasing concentrations of naloxone produced a parallel shift in the concentration-response curve for morphine, with a pA2 of −8.5 ± 0.1 (2.9 ± 0.5 nM; n = 3), a value consistent with the reported binding affinity of naloxone at human MOR (3 nM) 19 ( Fig. 2C ).
Mechanism of FSK-Induced Hyperpolarization of CHO-MOR Cells
We sought to determine the mechanism by which AC activation caused membrane hyperpolarization in CHO-MOR cells. The increase in cAMP resulting from AC activation can lead to activation of PKA, EPAC, or cAMP-gated ion channels.6,7,20 The membrane permeable cAMP analogue Sp-8-CPT-cAMPs (100 µM), a direct activator of PKA, mimicked the FSK response, producing a 44% ± 4% decrease in fluorescence (n = 5; Fig. 3A ). Rp-8-CPT-cAMPs, a cAMP analogue that inhibits activation of PKA, did not produce a change in membrane fluorescence. The hyperpolarization produced by Sp-8-CPT-cAMPs was not affected by DAMGO ( Fig. 3B ), consistent with Sp-8-CPT-cAMPs producing its effects downstream of AC, potentially by acting directly on PKA. However, moderate concentrations of PKA inhibitors H89 (100 nM to 1 µM), KT5270 (100 nM to 1 µM), and staurosporine (1 µM) did not affect the hyperpolarization produced by forskolin, and at higher concentrations (10 µM and above), the protein kinase inhibitors produced substantial hyperpolarizations by themselves. The cAMP analogue 8-CPT-2Me-cAMP (100 µM), which selectively activates EPAC and not PKA, did not significantly affect cellular fluorescence (n = 4; Fig. 3C ; p > 0.5). The AC-inactive FSK analogue 1,9-dideoxyforskolin (1 µM) did not produce a change in fluorescence (n = 5; Fig. 3C ; p > 0.1).
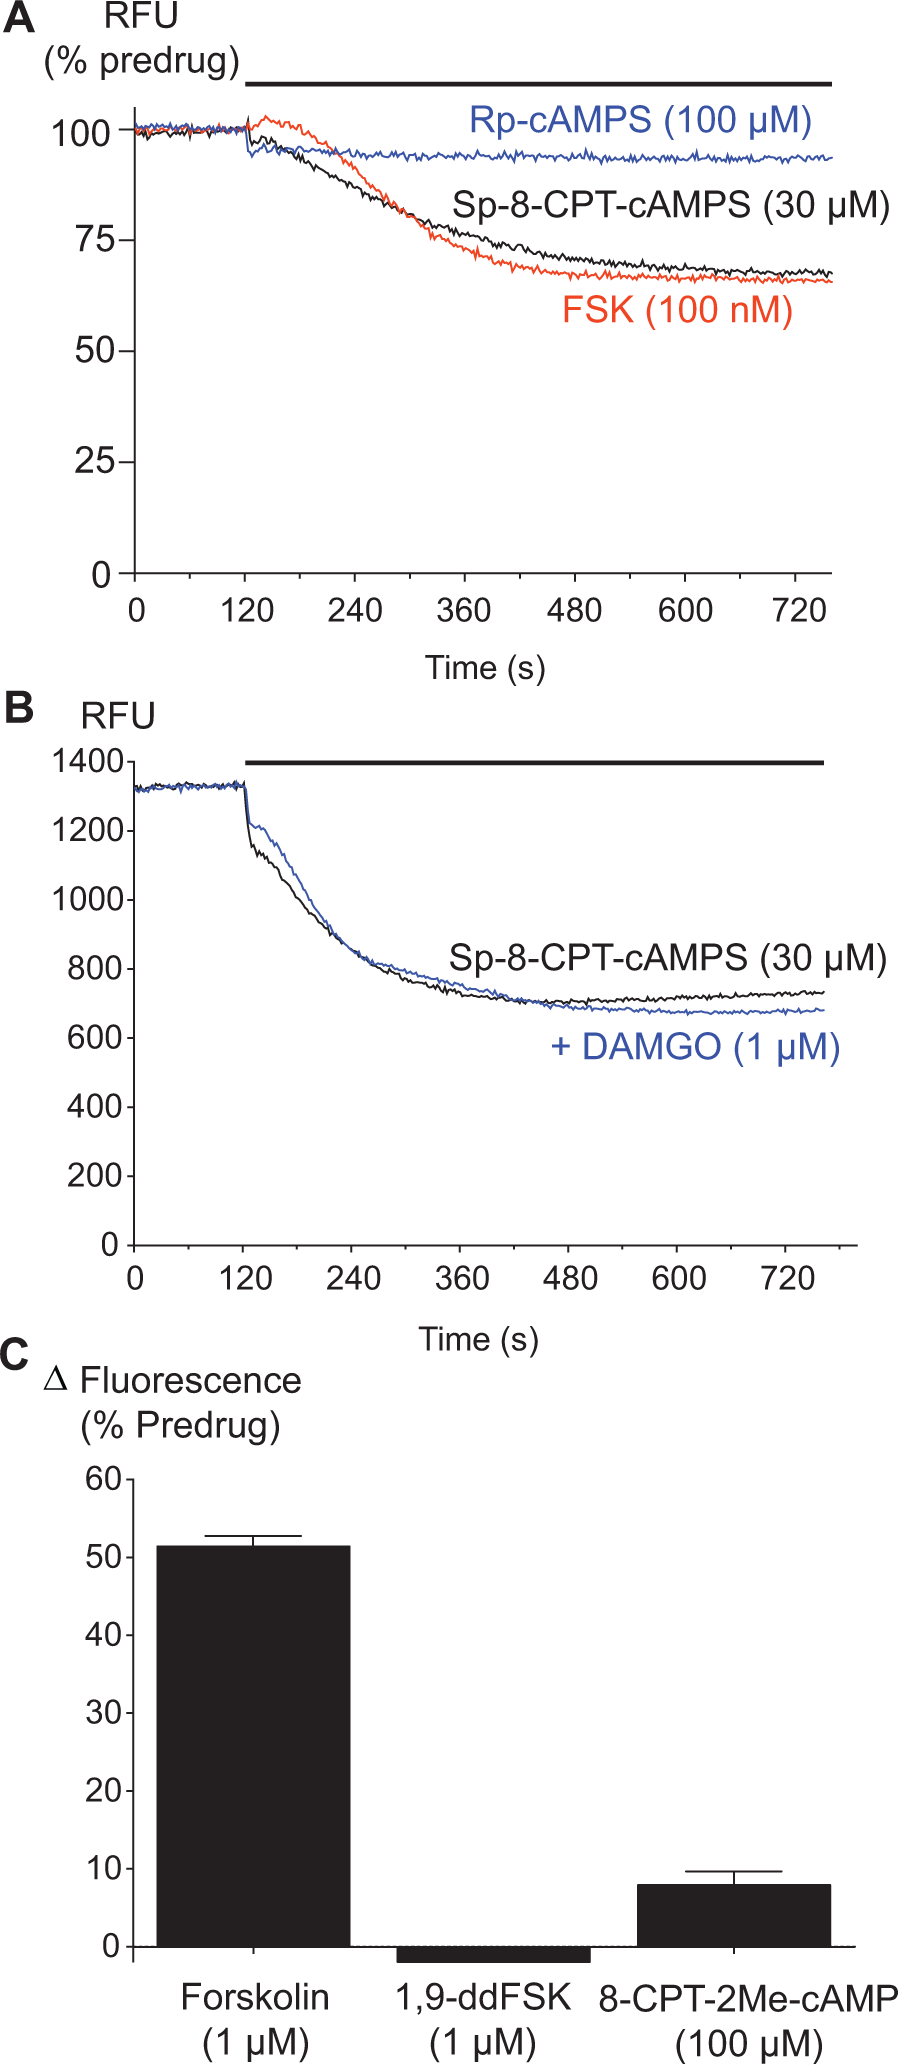
Protein kinase A activators mimic the effects of forskolin (FSK). The membrane potential of Chinese hamster ovary (CHO)–µ-opioid receptor (MOR) cells was determined as outlined in the Materials and Methods. (
Membrane hyperpolarization usually occurs by efflux of K ions from cells. The nonspecific K channel blockers tetraethyl ammonium chloride (TEA, up to 10 mM) or 4-aminopyridine (4-AP, up to 1 mM) did not inhibit the FSK-induced hyperpolarization ( Fig. 4B ). In addition, the hyperpolarization produced by FSK was not affected by the more selective KATP channel blocker glibenclamide (10 µM), the renal outer medullary potassium channel (Kir 1.1) blocker VU-591 (10 µM), or charybdotoxin (10 µM), a blocker of high-conductance Ca-activated K channels (KCa 1.1). To determine if FSK-induced membrane hyperpolarization was due to K efflux, the extracellular K concentration ([K]Ex) was increased to 30 mM and 75 mM to make the reversal potential (Ke) for K less negative. This will reduce K efflux and associated membrane potential changes when K channels are opened. [K]Ex was adjusted by dissolving the membrane potential dye in Hank’s balanced salt solution (HBSS), where NaCl was substituted by KCl. The effects of a maximally effective concentration of FSK (10 µM) were reduced by about 50% in 30 mM [K]Ex and almost completely when [K]Ex was 75 mM ( Fig. 4A ), suggesting FSK-induced membrane hyperpolarization is mediated by efflux of K from cells. The hyperpolarizations produced by 100 nM, 1 µM, and 10 µM FSK in the three concentrations of [K]Ex were analyzed by two-way analysis of variance (ANOVA) and found a main effect of FSK (p < 0.003) and [K]Ex (p < 0.0001). Subsequent analysis of the effect of [K]Ex on each concentration of FSK using Tukey’s multiple-comparison test indicated that the hyperpolarization produced by each concentration of FSK differed for each concentration of [K]Ex (p < 0.05 for each). The changes in fluorescence produced by altering the membrane K permeability were independently assessed by incubating CHO-MOR cells with nigericin, a potassium-selective antibiotic ionophore. 21 A maximally effective concentration of nigericin (1 µM) produced a decrease in fluorescence signal of 70% ± 3%, which was not decreased any further upon the addition of 10 µM FSK ( Fig. 4C ). The fluorescent signal observed after nigericin incubation may reflect the signal when the membrane potential of the cells is driven to EK. 21
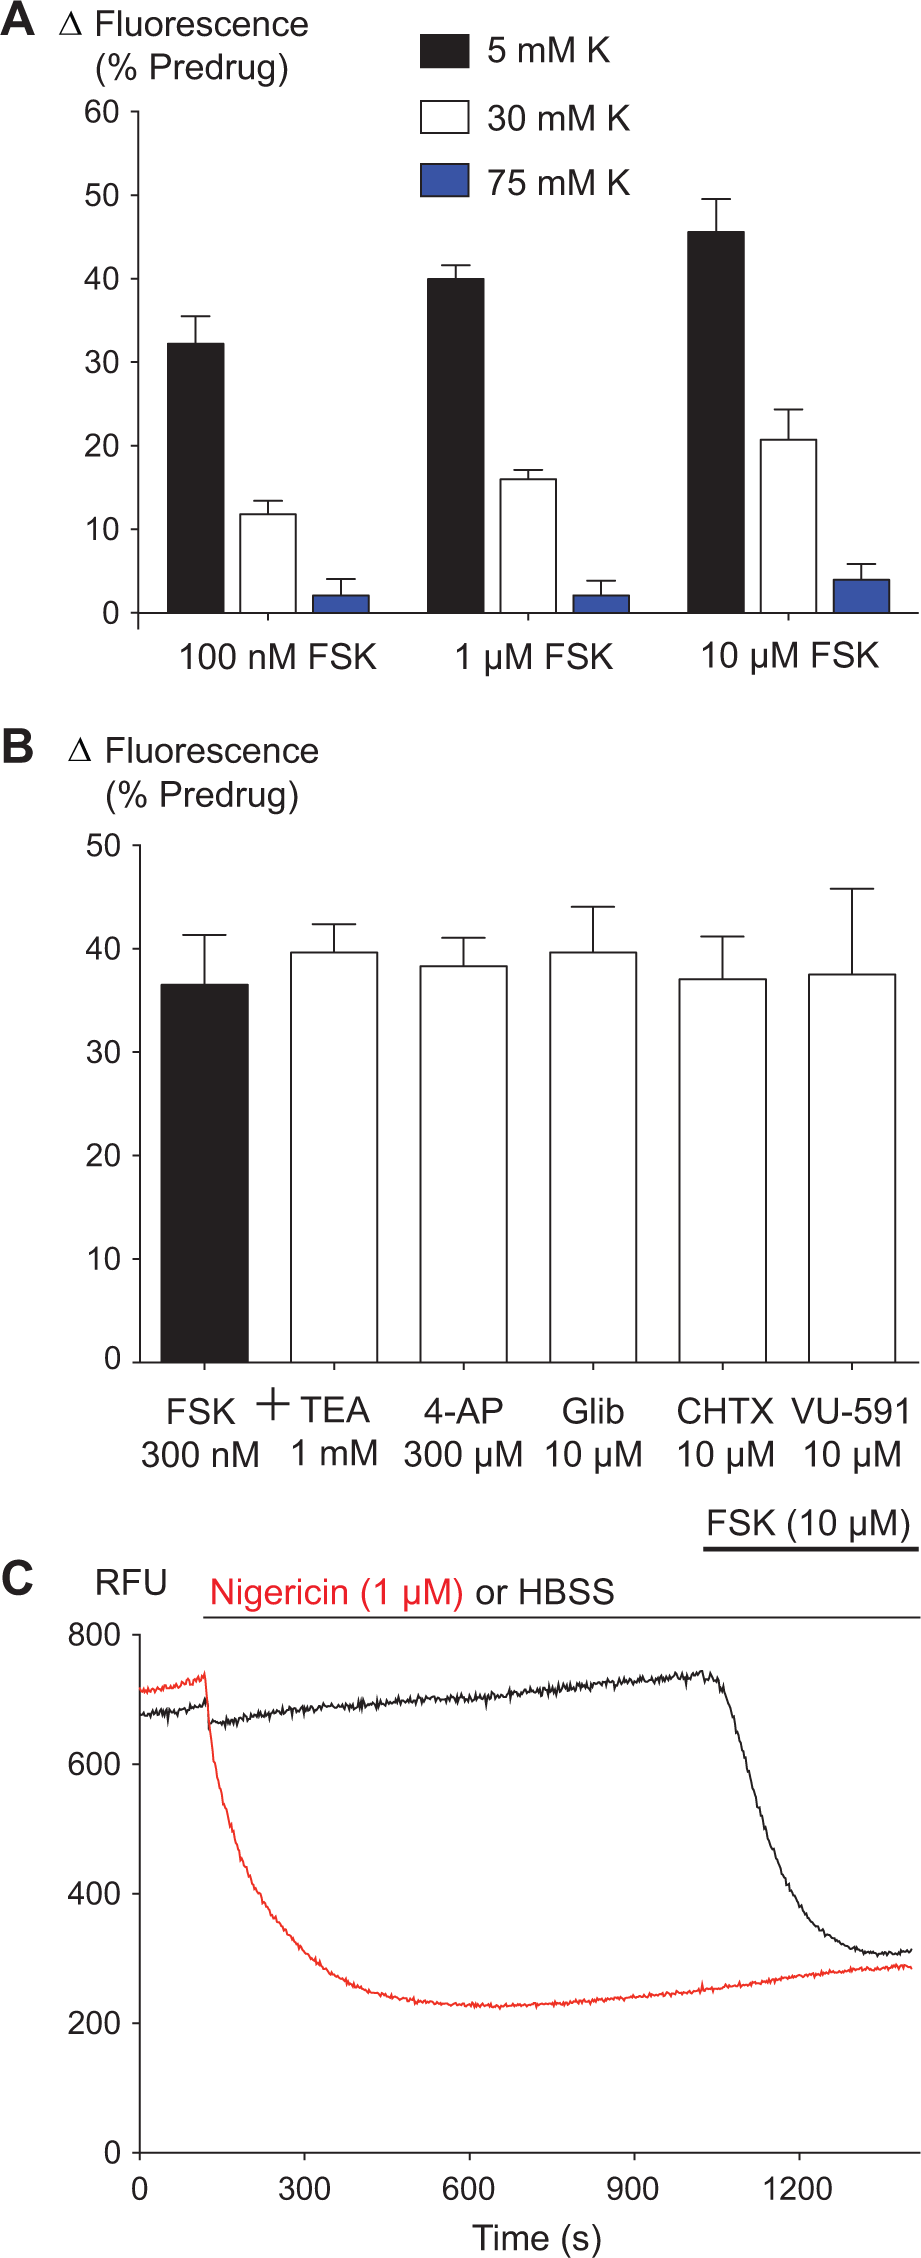
The forskolin (FSK)–induced hyperpolarization is dependent on extracellular K concentration. The membrane potential of Chinese hamster ovary (CHO)–µ-opioid receptor (MOR) was determined as outlined in the Materials and Methods. (
We assessed the suitability of this assay for HTS by calculating the Z′ factor, a measure of the assay robustness. An assay with a Z′ factor between 0.5 and 1 is an appropriate assay in terms of signal-to-noise ratio and data reproducibility. 15 The Z′ factor for this assay was calculated for both the 300-nM FSK response and for inhibition of the FSK response with 3 µM DAMGO in multiple experiments. The Z′ values were 0.7, 0.7, and 0.8 for FSK alone and 0.7, 0.7, and 0.7 for FSK + DAMGO, indicating that the assay is suitable for HTS.
Discussion
In this study, we have developed a real-time, no-wash, fluorescence-based assay for MOR-mediated inhibition of AC in intact CHO-K1 cells. We used a proprietary membrane potential–sensitive dye from Molecular Devices to measure membrane hyperpolarization following FSK-stimulated AC activation. 22 Activation of endogenous calcitonin receptors in CHO-K1 cells 16 produced a reduction in fluorescence similar to that seen following FSK application, and in both cases, this reduction was less than that produced by application of the K-selective ionophore nigericin. 21 The fluorescent signal rapidly and reliably decreased after FSK application, and this decrease in signal was inhibited by the simultaneous application of opioid agonists.
CHO cells are frequently used in assays of opioid inhibition of AC activity. The elevation of cAMP in CHO cells following FSK application, as well as the ability of opioids to inhibit this elevation of cAMP, is well documented.16,23,24 In this assay, opioid inhibition of FSK-stimulated membrane hyperpolarization is consistent with opioid inhibition of AC, one of the hallmarks of MOR activation. 3 CHO cells have been shown to express AC subtypes VI and VII. 25 Opioid modulation of AC activity is isozyme specific, with acute opioid treatment shown to inhibit Gs-stimulated AC-VI activity and potentiating Gs-stimulated AC-VII. 26 Because AC-VII has been reported to be insensitive to FSK, 27 we chose to use FSK rather than calcitonin as the AC-stimulating agent, as this should avoid the confounding effects of opposite MOR modulation of the Gs-mediated stimulation of AC-VI and AC-VII.
Morphine and buprenorphine are lower efficacy agonists at MOR,17,18 but the measured efficacy of a compound depends on the assay being used. In the present assay, morphine acted as a full agonist, with an Emax similar to that of DAMGO. This likely reflects the relatively low receptor occupancy required for AC inhibition, particularly as we were stimulating AC with a submaximally effective concentration of forskolin. Many previous studies have reported morphine to be a full agonist in assays of AC inhibition.4,28
The measurement of MOR inhibition of AC is often performed using end-point assay techniques with lengthy inhibition times. As shown in our assay, some sensitivity would be lost using this approach. Inhibition of the FSK-stimulated membrane hyperpolarization peaked at approximately 5 min after the addition of FSK and opioid. After this time, the fluorescent signal gradually decreased further. A single time point measurement of cAMP accumulation after 10 min in our assay shows a reduction in the efficacy of DAMGO in AC inhibition, with Emax decreased from 56% to 40%, possibly reflecting receptor desensitization. While we chose to measure at a time point when the FSK-induced hyperpolarization signal had plateaued, it would be a simple matter to measure at any time point after addition of the drugs, enabling the virtually instantaneous measurement of cell responses after the addition of FSK and/or opioid. Depending on the agonist employed, MOR rapidly desensitizes and/or internalizes, with up to 50% of MOR internalized within 5 min of agonist exposure in some cells.11,12,20 AC assays using a single time point measurement of cAMP accumulation after incubation times of up to 20 min are measuring the summed output of signaling from activated, desensitized, and internalized MOR and thus give little insight into the real-time dynamics of the effects of MOR activation on cAMP-mediated signaling.
The measurement of real-time AC inhibition has previously only been achievable by the use of complex techniques such as transfection of reporter genes or proteins with cAMP binding domains or bioluminescence resonance energy transfer (BRET) assays.8,27,29–31 These assays can be very useful for studying cAMP signaling, although each has its potential weaknesses as well as strengths. 8 Bioluminescence assays such as the GloSensor (Promega) can provide a continuous reading of cAMP levels, allowing kinetic studies and repeated drug applications. 30 However, this assay requires transfection of a luciferase sensor construct with cAMP binding domains and use of specialized reagents, in addition to any stable transfections of the receptors of interest. For the kind of studies described in this article—inhibition of cAMP accumulation by a Gi/Go-coupled GPCR—the developers of the GloSensor assay recommend a 5- to 10-min preincubation with agonist before the addition of FSK, which is likely to be unsuitable for studies of rapidly desensitizing GPCR such as MOR. 30 The assay described here is simpler than these assays, requiring transfection of the receptor of interest only and addition of a single assay reagent. The drug responses can be observed immediately following agonist addition. The Z′ calculated for this assay were similar to those reported for the GloSensor assay.27,31 However, as the plate reader format means that we are unable to study recovery of AC activity following wash of agonists, the kinetic and stoichiometric relationship between the FSK-induced rise in AC levels and hyperpolarization of the CHO cells is unknown.
Activation of the endogenous Gs-coupled CTR receptors in CHO cells caused membrane hyperpolarization similar to that produced by the AC activator FSK. Membrane hyperpolarization in CHO cells by AC activation has not been shown previously, so we sought to determine the mechanism by which membrane hyperpolarization occurs. Endogenous K channels are not well defined in CHO cells, and CHO cells are frequently used as heterologous expression systems for recombinant K channels due to the apparent low levels of native K channel activity. 32 The nonspecific K channel inhibitors TEA and 4-AP did not inhibit FSK-induced membrane hyperpolarization, nor did the more specific K channel inhibitors glibenclamide, VU-591, or charybdotoxin. However, when the reversal potential for K was made less negative by increasing [K]Ex, membrane hyperpolarization was reduced, and hyperpolarization was essentially abolished when [K]Ex was increased to 75 mM. Furthermore, the FSK-induced membrane hyperpolarization was mimicked and occluded by the addition of the K-selective ionophore nigericin. This suggests that FSK-induced membrane hyperpolarization is due to the movement of K ions through native K channels in CHO cells.
Membrane hyperpolarization resulting from application of FSK and calcitonin is due to the activation of AC.16,22 The resulting elevation of cAMP levels in the cell leads to the activation of PKA, as well as EPACs. The cAMP analogue Sp-8-CPT-cAMPs, a direct activator of PKA, mimicked the effects of FSK, while Rp-8-CPT-cAMPs, an inhibitor of cAMP activation of PKA, was inactive. 8-CPT-2Me-cAMP, a selective activator of EPAC, also produced no effect. Together, these data are consistent with the idea that membrane hyperpolarization is occurring via PKA activation. However, we were unable to inhibit the effects of FSK with modest concentrations of protein kinase inhibitors, and higher concentrations of these drugs themselves hyperpolarized the CHO cells. Novel cAMP-dependent signal transduction pathways are still being discovered, 33 and it may be that the observed hyperpolarization of CHO cells is mediated by such a mechanism.
Assays of AC inhibition represent one of the most straightforward ways of studying Gα (as opposed to Gβγ) signaling in a high-throughput environment. The assay described here offers a novel approach for measuring MOR-mediated AC inhibition in intact CHO cells and has the advantages of being both real time and reflecting the naturalistic coupling of MOR to the signaling pathway. The lack of a defined mechanism for the hyperpolarization does not detract from the utility of the assay for acute studies, but the assay may not be suitable for studies of more complex signaling cascades such as those potentially underlying agonist-induced receptor regulation. Nevertheless, our results show the membrane potential assay to be a rapid, reliable, and inexpensive method for assessing opioid activation of MOR in CHO cells and may be scaled up to enable HTS. Coupled with our recent description of an HTS-appropriate membrane potential assay of Gβγ signaling in AtT-20 cells, 34 it is clear that multiple aspects of GPCR signaling can be studied in a relatively simple, noninvasive, and efficient manner using simple reagents that report changes in basic cellular properties such as membrane potential.
Footnotes
Declaration of Conflicting Interests
The authors declared no potential conflicts of interest with respect to the research, authorship, and/or publication of this article.
Funding
The authors disclosed receipt of the following financial support for the research, authorship, and/or publication of this article: This work was supported by NHMRC grant 1011979 to MC. AK was supported by a MQRes Postgraduate Scholarship from Macquarie University.