
Abstract
The NaV1.7 voltage-gated sodium channel is a highly valued target for the treatment of neuropathic pain due to its expression in pain-sensing neurons and human genetic mutations in the gene encoding NaV1.7, resulting in either loss-of-function (e.g., congenital analgesia) or gain-of-function (e.g., paroxysmal extreme pain disorder) pain phenotypes. We exploited existing technologies in a novel manner to identify selective antagonists of NaV1.7. A full-deck high-throughput screen was developed for both NaV1.7 and cardiac NaV1.5 channels using a cell-based membrane potential dye FLIPR assay. In assay development, known local anesthetic site inhibitors produced a decrease in maximal response; however, a subset of compounds exhibited a concentration-dependent delay in the onset of the response with little change in the peak of the response at any concentration. Therefore, two methods of analysis were employed for the screen: one to measure peak response and another to measure area under the curve, which would capture the delay-to-onset phenotype. Although a number of compounds were identified by a selective reduction in peak response in NaV1.7 relative to 1.5, the AUC measurement and a subsequent refinement of this measurement were able to differentiate compounds with NaV1.7 pharmacological selectivity over NaV1.5 as confirmed in electrophysiology.
Introduction
The voltage-gated sodium channel NaV1.7, encoded by the SCN9A gene, is an attractive target for treatment of neuropathic pain based on strong human genetic data linking mutations in SCN9A to pain sensory pathologies. 1 Both loss-of-function 2 and gain-of-function3,4 mutations and alleles 5 in the SCN9A coding sequence have been reported. A number of small-molecule antagonists 6 as well as at least one report of a functional inhibitory antibody 7 to NaV1.7 have been under investigation as therapeutics for neuropathic pain.
Although a variety of in vitro methods are employed to interrogate compound effects on ion channels in general, voltage-gated sodium channels have presented particular challenges to these screening approaches. The patch-clamp technique remains the gold-standard method for studying compound effects on ion channels, and significant advances in higher throughput automated electrophysiology platforms have been made.8–10 However, due to large compound libraries and significant costs associated with automated electrophysiology platforms, high-throughput screening (HTS) of ion channel targets often relies on dyes that detect ion flux or changes in membrane potential. 11 Voltage-gated sodium channels are no exception. In many of these cases, where voltage cannot be used to activate the channels,12,13 small-molecule activators such as veratridine or deltamethrin are used to increase the open probability of the channel to evoke a significant response that can be detected.14–16 Two membrane potential dyes are widely used for HTS: the FLIPR Membrane Potential dye (Molecular Devices, Sunnyvale, CA) that uses a fluorescence indicator in combination with a quencher and voltage sensor probes (VSPs) that rely on fluorescence-resonance energy transfer (FRET) between a voltage-sensing oxonol acceptor and a fluorescent membrane-bound coumarin dye. 17 In the current study, we compared the performance of these membrane potential dyes, along with a sodium-sensing dye, in assay development and found that these dye systems could only detect certain subsets of NaV1.7 inhibitors using standard data analysis methods. In this article, we describe alternate approaches to analyzing these data to identify compounds with NaV1.7 selective activity.
Materials and Methods
FLIPR Membrane Potential Dye Assay
Human embryonic kidney (HEK) cells stably expressing NaV1.7 (PN1) α subunit or NaV1.5 (hH1a) α subunit were thawed from frozen stock vials, resuspended in growth media (1× MEM with GlutaMax, penicillin-streptomycin at 10 mL/L, G418 [50 mg/mL] at 10 mL/L, nonessential amino acids [all from Life Technologies, Grand Island, NY] and 10% Defined FBS [SH30070.02; HyClone, Logan, UT]) 1 × 10⁶ cells/mL, and plated into Aurora 1536-well black side clear-bottom PDL-coated plates (BioMedTech, Tampa, FL) at 4000 cells/well (4 µL/well). Plates were incubated overnight at 37 °C, 5% CO2.
Following 18- to 24-h incubation, plates were washed 2× in assay buffer (containing in mM: 165 NaCl, 4.5 KCl, 2 CaCl2, 1 MgCl2, 10 HEPES, 10 glucose [pH 7.4] with NaOH; Sigma, St. Louis, MO), leaving 2 µL/well. Membrane Potential Blue Dye (MD Blue; Molecular Devices; one bulk vial dissolved in 100 mL assay buffer) was added at 2 µL per well. Test compounds (5 µM with 0.25% DMSO final) were transferred to individual wells using a 10-nL pintool, and the plates were subsequently incubated for 50 min at room temperature. The plates were transferred to a FLIPR Tetra Plus (Molecular Devices) where, following a baseline signal measurement of 10 reads (20 s), the sodium channel opener veratridine (Ezno Life Sciences, Farmingdale, NY) was added at a 60-µM (NaV1.7) or 30-µM (NaV1.5) final concentration. Veratridine concentration was selected to produce an EC70-90 response in each respective cell line.
Measurements were made at a 2-s interval for reads 1 to 40 and at a 6-s interval for reads 41 to 70 (excitation, 510–545 nm; emission 565–625 nm). For the ratio method (ratio = maximum/minimum), minimum was determined between reads 1 and 10, and maximum was determined between reads 11 and 70. For the area under the curve (AUC) method, AUC (each well) = Summation of (response – minimum) * 2 [over 6 to 40 reads] + Summation of (response – minimum) * 6 [over 41 to 70 reads]. Data were normalized to maximal inhibition by 100 µM tetracaine (Spectrum Chemical, New Brunswick, NJ) for both ratio and AUC measurements on a per-plate basis.
For the targeted delay-to-onset analysis, the raw FLIPR traces were processed offline using Excel (Microsoft, Redmond, WA). Each FLIPR trace was divided into four regions: 0 to 10 s, 11 to 30 s, 31 to 50 s, and 51 s to end. Then the maximum and minimum of each region was determined, and the ratio of maximum over minimum was calculated. Control sweeps exhibited a ratio in the second region >1.7, whereas delay-to-onset sweeps exhibited a ratio >1.7 in either the third or fourth region while having <1.2 in the second region.
Experiments using the Asante NaTRIUM Green (ANG-2; TefLabs, Austin, TX) sodium dye were performed as above except using different excitation light-emitting diodes (470–495 nm) and emission filters (515–575 nm). The ANG-2 dye was prepared in DMSO at 4 mM and then mixed 1:1 with Pluronic F127 (20% solution in DMSO; Invitrogen, Molecular Probes, Eugene, OR) before adding to the assay buffer at 10 µM (5 µM final during dye incubation).
Voltage Sensor Probe dye system (VSP; Life Technologies, Carlsbad, CA) CC2 was prepared by mixing 100 µL of 5 mM CC2 and 50 µL of 20% pluronic in water, with sonication and vortex. The mixture was added to Dulbecco’s Phosphate Buffered Saline (DPBS) with 10 mM HEPES, 10 mM glucose and 1 N NaOH (pH 7.4) to a concentration of 9 µM. Cells were washed 2× with DPBS (leaving 2 µL/well at end of wash), and then 6 µL of 9 µM CC2 in buffer was added to each well. Cells were incubated with CC2 for 40 to 45 min at room temperature in the dark. DiSBAC2(3) was prepared by diluting from a 15-mM stock in 100% DMSO to 5 or 10 µM into assay buffer containing 165 mM NaCl, 4.5 mM KCl, 2 mM CaCl2, 1 mM MgCl2, 10 mM HEPES, and 10 mM glucose (pH 7.4). Cells were washed 3× with assay buffer, leaving 2µL/well buffer. Then, 7 µL of 5 µM DiSBAC2(3) in assay buffer was added to each well. Compounds were pintooled into the plate using a 10-nL head and incubated 27 min at room temperature (RT) in dark. On the FLIPR, wells were sampled at 0.5 Hz (excitation 390–420 nm, emission monitored at 440–480 nm [CC2] and 565–625 nm [FRET with DiSBAC2(3)]). Following a 20-s baseline read, veratridine (prepared at 220 µM) was added to each well (3µL) at a final concentration of 60 µM and read for an additional 200 s.
Electrophysiology Assays
Ion Works Quattro (PPC mode, Molecular Devices)
NaV1.7 cells (as above) were harvested from T175 flasks with trypsin, washed, and resuspended in External Buffer (containing in mM: 150 NaCl, 2.5 KCl, 2 CaCl2, 1 MgCl2, 5 HEPES, 10 dextrose, pH 7.4 with NaOH, ~330 mOsm). Amphotericin was prepared at 160 µg/mL in Internal Buffer (in mM: 120 CsF, 30 CsCl, 10 EGTA, 5 HEPES, 5 NaF, 2 MgCl2, pH 7.4 with CsOH, ~330 mOsm). Compounds were tested at a 10-µM final concentration (0.46% DMSO) with a 5-min incubation. A double-pulse protocol was used in which cells were held at −90 mV and stepped to −10 mV for 1 s, to −100 mV for 20 ms, and back to −10 mV for 10 ms. Pulse 2 was monitored for compound efficacy. Ten-point dose-titration percent inhibition data were fit with a four-parameter, variable-slope logistic equation to determine IC50:

For each plate, data were normalized to top (100 µM tetracaine) and bottom (DMSO) control wells.
PatchXpress7000
The temperature of the PatchXpress instrument (Molecular Devices) was maintained at 22 °C. The following recording solutions were used. Internal solution (mM): 30 CsCl, 5 HEPES, 10 EGTA, 120 CsF, 5 NaF, 2 MgCl2, pH 7.3 with CsOH, 324 mOsmo. External solution (mM): 120 NMDG, 40 NaCl, 1 KCl, 0.5 MgCl2, 5 HEPES, 2.7 CaCl2, pH 7.5 with NMDG-OH. The PatchXpress voltage protocol was modified from the voltage protocol published by Castle et al. 18 so that one inactivation curve measurement is used for testing one drug concentration. After determination of V0.5 inact., the scripting of PatchXpress software used the V0.5 inact. as a reference point to set the voltage protocol to have a fixed amount of the NaV1.7 channel in the inactivated state. A double-pulse protocol was used to measure the inactivated state block. Cells were held at a potential 20 mV negative to V0.5 inact . An 8000-ms prepulse 7 mV positive to V0.5 inact was given followed by a hyperpolarizing 2-ms pulse to −120 mV and a 20-ms test pulse to −20 mV. The protocol was applied to cells in the control, after 5 min of drug incubation and after 5 min of washout. The peak current amplitude of NaV1.7 was measured at the second pulse at −20 mV with a sampling rate of 5 kHz. During analysis, DataXpress software used the peak current of NaV1.7 measured after a 5-min wash to correct the amount of current rundown. The percent inhibition of NaV1.7 current was calculated by 100*(control – drug)/control. Origin software was used to generate the IC50 by fitting averaged percent inhibition with the Logistic function:

For determination of kinetic parameters, rise (10% of peak to peak) and decay (peak to 9 ms of test pulse) phases of the evoked currents were fit to a single exponential equation:

where I is the current amplitude, A is the peak current, t is time, C is the current (at 9 ms), and t
Statistical analyses were performed in Prism v6.04 (GraphPad Software, La Jolla, CA).
Results and Discussion
As described in past screens for NaV1.7 inhibitors,14,16 assay development for the current screening effort focused on the MD Blue and VSP membrane potential dyes using veratridine to activate NaV1.7 voltage-gated sodium channels. A set of compounds was profiled with both dyes, including use-dependent inhibitors exemplified by tetracaine and compound 1,
19
as well as a newer series of compounds exemplified by compound 220,21 and compound 3
21
(
Fig. 1
). Two striking differences were observed in testing the effect of NaV1.7 inhibitors on veratridine-evoked responses detected with these dyes. First, the MD Blue dye revealed a concentration-dependent delay in the onset of the response by compounds 2 and 3, whereas the expected decrease in peak amplitude was observed with tetracaine and compound 1 (
Fig. 2A
). Second, the veratridine-evoked response by tetracaine and compound 1 was detected with the VSP dye, but no change in the dye ratio was detected for compound 2 or 3 (
Fig. 2B
and
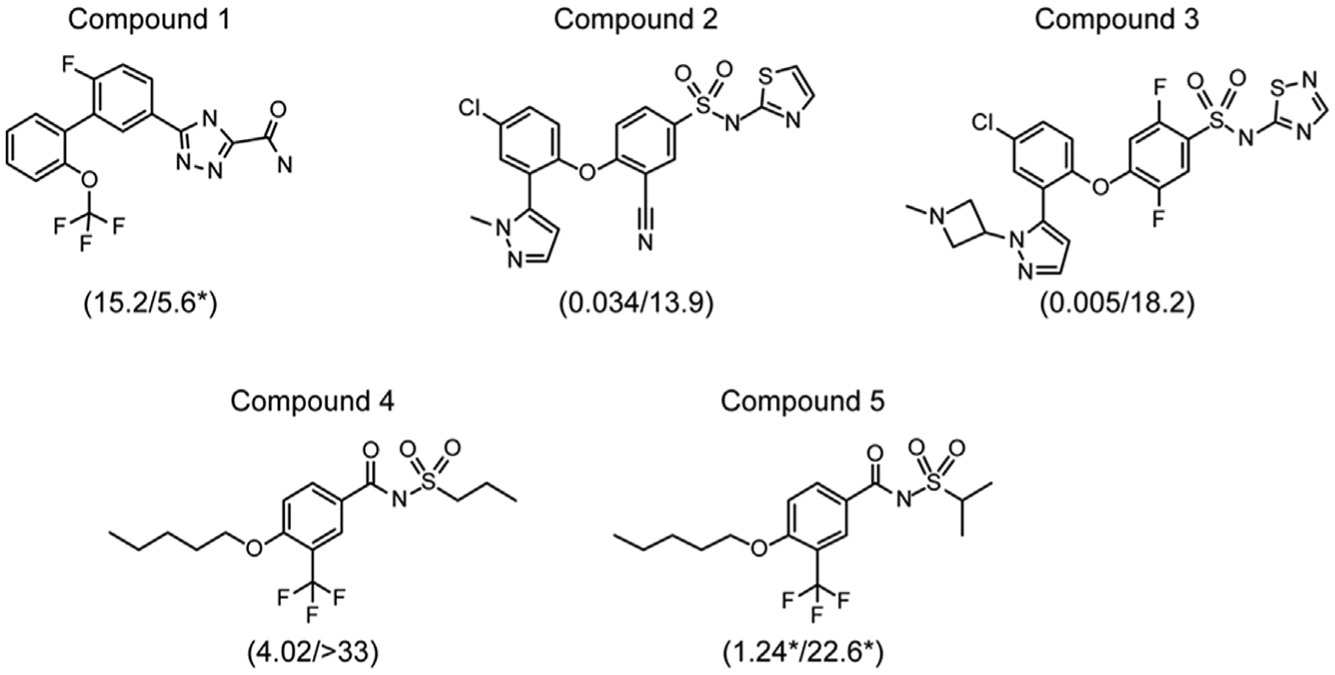
Structures of compounds 1 to 5. Values in parentheses are IC50s for NaV1.7 and NaV1.5, respectively, indicated in µM. All IC50 values were determined from 10-point concentration-response curves on the Ion Works Quattro or PatchXpress(*).
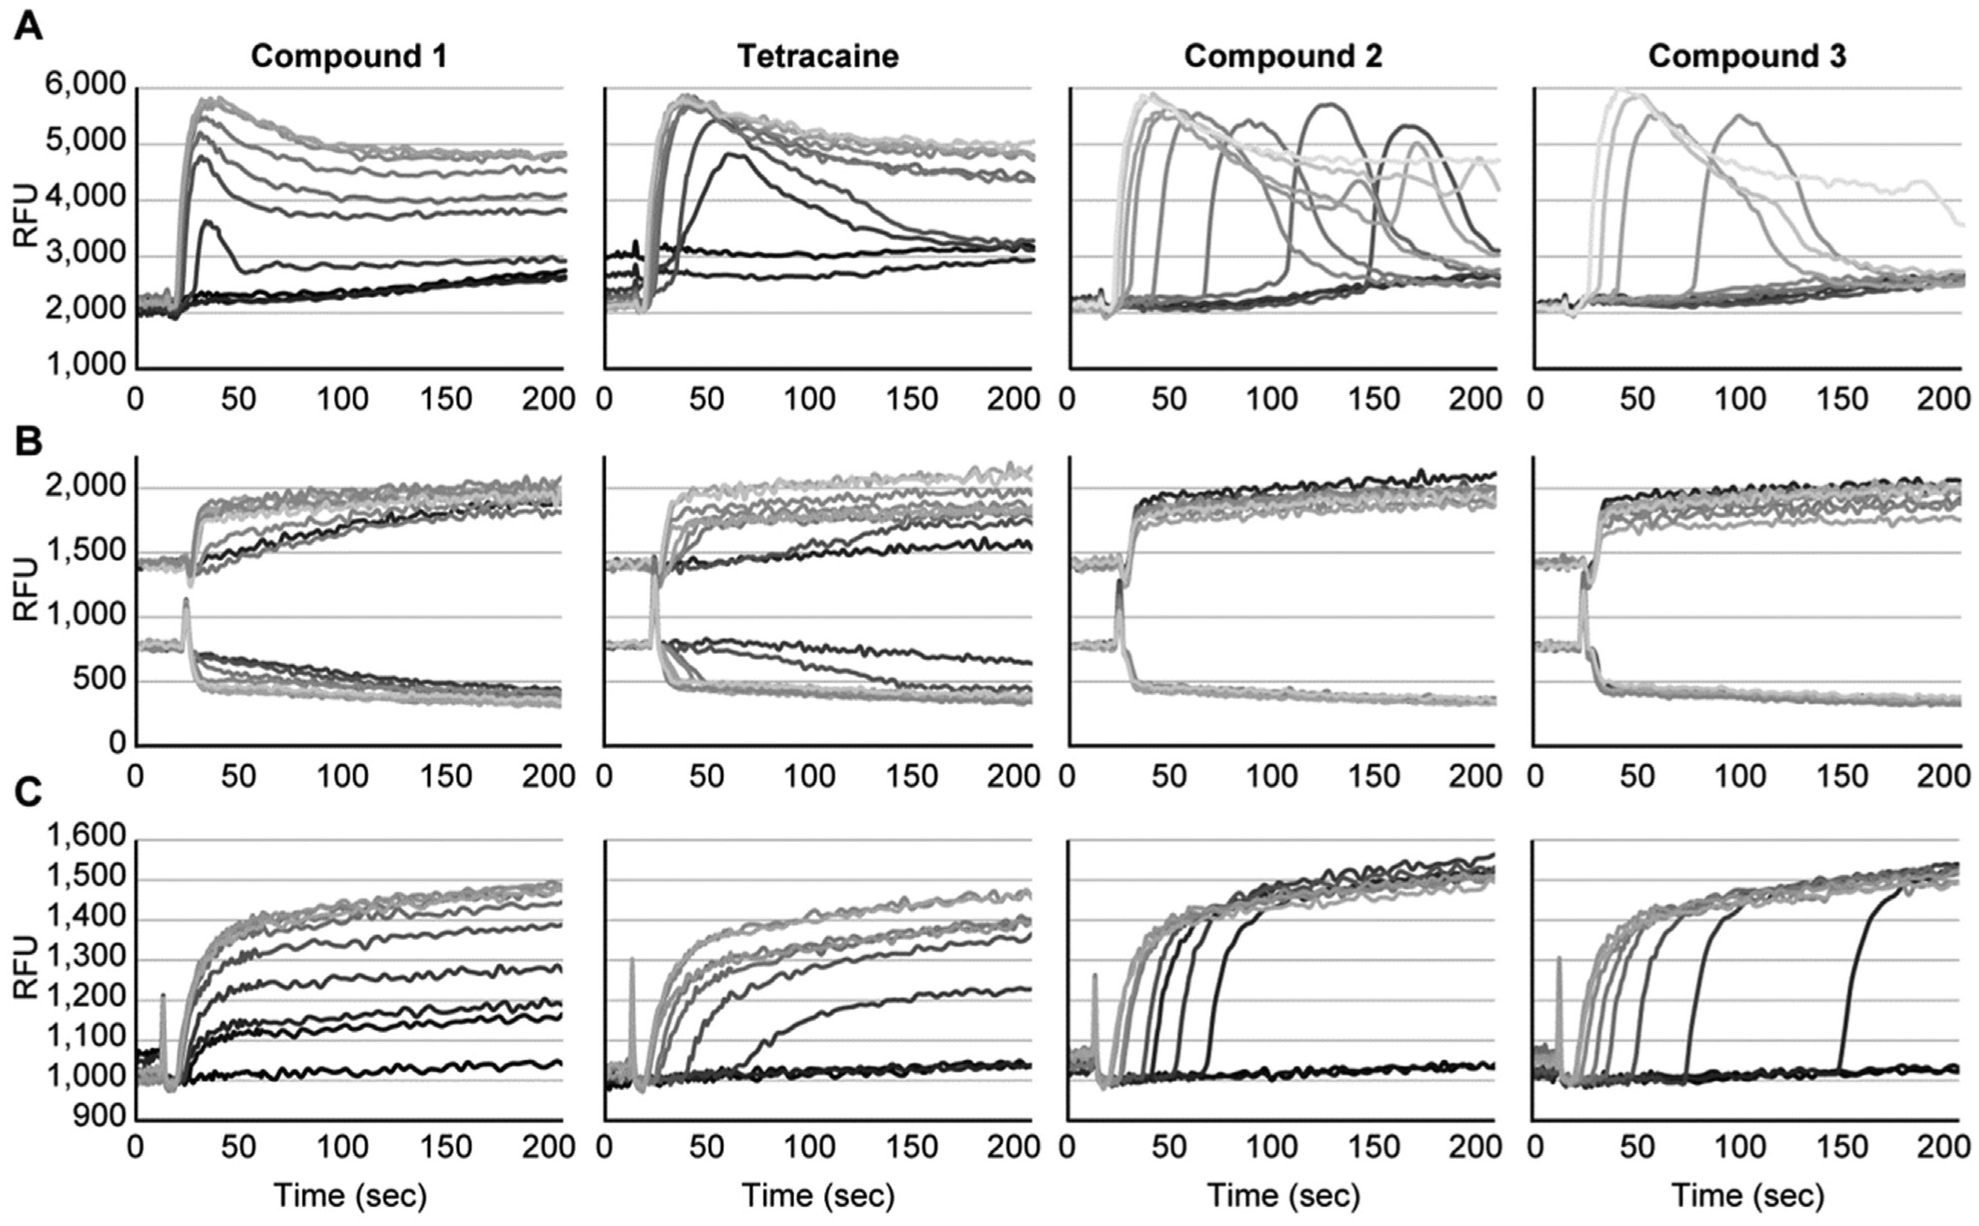
Representative FLIPR traces from concentration-titrations of compounds 1 to 3 and tetracaine for each of the three dyes examined: MD Blue dye (
The FLIPR Tetra supports automated analysis of traces by several methods. One common method used for analyzing FLIPR traces takes the ratio of the peak response divided by the prestimulus baseline from the FLIPR waveform (see Materials and Methods). Compound 1 exhibited a concentration-dependent decrease in the ratio, in contrast to compound 2, in which the concentration dependency appeared to be “all-or-nothing” ( Fig. 3A ). These data are consistent with the observation that several intermediate concentrations of compound 2 cause a delay to onset of response but have almost no effect on the response maximum ( Fig. 2A ). In these cases, the ratio would either underestimate potency or, more significantly, entirely miss compounds that had a delay-to-onset effect at the screening concentration. To mitigate the reduced sensitivity of the ratio method for these compounds, an AUC measurement was employed in parallel with the ratio measurement to analyze each sweep. Comparing AUC to ratio measurements revealed that compound 2 showed a trend toward greater potency with the AUC measurement, whereas compound 1 had no shift between the two measurements ( Fig. 3A ). There was day-to-day variability in the magnitude of delay to onset and in the shape of the waveforms at the intermediate concentrations of compounds 2 and 3. Although this is reflected in an increased variability in apparent potency for these compounds, the improved sensitivity of AUC over ratio was consistent over multiple days ( Fig. 3B ). These data indicated that the AUC measurement may be more sensitive to detecting compounds with a delay-to-onset phenotype. To test this idea further, a set of 40 compounds with a delay-to-onset phenotype and a range of apparent potencies was examined at the targeted screening concentration of 5 µM. Plotting percent inhibition determined by ratio or by AUC revealed that many of these compounds exhibited greater inhibition in the AUC over the ratio measurement ( Fig. 3C ). The difference between the percent inhibition determined by AUC versus ratio measurements could be used to identify less potent compounds exhibiting the delay-to-onset phenotype.
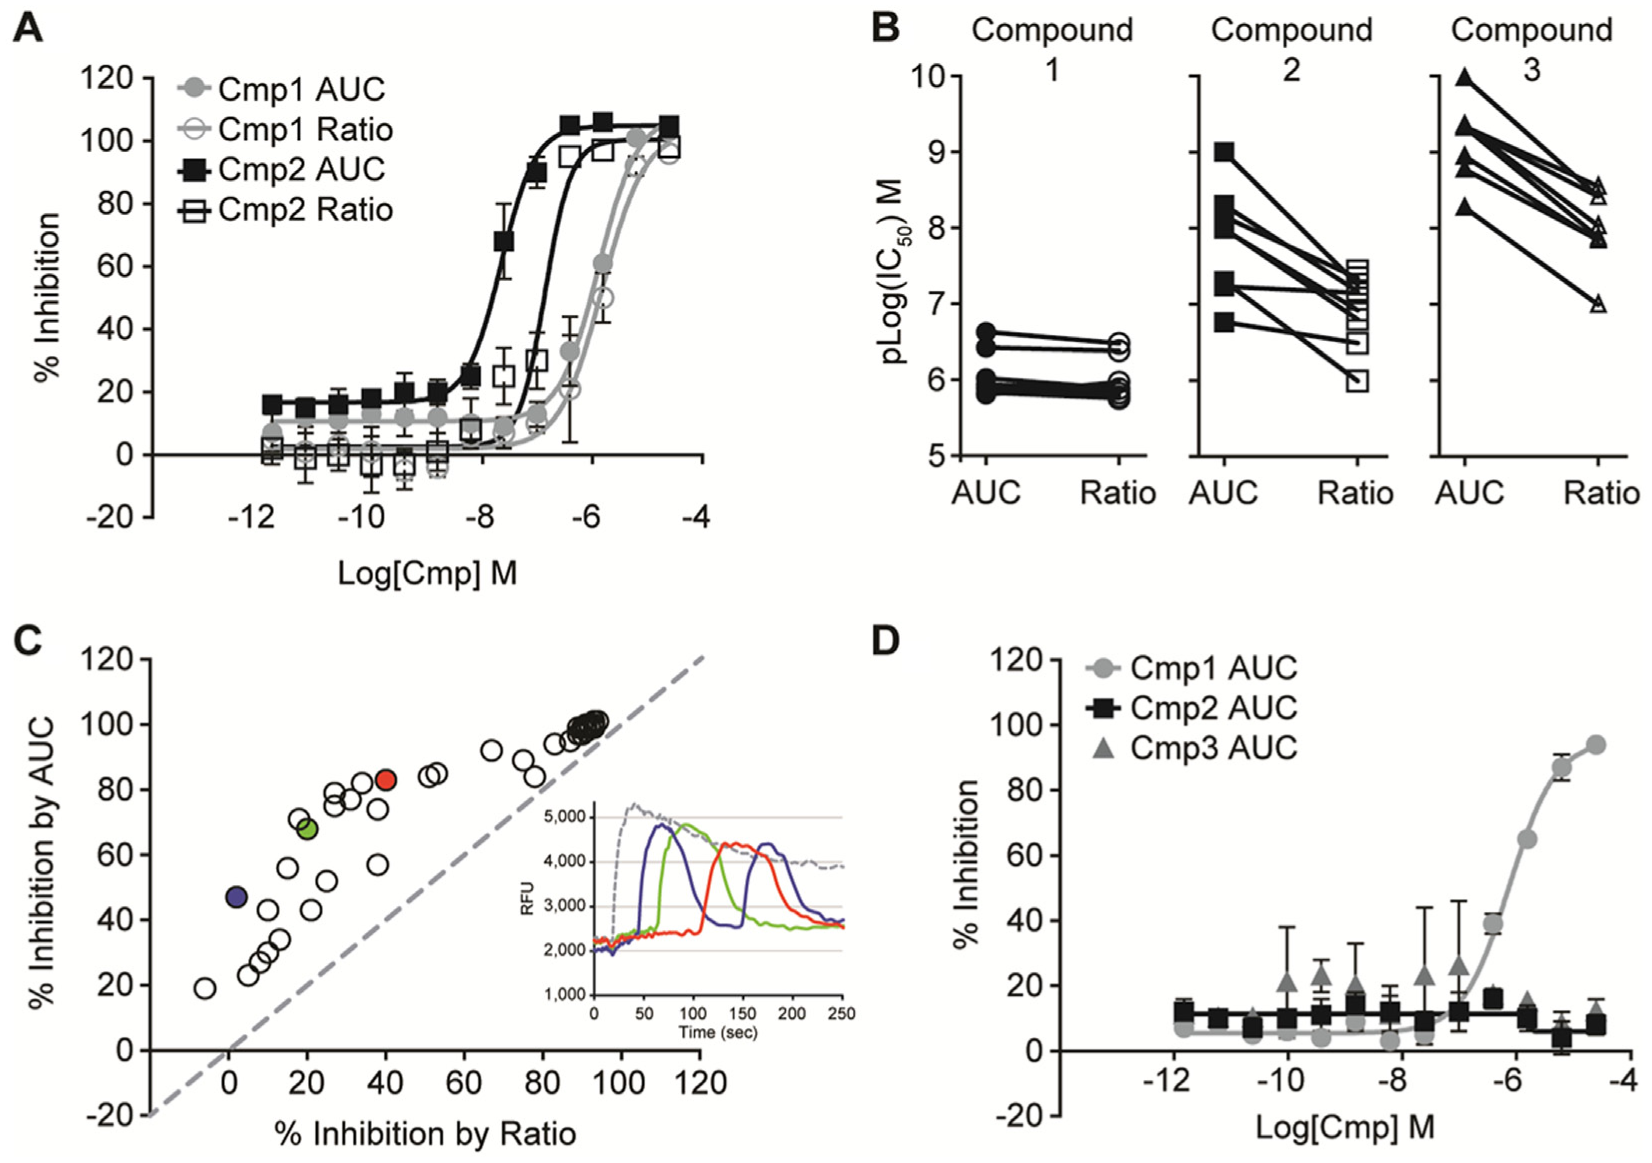
Comparison of ratio and area under the curve (AUC) measurements of MD Blue dye FLIPR responses. (
Preliminary hit rate testing revealed a very high percentage of active compounds in the collection using the MD Blue FLIPR assay. In a set of 6400 compounds in five plates selected randomly from the screening collection tested at 5 µM, 851 compounds exhibited ≥70% inhibition using the ratio method, representing a 13% hit rate. To assist in the triage of the anticipated high number of hits, a similar veratridine-evoked MD Blue membrane potential FLIPR assay was developed with the cardiac sodium channel, NaV1.5. In the same set of 6400 compounds, 778 of the 851 NaV1.7 hits also showed ≥70% inhibition in the NaV1.5 FLIPR assay, leaving 78 hits that were selective (had greater percent inhibition) on NaV1.7 versus NaV1.5 (representing a 1.2% hit rate). Although compounds such as compound 1 inhibited NaV1.5 responses evoked by veratridine, no inhibition by compound 2 or 3 was observed ( Fig. 3D ). These data are consistent with observations from electrophysiological experiments ( Fig. 1 ).
As outlined in Figure 4A , an HTS campaign of approximately 3 million compounds screened on both NaV1.7 and NaV1.5 (5 µM, n = 1) was initiated using the MD Blue FLIPR assay. Both ratio and AUC measurements were made for all compounds tested. Three categories of hits were selected from the primary screen: (1) 79,500 “selective” inhibitors of NaV1.7 versus NaV1.5 as determined by ratio measurements, (2) 98,000 highly efficacious compounds (≥90% inhibition) on both NaV1.7 and NaV1.5 as determined by ratio measurements (potent NaV1.7 inhibitors with potential selectivity in electrophysiology assays) with 40,800 falling into categories 1 and 2, and (3) 5600 compounds that demonstrated greater inhibition of NaV1.7 in the AUC measurement relative to the ratio measurement. Chemical cluster analysis and filtering were applied to reduce the total list of 142,300 compounds to 60,100 compounds for confirmation on NaV1.7 and NaV1.5.
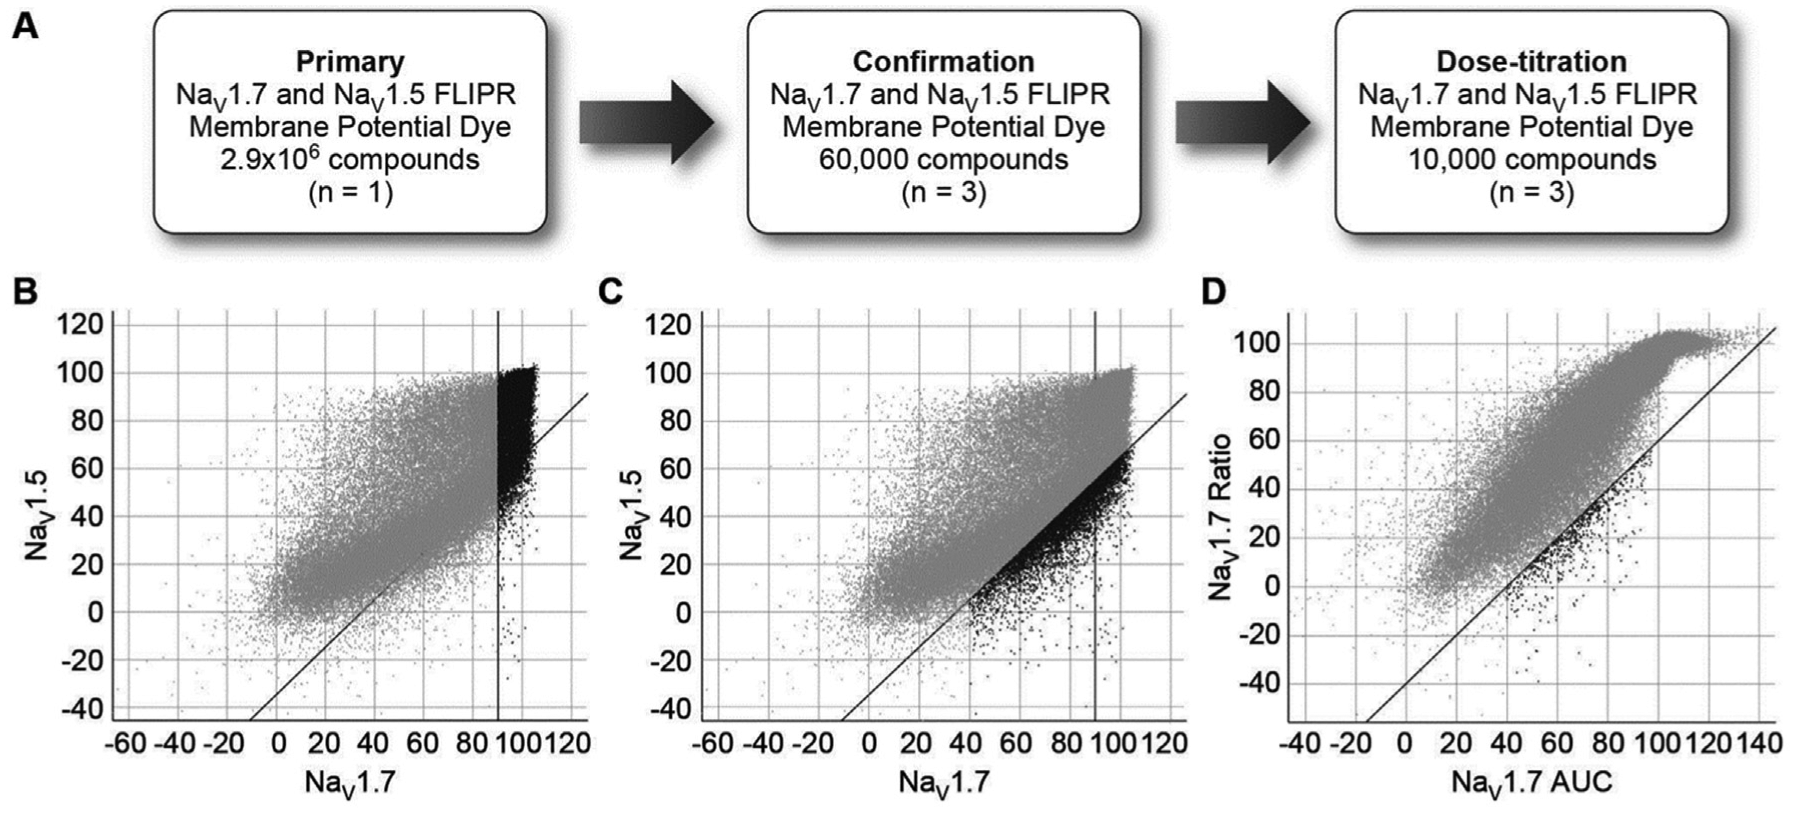
Screening strategy. (
Following the confirmation screen and counterscreen in triplicate, data analysis revealed that 14,400 compounds exhibited high efficacy on NaV1.7 (≥90% inhibition) as indicated in black in Figure 4B . A set of 6500 compounds was identified exhibiting inhibition of NaV1.7 that was at least 35% greater than the inhibition of NaV1.5 (indicated in black, Fig. 4C ) with 1500 compounds overlapping. An additional ~300 compounds were also carried forward to concentration-titration based on more robust inhibition assessed in NaV1.7 AUC measurement versus the ratio measurement (% inhibition AUC >40 and % inhibition AUC – % inhibition ratio >40) (shown in black, Fig. 4D ).
In parallel to the 8-point concentration-titration performed in the FLIPR assays, an Ion Works Quattro electrophysiology assay was performed at a single concentration (10 µM, n = 2) on 1142 prioritized compounds, 863 selected by the ratio methods and 279 selected by the AUC versus ratio comparison. Compounds exhibiting greater than 50% inhibition, which was more than twofold above the standard deviation of DMSO-treated wells (−1.0% ± 18% inhibition), in either replicate were considered hits in the Ion Works Quattro assay, with a 54% confirmation rate for compounds selected based on ratio and 25% confirmation rate for compounds based on selective inhibition of the AUC measurement (
Fig. 5A
). This latter category represents compounds that would have otherwise been left unidentified as hits using the ratio method alone. Given this finding, an additional set of 533 compounds was selected based on the AUC versus ratio data from the confirmation screen (“AUC2”) and directly tested in the Ion Works NaV1.7 single-concentration assay. Of these compounds, 165 were confirmed active (31%;
Fig. 5A
). Active compounds were subsequently prioritized for additional follow-up in concentration-titration on Ion Works for NaV1.7 and NaV1.5. Of the ratio-selected compounds that were tested, 26% (n = 98) were more than threefold selective, whereas 56 % (n = 9) of AUC and 63% (n = 16) of AUC2 compounds were more than threefold selective (
Fig. 5B
). An acyl-sulfonamide structure, compound 4, represents one such compound exhibiting a concentration-dependent delay to onset in the NaV1.7 FLIPR MD Blue assay, a concentration-dependent inhibition in the NaV1.7 Ion Works electrophysiology assay, no inhibition in the NaV1.5 MD Blue assay, and almost no inhibition in the NaV1.5 Ion Works electrophysiology assay (
Fig. 5C
and
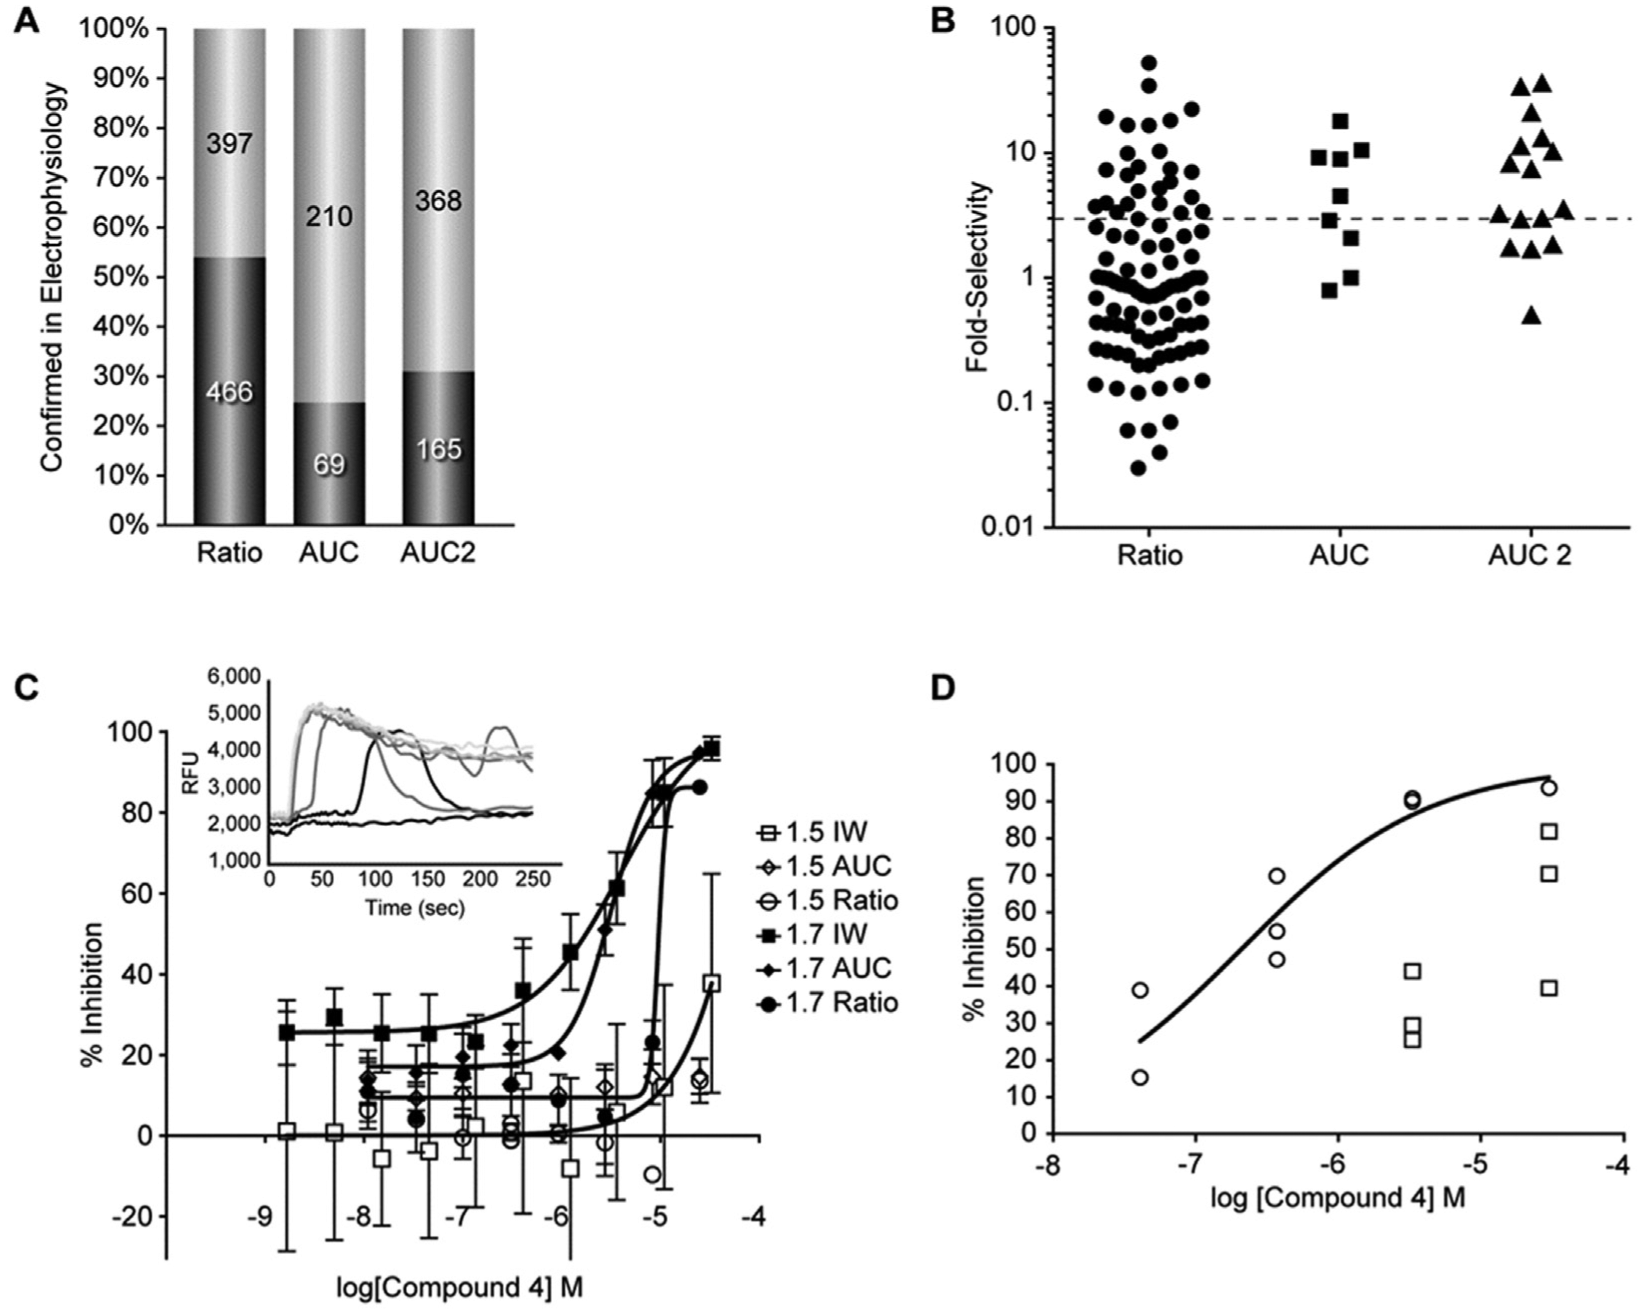
Electrophysiology confirmation. (
Additional remining of the HTS data was performed on all screened compounds using further analysis of the raw FLIPR traces to better identify the delay-to-onset effect. The sweep was divided into four regions corresponding to the baseline (period 1), the period of rapid increase in response to veratridine in control wells (period 2), and then two periods representing a modest delay (period 3) and a more extreme delay (period 4; see Materials and Methods). Compounds exhibiting a ratio >1.7 during periods 3 or 4 were identified as hits for additional follow-up (761 and 143, respectively). Of these delay-to-onset hits, 4% (period 3) and 24% (period 4) were confirmed to have inhibitory activity in Ion Works. From this additional screening effort, more structures were identified that were active in electrophysiology and had selectivity over NaV1.5 as exemplified by compound 5 ( Fig. 1 ), as well as compounds with more distinct structures from those of compounds 4 and 5 (data not shown).
To further elaborate the relationship between the kinetic changes in the FLIPR MD Blue traces and electrophysiological activity, a subset of compounds exhibiting the delay-to-onset phenotype was analyzed in titration on a gigaseal automated patch-clamp platform (PatchXpress; see Materials and Methods). For these compounds, the delay to onset was determined for each FLIPR MD Blue trace (see Materials and Methods and Fig. 6A ), and an IC50 was calculated from the resulting FLIPR titration ( Fig. 6B ) and compared with IC50s determined by whole-cell patch clamp, revealing a positive correlation between the two assays (R2 = 0.47, Fig. 6C ). Furthermore, this set of compounds exhibited high selectivity over NaV1.5 as determined by whole-cell patch clamp ( Fig. 6D ).
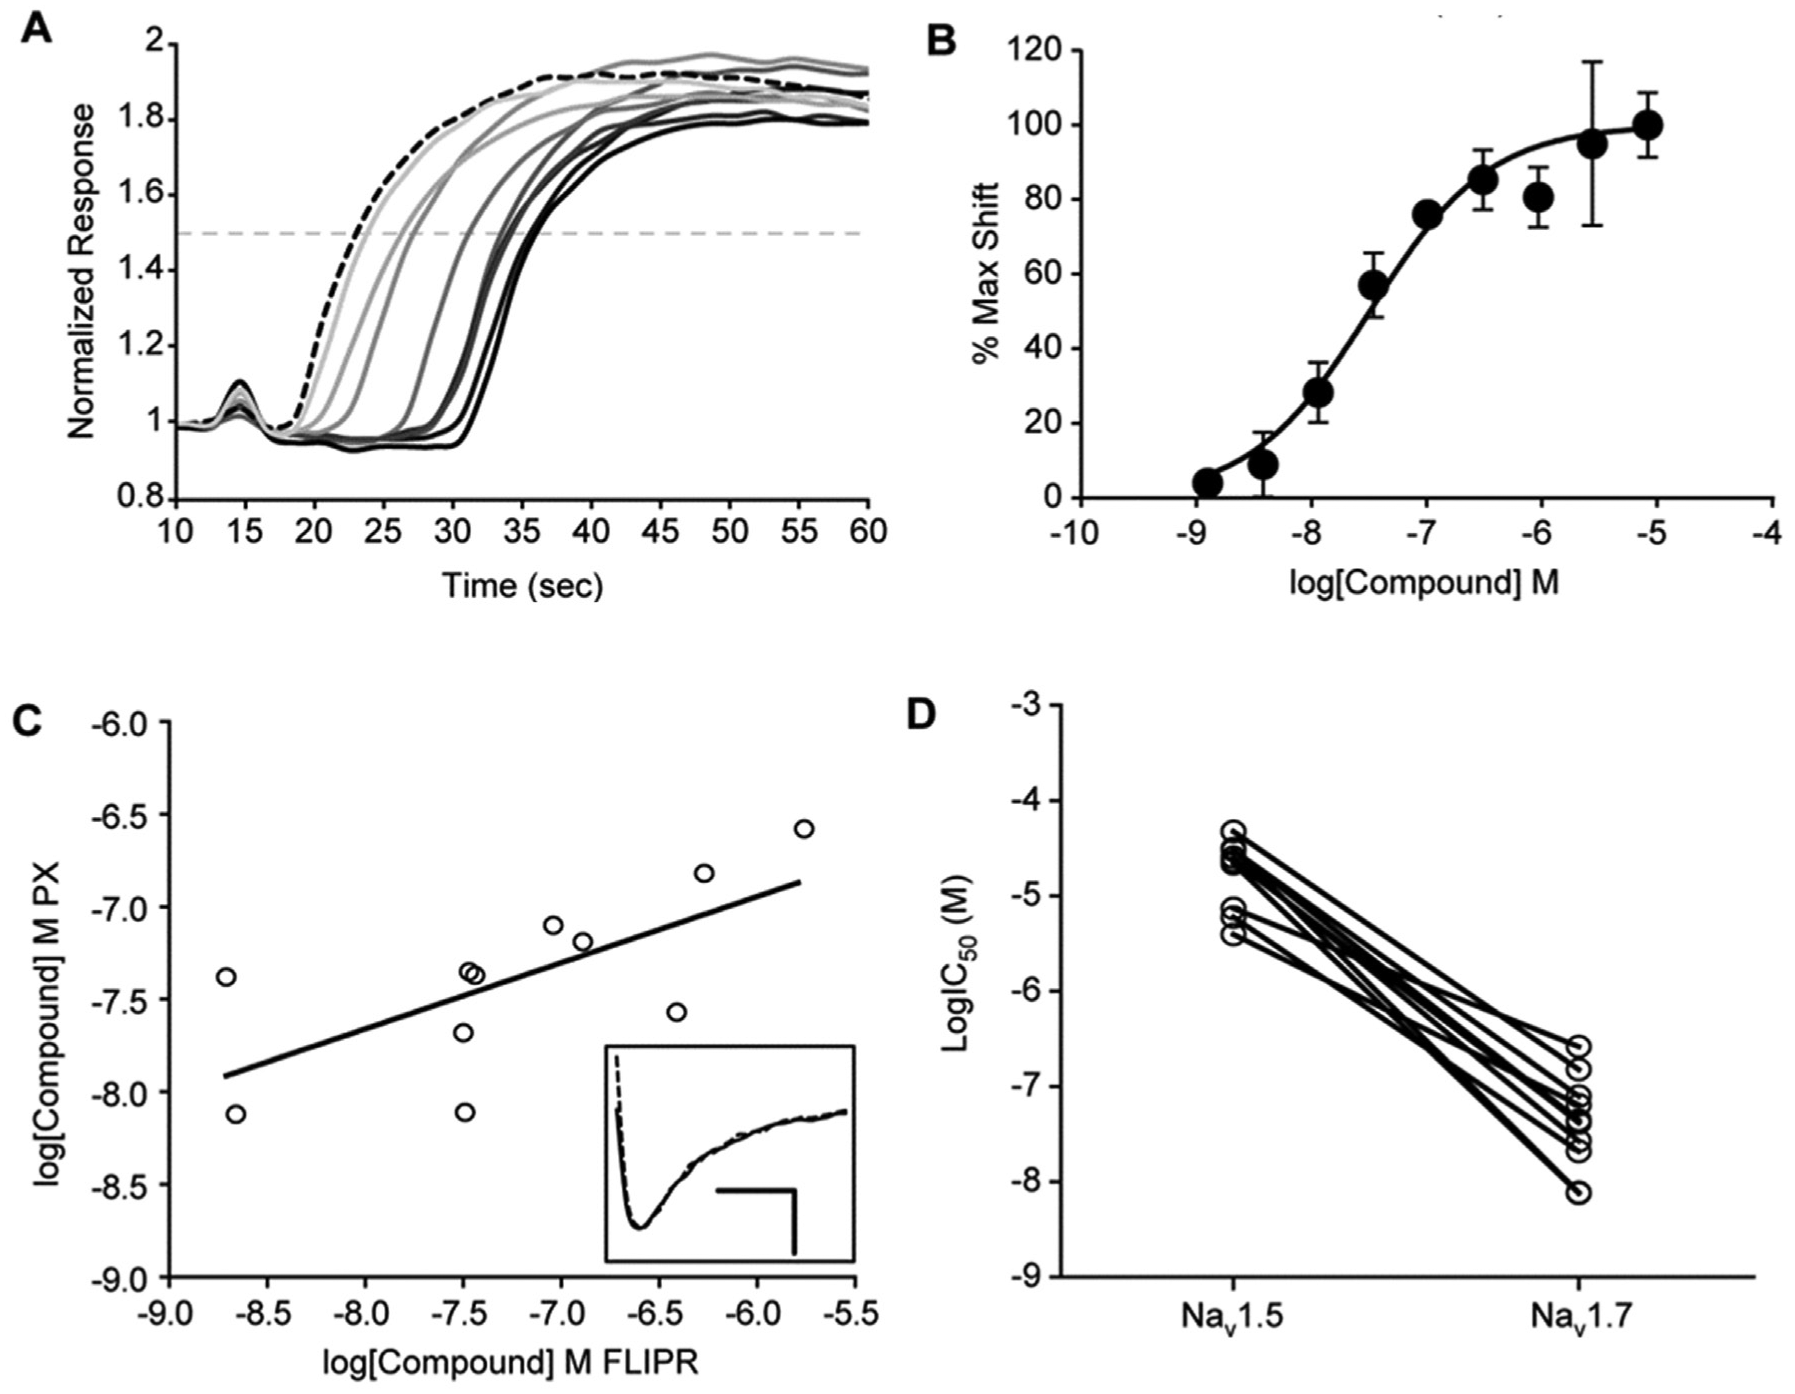
Delay-to-onset effect in FLIPR correlates with electrophysiology results. (
Differences in the kinetics of membrane potential dye responses have been observed for other ion channels, 22 and sophisticated kinetic analyses have been described for G protein–coupled receptors (GPCRs) that enable subcategorization of compounds based on subtle kinetic effects on calcium dye responses. 23 One general concern in focusing on kinetic variability in these responses is the potential for committing to extensive analysis of sweeps that may be due to assay artifacts. It was intriguing to note that the VSP dye system was unable to detect inhibition by compounds 2 and 3. Although both dye systems employ negatively charged oxonols that can translocate across the plasma membrane in response to depolarization, the MD Blue dye uses an extracellular quencher to reduce fluorescence when the oxonol is at the outer leaf of the membrane, whereas the VSP relies on FRET with a coumarin dye that is restricted to the outer leaf. 17 Whether these differences underlie the (lack of) sensitivity of the respective dye systems to inhibition by compounds 2 and 3 is not clear. However, we limited our use of the membrane potential dye delay-to-onset profile until we had confirmed that hits from this approach were active in electrophysiology assays ( Fig. 5 ), subsequently expanding our exploitation of the kinetic phenotype with a better understanding of its correlation to higher quality methods of compound activity ( Fig. 6 ).
Although we do not have a clear mechanistic explanation for the delay-to-onset effect observed with the subset of compounds exemplified by compounds 2 to 5, the fact that both the MD Blue membrane potential and ANG-2 sodium-sensing dyes exhibit the effect ( Fig. 2A , C ) indicates that it is not an artifact of the interaction between the compounds and the detection of veratridine responses. In addition, the delay to onset observed on the FLIPR appears to correlate with inhibition of voltage-clamp measured currents ( Fig. 6 ). However, no kinetic changes in rise or decay times in electrophysiological current traces were observed in the presence of these compounds, as illustrated by data from compound 3 ( Fig. 6C , inset, mean ± SD for τactivation = 0.34 ± 0.15 ms vs. 0.33 ± 0.14 ms and τinactivation = 2.4 ± 0.4 ms vs. 2.6 ± 0.4 ms for control and compound 3, respectively, as determined by equation (3), n = 6 cells). Recent publications indicate that compound 2 has a distinct binding mode, interacting with the voltage-sensing domain of domain IV, 21 compared with channel pore-binding sites for local anesthetics 24 and veratridine. 25 Whether this unique binding mode for compound 2 explains why a delay in response to veratridine induced depolarization in a cell that is not under voltage-clamp is yet to be determined.
Another possibility to explain the delay-to-onset phenotype is an allosteric interaction between veratridine and compounds 2 to 5. In whole-cell patch-clamp recordings, veratridine has been shown to increase steady-state currents following a depolarized voltage step and induce a subsequent tail current upon repolarization. 26 In preliminary electrophysiological experiments, we observed that compound 3 can inhibit NaV1.7 currents evoked by activating step pulses in the presence of veratridine but not the increased steady-state or tail currents that develop; however, we observed the same results with compound 1 (data not shown). A more detailed analysis of veratridine interactions with compounds acting through either local anesthetic or voltage-sensing binding sites is needed to explain the difference in kinetics observed in FLIPR by these classes of compounds.
In summary, we identified a unique kinetic signature in a subset of NaV1.7 antagonists in FLIPR membrane potential dye responses to veratridine addition. To extract compounds with the delay-to-onset kinetic profile, we employed approaches taking advantage of existing analysis capabilities, such as comparing AUC with ratio measurements based on the entire sweep and, later, examining ratio measurements within subsections of the sweep time course. These efforts identified chemical matter with selectivity for NaV1.7 over NaV1.5 that was overlooked in prior screens and supported further efforts to develop selective small-molecule inhibitors of NaV1.7.
Footnotes
Acknowledgements
Thanks to Joe Duffy, Vic Uebele, and John Hunter for critical reading of the manuscript; Lynn Boots and Gangguo Gu for cell culture support; and Andrea Houghton, Chris Burgey, Jeff Hermes, and John Hunter for support.
Declaration of Conflicting Interests
The authors declared no potential conflicts of interest with respect to the research, authorship, and/or publication of this article.
Funding
The authors received no financial support for the research, authorship, and/or publication of this article.
References
Supplementary Material
Please find the following supplemental material available below.
For Open Access articles published under a Creative Commons License, all supplemental material carries the same license as the article it is associated with.
For non-Open Access articles published, all supplemental material carries a non-exclusive license, and permission requests for re-use of supplemental material or any part of supplemental material shall be sent directly to the copyright owner as specified in the copyright notice associated with the article.