
Abstract
There has been increasing interest in the development of cellular behavior models that take advantage of three-dimensional (3D) cell culture. To enable assessment of differential perturbagen impacts on cell growth in 2D and 3D, we have miniaturized and adapted for high-throughput screening (HTS) the soft agar colony formation assay, employing a laser-scanning cytometer to image and quantify multiple cell types simultaneously. The assay is HTS compatible, providing high-quality, image-based, replicable data for multiple, co-cultured cell types. As proof of concept, we subjected colorectal carcinoma colonies in 3D soft agar to a mini screen of 1528 natural product compounds. Hit compounds from the primary screen were rescreened in an HTS 3D co-culture matrix containing colon stromal cells and cancer cells. By combining tumor cells and normal, nontransformed colon epithelial cells in one primary screening assay, we were able to obtain differential IC50 data, thereby distinguishing tumor-specific compounds from general cytotoxic compounds. Moreover, we were able to identify compounds that antagonized tumor colony formation in 3D only, highlighting the importance of this assay in identifying agents that interfere with 3D tumor structural growth. This screening platform provides a fast, simple, and robust method for identification of tumor-specific agents in a biologically relevant microenvironment.
Introduction
Phenotypic screening for oncology drug discovery is typically performed in a two-dimensional (2D) manner by adding potential inhibitors to cancer cells grown as a monolayer on plastic plates followed by assessment of cell viability. Although this assay paradigm has proven invaluable for its ease in screening millions of compounds in automated high-throughput screening (HTS)–compliant formats, it may fail to capture the full range of cellular phenotypes owing to the relative simplicity of the system. Cells grown in a 2D adherent format frequently exhibit different morphological and genetic traits when cultured in 3D matrices,1–4 and it has been demonstrated that 3D models more accurately recapitulate in vivo cellular behavior. 5 It has been suggested that assay technologies capable of assessing inhibition of these more complex phenotypes may prove useful in guiding drug discovery efforts.6–8 One alternative to 2D-based drug discovery is to employ a method that incorporates a 3D extracellular scaffold to more accurately reflect the tumor microenvironment. Mimicking biologically relevant tumor environmental conditions may greatly enhance high-content chemotherapeutics screening, thereby fast tracking early discovery compounds through the preclinical development process.
The 3D soft agar assay is a well-established surrogate assay for tumorigenesis. It is an ideal assay for assessing the impact of inhibitors on cancer cell colony formation and is frequently the first experimental validation that compounds active in 2D must possess in order to progress through the drug discovery pipeline. 9 Compounds active in 2D but unable to subvert 3D colony formation are frequently deemed unlikely to show effects in later models such as rodent xenografts and are deprioritized. 10 Recently, the soft agar assay has been adapted from 96- to 384-well format, enabling the screening of tens or, potentially, hundreds of thousands of compounds.11–13 Unlike conventional 2D monolayer compound screening, which often takes advantage of cellular ATP concentration to determine cell viability, 3D soft agar screening produces a readout reflecting a variety of different cell intrinsic properties, including colony formation, cancer stem cell population, anchorage-independent growth, and cell-to-cell adhesion. 14 This complex multiparametric readout produces significantly more sophisticated data than 2D monolayer screening, particularly when acquired via high-content imaging.
Although several high-content 3D colony formation assays have been previously described, they have conventionally employed metabolically reactive dyes such as alamar blue for recording whole-well fluorescence signals.12,13 Those methods provide indirect measurements of 3D colony formation and cannot report on colony size, shape, or individual fluorescence intensity. The logical readout for a 3D colony formation screen would be imaging based and would enable experimental scrutiny of individual objects within a well. However, HTS soft agar screening platforms that employ an automated microscopy readout are slow and cumbersome due to the limited depth of field in microscopic imaging and the necessity to acquire a Z stack of several images within a microplate well. 8 Employment of a nonconfocal, image-based laser-scanning cytometer for quantitating 3D colony formation produces highly sensitive data similar to automated microscopy but does not require the assemblage of Z stack images and large amounts of data storage. In addition, a laser-scanning cytometer is able to read an entire 384-well microplate in approximately 14 min, making the 3D screening of large-compound collections technically feasible and expedient. 15
The microenvironment of the tumor has been recognized as a key determinant of tumor initiation and maintenance. 16 Tumor microenvironment is highly variable depending on the tissue of origin and may consist of extracellular matrix, tumor vasculature, cancer-associated fibroblasts, and members of activated immune cells that all interact with neoplasia via cell-to-cell contact and paracrine signaling mechanisms of secreted factors. 17 The incorporation of stromal cells into a 3D tumor model has proven extremely informative in the study of breast 18 and colon19,20 cancers. In addition, there have been several recent reports of stroma-mediated drug resistance in tumors,21,22 which only strengthens the necessity for their inclusion in HTS drug discovery screening. Tumor/stroma paracrine signaling paradigms have been dissected in cell-based colon models showing mutual stimulation of proliferation between fibroblasts and carcinoma cells, 23 and these models have been miniaturized and adapted to 3D colon cancer drug screening. 19
A further advantage of the 3D assay system may involve the ability to test compound efficacy at various points in the cellular behavior continuum. In 2D, cells are typically plated, allowed to attach, exposed to compounds, and then assessed for survival. The presently described assay permits compound testing to be performed at any point during colony formation; from colony preformation (treatment immediately after cell/agar dispense, e.g., prophylactically) to after colony formation (treatment once colonies have fully formed, e.g., therapeutically).
Herein we describe a high-throughput 3D colorectal cancer colony formation soft agar assay used to screen a library of 1528 diverse natural product compounds, first with colon cancer cells in 3D alone and then in the presence of both colon cancer cells and colon stromal cells within the same scaffolding matrix. This novel imaging-based assay was used to dissect the activities of primary hit compounds, revealing discrepancies in inhibitory concentrations (IC50) between the two populations. These therapeutic windows served as a sophisticated triaging measure by which to stratify early-development chemotherapeutics.
Materials and Methods
General Cell Culture
HCT116 human colorectal carcinoma cells (ATCC, Manassas, VA) were maintained according to standard growth conditions in McCoy’s 5A medium (Life Technologies, Carlsbad, CA) supplemented with 10% fetal bovine serum (FBS) and 1× pen/strep/antimycotic. CCD-18Co human normal colon myofibroblasts 24 (CRL-1459, ATCC), taken from a neonatal colon, were maintained according to standard growth conditions in Eagle’s Minimal Essential Medium (EMEM; Life Techno-logies) supplemented with 10% FBS. The HCT116-eGFP cell line was created by infecting parental HCT116 cells with an eGFP-expressing retrovirus and then sorting for single eGFP+ cells. The retroviral vector used was a derivative of the murine stem cell virus and contains an IRES-eGFP driven by a cytomegalovirus promoter. Single-cell eGFP+ clones were expanded for approximately 6 wk before use.
3D HTS Soft Agar Colony Formation Assay
The 384-well high-content soft agar colony formation assay was adapted from Anderson et al. 13 Briefly, 384-well black-sided, clear-bottom plates (789071G, Greiner, Monroe, NC) were prepared with a 10 µL base layer of 0.8% soft agar. Soft agar 0.8% was made by melting agarose (NuSieve-GTG; Lonza, Walkersville, MD) in the cell-specific growth medium, filter-sterilizing through a 0.22 µm filter, and cooling to 37 °C. The 0.8% soft agar base layer comprises the bottom 1 mm of the well. After the base layer solidified, HCT116 cells were trypsinized, washed, counted, and diluted to 150 cells/10 µL in medium. Cells were then mixed with an equal volume of 0.8% soft agar (yielding 150 cells/20 µL of 0.4% soft agar), and 20 µL of the suspension was added to each well of the 384-well plate using a 16-channel matrix pipette. The middle 0.4% soft agar layer occupies the next 2 mm of the well. Plates were incubated at room temperature (RT) for 20 min to allow soft agar to solidify. A 30 µL medium overlay was added to the wells, and plates were then incubated overnight at 37 °C. The top medium layer occupies the upper 2 to 3 mm of well height, yielding a total well occupancy volume of 60 µL or 5 to 6 mm. The space available for colony formation is typically the 2 mm middle layer.
3D HTS Soft Agar Colony Formation Natural Products Screen
For screening a natural products custom diversity compound library, 384-well soft agar plates (prepared the day before) containing 150 HCT116 cells/well were used. A library of 1528 purified natural product compounds derived from plants, sponges, fungi, actinomycetes, and bacteria was dispensed onto soft agar plates using the Echo acoustic transfer device (Labcyte, Sunnyvale, CA) at 2.5 µM in duplicate. This compound library contains many commercially available natural products as well as Novartis proprietary novel compounds. The 2.5 µM dose was chosen to keep the DMSO volume in the upper medium layer below 1% until the compound diffused into the soft agar. A total of 150 nL of a 1 mM compound stock was transferred, yielding an overall well DMSO concentration of 0.25% in 60 µL. Four wells per plate were reserved for a volume-equivalent DMSO negative control, and four wells per plate were reserved for an 18 nM doxorubicin positive control (Sigma-Aldrich, St. Louis, MO). Plates were then incubated for 5 days at 37 °C to allow for colony formation.
Image Analysis
After 5 days, plates were removed from 37 °C and allowed to adjust to RT for 15 min, at which point 200 nM calcein AM (C3099; Life Technologies) diluted in phosphate-buffered saline was added per well. Plates were sealed with foil seals and incubated at RT for 1 h to allow calcein AM to penetrate colonies. Colony formation was quantitated on an Acumen laser-scanning fluorescence cytometer 25 (TTP Labtech Ltd, Hertfordshire, UK) using the 488 nm laser and the appropriate filter settings. A range of colony sizes was observed in the DMSO negative control assay wells, from nonproliferative single cells to large, irregularly shaped colonies consisting of thousands of cells. The average size based on colony area was calculated using the Acumen Explorer software, and that became the minimal threshold to score a colony-positive object. The following parameters were recorded using the Acumen Explorer acquisition software for colony-positive objects: average colony intensity, mean intensity per well, and total area of positive signal. These values were then used in a formula that most accurately reflects colony formation:
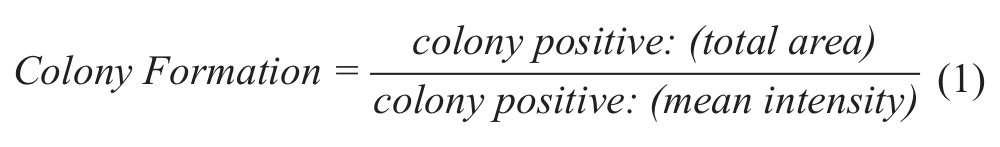
This formula was determined to produce values that were most consistent with the observed images. It should be noted that we did not test the 3D spherical volume algorithm currently available in Acumen Explorer acquisition software.
15
We noticed that using the total area measurement or the average intensity measurement alone overvalued the observed colony formation (
3D HTS Soft Agar Colony Formation Co-culture Assay
For the HTS co-culture 3D soft agar colony formation assay, CCD-18Co normal colon fibroblasts were employed as a stromal layer. CCD-18Co cells were trypsinized, washed, counted, and suspended in medium. Cells were then stained with the QTracker-625 Cell Labeling Kit (A10198; Life Technologies) according to the manufacturer’s instructions. Two thousand five hundred labeled CCD-18Co cells were plated per well in 10 µL EMEM into 384-well plates and allowed to adhere overnight at 37 °C. CCD-18Co cells were not plated within the 3D matrix because those cells require anchorage to a firm support and do not form 3D structures. The following day, the soft agar colony formation assay was set up with a few modifications. HCT116-eGFP cells were used (150 cells/well), prepared as 150 cells/20 µL in 0.7% soft agar. Twenty microliters of cells was dispensed per well over the CCD-18Co cells in 10 µL EMEM, yielding a final soft agar concentration of 0.46%. Because we did not employ an 0.8% base layer in this assay, the middle layer’s soft agar concentration was increased from 0.4% to 0.46% to discourage HCT116 cells from invading the stromal layer. The increase in soft agar concentration did not affect the colony formation. Wells were then overlaid with medium, and compounds were dispensed in an eight-point dilution scheme (10 µM to 0.005 µM) using the Echo device as before. Co-culture 3D plates were then incubated for 5 days at 37 °C.
Quantitation of co-culture 3D colony formation was performed on the Acumen laser-scanning fluorescence cytometer as before with a few modifications. A dual laser scan was performed using the 488 nm laser to measure HCT116-eGFP colony formation and the 633 nm laser to measure CCD-18Co-QDot625 total area.
HCT116-eGFP colony formation was calculated using the ratio equation mentioned above. CCD-18Co viability was quantitated using the total area measurement. Reconfirmation dose-response data points were curve fitted using the standard logistic regression model, implemented with an in-house developed Matlab (mathworks.com) program. The resultant IC50 values correspond to the compound concentration that induced 50% activity. Plotting the IC50 values for the same natural product compound on HCT116 versus CCD-18Co cells yielded potential therapeutic windows, in which the HCT116 value represents the therapeutic concentration and the CCD-18Co value represents the limit of toxicity. Reconfirmed hit pick compounds were then triaged according to the weight of the observed therapeutic window.
Analysis of Compound Activities in 2D
Assessment of hit compound activities on HCT116 colon cancer cells grown as an adherent monolayer was performed according to standard industry practices for determining compound cytotoxicity using CellTiter-Glo. The CellTiter-Glo assay is a method of determining the number of viable cells based on quantitation of the ATP present, an indicator of metabolically active cells. HCT116 colorectal carcinoma cells were added to a 384-well solid white plate (781182, Greiner, Monroe, NC) at 5000 cells per well and incubated overnight. The next day (at approximately 70% confluency), compounds were dispensed onto the plate in eight-point dose response using the Echo acoustic transfer device. Plates were incubated at 37 °C for 48 h. After 48 h, an equal volume of 1× CellTiter-Glo (G7572, Promega, Madison, WI) was added to the wells, and plates were incubated at RT for 10 min. Cell viability, as measured by luminescence, was recorded using an EnVision 2104 Multilabel reader (Perkin Elmer, Waltham, MA), and data were analyzed using the associated software.
Results
384-Well 3D Screen Optimization
To create a more robust 3D chemotherapeutic screening platform for high-content drug discovery, we built on the work of Anderson et al., who first described the 384-well soft agar assay.
13
There are a number of variables for this assay that require optimization in a cell type–dependent manner. For HCT116 colorectal cancer cells, we determined that the optimal soft agar seeding density was 150 cells per well in 384-well format (
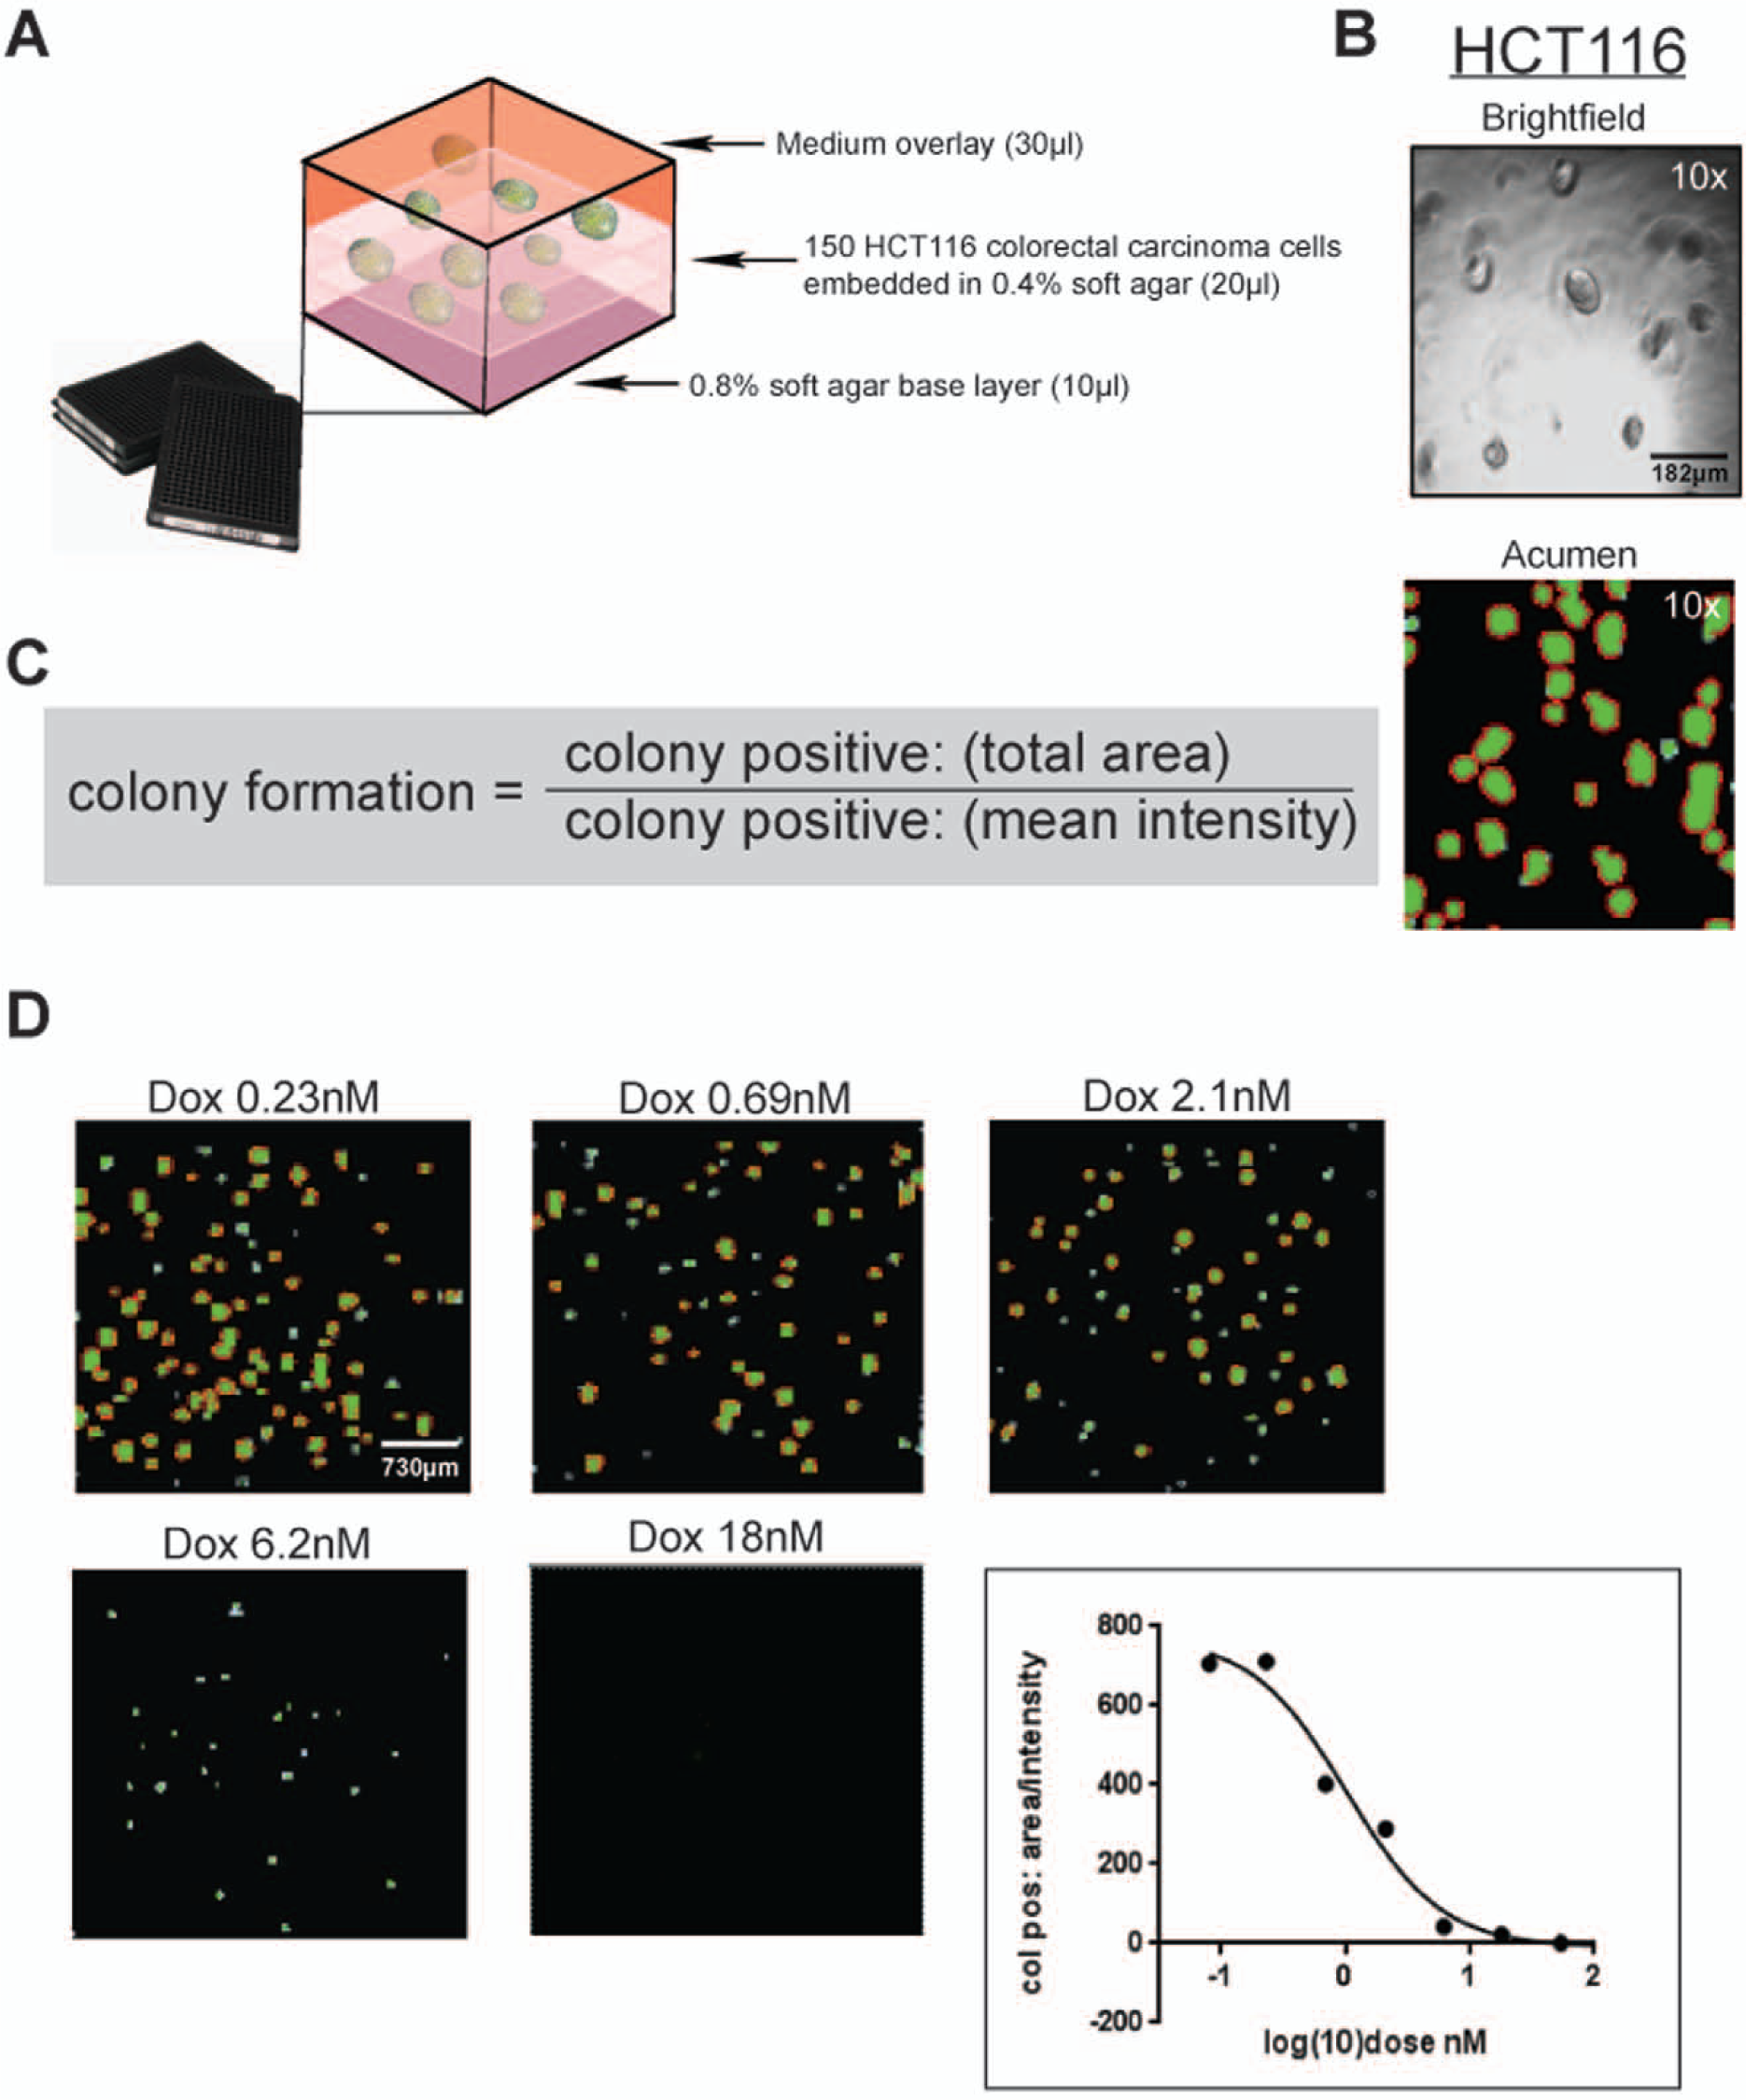
Optimization of the 384-well high-throughput screening (HTS) soft agar assay. (
Accurate quantitation of colony formation was critical for this assay and necessitated an image-based HTS plate reader able to record fluorescence signals over a 2 to 3 mm Z axis. Therefore, we employed the Acumen laser-scanning fluorescence cytometer (TTP Labtech). The Acumen laser-scanning imager was equipped with a specialized widefield objective lens that can scan entire wells and report data for all objects. Colonies were stained with calcein AM, a membrane-permeable live cell–labeling dye, which thoroughly penetrated the soft agar and cells throughout the well. Calcein AM is cleaved by intracellular esterases, yielding the membrane-impermeable calcein fluorescent dye that cannot be retained by dying or apoptotic cells. HCT116 colonies stained with calcein AM show robust fluorescence upon excitation with a 488 nm laser and reveal 3D structures on all Z planes (
Fig. 1B
). The necessity of multiplane colony quantitation is illustrated here by the discrepancies observed between the brightfield image and the Acumen image. The brightfield image displays HCT116 colonies on only one confocal Z plane, whereas the Acumen image is a whole-well readout of colony formation across all Z planes within the 2 to 3 mm space of colony formation. Several different measurements were collected for defined colony-positive objects and assembled into a formula we created to most accurately represent colony formation (
For controls that would establish the assay window for 3D compound screens, we tested several current standard-of-care compounds for colorectal cancer including 5-fluorouracil, gefitinib, and doxorubicin as well as the broad-spectrum kinase inhibitor staurosporine (
384-Well 3D Soft Agar Natural Product Compound Screen
Once optimized, the 3D HCT116 soft agar colony formation platform was employed to screen a natural product diversity collection of 1528 compounds. Compounds in this library represent a broad range of complex structures purified from various sources of bacteria, fungi, and plants and include many that share basic structural similarity to known bioactives. For the proof-of-concept screen, compounds were transferred to soft agar plates using an Echo acoustic transfer device rather than a pintool in order to avoid soft agar disruption. Compounds were dispensed at 2.5 µM in duplicate 1 day after the cells were plated in soft agar, and the cells were allowed to grow for 5 days (
Fig. 2
). Therefore, this particular assay workflow was designed to detect compounds that antagonized colony formation in a prophylactic manner rather than in a therapeutic manner. Although compounds could be tested therapeutically by enabling colony formation for 3 to 4 days before dosing with compounds, we decided against this method as it may not have revealed less-potent compounds within the screened collection. The results of the screen are shown in
Figure 3A
. A large variation in colony formation was observed (coefficient of variation = ~50%), although hit compounds that strongly antagonized colony formation were obvious outliers (
Fig. 3A
, white boxes). A Z′ factor for screen quality assessment was calculated as 0.5, meaning it qualified as an assay with acceptable robustness (
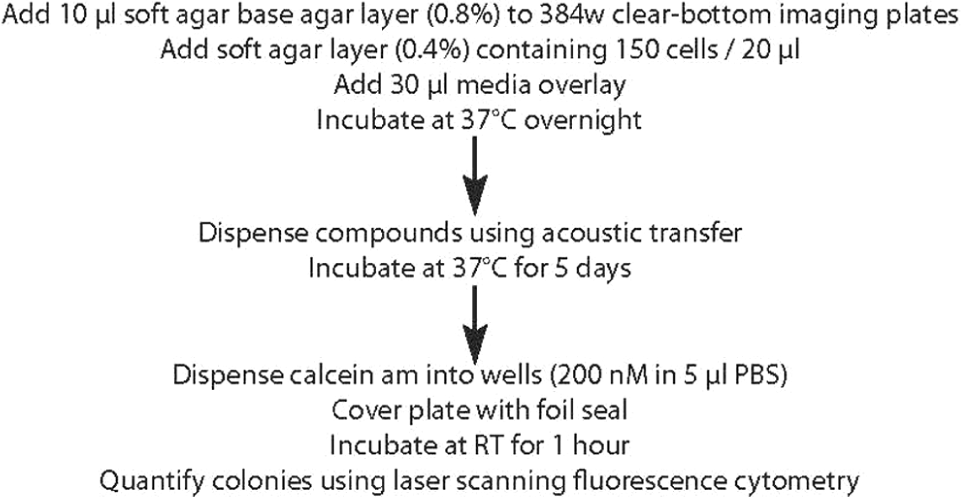
Flow chart describing the 384-well high-throughput soft agar screening assay.
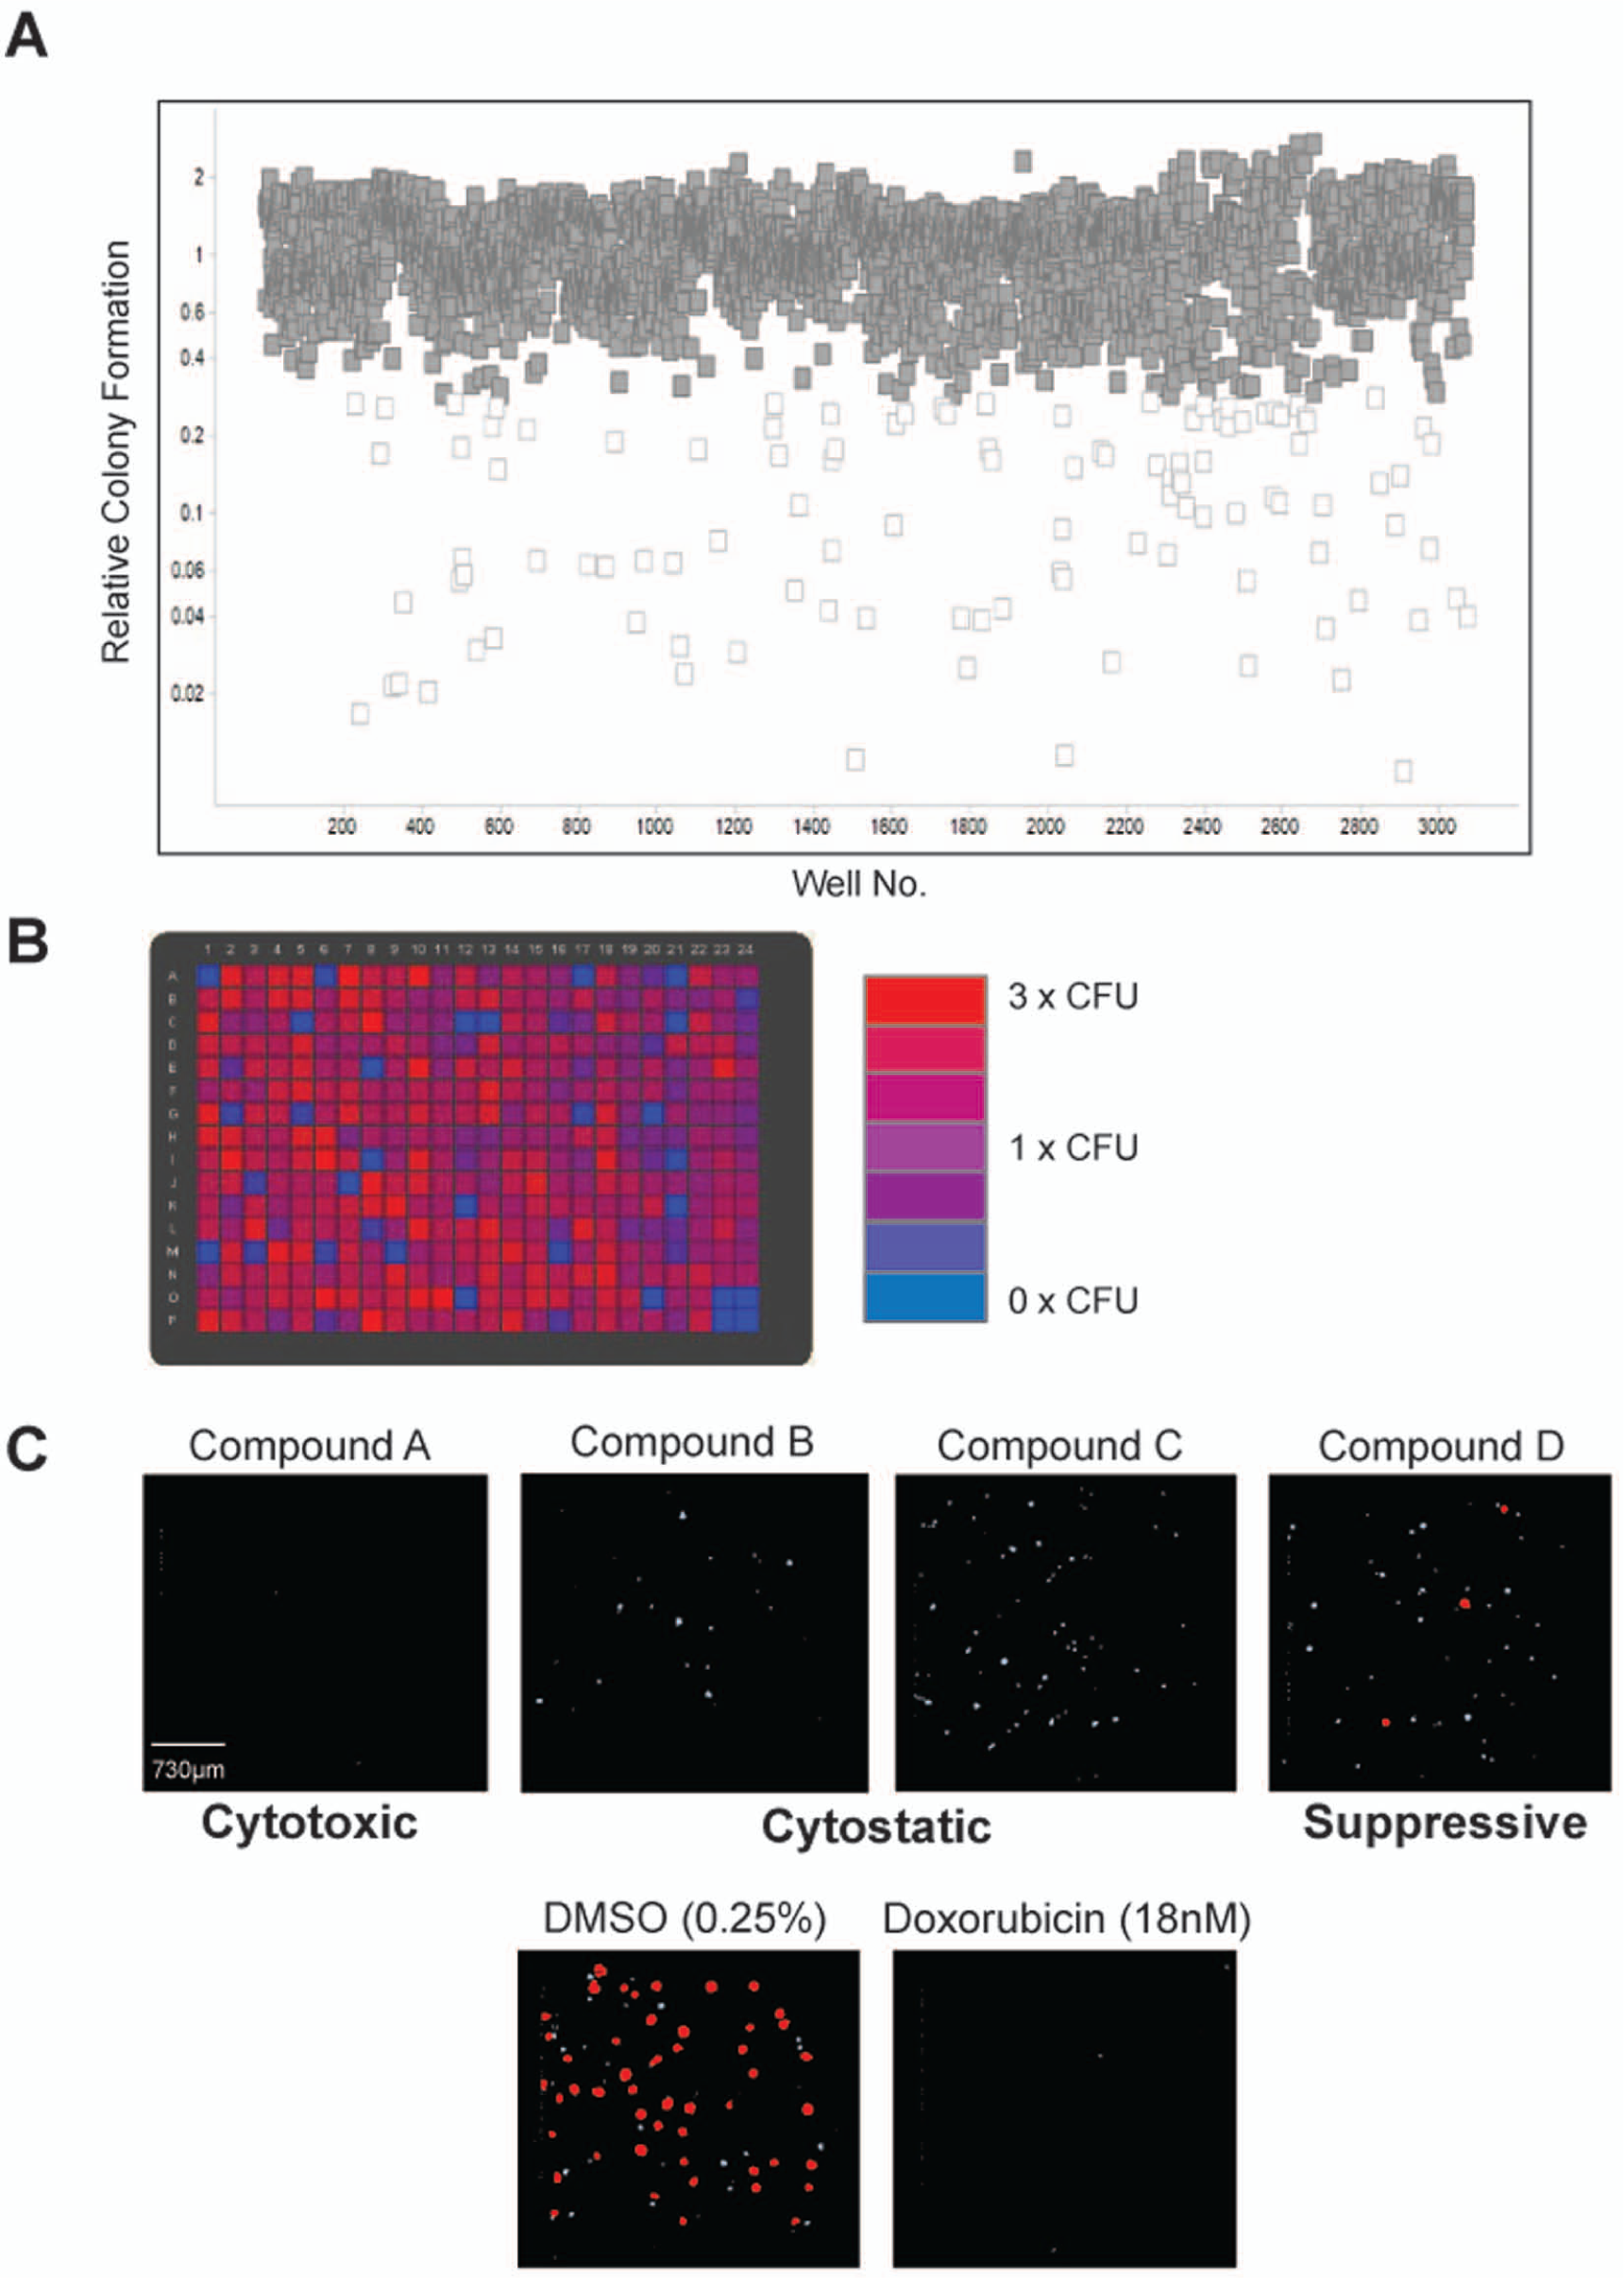
Results of the three-dimensional high-throughput colorectal cancer soft agar colony formation natural products compound screen. (
384-Well 3D Soft Agar Co-culture Reconfirmation Screen
Compounds demonstrating significant colony antagonism in the primary monoculture 3D soft agar screen were rescreened in an eight-point dose response in a 384-well, 3D co-culture colony formation assay that incorporated CCD-18Co normal human colon epithelial fibroblasts. This assay was assembled in a manner identical to the primary screen with the following exceptions: CCD-18Co normal colon fibroblasts were labeled with Quantum Dots (QDot625) and plated as a 60% confluent monolayer before the addition of the soft agar middle layer containing the HCT116 tumor cells (
Fig. 4A
). In addition, a single-cell sorted clonal line of HCT116-eGFP cells were used to readout for colony formation (
Fig. 4A
). The HCT116-eGFP cell line displayed growth kinetics, colony formation, and compound sensitivity similar to the parental HCT116 cell line used for the primary screen (
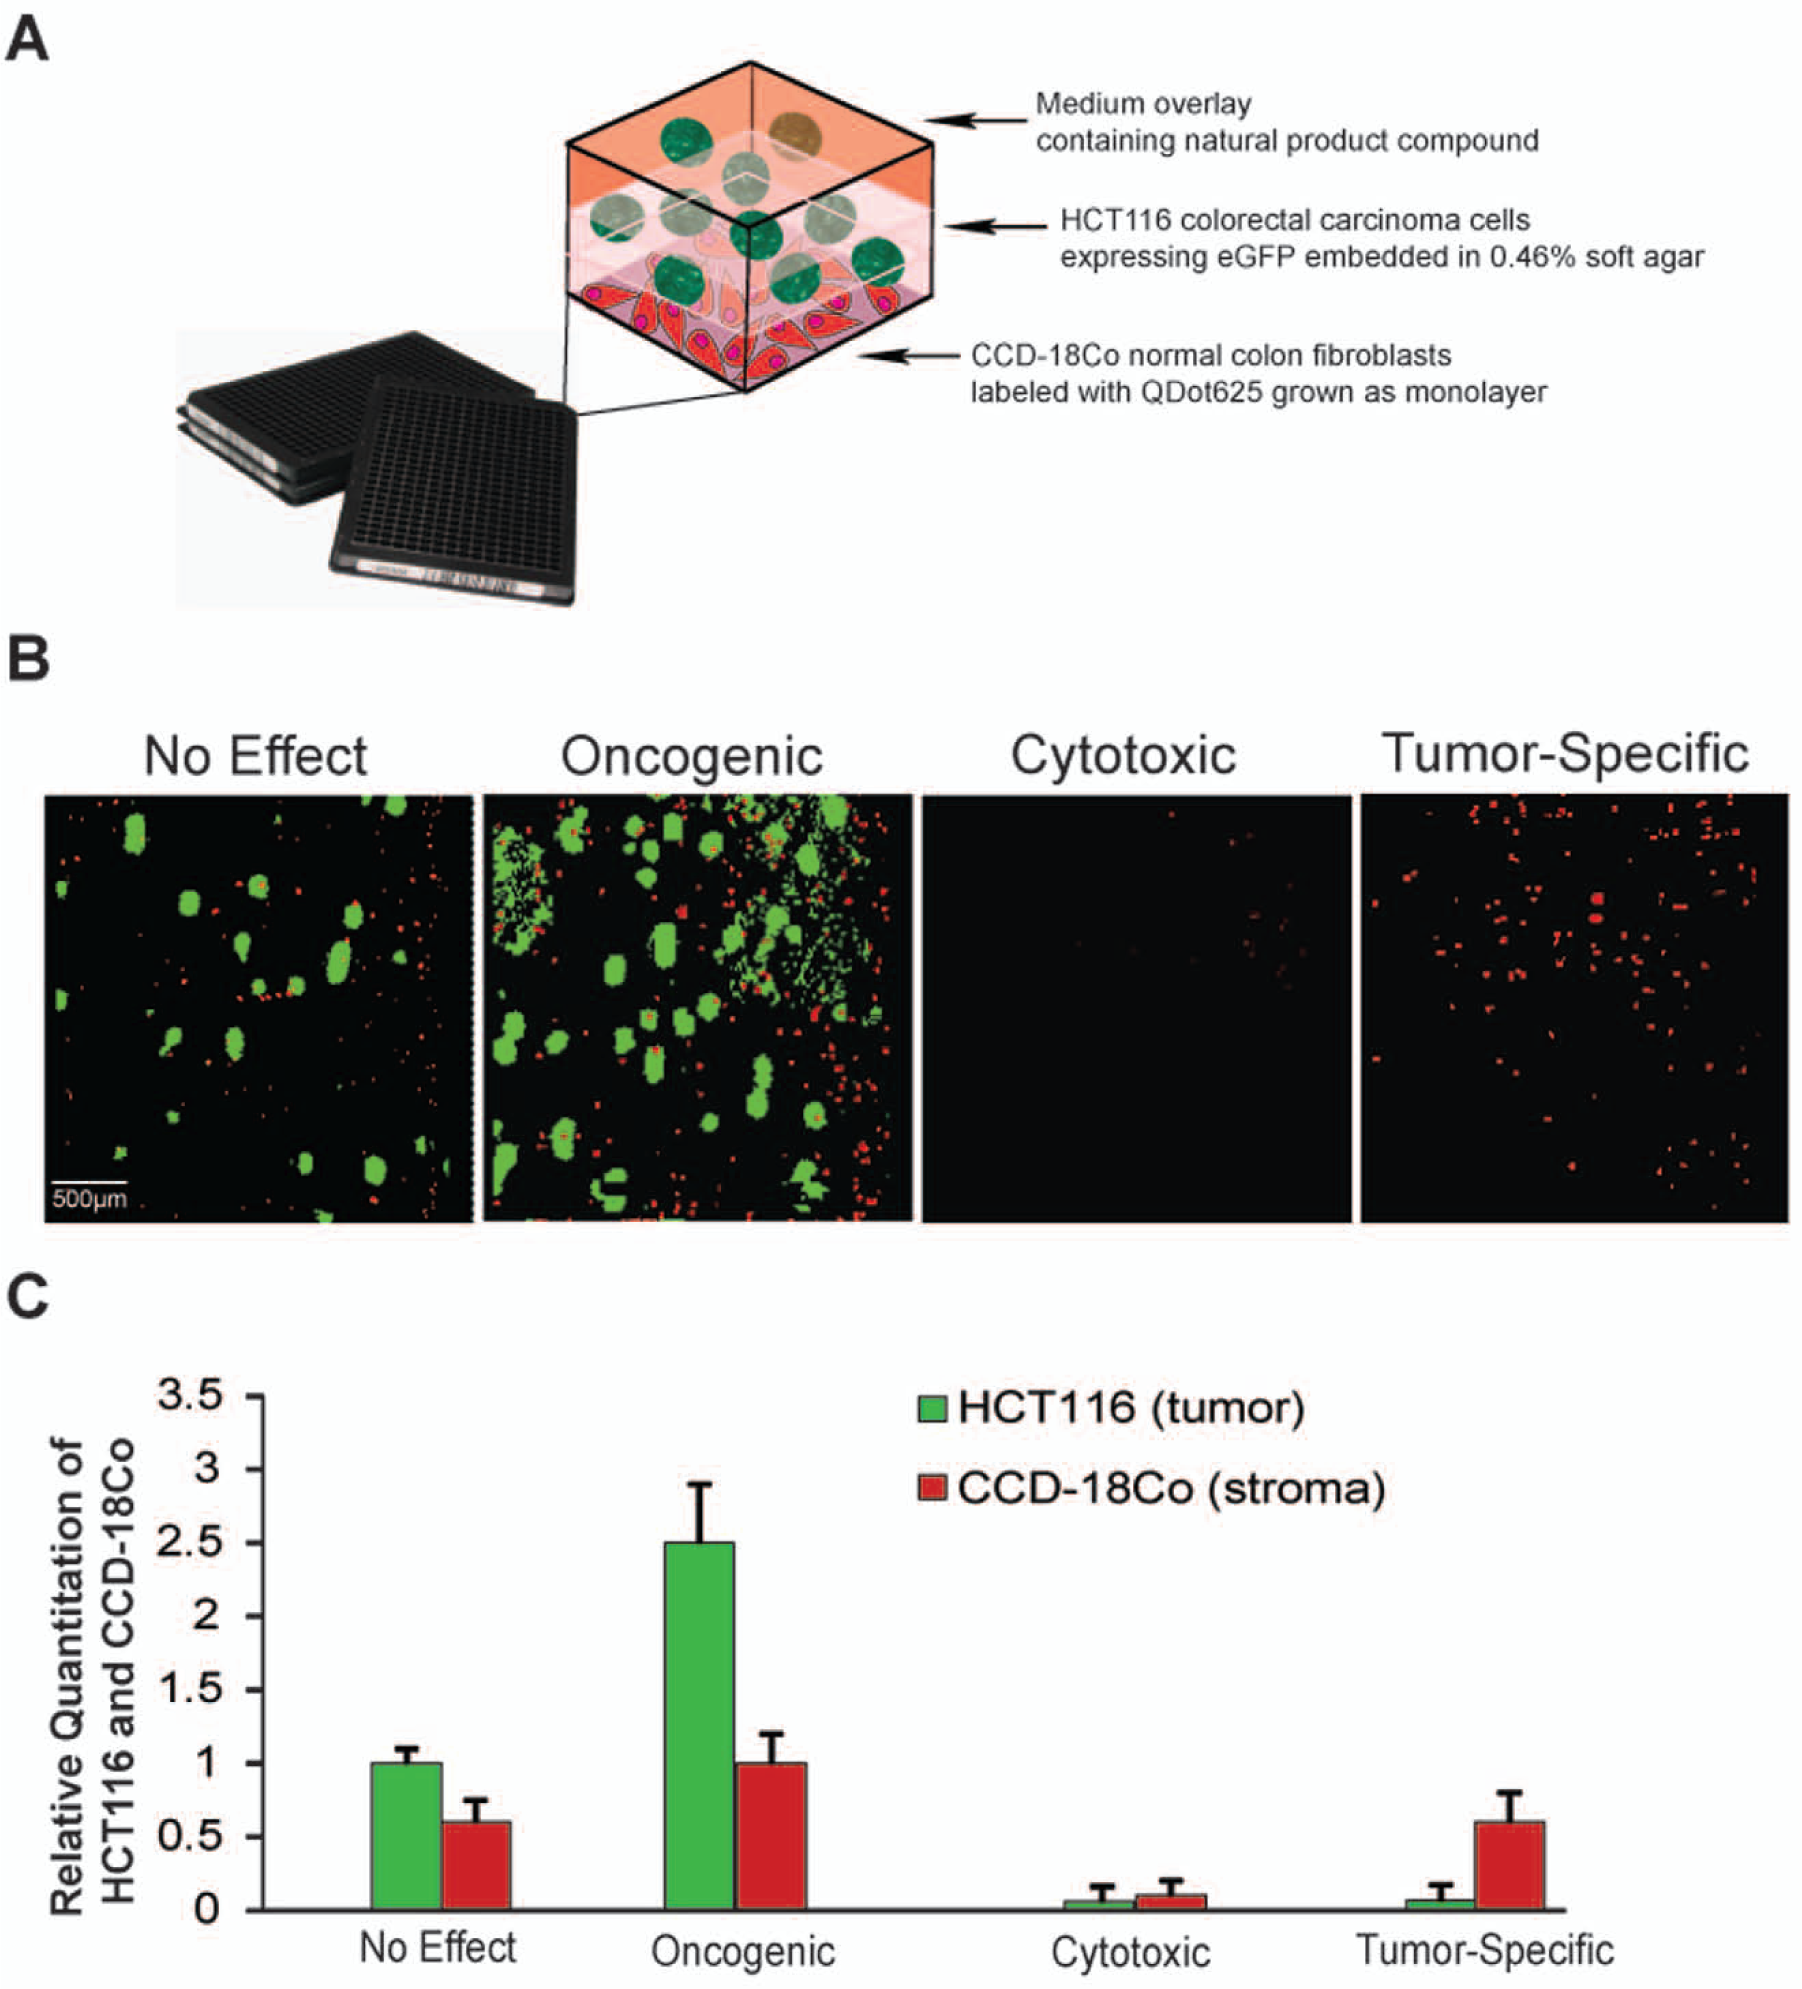
Construction and analysis of the high-throughput screening three-dimensional (3D) co-culture colony formation assay. (
Incorporation of CCD-18Co colon stromal cells into the 3D colony formation assay did not significantly affect HCT116 growth and colony formation (
A total of 83 hit compounds were rescreened in the 3D co-culture assay in eight-point dilution from 20 µM to 4 nM. We observed several examples of potential false-positive compounds that did not reconfirm in the rescreen. In fact, the false-positive rate was approximately 50%, an unexpectedly high frequency for an HTS screen. It is conceivable that the presence of the CCD-18Co stromal layer in the reconfirmation co-culture assay may have conferred some unknown growth advantage to the tumor cells in the presence of the anticancer agent. 21 However, the high false-positive rate only strengthened the necessity for a robust validating reconfirmation assay. For example, compound C exposure yielded a potent cytostatic phenotype in the primary screen (monoculture), but this phenotype was not observed in the co-culture assay ( Fig. 5A ). Powerful compounds such as microtubule inhibitors yielded virtually identical inhibitory values between tumor cells and stromal cells, demonstrating potent cytotoxic properties ( Fig. 5A , compound A). An example of a compound that displayed tumor-specific properties can be found with compound D, which showed strong inhibition of tumor cell colony formation at low nanomolar doses but did not affect the stromal cell population even at 20 µM doses ( Fig. 5A , compound D). Of the 83 compounds tested in the rescreen, 30 showed inhibition of HCT116 colony formation with IC50 values less than 1 µM, and these compounds were triaged according to the differential in their respective IC50 values between HCT116 tumor cells and CCD-18Co stromal cells ( Fig. 5B ). For example, compound D demonstrated a potential 3 log therapeutic window between tumor and stroma ( Fig. 5C ). Compounds selected for further analysis based on potent and selective inhibition of tumor cell colony formation were counterscreened for growth inhibitory effects on HCT116 tumor cells grown in a 2D monolayer. Of those tested for effects in 2D, eight demonstrated growth inhibitory properties only on HCT116 cells grown in 3D with no observable 2D phenotype up to 10 µM ( Fig. 5D ), suggesting activity against pathways or mechanisms required for cellular growth in 3D alone.
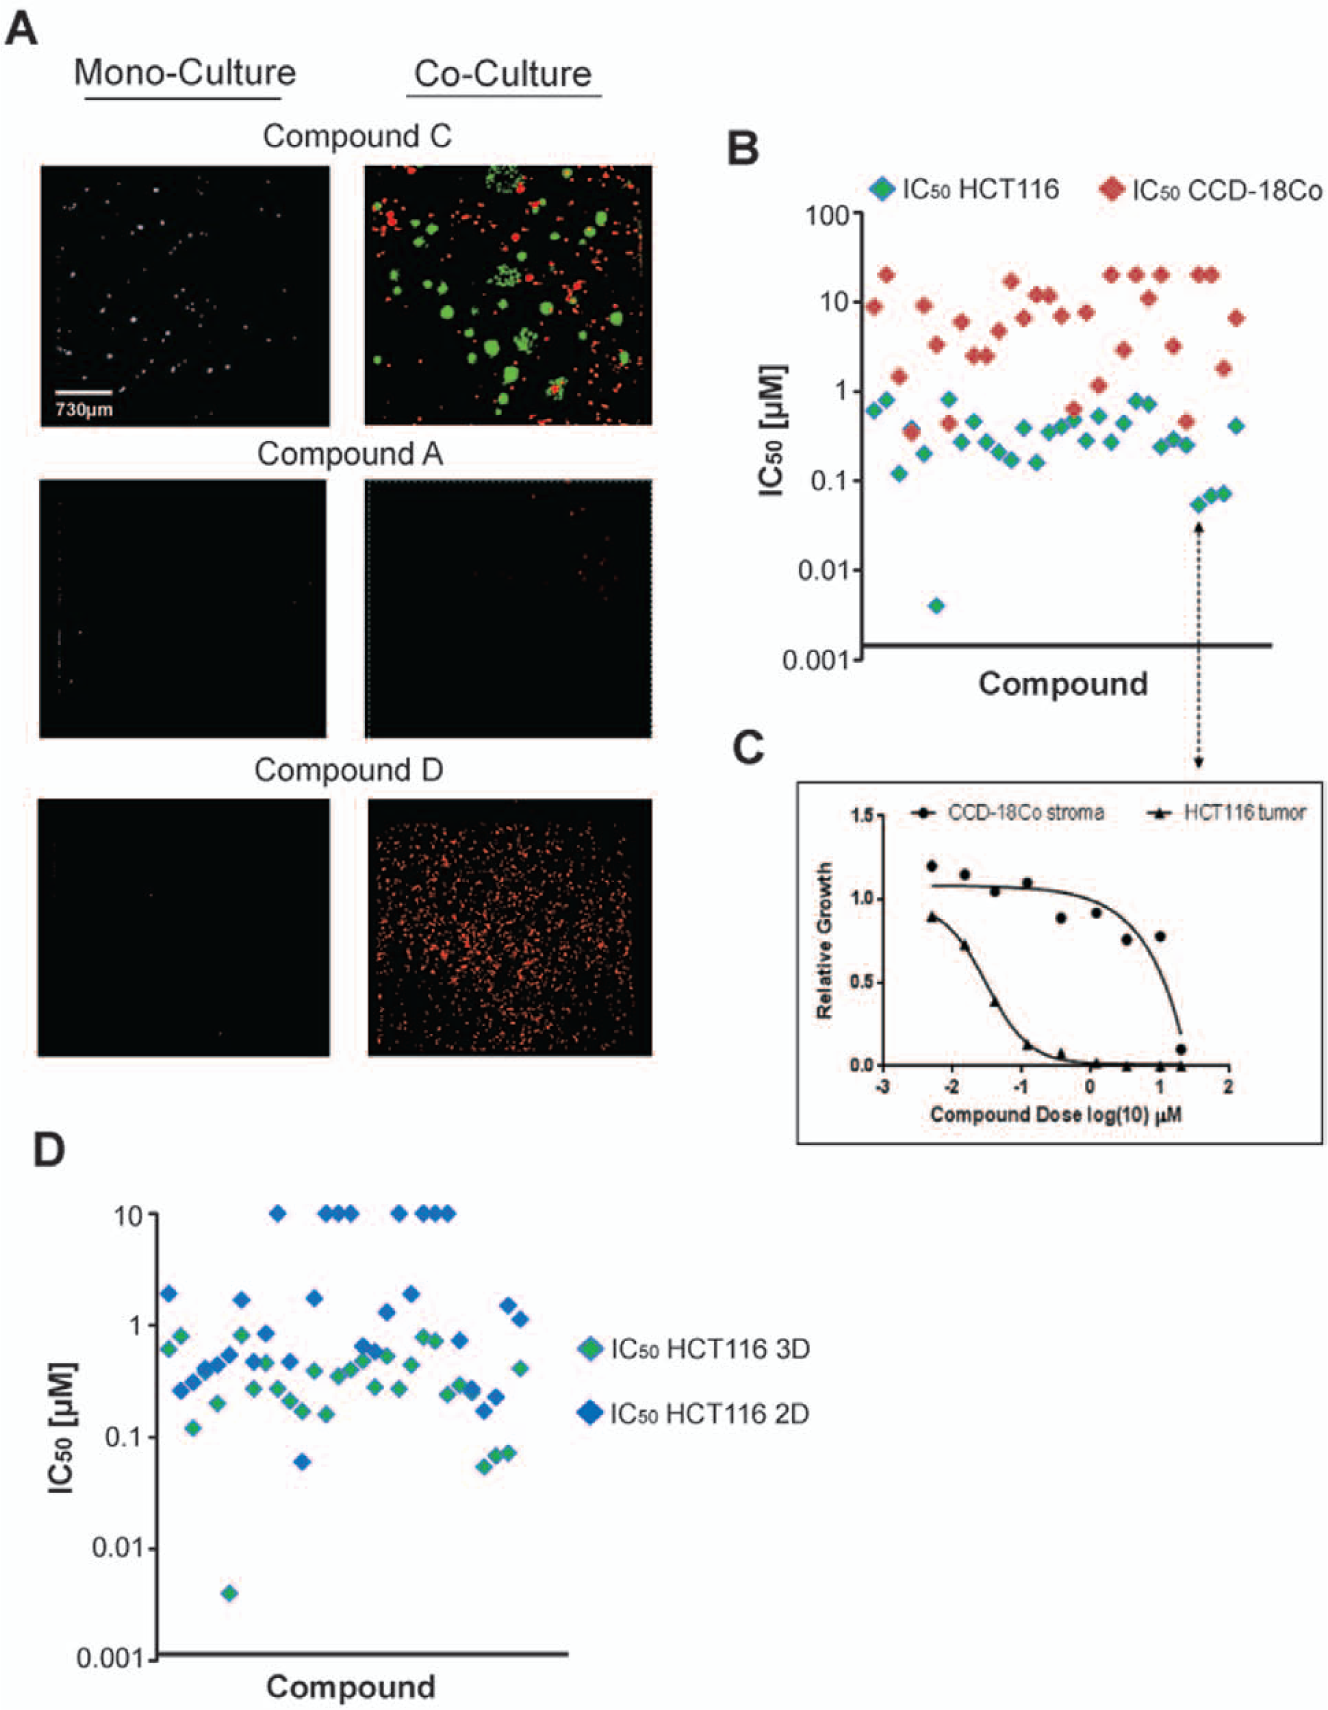
Results of three-dimensional (3D) co-culture reconfirmation and 2D counterscreen. (
Discussion
The high-content 3D co-culture soft agar colony formation platform presented here expands on earlier work in the field by adopting a laser-scanning image cytometer for colony formation readout. Contrary to previous high-content colony formation screens that used metabolically reactive dyes or high-content imagers to measure colony formation, our assay took advantage of the ease and speed of the Acumen fluorescence laser-scanning cytometer. We have demonstrated that this technology may be vastly superior to other types of readout based on its differentiation of cell populations, instantaneous acquisition of whole-well 3D population characteristics, speed at reading 384-well microplates, and user-friendly software.
The HTS 3D co-culture model presented here incorporates normal human colon fibroblasts in conjunction with colon tumor cells for a simultaneous readout of compound toxicity. There are myriad data that implicate the active participation of tumor stroma in tumorigenesis, 27 but there is a paucity of organotypic models that account for the cellular complexity and heterogeneity of animal models. Although several 3D co-culture systems have been developed to explore the molecular interactions between tumor cells, fibroblasts, and the extracellular matrix,28,29 this report represents the first of these models to be miniaturized to the 384-well microplate and incorporated into contemporary high-content drug discovery screening. By including tumor and stroma in the same matrix, we were able to simultaneously obtain activity and toxicity data and potential therapeutic windows of test compounds. Moreover, the screening system developed here is highly adaptable to screening tumor/stroma pairs in other organ systems such as breast or lung and may be expanded to include three or more cell types, for example, activated immune components. It has been shown that stroma may confer resistance to molecularly targeted cancer cells, 21 a phenomenon that may have been revealed here by the exceptionally high false-positive rate of compounds in the primary monoculture screen compared with the co-culture reconfirmation screen.
The HTS assay described here takes into account the 3-dimensional growth of tumor cells in a scaffolding matrix in addition to tumor/stroma paracrine signaling interactions and better mimics the in vivo microenvironment. The screening of cancer cells grown in 3D may address the differential gene expression patterns of cells grown in 3D compared with 2D. Specifically, those genes involved in biological processes such as tissue development, cell adhesion, and extracellular matrix remodeling have shown differential expression in 3D compared with 2D, in contrast to genes, for example, involved in DNA repair, which fail to show significant changes30,31 and which are often the targets of conventional chemotherapies. Moreover, cancer cells cultured in 3D may shift their oncogenic signaling nodes away from those observed when grown in 2D. This behavior was observed in HER2-amplified breast cancer cells in which 3D culturing conditions induced a switch between PI3K-AKT and RAS-MAPK pathway activation. 32 These 3D-specific genes and signaling nodes represent a novel class of molecular targets that would not necessarily be discovered during conventional 2D molecular scrutiny and may make attractive candidates for future drug discovery efforts. Indeed, our work uncovered eight natural product compounds that exhibited potent antitumor properties on cancer cells grown in 3D but exhibited no effects on the same cells grown as an adherent monolayer. This phenomenon is becoming more commonplace of late, particularly in the investigation of monoclonal antibody therapies such as trastuzumab on breast cancer cell models. 32
The initial trickle of 3D-related tumor modeling literature has recently become a flood as technology has gradually caught up with the imaginations of oncology investigators. Three-dimensional soft agar screens are considerably more labor intensive than 2D screens but only negligibly more expensive (~12 cents/well for 3D and ~5 cents/well for 2D in the HTS systems described here). However, the data generated from a 3D screen may be more accurate and indicative of in vivo biology than that from a 2D screen. The most optimal situation is one in which the same cancer cells are screened through multiple platforms (both 2D and 3D) in order to cross-reference the data to obtain the highest confidence for hit reagents. Complex, yet elegant, 3D screening platforms for chemotherapeutic drug discovery, such as the one presented here, have become more ubiquitous in the current industry landscape and may facilitate the identification of patient-relevant molecular targets as well as accelerate the timeline of early-stage drug discovery initiatives.
Footnotes
Acknowledgements
We would like to thank Vy Trinh and Richard Brusch for their assistance in optimizing the Acumen readout. We also thank Diana Caracino for Acumen insight and expertise. We thank Frank Peterson and Philipp Krastel for development of the natural products compound library. We thank Loren Miraglia for assistance in determining variance metrics.
Declaration of Conflicting Interests
The authors declared no potential conflicts of interest with respect to the research, authorship, and/or publication of this article.
Funding
The authors received no financial support for the research, authorship and/or publication of this manuscript.
References
Supplementary Material
Please find the following supplemental material available below.
For Open Access articles published under a Creative Commons License, all supplemental material carries the same license as the article it is associated with.
For non-Open Access articles published, all supplemental material carries a non-exclusive license, and permission requests for re-use of supplemental material or any part of supplemental material shall be sent directly to the copyright owner as specified in the copyright notice associated with the article.