
Abstract
The use of cell colony formation assays for research and clinical applications to assess the functional integrity of cells after in vitro manipulations is extensive. Key areas include hematopoietic stem cell research, cell transformation studies, and predicting the response of tumors to chemotherapeutic agents. Traditionally, enumeration of colonies has involved laborious and subjective counting by hand using a microscope. Here, laser scanning microplate cytometry has been used to provide an automated high-content readout of the effects of cytostatic agents on colony formation. This approach determines colony number through the application of a volume algorithm. Such an approach permits the differentiation of cytostatic effects where the number of colonies and size remains constant, and cytotoxic effects where the size and number may be reduced. Application of microplate cytometry thus offers significant benefits over alternative analytical methods in the search for novel chemotherapeutic agents.
Keywords
Introduction
Cell colony formation has been found to be a more sensitive parameter of toxicity than cell viability because colony formation is assessed while the cells are in a state of proliferation, and thus more susceptible to toxic effects. 1 Enumeration of colonies has been traditionally carried out using a semisolid agarose bilayer system in petri dishes and involves manual counting on a microscope. 2 –4 These soft agar colony formation assays have been widely used to determine growth and drug sensitivity of mammalian stem cells as well as fresh human tumor material. 5 In general, use of these assays to determine drug sensitivity has been largely based upon subjective determination of the number of colonies which exceed an arbitrary size (often 60 μm in diameter) in drug-treated cultures relative to that seen in control cultures. 5
Recent advances have provided automatic number counting of bacterial and mammalian colonies using digital color cameras, which with the accompanying software, allows a number of different colony colors to be distinguished. 6 –8
More advanced image analysis systems are unable to offer colony counting on a whole well basis due to the imaging of small well areas, typically less than 1 mm x 1 mm. The Acumen Explorer laser scanning fluorescence microplate cytometer (TTP LabTech Ltd, Melbourn, UK) is a nonconfocal system, permitting area-based scanning of fluorescent objects in whole wells, without the need of a nuclear stain required by image platforms. It also does not need to refocus between wells, enabling high scan speeds on any Society of Biomolecular Screening standard plate. Here, an Acumen Explorer has been used to provide an automated high-content whole well readout from 24-well plates to determine the time course and effects of the cytostatic agent staurosporine on colony formation of HT1080 cells. The Acumen Explorer software determines colony number through the application of a volume algorithm, which utilizes the minimum and maximum distance across a scanned object to estimate the volume of cells it contains. The use of volume as an assay readout has been shown to be more representative of cell colony formation in vivo since it correlates well with the growth of higher stage and higher grade tumors not supported by simply counting the number of colonies above a certain size. 9
Materials and Methods
Cell Culture
Cells from the human fibrosarcoma cell line, HT1080 (The European Collection of Cell Cultures, Porton Down, UK), were routinely cultured in Dulbecco's Modified Eagle Medium, supplemented by 10% (v/v) fetal calf serum, 100 units/mL penicillin, 100 μg/mL streptomycin, and 2 mM L-glutamine. Cells were passaged prior to achieving full confluency. All culture media and supplements were purchased from Invitrogen, Paisley, UK.
Assay Plate Preparation
In a 24-well tissue culture plate, a 300 μL base layer of 0.5% (w/v) agarose was prepared by adding autoclaved 1% (w/v) agarose solution to 2x DMEM medium supplemented with 20% fetal calf serum in a 1:1 ratio. HT1080 cells that had attained 80% confluency in a T75 tissue culture flask were carefully washed twice in prewarmed phosphate buffered saline, lifted by adding 5 mL trypsin/ethylenedi-aminetetraacetic acid solution, and incubated for 5 min at 37°C. The cell suspension was removed and spun down in a centrifuge for 10 min at 500 x g. The cells were resuspended in 5 mL of prewarmed cell culture medium and the number of cells determined by counting using a Neubauer 0.1-mm-depth hemocytometer. The volume of the cell suspension was adjusted to achieve a cell concentration of 2.5 × 10⁶ cells/mL with prewarmed cell culture medium. A working cell suspension containing 2.5 × 10⁴ cells/mL was prepared in a 1:1 mixture of 0.7% (w/v) agarose solution and 2x DMEM supplemented with 20% FCS. Cell suspension (400 μL) was added to the top of the base layer, allowed to solidify, and the plate was incubated overnight at 37°C/5% CO2. The following day, 400 μL of 2x dilutions of test compounds in media were added to appropriate wells.
Colony Identification
The cultures were microscopically monitored for colony formation and at selected time points, the cells were stained with 0.5 μM calcein-AM (Molecular Probes, Eugene, IR) for 30 min. The plate was scanned for colonies using an Acumen Explorer fluorescence microplate cytometer.
The fluorescence microscope was integrated with the microplate cytometer, providing a visual image link between the Acumen Explorer software algorithms used for cell analysis and cellular staining images observed microscopically. Following scanning of the microplate, the plate was removed and repositioned onto a powered microscope stage. Using the software, the stage automatically positioned the microplate so that fluorescent objects selected in the Acumen Explorer software appeared in the central area of the eyepiece on the microscope. As different objects were selected, the stage moved accordingly. Colonies were defined by identifying clumps consisting of 20 cells or more in control wells using a fluorescence microscope and a graticule. Using the Acumen Explorer software, the mean volume of these colonies was determined to provide a threshold for classification of colonies in all other wells. The formula used for calculation of colony volume was:

where Radiusmin = minor axis length/2, Radiusmax = major axis length/2 and Radiusdepth = (Radiusmin + Radiusmax)/2 as defined in the Acumen Explorer software.
Results and Discussion
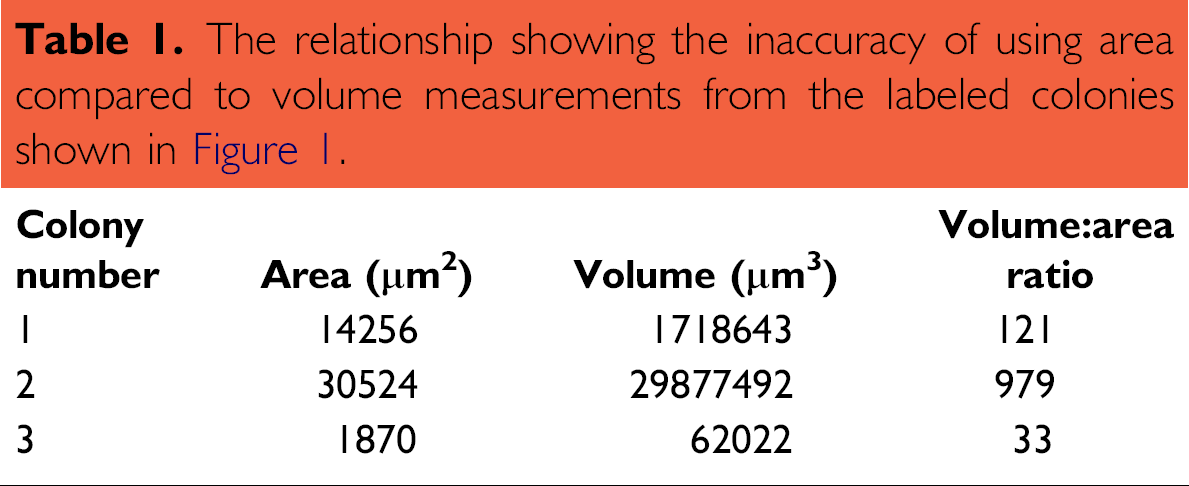
One of the major advantages of using this technique is that the user can reliably determine the number of cells required to distinguish between a cluster of cells and a colony. In this study, cell colonies of interest were deemed to be those containing more than 20 cells. As can be seen in 1 , even small colonies (label 3) are easily discriminated from clusters of less than 20 cells (green). In standard methods, the differing orientation of the colony can make identification more difficult when using a graticule, especially when the colony is orientated in a diagonal manner (for an example see colony 2 in Fig. 1). As the Acumen Explorer microplate cytometer identifies all fluorescent objects in a well, independently of orientation, this method means that all colonies are more accurately identified and classified as colonies or cell clusters. This is principally achieved by using the minimum and maximum distances across a scanned object (minimum and major axis lengths) for volume calculation: such parameters are not easily calculated using a conventional cross-shaped graticule in a microscope eyepiece. The volume algorithm also accounts for different shaped colonies, such as those labeled 1, 2, and 3, and is thus not dependent on all the colonies having a similar shape. In Table 1 the area and volume measurements are detailed for each of the colonies labeled in Figure 1. The table shows that using area as a parameter underestimates the size of the colony when compared to using volume. This is exemplified for colony 2, which has a greater volume:area ratio than either colony 1 or 3, due in part to its complex shape and orientation within the well.
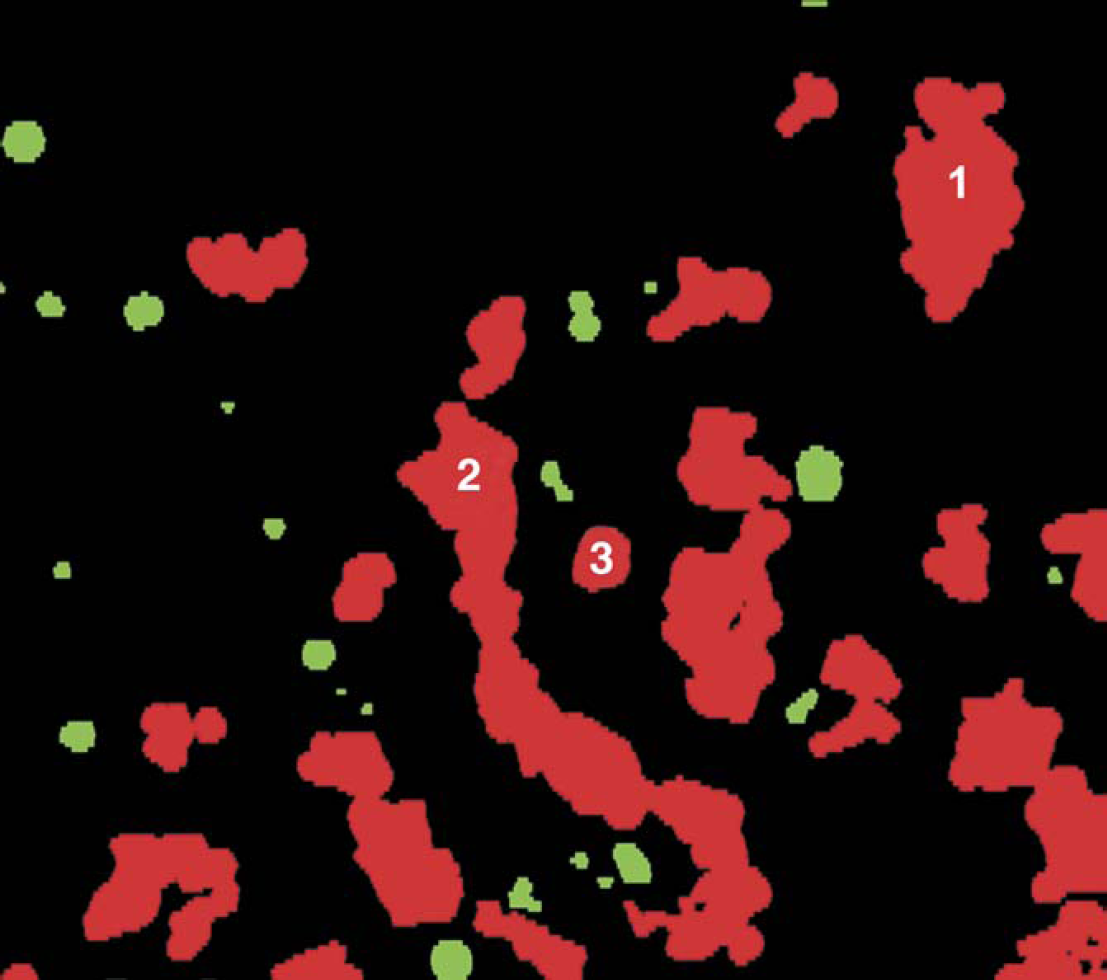
Colonies containing more than 20 cells were identified and classified as a colony.
The relationship showing the inaccuracy of using area compared to volume measurements from the labeled colonies shown in Figure 1.
Using the volume algorithm on the microplate cytometer, the formation of colonies and cell clumps was rapidly determined. Figure 2a shows a virtual well view of HT1080 cells at day 0. The cells shown are individual cells as can be seen by their size in Figure 2b. At day 14, the cells have formed colonies and the well view shown in Figure 2c displays a distinct set of colonies and formations of cell clumps. As image-based systems utilize microscope objectives, colonies larger than the field of view cannot be captured in a single image for analysis. Since the Acumen Explorer is capable of rapidly scanning the entire well area, the field of view is not limiting and all colonies, regardless of size, can be accurately determined. The data is thus more representative as the growth of every colony in the well is measured. This feature is particularly important where the colony formation is being observed over a prolonged time course.
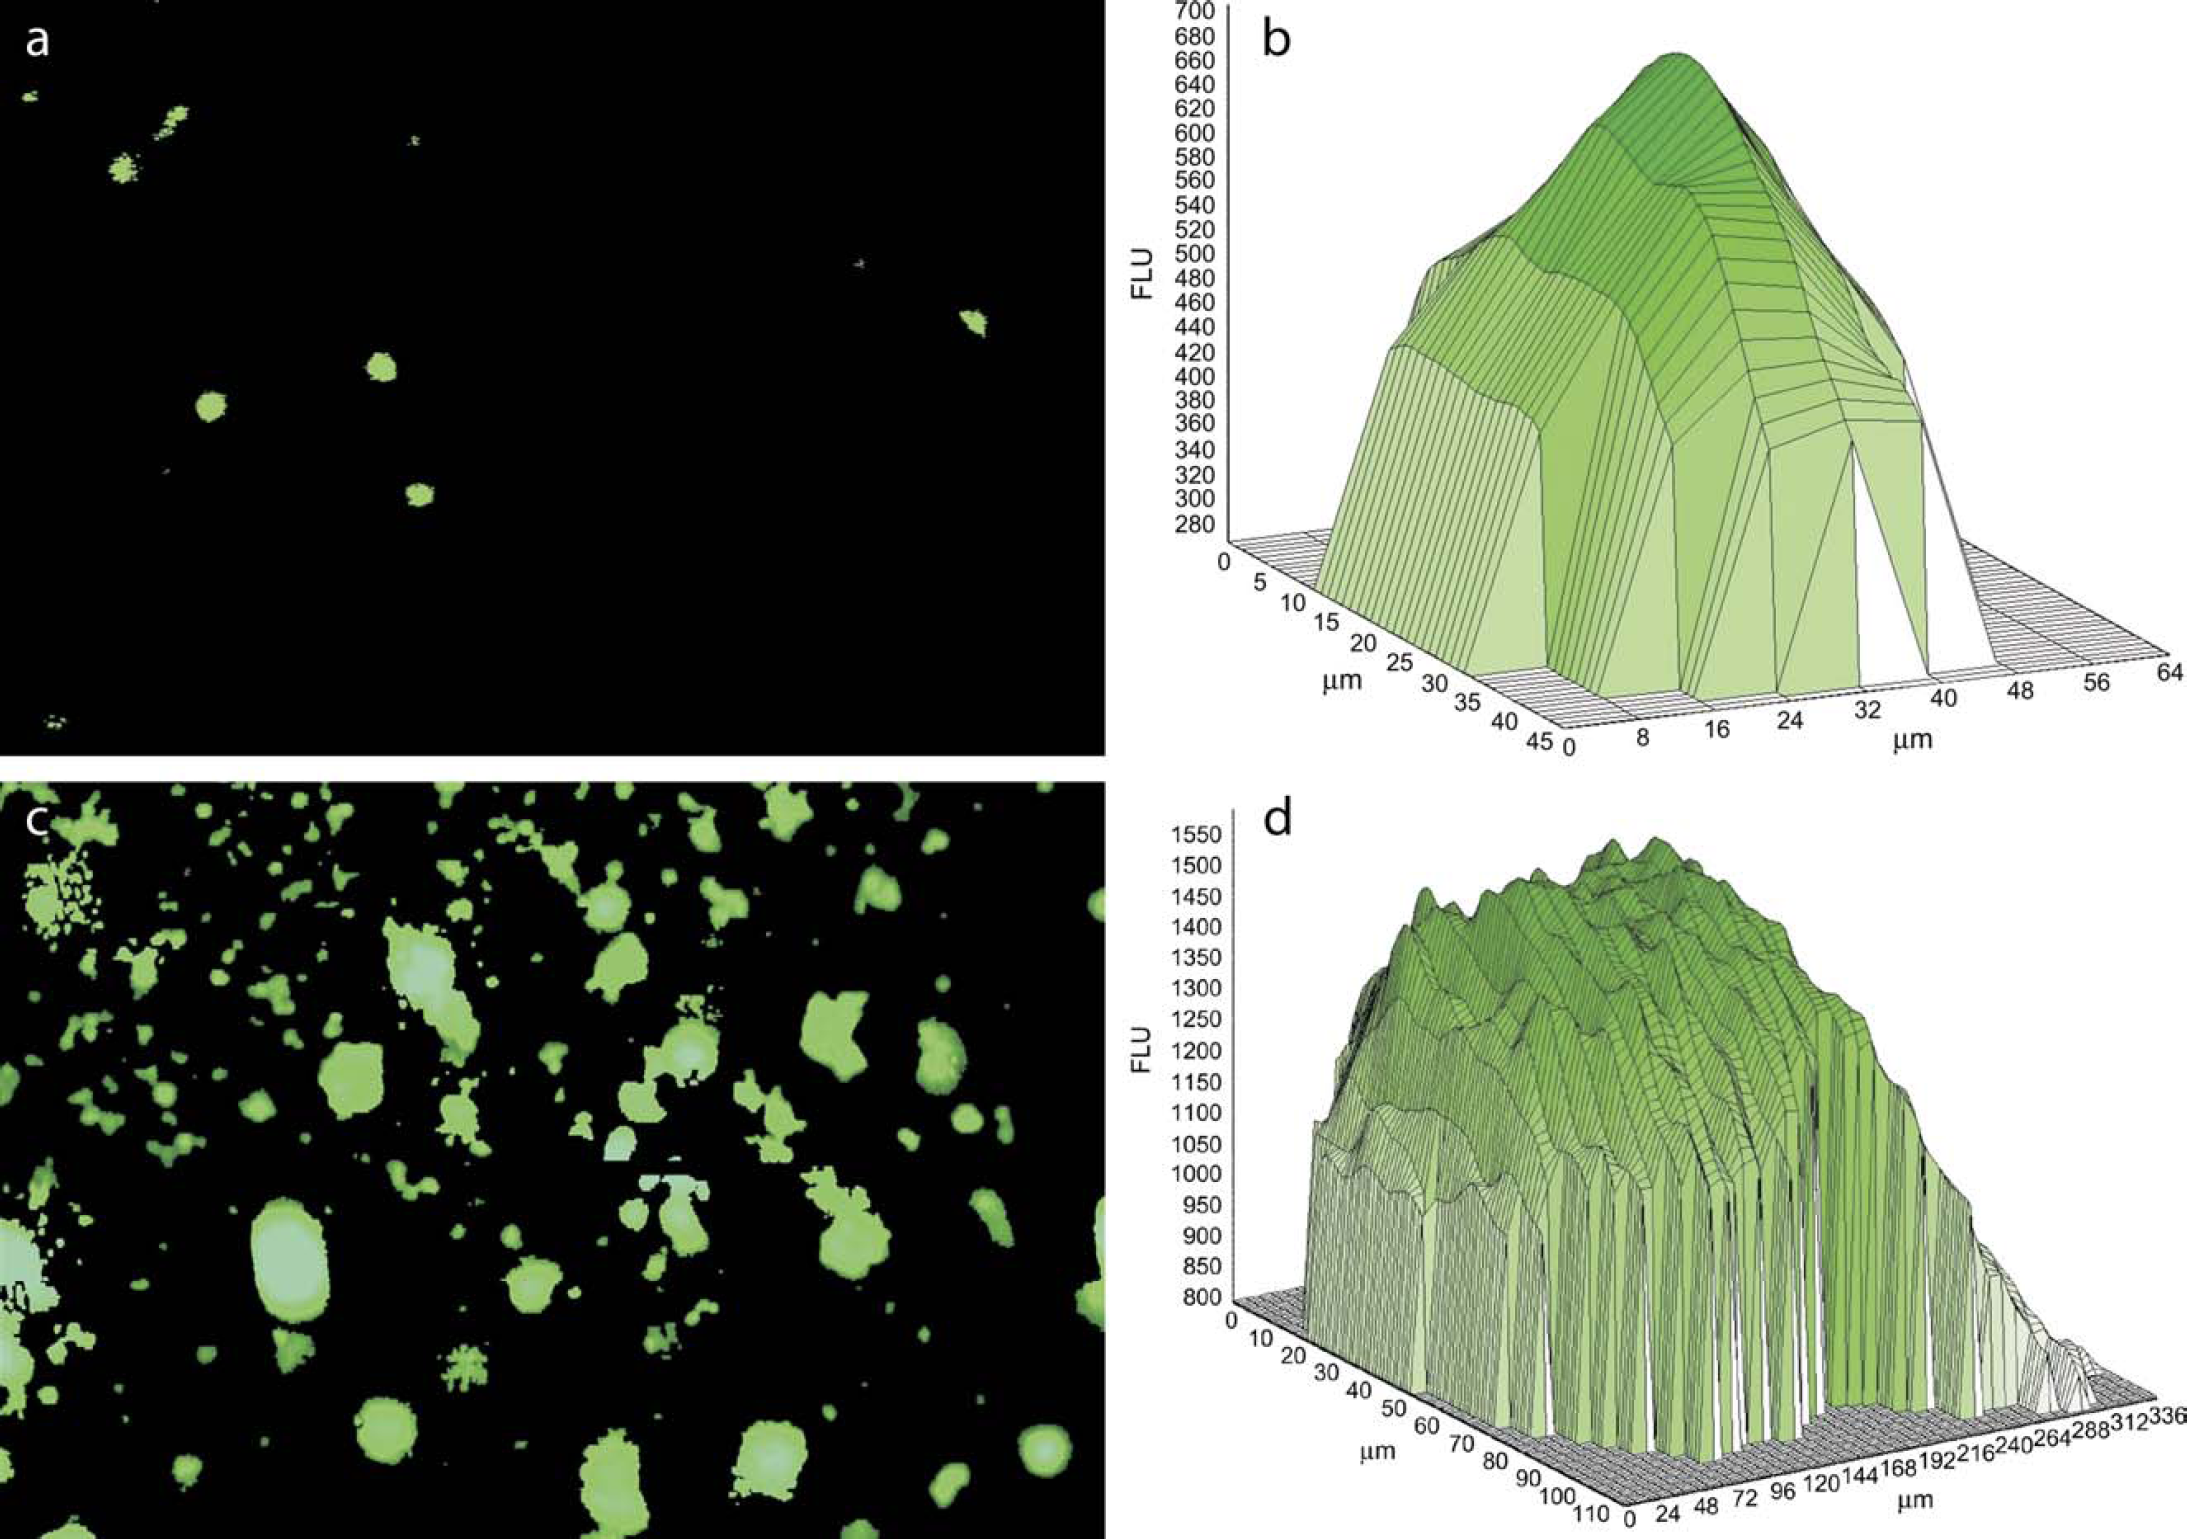
(a) Acumen Explorer well view showing individual HT1080 cells at day 0; (b) corresponding fluorescent profile of a single cell, at day 14 cell colonies have formed; (c) well view of HT1080 colonies; and (d) fluorescent profile of a cell colony.
Using the described method, the time course of colony formation in HT1080 cells was investigated. As seen in Figure 3, there was a distinct and easily determinable increase in the number of colonies over 14 days using this method. Subsequently, the effects of the cytostatic agent staurosporine on colony formation of HT1080 cells were studied. Staurosporine was added at day 0 and the plate read at day 12. As shown in Figure 4, there was a distinct concentration-dependence curve for staurosporine-induced inhibition of HT1080 colony formation after 12 days, with a pEC50 value of 9.85. This assay was run with plate read and analysis times in the region of 10 min per plate, allowing for up to 1100 data points per day to be determined. Preliminary studies have shown that this method is transferable to a 96-well plate format, which allows for a fourfold increase in the throughput values to those obtained in 24-well plates (data not shown).
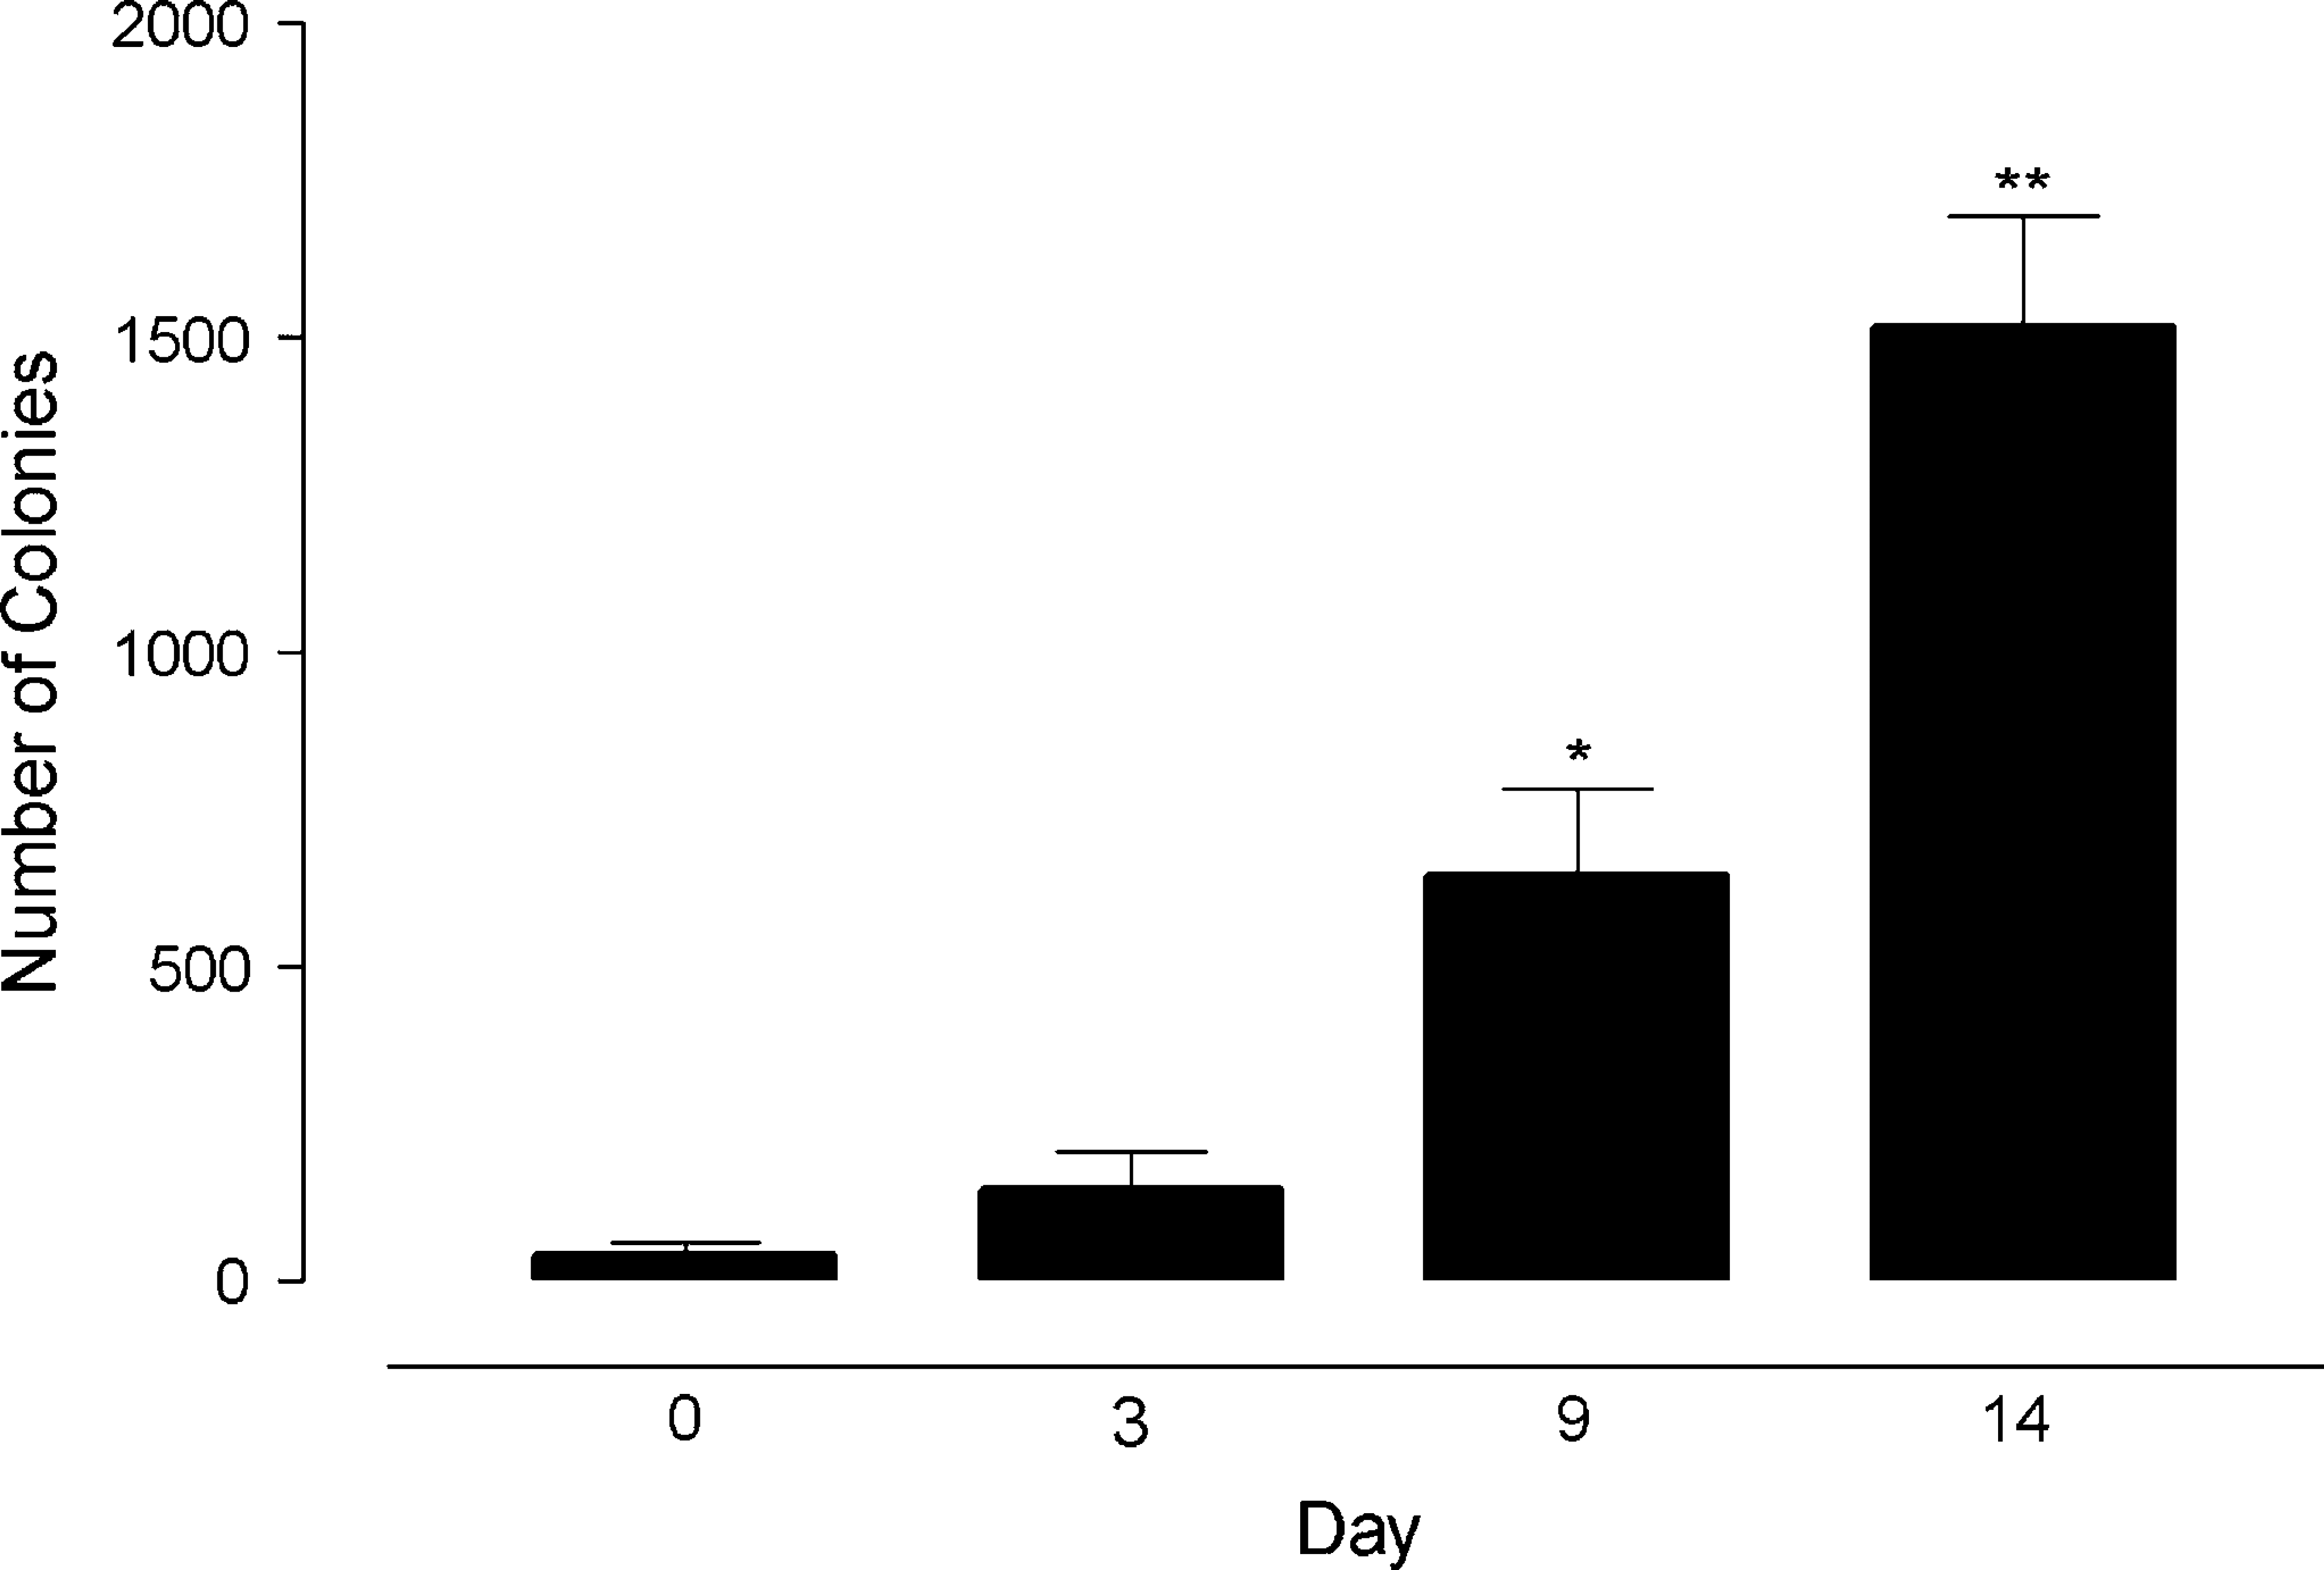
Time course of colony formation by HT1080 cells. (data represents mean ± standard error of the mean of results obtained from three separate experiments). *Indicates significance at p < 0.05 over data at day 0 and **indicates significance over data at day 0 at = p < 0.01 ANOVA with Bonferroni's multiple comparison test.
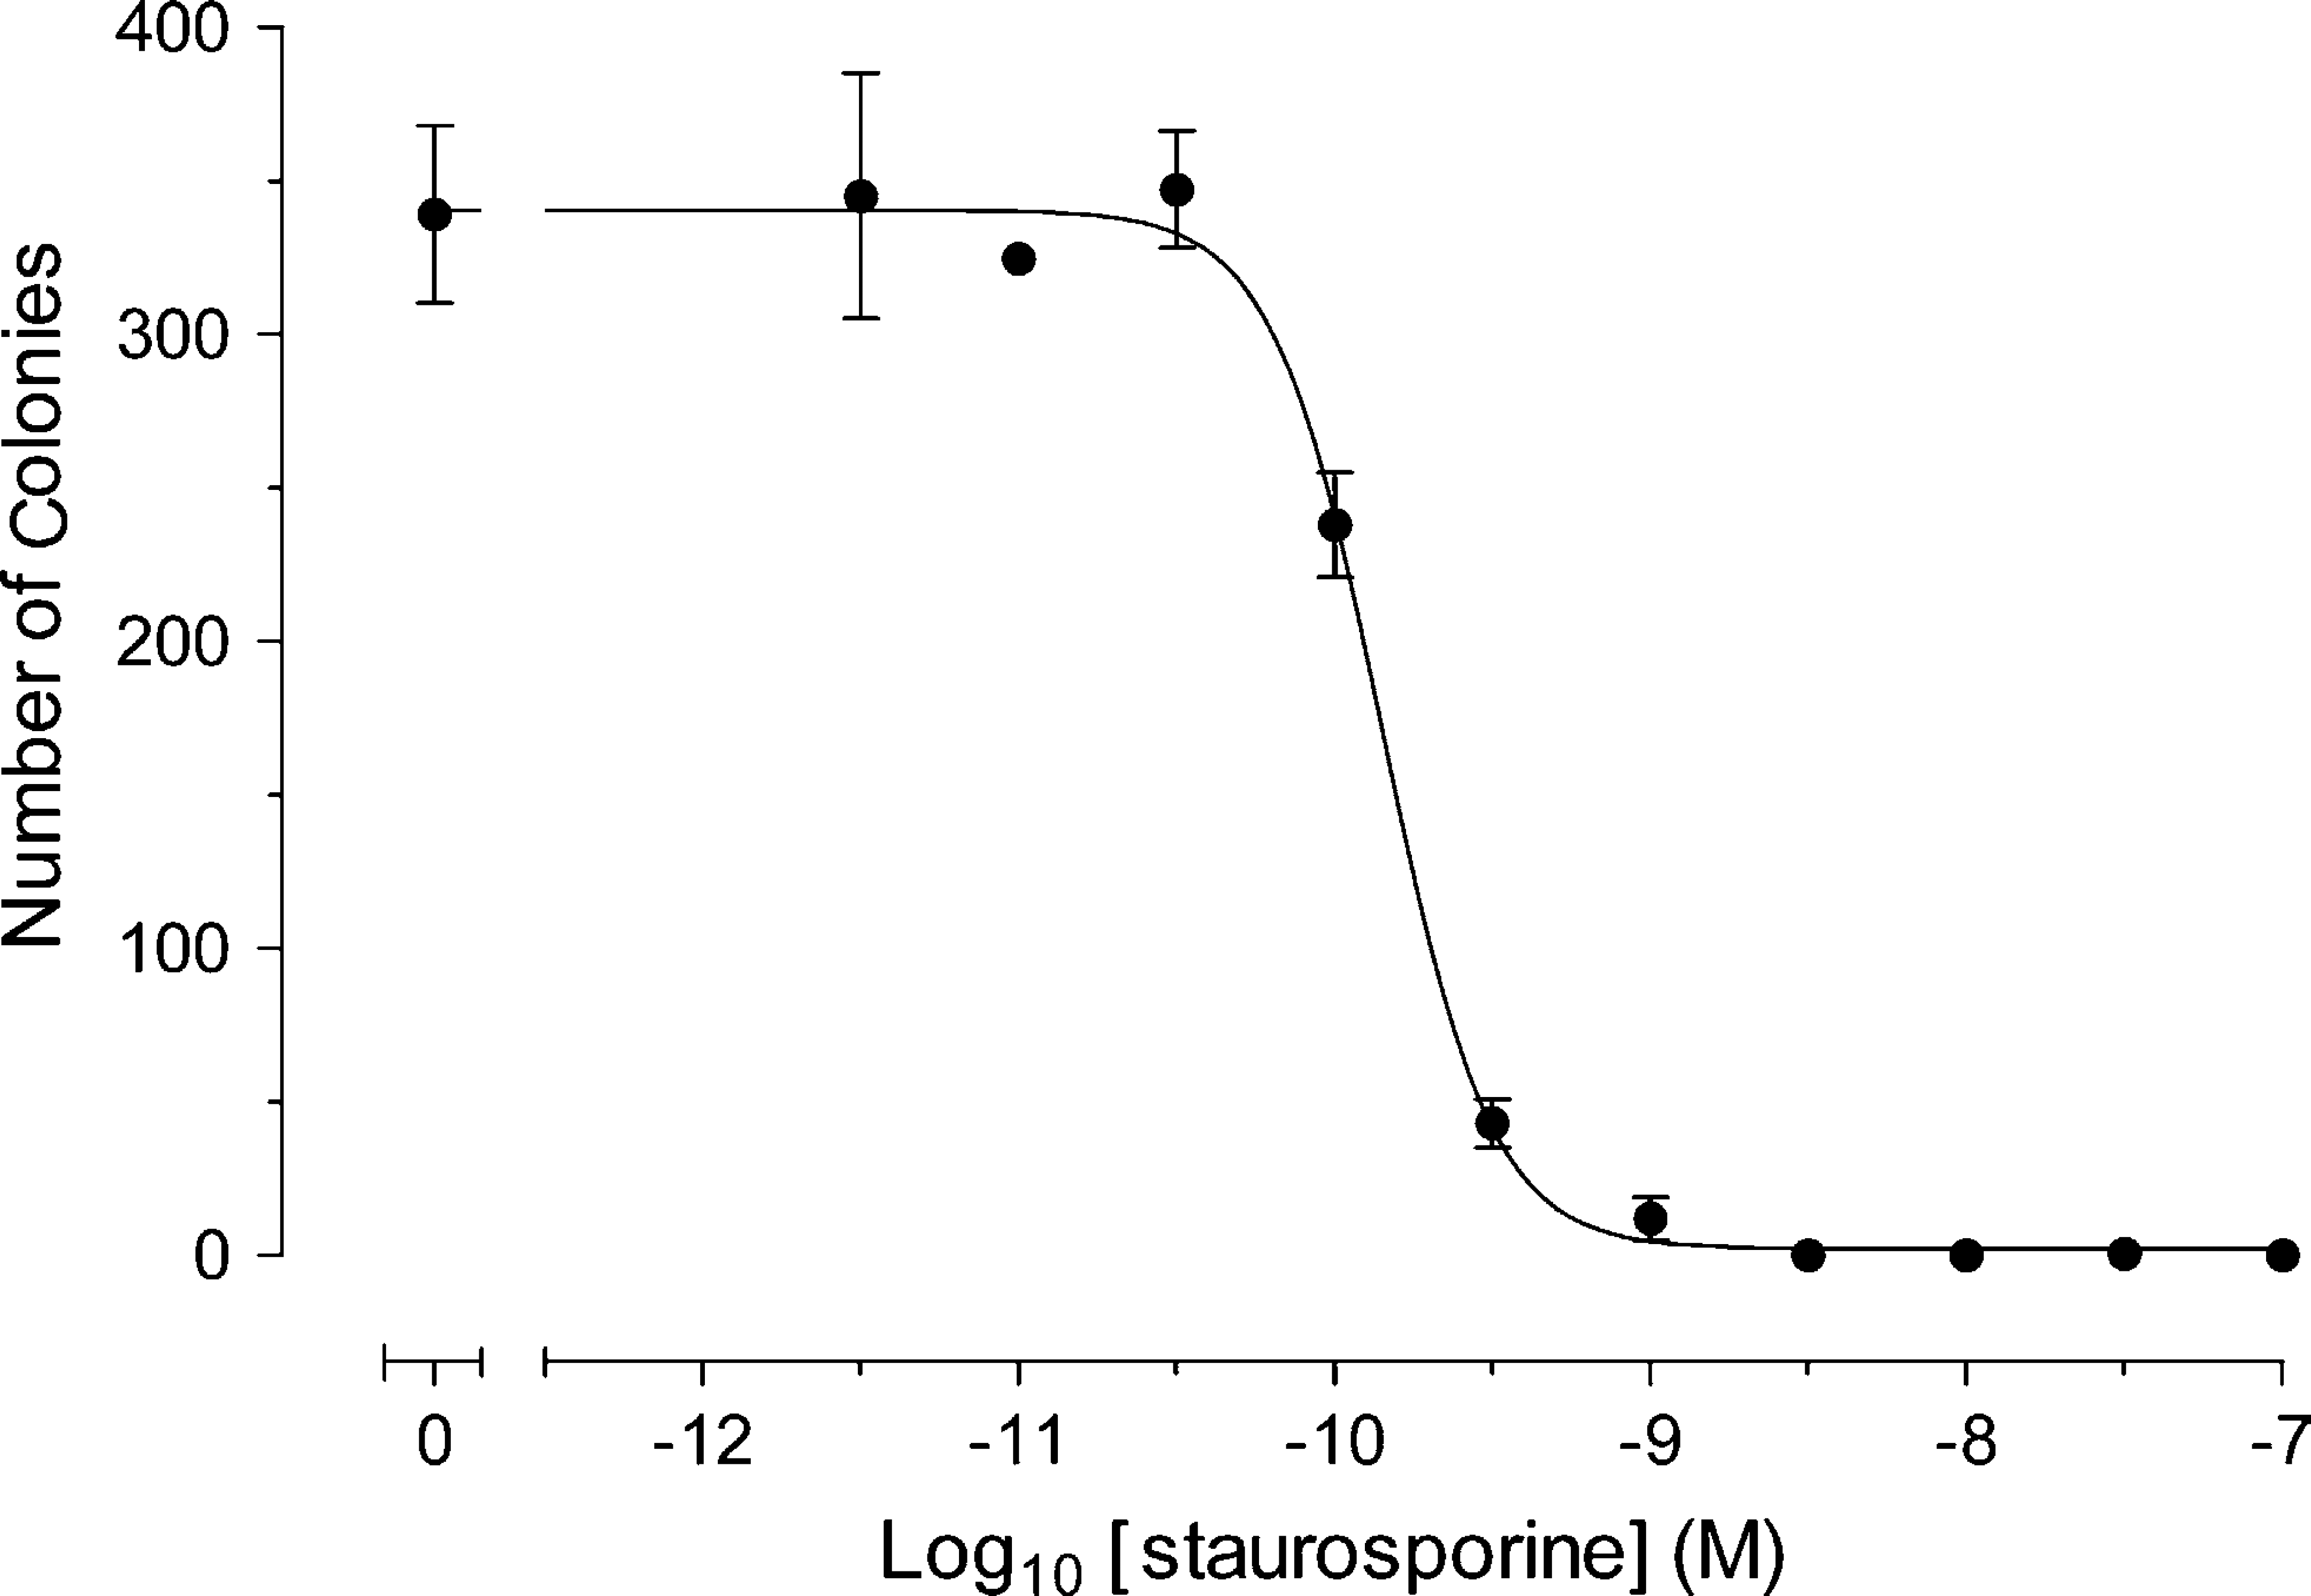
Concentration-dependence curve of staurosporine-induced inhibition of HT1080 colony formation after 12 days (data represents mean ± SEM of results obtained from three separate experiments).
In this study, an Acumen Explorer fluorescence micro-plate cytometer and a volume algorithm have been successfully used to determine cell colony formation. This method allows rapid enumeration of colony number suitable for higher throughput compound assessment than current microscope-based methods. The method enabled determination of the time course of HT1080 colony formation in a 24-well plate and its inhibition by staurosporine. The assay provides a simple, high-content and high-throughput method for predicting the response of tumors to chemotherapeutic agents.