
Abstract
For drug discovery, cell-based assays are becoming increasingly complex to mimic more realistically the nature of biological processes and their diversifications in diseases. Multicellular co-cultures embedded in a three-dimensional (3D) matrix have been explored in oncology to more closely approximate the physiology of the human tumor microenvironment. High-content analysis is the ideal technology to characterize these complex biological systems, although running such complex assays at higher throughput is a major endeavor. Here, we report on adapting a 3D tumor co-culture growth assay to automated microscopy, and we compare various imaging platforms (confocal vs. nonconfocal) with correlating automated image analysis solutions to identify optimal conditions and settings for future larger scaled screening campaigns. The optimized protocol has been validated in repeated runs where established anticancer drugs have been evaluated for performance in this innovative assay.
Introduction
For research or drug discovery in oncology, large-compound collections are currently screened in target-directed in vitro assays, using two-dimensional (2D) monolayer cultures, or in vivo, using human xenografts in immunocompromised rodents. These assays represent the primary platforms for biological or pharmacological drug activity. Cell monolayers are physiologically dissimilar when compared to three-dimensional (3D) human tissues or tumors ( Fig. 1 ),1–4 and anticancer compounds have been shown to act with different potencies in 2D versus 3D in various models.5–7 Solid tumors are composed of tumor cells and the normal cells of the stroma, which consists of several cell types such as cells for vascularization, immune cells, and fibroblastic cells. 8 The extracellular matrix (ECM), which is considered part of the stroma, has been shown to activate signaling pathways. Many parameters such as stiffness, pH, oxygen, glucose, and growth factors are intentionally misaligned in standard 2D cell cultures to maximize tumor cell growth and viability of 2D monocultures. Interaction of extracellular matrix, other cell types, or the immune system is scant or completely absent, and proliferation rates of such cancer cells growing on 2D surfaces are immensely accelerated compared with observed tumor cell growth rates in patients. Taken together, monolayer cell cultures represent a poor and outdated physiological model for human cancer, and their use for new drug screening may, in part, contribute to the low predictability of these 2D models for animal studies and clinical trials.9,10
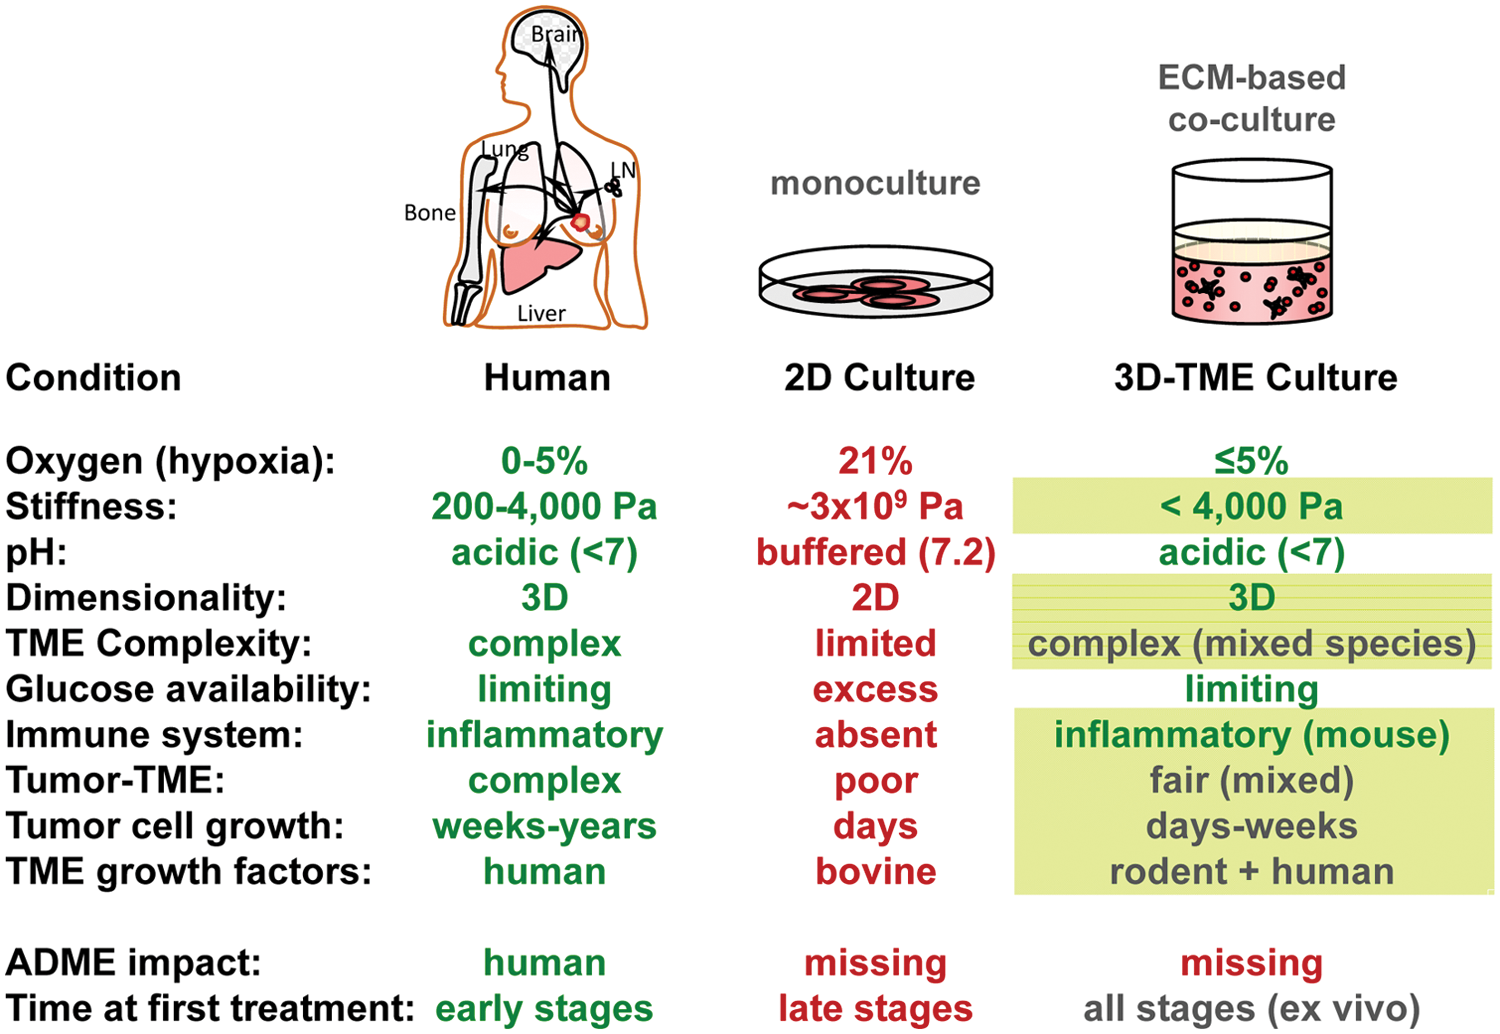
Comparison of cell culture versus human cancer. For various parameters and conditions, the situations in the patient, in standard two-dimensional cell culture models, and in the humanized three-dimensional (3D) multicellular tumor growth assay are opposed. Those parameters that could be adapted in the proposed 3D–tumor growth assay model (last column) are written in green, whereas those implemented already or brought closer to the in-patient situation in the current publication are boxed in green. ECM, extracellular matrix.
To better mimic the in vivo situation of tumors where cell-cell interactions, cell-matrix interactions, and local gradients of secreted factors affect cell function and behavior, we developed a 3D multicellular tumor growth assay (TGA) consisting of a mixture of tumor cells and stromal cells organized in a 3D extracellular matrix protein gel, which was subsequently optimized and translated into a screenable assay. Our new assay improves upon the one we first described in 2007, 11 in which human mesenchymal stem cells (hMSCs; also known as bone marrow stromal cells) are mixed with the tumor cells and embedded into a 3D laminin-rich basal membrane extract (BME) gel. Such BME is derived from a murine chondrosarcoma (i.e., EHS tumor) that is grown in mice, produces significant amounts of tumor matrix, and, importantly, includes also immune modulators of mouse origin. 12 BME is diluted to the desired concentration in phenol red–free cell culture medium that has been supplemented with L-glutamine but not with (bovine) serum proteins or antibiotics. So the tumor cell growth relies on the murine-derived acellular TME (i.e., BME) and human factors secreted by the tumor cells (autocrine) and stromal cells (paracrine) akin to cancer tissue, where mesenchymal stem cells differentiate to tumor-associated fibroblasts. 13 Alternatively, it has been shown that conditioned medium from fibroblasts can be sufficient to support the growth of various tumor cell lines in the 3D-TGA. 11 In such a system, the tumor cells grow as little colonies with 3D architecture. However, the growth rates are reduced compared with growth on 2D plastic substrata, and therefore at least 7 days of incubation are required. Sasser and coworkers 11 have reported data using dsRed stable cell lines to follow the daily growth of the mini-tumors by applying a homogeneous reader to quantify the red fluorescence. Daily, noninvasive monitoring of tumor growth was the starting point for our endeavor.
The goal of this study was to demonstrate feasible transfer of a complex tumor microenvironment mimicking a 3D co-culture assay to a high-content screening platform and extract multiple, robust parameters. We strived to quantify tumor cell growth in 3D co-cultured tumor cell colonies by automated microscopy and image analysis. Because of the 3D nature of this model, imaging of the mini-tumor spheroids should cover the entire depth of the well, and a specific algorithm should allow for accurate determination of the size and number of colonies. Because of the limited depth of field in microscopic imaging, a stack of images at different Z (vertical) positions was generated and processed into separate colonies located at a similar X and Y position but at a different vertical position.
Materials and Methods
Chemicals
All chemicals are from Merck (Darmstadt, Germany) if not indicated otherwise. Camtothecin and PD0325901 were purchased from Calbiochem (Merck KGaA, Darmstadt, Germany), AZD0530 and BI-2536 from Selleckchem (Houston, TX), and Draq5 from Biostatus (Shepshed, UK).
General Cell Culture
The PC-3M-luc-C6 Bioware Cell Line (cat. no. 119270; Caliper Life Sciences, Hopkinton, MA) exhibits a SV40 promoter-driven firefly reporter gene, 14 and a stably expressed dsRed was inserted in our labs. NCI-H460 (no. HTB-177; ATCC, Manassas, VA) and PC-3M-luc-C6 cells were maintained in RPMI 1640 medium supplemented with Defined FBS (cat. no. SH30070.03; HyClone Laboratories, Logan, UT), L-glutamine, and gentamicin. All cell culture reagents are from Invitrogen (Carlsbad, CA). hMSCs were purchased as the MesenCult-XF Culture Kit (cat. no. 04529; STEMCELL Technologies, Vancouver, BC, Canada) and expanded according to the supplier’s information.
3D Tumor Growth Assay
Cultrex BME without phenol red (cat. no. 3432-005-01; TREVIGEN, Gaithersburg, MD) was diluted to the indicated concentration in cold “3D-TGA medium” (1% GlutaMAX in phenol red–free RPMI 1640) and stored on ice. Tumor cells and hMSCs were mixed in a ratio of 10:1, resuspended in 3D-TGA medium, and stored at room temperature. The 96-well microplates and a plate warmer were heated to 37 °C. A manual multichannel pipette was used to load column by column while the plate was placed on a plate warmer. First, the wells were loaded with 50 µL cold BME working stock. Immediately afterwards, 50 µL of cell suspension was added and gently mixed by carefully pipetting up and down several times. The fully loaded plate was then transferred into the CO2 incubator overnight. The next day, the gel was overlaid with 50 µL of warm (37 °C) 3D-TGA medium that contained DMSO or compounds dissolved in DMSO, if appropriate. Plates were incubated for 7 days at 37 °C and 5% CO2 before being analyzed on day 8.
Homogeneous Cell Proliferation Assay
alamarBlue (Invitrogen) was used to determine the metabolic activity of the cells before image acquisition. Then, 15 µL alamarBlue was added per well and incubated for 4 h at 37 °C in the incubator. The developed fluorescence was measured at 560-nm (excitation)/590-nm (emission) filter settings in a fluorescence spectrophotometer (Spectramax M2; Molecular Devices, Sunnyvale, CA).
Microscopy
For automated fluorescent image acquisition, the Opera QEHS (PerkinElmer, Waltham, MA),15–17 the MIAS-2 (Digilab, Holliston, MA), 18 or the IN Cell Analyzer 2000 (GE Healthcare Life Sciences, Little Chalfont, UK) 19 was used. The MIAS-2 and IN Cell 2000 can also acquire brightfield images. Details are described in the main text.
Image Analysis
Image analysis scripts were elaborated using the Acapella software (PerkinElmer) or our in-house developed Phaedra system. 20 Furthermore, a solution was provided by DCILabs (Keerbergen, Belgium) that could be integrated into Phaedra. Finally, GE analyzed our images acquired by the IN Cell 2000 in its facilities. Further details are provided throughout the main text. Data analysis, including IC50 determination, was done in Phaedra. 20
Results and Discussion
Assay Development I: Biology
We were interested in further developing the assay of Sasser et al. 11 with the goal of generating a robust, reproducible, and screenable assay that could serve as a platform to apply to other cell lines, tumor types, and co-cultures.
In general, for the humanized 3D-TGA, equal volumes of chilled gel solution and a mix of tumor and stem cells in suspension at room temperature were mixed and jellified at 37 °C overnight. The next day, the gel was overlaid with medium that may have contained compounds for a 7-day incubation period. Cells were monitored each day for growth (red fluorescence), and at day 8, cells could be further processed and analyzed (
We established two cell lines in the current model: the lung cancer cell line NCI-H460 and the prostate cancer cell line PC-3M-luc-C6 (PC-3M), which exhibits high metastatic potential in xenografted animal models. For the cross-platform study, we used an NCI-H460 clone that was stably transfected with a constitutively expressed dsRed. However, rather than relying on stable fluorescent cell lines, we wanted to gain additional flexibility in future models that do not require stable transfection with a fluorescence marker. To this end, we explored postassay cell staining methods and brightfield microscopy.
First, we determined optimal cell seeding numbers and the influence of co-cultured hMSCs. Optimal cell density for an 8-day assay was determined at 10 000 NCI-H460 cells and at 7500 PC-3M cells per well in a 96-well format. The ratio of 10:1 between tumor cells and hMSCs as previously published 11 was not altered for these experiments. hMSCs are expanded over several passages after purchase and can be frozen at passages 5 to 6. The proliferation rate declines over time owing to the primary nature of these cells. At high passages, hMSCs undergo senescence or start to terminally differentiate. Typically, hMSCs are used for the assay between passages 6 and 14, and hMSCs contribute to tumor cell growth and crosstalk.
Various gel types have been tested, and laminin-rich BME was selected to continue with determination of optimal BME concentration, volume, growth curves, incubation times, and optimal casting conditions. The 50-µL volume of BME mixed with 50 µL of cell suspension was found to be optimal. At lower volumes, meniscus formation was too dominant, and with higher gel volumes, gel consumption was increased with limited volume remaining for medium overlay, which might be critical for long-term incubation and correlating evaporation. For PC-3M, no saturation of growth over 8 days with increasing BME concentration (5–8 mg/mL) was observed (
However, at much lower concentrations (e.g., 3 mg/mL BME), it was observed microscopically that many cells drift and attach to the bottom plastic and “overgrow.” We tried to approach the problem, but precoating of the wells with a small amount of BME did not provide improved results. At a lower concentration of BME, many cells still settled during the jellification (polymerization) process and expanded at high density on the interface between the gel phases. Therefore, higher BME concentrations were favored in this study; 6 to 8 mg/mL proved to be optimal with respect to sustained tumor co-culture suspension and a good distribution across the z-axis. Therefore, 7 mg/mL BME was chosen for all further experiments. Furthermore, we optimized the mixing. Previously, cells in cold medium and cold BME solutions were mixed and kept on ice before seeding. In the improved process, we added ice-cold BME into prewarmed (37 °C) 96-well plates first and immediately afterward mixed in the room-tempered cell suspension in TGA medium. Jellification, by adding ice-cold BME to prewarmed plates, created a thin film of coating on the bottom of each well and prevented cell attachment. Jellification occurred more rapidly, and therefore “sinking” of cells was minimized. Later, another step was added to improve image acquisition: The MIAS-2 was used with a fixed focus, and z-stacks were taken starting from a slightly elevated base level. To check for cells lying on the well bottom, the MIAS-2 instrument was set so that the z-stack was extended downward with extra planes.
Various fixation methods have been tried to allow us to transfer plates to other sites for analysis. Formaldehyde fixation unfortunately melted the gel, and the tumor colonies along with the individual hMSCs dropped to the bottom of the well. Better results were achieved using glutaraldehyde. However, fixation with 0.5% glutaraldehyde exhibited autofluorescence and made the gel opaque. The intensity of the yellow staining was dependent on the duration of the fixation step, and a gradient formed from top to bottom of the gel in a well, probably due to the slow diffusion of the fixative added to the top of the gel. This might explain the rapid absorption of blue light (2-fold decline per 0.5 mm) and likely interfered with the analysis of Hoechst-stained nuclei. Therefore, staining of nuclei with the far-red dye Draq5 was favored.
Furthermore, various reference compounds have been tested to serve as controls for inhibition of tumor growth. The DNA topoisomerase inhibitor camptothecin (CPT),21,22 the PLK-1 inhibitor BI2536,23,24 and a nonspecified HDAC inhibitor were chosen for further experiments. Compounds were overlaid in 50 µL medium to the jellified 100 µL BME embedding the cells.
Assay Development II: Image Acquisition and Analysis
We next sought to compare various imaging platforms (MIAS-2, IN Cell Analyzer 2000, Opera;
Image Acquisition
To optimally characterize the population of cell clusters in three dimensions, we have to find the right balance between high resolution, which gives us the best measurement of individual clusters, and the capture of a large volume, which gives us the best statistics on the population. The driving factor is the biology of cluster growth, and this was observed to result in a roughly lognormal distribution of size (i.e., one with a long tail comprising a small subpopulation of clusters of large size). Hence, better results can be expected from approaches that capture a large fraction of the well volume. Combined with practical limitations on the acquisition times and the data volume, this guided us toward objectives with a relatively low magnification and a long free working distance, which enabled us to image a volume of several cubic millimeters. In principle, high-resolution 3D imaging might permit the counting of the individual cells in the clusters but only at the cost of a reduction in sample size and an increase in processing time that are prohibitive.
A choice also needed to be made regarding the spacing of the planes in the z-stack. Here a distinction needs to be made between the ability to detect the presence of an object in the volume and the ability to capture an image of it that is approximately in focus. The latter depends on the depth of the field of the objective, which is roughly proportional to the inverse square of its numerical aperture. However, in brightfield and epifluorescence imaging, the presence of an object will result in a progressively blurred signal in out-of-focus planes. It will still be proportional to the size of the object but will not allow its features to be determined with any accuracy. In confocal fluorescence imaging, this out-of-focus signal is suppressed.
The PerkinElmer Opera QEHS15–17 is a microlens-enhanced Nipkow spinning disk confocal system for fluorescence imaging. It is powered by four lasers and images of three colors can be acquired in parallel by the three cameras. In principle, this is the most suitable choice for 3D image acquisition. However, the pinholes in the spinning disk unit are 50 microns in diameter, designed to match high-resolution 60× or 100× objectives, which sample a too limited volume for our purpose. We used an Olympus UplanSApo 10×/0.40 objective with a working distance of 3.10 mm. For this objective, the pinhole size is considerably larger than one Airy unit, and the imaging should not be considered confocal: A rough estimate of the optical section thickness is about 150 microns, 25 far more than the 5.6-micron depth of the field of the objective. As a compromise, we decided to take z-stacks spaced at 25 microns. Especially in fixed samples, we observed that the fluorescence intensity decreases strongly with depth into the sample as light is absorbed and scattered.
Images were also acquired on the Digilab MIAS-2 18 and GE Healthcare IN Cell Analyzer 2000 19 systems. Both were capable of investigating nonconfocal epifluorescence imaging and brightfield imaging. Both were equipped with low-magnification objectives, a 4×/0.2 on the GE system and a 5×/0.15 on the MIAS-2. However, the IN Cell 2000 captured a larger fraction of the well area because it is equipped with the large-chip camera option that allows 43% coverage of a well over 22% by the MIAS-2 in a 96-well plate format. The depth of field is 50 microns for the 5×/0.15 objective and 21 microns for the 4×/0.20 objective. The z-stacks were spaced at 25 microns on the MIAS-2 and at both 25 and 50 microns on the IN Cell 2000. The MIAS-2 was run with fixed focus height.
On the MIAS-2 and IN Cell 2000, we acquired both brightfield and fluorescence images. Brightfield images are inherently low contrast, and it is challenging to perform image analysis on them. But a major advantage was that the amount of signal that reached the detector was not limited by the concentration of fluorescent molecules in the sample. Far shorter exposure times of 40 ms were possible in brightfield mode over 100 ms in the fluorescence mode. As our goal was to build an assay suitable for medium-throughput screening, these are important gains.
Image Analysis
The desired outcome of this assay was to measure the growth of the colonies, which represent microtumors. As a measure of the size of a single colony, either its estimated volume (determined from a series of plane images) or the area of its largest horizontal section (determined from a single in-focus image) might serve. The area may be a more accurate estimator than the volume because in all our data sets, the optical system generated a vertically elongated image of what are more likely to be spherical clusters ( Figs. 2 and 3 ).
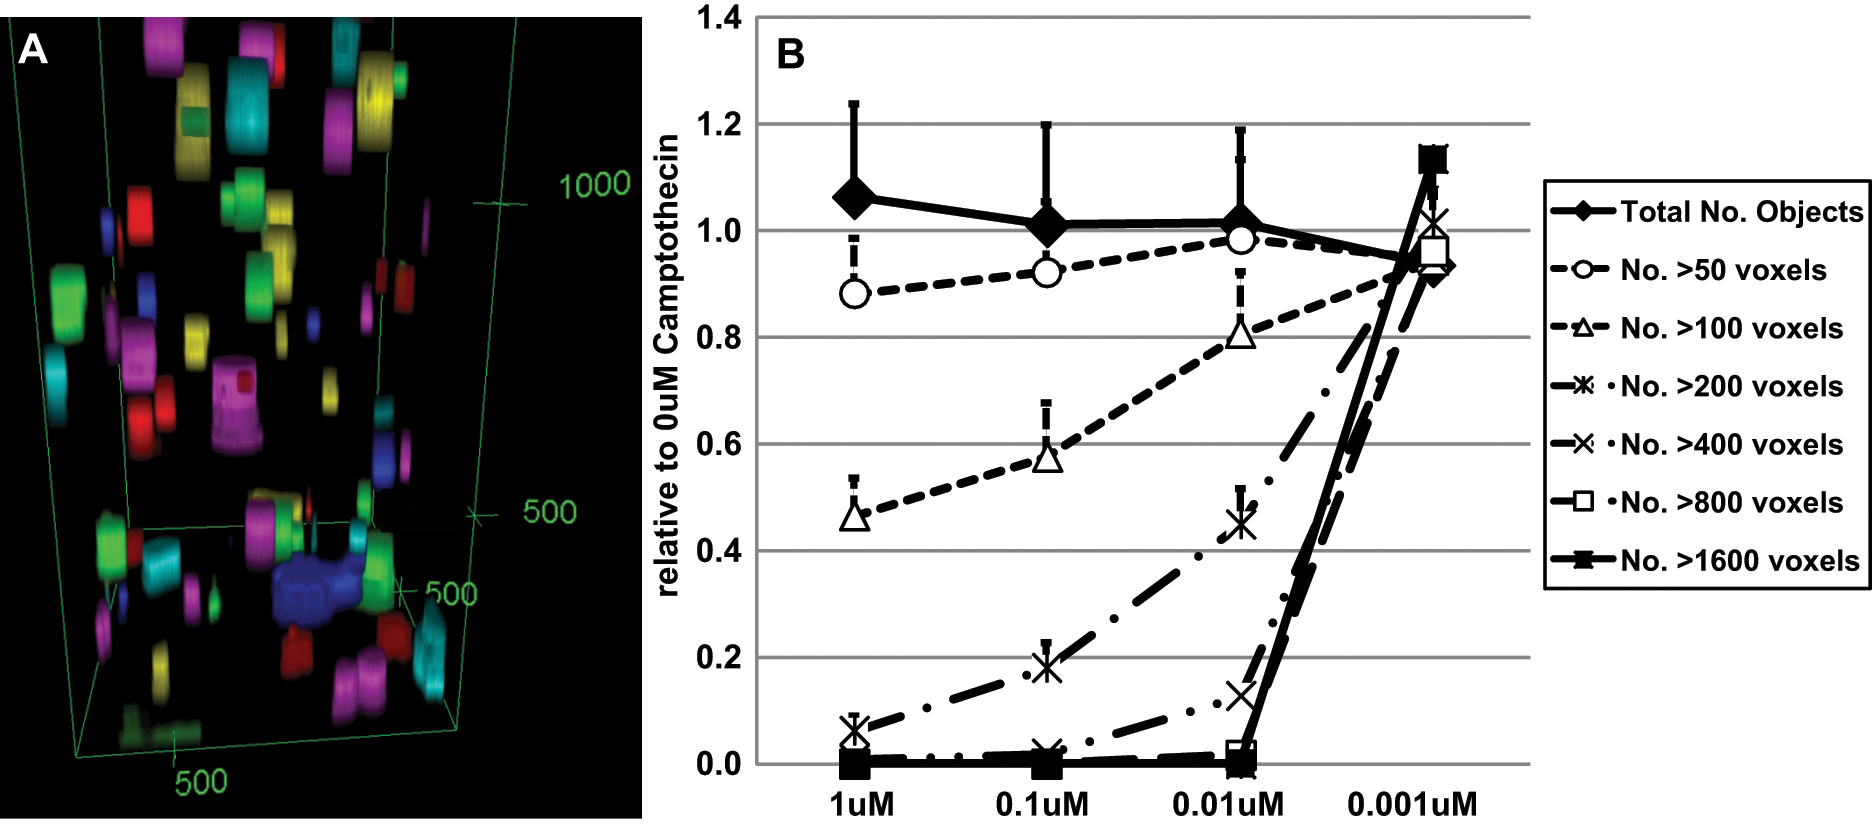
Image analysis by Acapella. (
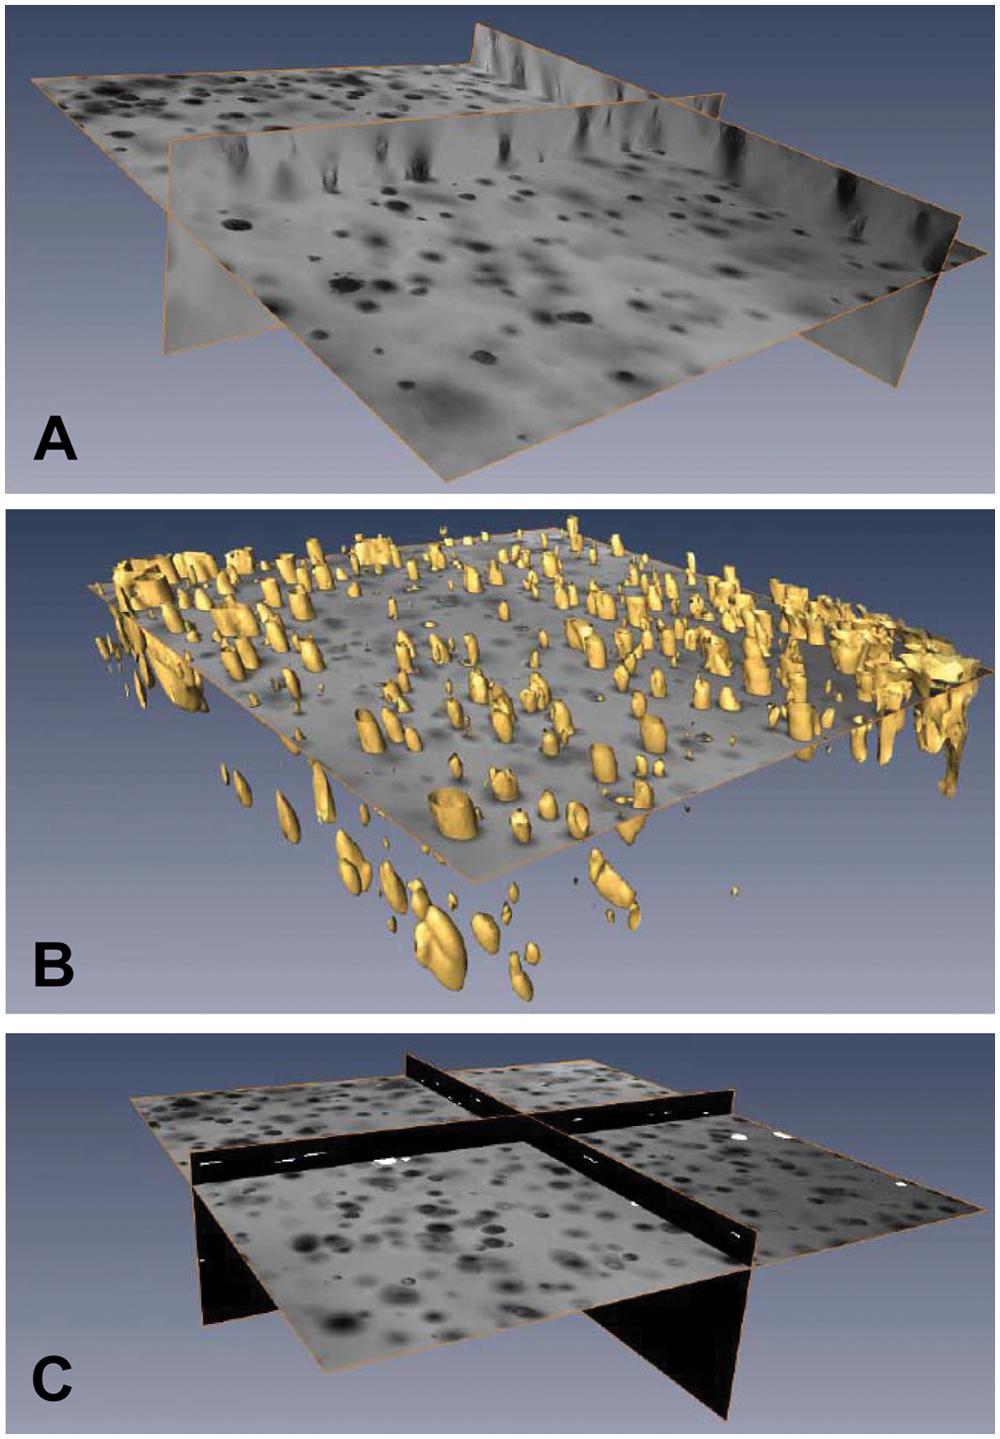
DCILabs image analysis and segmentation. PC-3M cells were imaged in brightfield mode with 5× objective using an MIAS-2. For each well, we collected 131 images spaced at 25 microns. These z-stacks were analyzed with the DCILabs CCA (Cell Colony Assay) software to automatically find the number and size of the colonies. Based on intensity and edge information (
The more difficult challenge was to count clusters in a way that remained unbiased toward large or small clusters. Of course, large clusters extend across a greater number of planes, increasing the risk that they may be accounted for multiple times. On the other hand, smaller colonies are more easily missed if the volume is undersampled, if image segmentation fails, or when they appear against the strong background of large colonies above or below them. We experimented with a number of different approaches with different software packages.
The Acapella software from PerkinElmer was used for the analysis of the images taken with the Opera. Every image in the stack was first segmented in two dimensions, using the PerkinElmer Nuclei Detection Algorithm C. The threshold for object size was set sufficiently low to detect also single cells ( Fig. 2 ). The position, roundness, and area of every 2D object were stored in a table. Next, for every pair of adjacent planes, the objects in the two planes were compared pairwise to determine whether they overlapped. If the calculated overlap exceeded a threshold, the objects were marked as connected. Finally, the algorithm walked over the graph of connections and summed together all interconnected 2D objects into a single 3D object.
Because of the properties of 2D segmentation, the objects constructed in this way trended to be more cylindrical in shape than spherical: The widest diameter was maintained in out-of-focus planes, until the algorithm stopped detecting the presence of an object. Thus, the volume was probably overestimated, but the area in the horizontal plane is fairly reliable. Starting from the images from the Opera, in which objects were well separated because of the relatively high magnification, the algorithm appeared to be robust against double counting or merging different objects.
DCILabs 3D image analysis was primarily designed to support MIAS-2 images. However, it can also be used to analyze other file formats. The algorithm generated a series of focus/defocus 3D cell colonies ( Fig. 3 ). Based on intensity and edge information, a 3D segmentation of cell colonies was obtained. A 3D blob will typically contain the focused and out-of-focus images of a cell colony. From the 3D blobs, the 2D slice was selected where a cell colony was in focus based on the focus criterion. This will finally render the in-focus z-location of a colony. From those selected slices, 2D features were calculated.
The IN Cell Investigator software v1.5 offers a flexible and comprehensive solution for automated high-content analysis of live- and fixed-cell assays. 26 A user-defined protocol within the Developer Toolbox was written to measure colony count and a range of morphological measurements such as colony area, form factor, length, and diameter.
Phaedra (Plate-based High-Content Analysis Evaluation and Dynamic Reliability Assurance)
Phaedra is an in-house developed tool for high-content analysis, quality control, and dose-response fitting, based on ECLIPSE-RCP, which has been published recently. 20 More than 50 cooperating views are available. An arbitrary number of views can be assembled within a so-called perspective (see Fig. 4 ). More than 12 perspectives are offered “out of the box,” and the user can assemble and save/name/reuse his or her own perspectives. For each protocol, an image analysis module can be attached. Using the Bioformats LOCI library, the system is open to more than 100 image file formats. Image analysis prototyping is done within MATLAB (MathWorks, Natick, MA), whereas production analysis is performed with compiled C. In every case, raw and result images are compressed in the JPEG 2000 format. Using JPEG 2000, Phaedra can create arbitrary-size thumbnails on the fly in a plate layout for orientation inside the plate (cf. Fig. 5 in Cornelissen et al. 20 ). The heatmap shows parameter-by-parameter values color-coded in plate layout. Phaedra can show individual image and correlating scatter plots, 3D graphs, and many other plot types. All views in Phaedra react to all relevant selections and actions. Phaedra handles all manipulations ranging from cell-level highlighting to dose-response approval in batch mode.
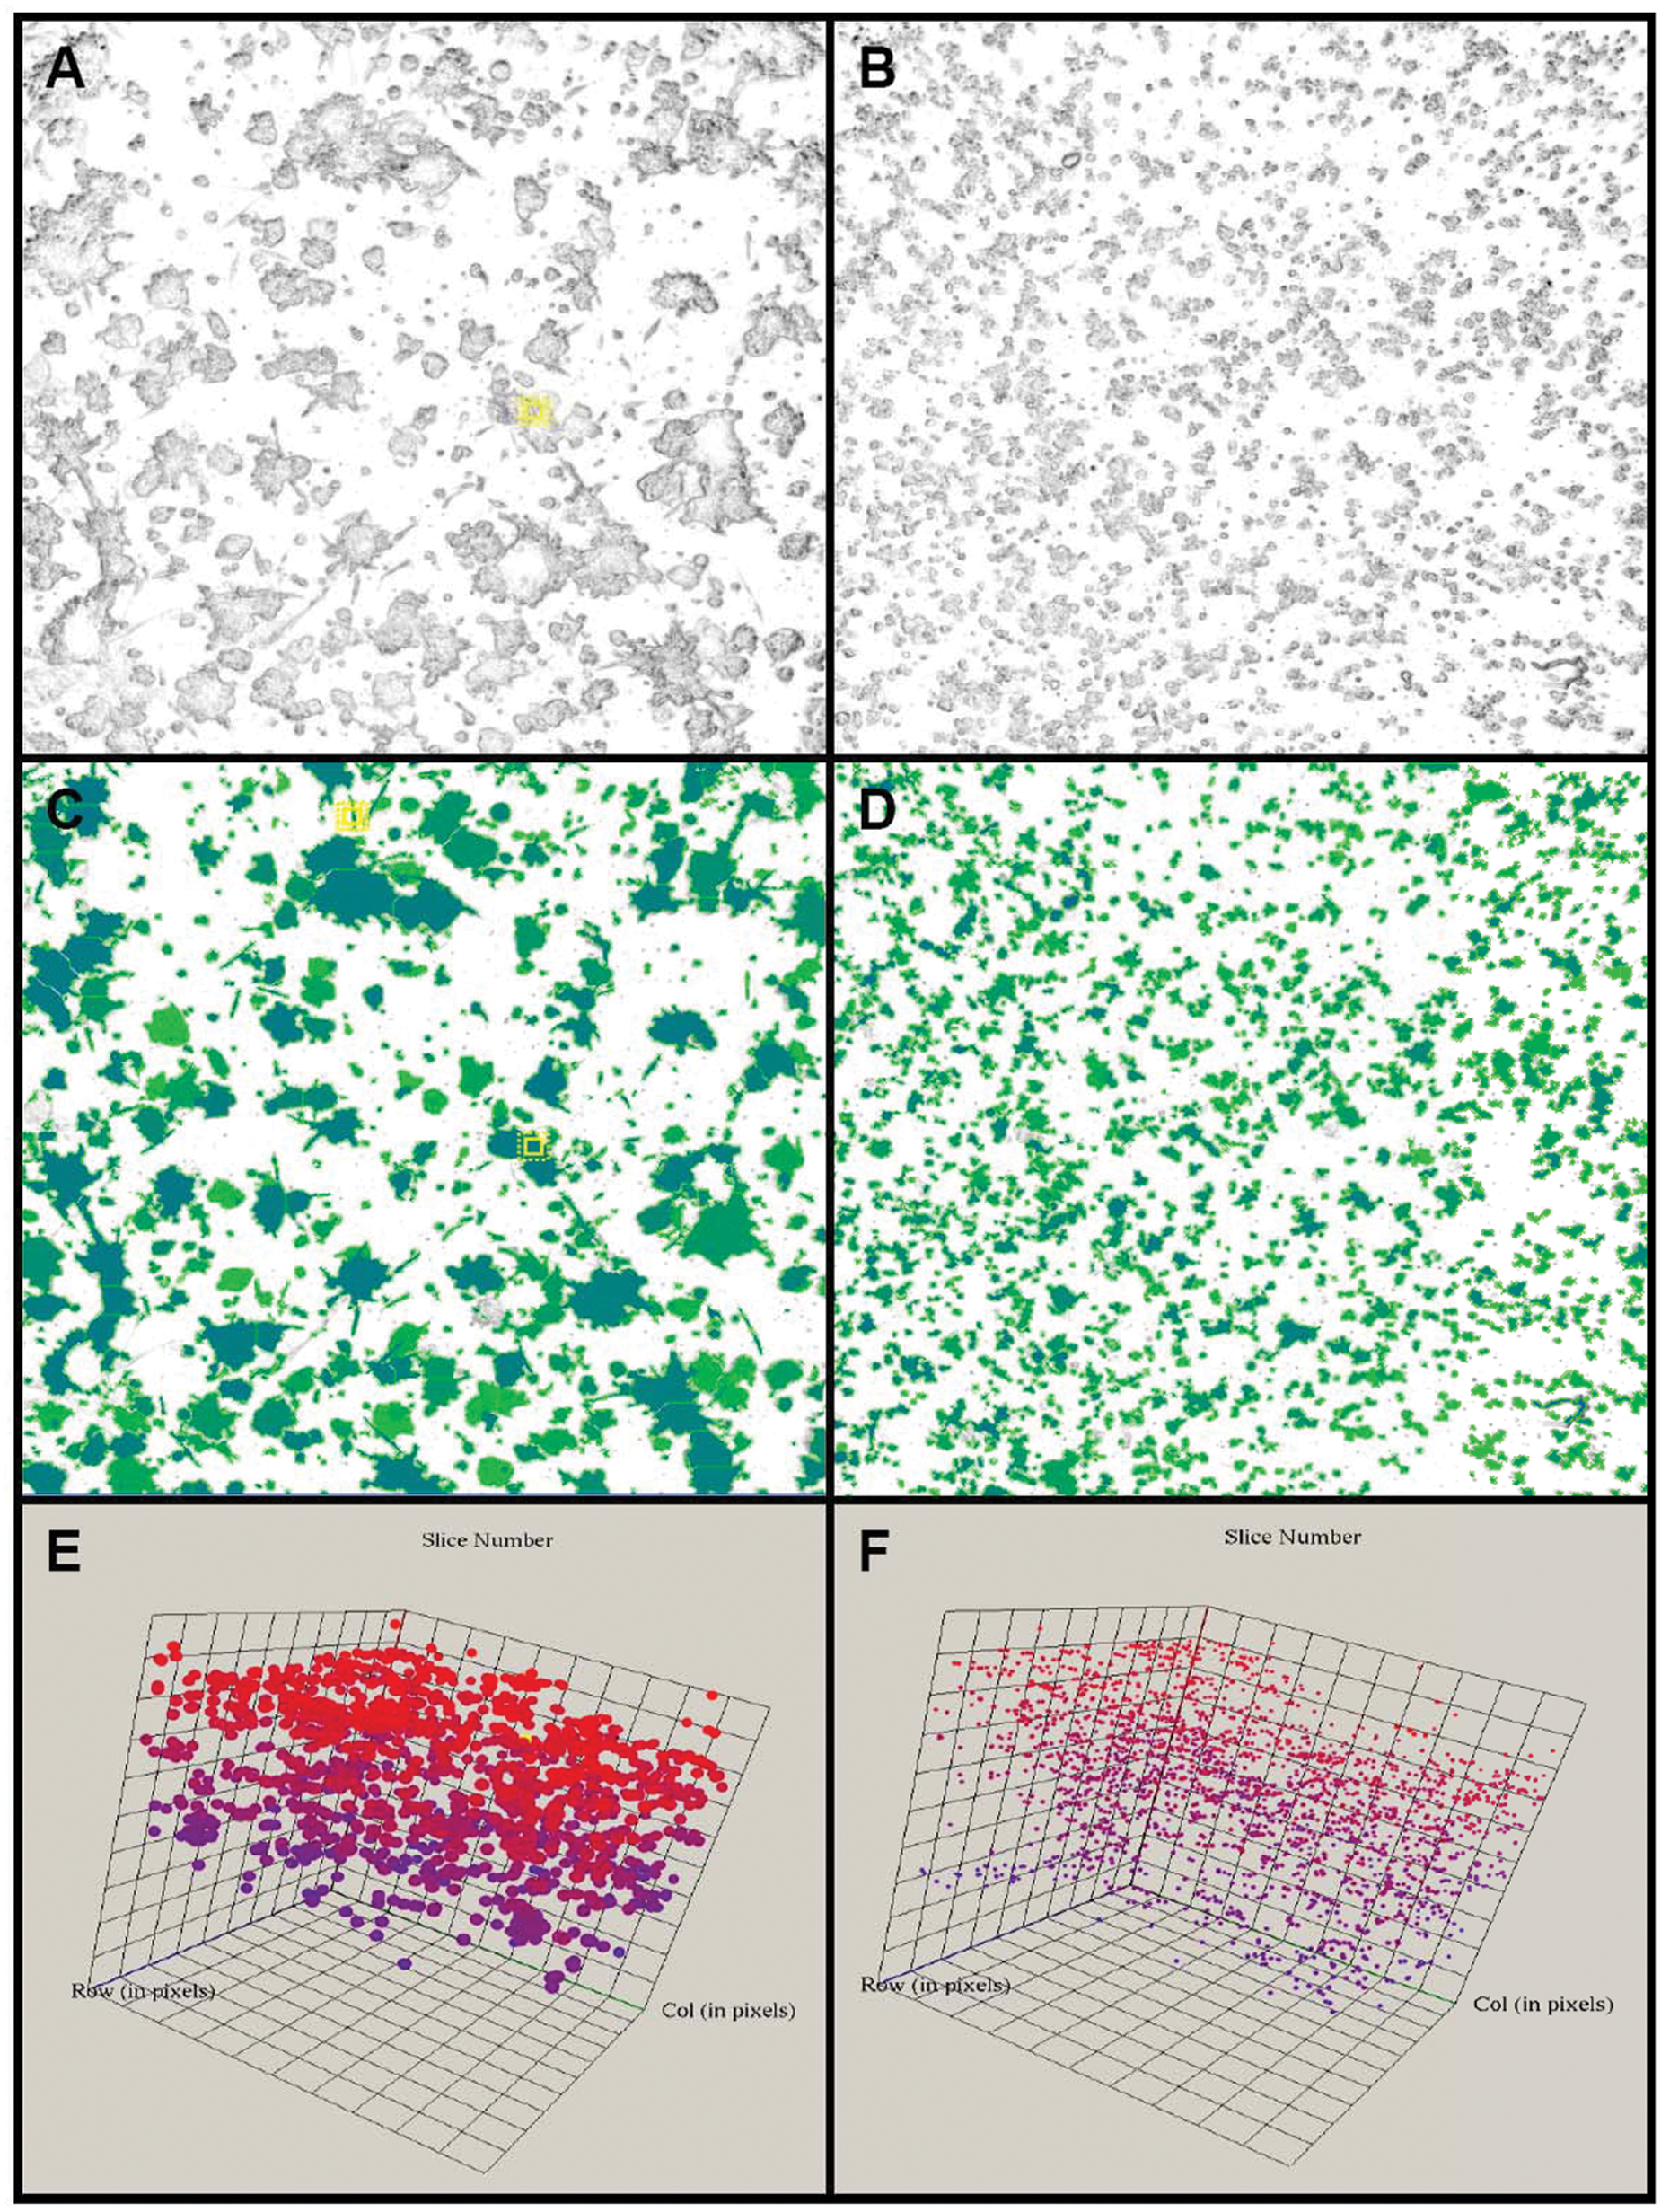
Phaedra images with original images (
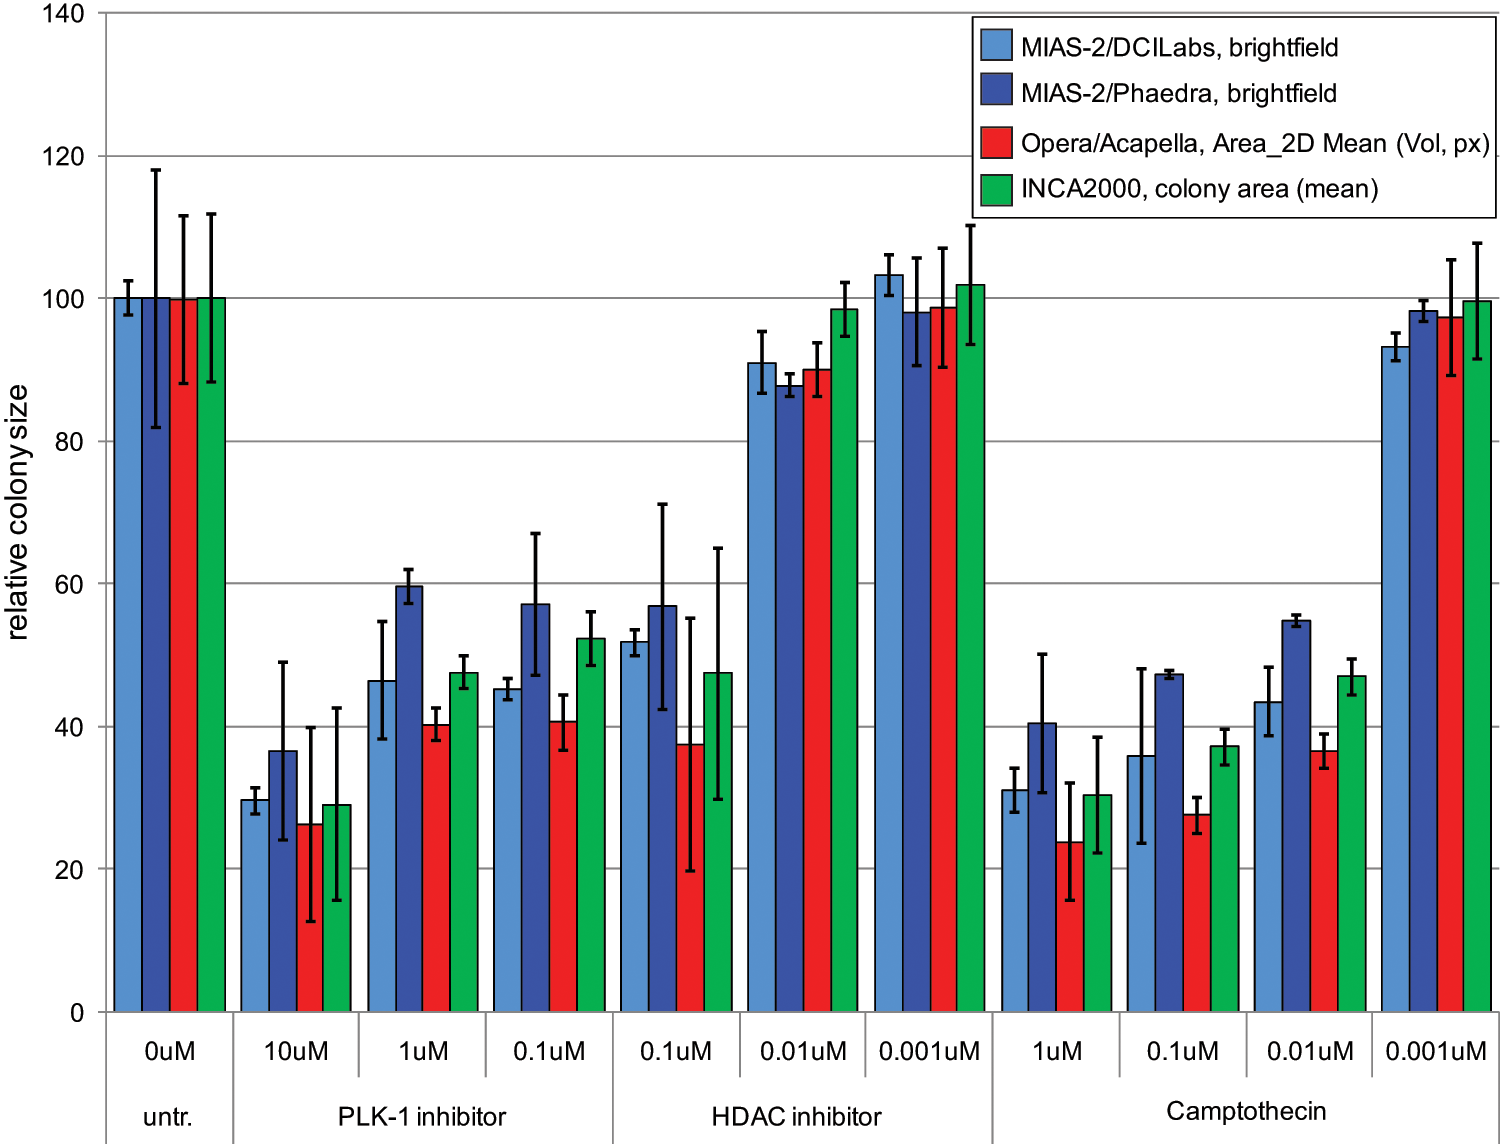
Cross-platform study: summary graph on colony size. Four 96-well plates were seeded with PC-3M/human mesenchymal stem cell (hMSC) co-cultures embedded in basal membrane extract (BME). Three different anticancer compounds at the indicated concentrations were incubated for 7 days. After 3D image acquisition by three different automated microscopy systems (MIAS-2, Opera, and In Cell 2000), various image analysis scripts (DCILabs, Phaedra, Acapella, and IN Cell Investigator) were applied to average quantify colony sizes. Average cell colony sizes were plotted relative to the untreated control.
Integrated 3D Analysis in Phaedra
The module developed for the Tumor Colony Growth Protocol reads in the complete 3D Tiff stacks and performs a real 3D analysis. This completely avoids double counting of colonies. The algorithm is based on scale space and differential geometry principles. 27 In short, 3D clusters are detected by calculating second-order Gaussian derivatives in X, Y, and Z at a range of scales. We use an infinite impulse response (IIR) filter to optimize the convolution speed. The entries in the Hessian are normalized to be scale independent. A weighted sum of the determinant and the trace of the Hessian are compared with a fixed threshold value. The binary images from all scales are combined using a logical “OR” operation. The separated objects in the resulting binary image are labeled, and several measurements are performed (volume, total intensity, radius of the best fitting ellipses, etc.). The results can be seen in Figure 4 . Several of the steps are multithreaded to enhance the performance. This results in a very fast algorithm (about 20–30 min per 96-well plate on a multi-CPU workstation). For colonies with smooth borders, the algorithm is very robust. A drawback is that colonies with very irregular boundaries are not well separated.
Import of DCI Image Analysis Data into Phaedra
Phaedra also allows importing analyzed results and image overlays from several third-party image analysis packages. The cell-level and well-level result files are parsed and saved into the Phaedra environment (file server and database, respectively). We use a separate protocol for the DCI-based results. After import of the results and images, Phaedra behaves identically for the different protocols.
Results of the Cross-Platforms Study
Cell colonies were counted and parameters describing the size of the colonies derived. Overall, all instruments and correlating image analysis provided very similar results. None was significantly superior over any of the other systems.
Co-culturing of hMSCs with NCI-H460 in BME exhibited a slight growth advantage over monoculture of NCI-H460 cells (data not shown), but the presence of hMSCs can affect tumor cell drug response and resistance, as well as tumor cell growth rates. When anticancer compounds were titrated, the total number of colonies stayed constant (
With the MIAS-2, brightfield offered an advantageous option over epifluorescence. Twenty-two percent of the well surface could be covered at 5× ( Table 1 ), and at one field per well and 131 z-stacks at a distance of 25 µm, a 3.3-mm depth could be imaged, and a plate was read in short over 1 h. Particularly applying Phaedra, the image analysis time could be reduced to 30 min and below per plate. The wide-field camera in the IN Cell Analyzer 2000 offered 43% coverage of the well at 4×, and with 51 z-stacks at a 50-µm distance, a 2.5-mm depth could be recovered at 1 h, 6 min per plate. The image analysis by the IN Cell Investigator software took quite long but was not optimized for speed. For the Opera, the lowest available lens was at 10× magnification. Therefore, two fields per well were chosen, which together covered 4% of the surface of a well. The 83 z-stacks at a 25-µm distance covered 2 mm in depth. One plate was scanned in 1 h, 21 min. However, the speed of image analysis, at 3 h, 8 min per plate, was rather low. No attempt was done to optimize this.
Summary of Technical Details as of the Cross-Platform Study
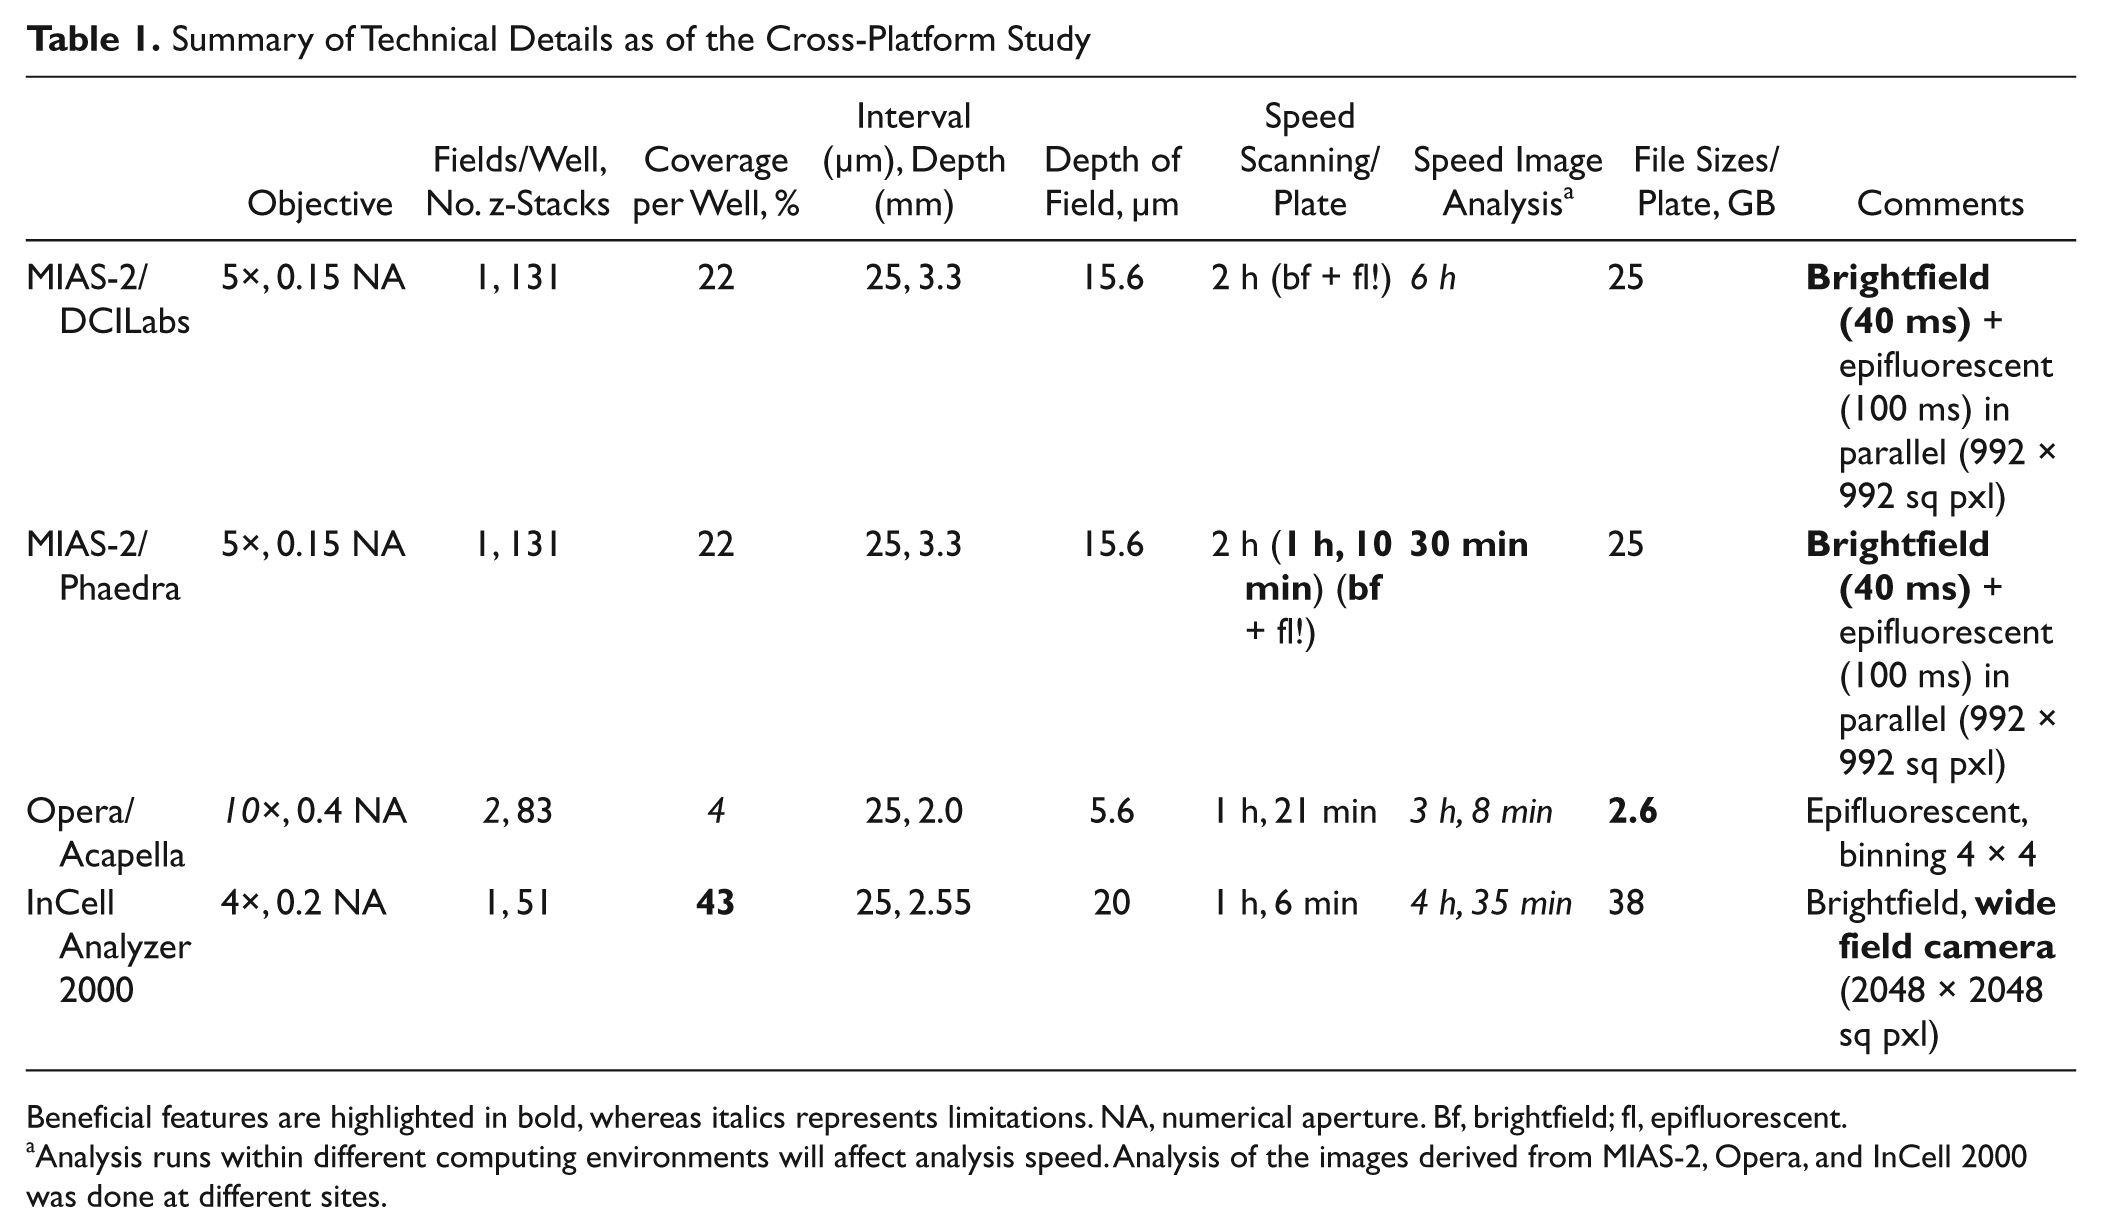
Beneficial features are highlighted in bold, whereas italics represents limitations. NA, numerical aperture. Bf, brightfield; fl, epifluorescent.
Analysis runs within different computing environments will affect analysis speed. Analysis of the images derived from MIAS-2, Opera, and InCell 2000 was done at different sites.
Assay Validation and Preparation of a Pilot Screen
Although the NCI-H460 served well the needs for comparing several imaging platforms and image analysis tools, for the proposed screening project, our interest shifted toward continuing with the prostate cancer cell line PC-3M.
To assess compound vehicle impact, we determined DMSO tolerance. At six concentration points between 0% and 1%, no significant colony growth reduction could be determined. However, at 2% and 3% DMSO, colony sizes were reduced by 80% (data not shown).
Next, we were interested in examining the variation and reproducibility of the assay. For this, 7500 PC-3M cells in co-culture with 750 hMSCs were seeded in 7% BME. At day 1, each half of the plate was treated with DMSO (high control, HC) or with 10 µM of the PLK1 inhibitor BI-2536 dissolved in DMSO (low control, LC) at a final concentration of 0.67% DMSO on the cells. At day 8, first the total metabolic activity was measured by alamarBlue before colonies were imaged using the MIAS-2. Various image analysis parameters were determined. For the total number of cell clusters, the overall number of all detected cell colonies per well was determined. Various parameters describing the size of the colonies were applied: The “cumulated cell cluster area” (µm2) describes the total surface of all detected cell colonies per well. Furthermore, the “median area size of the cluster” (µm2) and the “average area size of the cluster” (µm2) were determined (
The experiment was run a second time 2 months later. In the second experiment, two replica plates of PC-3M/hMSC co-cultures were run (
Of three parameters describing the colony size, the average area size of the cluster achieved the best Z′ factors 28 in both experiments. The DMSO control (HC) exhibited % coefficients of variation (CVs) of 8.59, 13.48, and 14.63, whereas the PLK-1 inhibitor-treated LC ranged slightly better at %CVs of 7.08, 6.33, and 6.64. For any 96-well plate, 46 wells were taken into calculation for LC and HC. The remaining wells were not loaded with cells in order to have blanks for the alamarBlue assay. The plate-to-plate variance of replica plates was very low, as shown during the second experiment. Ratios of high to low controls were rather low, ranging from 2.08 to 2.7 (window [mean HC/LC]).
Testing 32 Reference Compounds at Four Dilutions
Next, an experiment testing 32 reference compounds at four dilutions was performed. Two 96-well plates were seeded with PC-3M cells in co-culture with hMSCs. Each plate was loaded 14 times with DMSO only (HC) and the PLK-1 inhibitor (LC). The remaining wells were used to test the desired compounds. Here again, well-to-well variations of less than 10% CV were observed, whereas at high control to low control ratios of 2.64 and 3.31, Z′ factors of 0.53 and 0.55 were calculated, respectively (
Experiment with Large Dose-Response Curves
Eight compounds were selected from the previous 32-compound screen. Each was tested in a large dose-response experiment comprising eight dilution points spanning from 10 µM to 1 nM compound concentration. The experiment was done three times. Each plate had 14 wells of HC versus 14 wells of LC. The homogeneous alamarBlue assay was compared with automated microscopy on the identical plates. Data are displayed in Table 2 .
Three Independent Experiments for Assay Validation
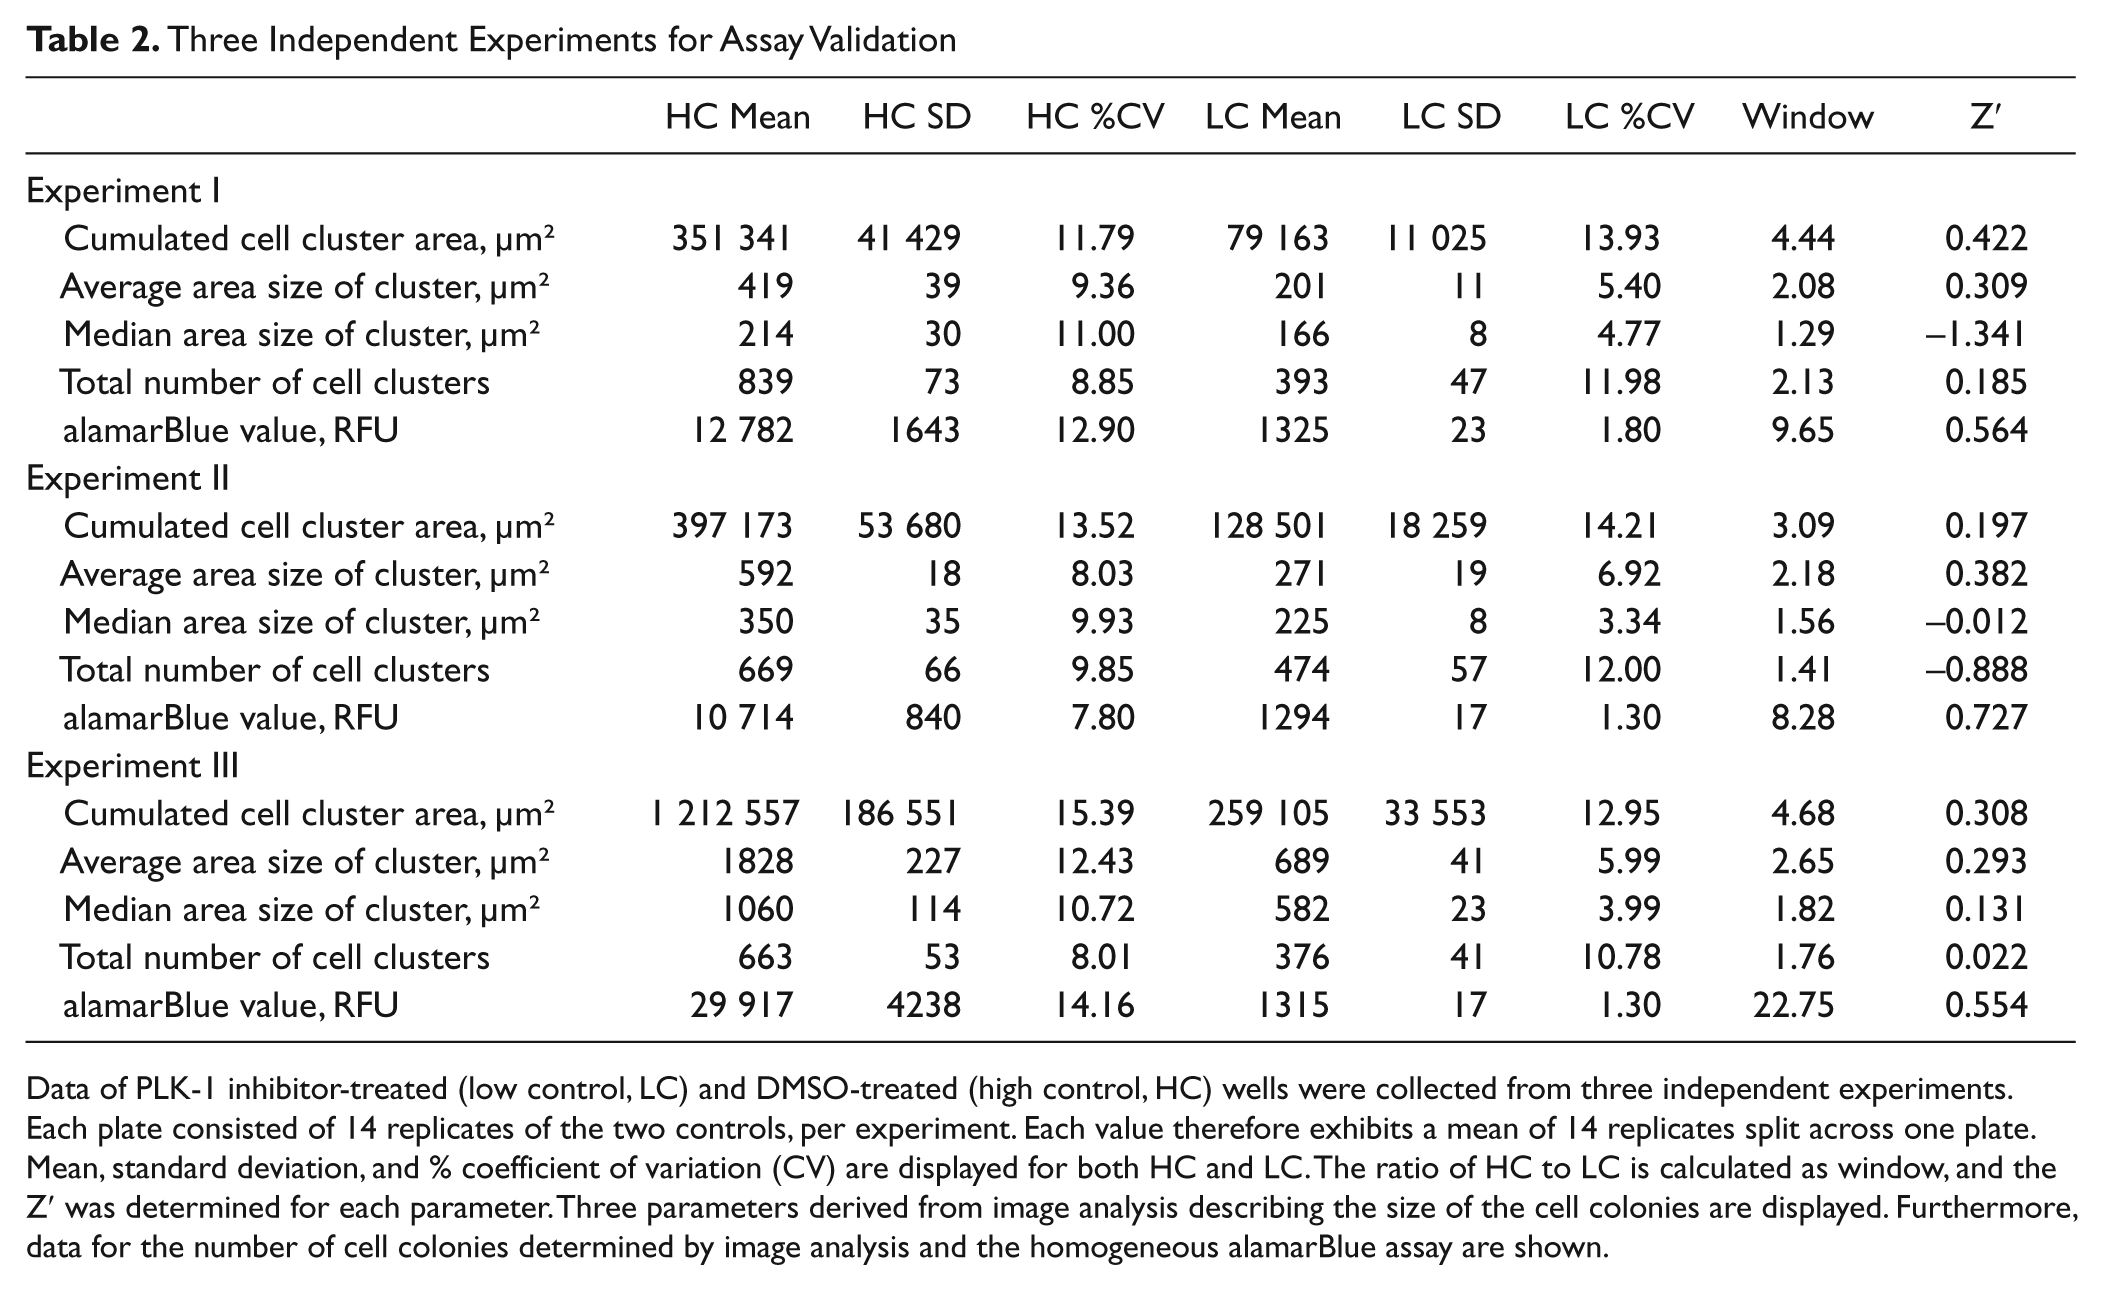
Data of PLK-1 inhibitor-treated (low control, LC) and DMSO-treated (high control, HC) wells were collected from three independent experiments. Each plate consisted of 14 replicates of the two controls, per experiment. Each value therefore exhibits a mean of 14 replicates split across one plate. Mean, standard deviation, and % coefficient of variation (CV) are displayed for both HC and LC. The ratio of HC to LC is calculated as window, and the Z′ was determined for each parameter. Three parameters derived from image analysis describing the size of the cell colonies are displayed. Furthermore, data for the number of cell colonies determined by image analysis and the homogeneous alamarBlue assay are shown.
Again, three parameters describing the size of the colonies were derived. For average area size of the cluster and cumulated cell cluster area, much better Z′ values were observed with median area size of the cluster, which exhibited much lower values and twice even negative ones. However, which of the two is the better parameter was not consistent. Variations in the PLK1 inhibitor-treated LC %CV values were in the range of 5% to 7%. For DMSO only, HC variations of 8% to 12% CV were determined for average area size of the cluster. The assay window was between 2- and 3-fold. As observed previously many times, the colony numbers (total number of cell clusters) were not affected much, and therefore low Z′ or even negative ones were calculated.
Reduction of colony size was observed for a number of established anticancer drugs, and IC50 values for those reference compounds were determined based on the average area size of the cluster. IC50 values were determined in two independent experiments and were quite reproducible (
Table 3
and
Reproducibility of Compound Activity in the 3D-TGA
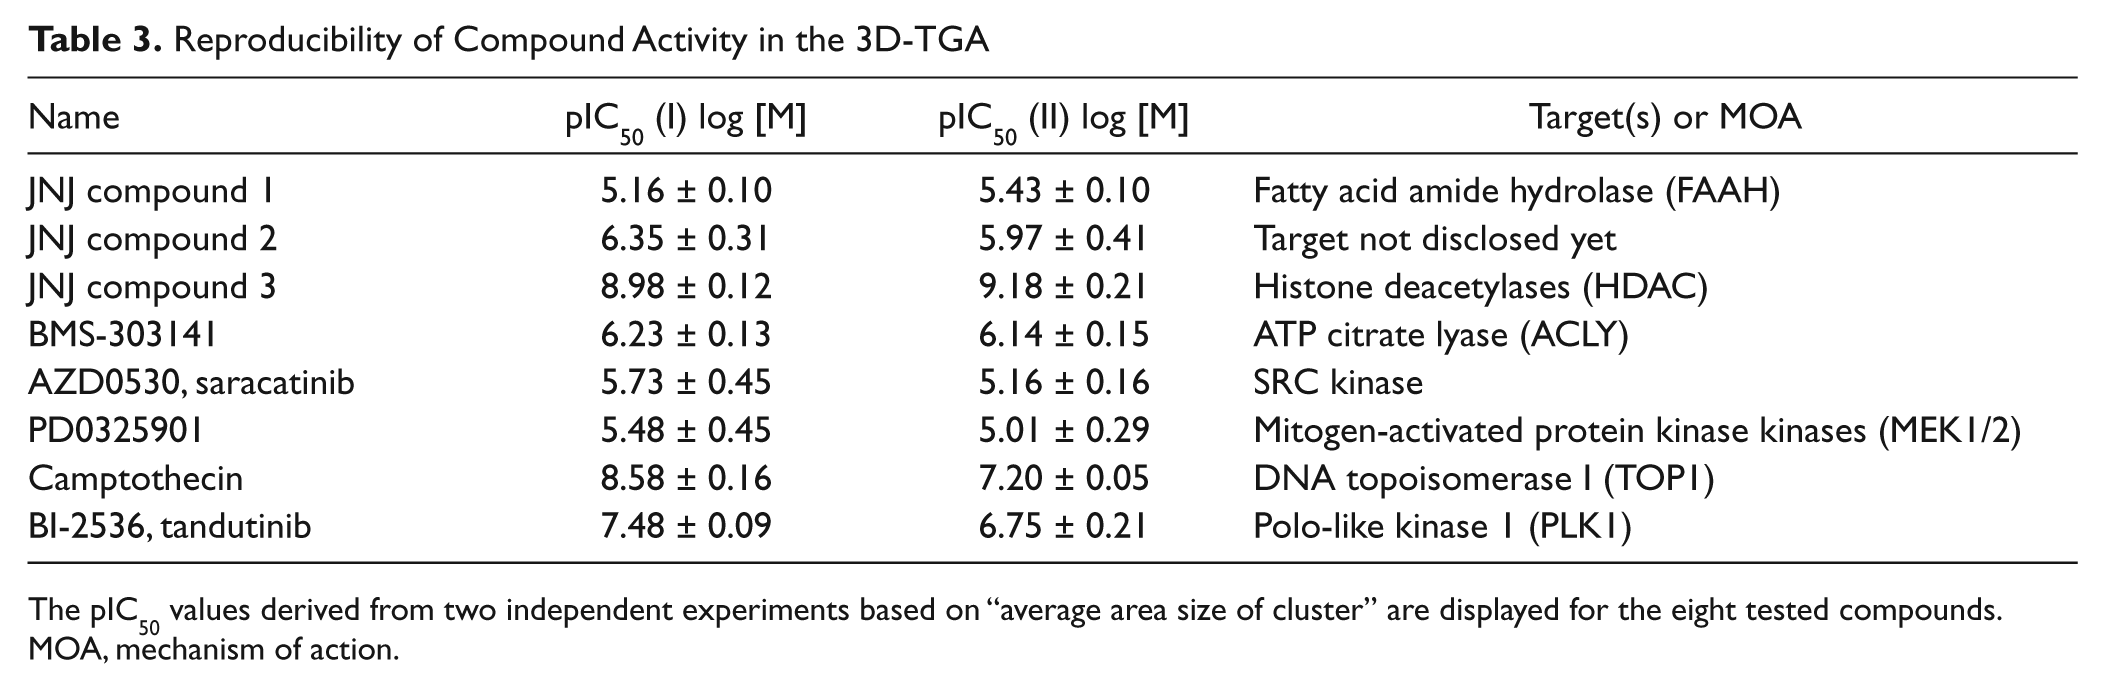
The pIC50 values derived from two independent experiments based on “average area size of cluster” are displayed for the eight tested compounds. MOA, mechanism of action.
Challenges and Future Improvements
We could reproduce a previously published humanized 3D tumor growth assay 11 in a 96-well microtiter format. We optimized systematically the assay to identify conditions that would allow adaption to a high-throughput environment. We discovered and overcame a number of challenges. Particularly critical is the BME; various batches should be tested and sufficient charge volumes stocked. Not every cell line was suitable for growth in 3D under the conditions tested. Automation of the cell-embedding process might reduce variance.
Some principal conformations of classical cell culture to a more TME-mimicking assay system have been achieved (
Fig. 1
): Cells grow in a 3D matrix, addressing the stiffness and dimensionality issues. Extracellular matrix and co-cultured stem cells provide external stimuli and human growth factors, and overall growth rates of the tumor cell colonies are significantly reduced. More recently, we discovered a number of tumor cell lines that demonstrate growth advantages when co-cultured with hMSCs (
Growth at hypoxic conditions, at acidic pH, and at reduced glucose availability can easily be achieved. In any case, models that would be used for drug discovery should be carefully characterized at the gene expression level and morphologically if the tumor colonies under the desired conditions exhibit actual properties more closely to real tumors. Furthermore, whether a larger panel of known anticancer compounds behaves differently under those conditions compared with treatment of cancer cells in 2D or 3D monocultures is currently under evaluation. Ultimately, it has to be proven if the elaborated humanized 3D tumor growth assay will indeed be more predictive of in vivo activity of drug candidates in animal models and patients. To achieve this goal, researchers will find that a number of compounds selected in target-directed in vitro assays or from phenotypic screens in 2D cell culture proliferation assays, which later failed in the process when proven for efficacy in mouse xenograft models or human patients, will be very useful tools. Here, we show the technical feasibility of such a complex assay and correlating conditions to be run for drug discovery.
All the fixation methods described did have at least some negative effect on the imaging quality, and therefore plates have to be processed immediately after the desired incubation time and cannot be stored. Testing various imaging platforms did not reveal any with superior ability. Also, for image analysis, suitable platforms could be identified. For data management and analysis, an own platform, Phaedra, has been developed. 20 The homogeneous proliferation assay using the alamarBlue reagent performed very well for the described 3D tumor growth assay, and if tumor mass is the only parameter of interest, it could be well used for primary screening, as data generation, handling, and analysis are much simpler and more convenient, particularly when screening of larger libraries is considered. However, we have developed a versatile and robust platform applying automated microscopy and image analysis that currently extracts already more parameters than a homogeneous assay could provide. The colony number determines if a compound is purely antiproliferative (i.e., inhibits further cell doubling) or efficiently also kills seeded cells that are resting. Distribution of colony sizes may also give an indication on migration and aggregation abilities of cells. Furthermore, the platform can be quickly adapted to analyze more parameters: In brightfield, certain shapes or structures of the colonies could be extracted without sacrificing throughput of screening. In the fluorescent mode, additional parameters could be extracted after staining specifically such as cell types, cellular structures, protein localizations, or protein modifications. Considering the additional complexity of the process, the latter would be more a secondary assay type.
Throughput
Currently, all steps of the experiments are run manually. Maximally, 10 plates can be imaged per day by one MIAS-2 system, although two colleagues could set up 30 plates on a (long) working day. Cell plates can be set up 4 days per week, which could deliver 120 plates per week. Applying all our three MIAS-2 systems, we could reach nearly 10 000 compounds tested at a single dose and no replicate per week. However, if we would (semi)automate the process, 16 plates could be read every 24 h per imager. With our three MIAS-2 imagers in a line, we could improve to 20 000 compounds per week at a 96-well format, even when cell preparation is limited from Monday to Friday.
Future Directions
For the future, we are interested in extending the number of parameters in image analysis. Particularly the shape and surface of the colonies could provide valuable additional information. For example, could a surface roughness factor give hints on metastatic potential of colonies and its modification by compound treatment?
Brightfield microscopy offers full flexibility on cell lines; no transgene fluorescent (sub) cell lines are needed, and no extra staining is required. However, epifluorescence would require staining of the cells but would also allow a second and third staining for other parameters. Cell-specific markers could be applied to discriminate the individual co-cultured cell types and report putatively different responses to the treatment. Or, activity of relevant pathways or death/antiproliferative mechanisms could be determined. We have developed a versatile platform that can be developed in many directions. To increase throughput, downscaling to a 384-well format should be considered. For prostate cancer, other cell lines may be tested (
Footnotes
Acknowledgements
We thank Barbara Weyn (DCILabs) for elaborating the image analysis script ‘Cell Colony Assay’ and Val Millar (GE) for her outstanding engagement to support and coordinate the image acquisition by the IN Cell Analyzer 2000 and analysis by the IN Cell Investigator software. We also thank our colleagues Christophe Buyck and Lieven Meerpoel for their valuable contribution on selecting the reference compounds and chemistry support, as well as Ralph Graeser for critical reading and his valuable comments on the manuscript.
Declaration of Conflicting Interests
The authors declared no potential conflicts of interest with respect to the research, authorship, and/or publication of this article.
Funding
The authors received no financial support for the research, authorship, and/or publication of this article.
References
Supplementary Material
Please find the following supplemental material available below.
For Open Access articles published under a Creative Commons License, all supplemental material carries the same license as the article it is associated with.
For non-Open Access articles published, all supplemental material carries a non-exclusive license, and permission requests for re-use of supplemental material or any part of supplemental material shall be sent directly to the copyright owner as specified in the copyright notice associated with the article.