
Abstract
The identification of small molecules that positively modulate the mitochondrial respiratory function has broad applications in fundamental research, therapeutic target validation, and drug discovery. We present an approach in which primary screens for mitochondrial function in yeast are used to efficiently identify a subset of high-value compounds that can in turn be rapidly tested against a broad range of mammalian cell lines. The ability of the yeast assay to successfully identify in a high-throughput format hit compounds that increase the mitochondrial membrane potential and adenosine triphosphate (ATP) levels by as little as 15% was demonstrated. In this study, 14 hits were identified from a collection of 13,680 compounds. Secondary testing with myotubes, fibroblasts, and PC-12 and HepG2 cells identified two compounds increasing ATP levels in hepatocytes and two other compounds increasing ATP in fibroblasts. The effect on hepatocytes was further studied using genomic and mitochondrial proteomic tools to characterize the changes induced by the two compounds. Changes in the accumulation of a series of factors involved in early gene response or apoptosis or linked to metabolic functions (i.e., β-Klotho, RORα, PGC-1α, G6PC, IGFBP1, FTL) were discovered.
Introduction
Mitochondria represent a source of unintended targets producing hepatotoxic adverse effects in drug development 1 and a source of therapeutic targets for the treatment of degenerative diseases, diabetes, obesity, cardiovascular diseases, and cancer. Negative modulation of mitochondria reducing oxidative stress is an attractive model against cancer2,3 or degenerative processes, while positive modulation can restore failing functionality during aging, degenerative diseases, and metabolic diseases.4 –8 The complexity of mitochondrial function provides a plethora of potential therapeutic targets involved in mitochondrial gene expression and genome maintenance, oxidative phosphorylation, antioxidative mechanisms, apoptosis, uncoupling, and so on. One of the challenges in designing screening assays targeting mitochondrial functions is the question of which pathways and specific targets are more likely to yield hit compounds that can produce relevant physiological changes and enter a drug development process. A possible avenue to interrogating mitochondrial function as a source of therapeutic targets is to establish which ones are most amenable to regulation by small molecules. This can be achieved with screens measuring a general mitochondrial phenotype, followed by the identification of the specific targets affected by hit compounds. This approach promises to uncover novel targets, functions, and links between pathways that are yet to be discovered. A multiplex high-throughput approach combining viability, four assays for mitochondrial physiology, and monitoring the expression of nuclear and mitochondrial genes has been developed in cultured myotubes. 9 High-content screening assays are emerging as advanced tools to monitor mitochondrial dysfunction10 –13 or biogenesis. 12 But the drawback of increasing complexity in primary assays is a rapidly increasing cost and a limitation to testing in a broad range of cellular models.
In addition to well-known screening tools such as the two-hybrid, three-hybrid, and protein display, yeast represents a powerful alternative to in vitro assays or mammalian cell-based assays for various applications. 14 Yeast-based assays have been validated for the identification of inhibitors of key fungal, viral, or mammalian enzymes15 –19; for G-protein–coupled receptor–related screens 20 ; and for high-content screening as a model for eukaryotic cells. 21 Yeast as a eukaryotic screening system offers very inexpensive and rapid scalability for hit identification and confirmation, no reagent aging, and a powerful genetic toolbox. While the cell wall does lower permeability to small molecules, yeast suspensions offer very high cell density tested per well compared with a monolayer of adhering cells, producing assays with stronger signal windows. The development of screens related to mitochondrial functions using yeast as host has strong potential in drug discovery given the high degree of conservation of mitochondrial functions across eukaryotes, even including a relative conservation in yeast of mitochondrial mechanisms leading to cell death. 22 An assay, for example, was developed to identify small molecules conferring viability to yeast mitochondrial mutants affected in adenosine triphosphate (ATP) synthase in cybrid cells. 23
Nondividing yeast cells in the postdiauxic phase relying on respiration were used as a tool to identify novel modulators of the mitochondrial function. We report the development of a primary screening assay monitoring subtle increases in the yeast mitochondrial potential and a screening campaign of 13,680 small molecules, followed by secondary screening measuring ATP levels in yeast. Fourteen hit compounds corresponding to six scaffolds were identified and further evaluated in four mammalian cell lines: myotubes, fibroblasts, hepatocytes, and differentiated PC-12 cells. Two related compounds increased ATP levels in fibroblasts, and two other compounds increased ATP levels in HepG2 cells. The effect of these two compounds on hepatocytes was investigated by gene expression profiling and iTraq (AB Sciex, Framingham, MA) proteomic analysis of mitochondrial fractions, identifying a series of changes in high-value targets for drug discovery. This study establishes the use of yeast for high-throughput screening to identify subsets of compounds that in turn can be rapidly tested against a broad range of cultured cell lines for target identification, target validation, and drug development in mitochondrial research.
Experimental Details
Mitochondrial Membrane Potential
D273-10B yeast cells grown to stationary phase (>8 OD600) in YPAD medium were transferred (85 µL) to 384-well filter plates (MZHVN0W50; Millipore, Billerica, MA) except in “no-cell” control wells (half of wells in columns 1 and 24) on a BioTek Precision platform (BioTek, Winooski, VT). Compounds were added (5 µL) and incubated with cells for 24 h at 30 °C. Mitochondrial staining for membrane potential was completed with 10 µL DiOC6(3) (Molecular Probes, Sunnyvale, CA), 175 nM final, for 15 min. Medium and excess dye were removed by centrifugation (2 min 800 g) of the filter plates, and cells were washed twice with phosphate-buffered saline (PBS). Cells were resuspended in 100 µL PBS, and 50 µL was transferred to black/clear-bottom 384-well plates. Fluorescence was measured after a 1-min centrifugation to pellet cells and reduce horizontal drifts within plates. Assay variability ranging from 15% to 20% when measuring DiOC6(3) fluorescence (485/535 nm) was attributed to the transfer step of high-density cell suspensions from filter plates to black plates. Standardization of DiOC6(3) fluorescence against cellular auto-fluorescence (360/465 nm) reduced within-plate variability to 9% to 11%. Control plates with wells exposed to 1% DMSO exhibited a normal distribution, with 3% to 7% of wells having a z score above 1.65 σ on each tail. Empirical analysis determined that a z score of +1.65 σ corresponded to fluorescence 17% higher than the mean on the plate.
Yeast ATP Levels
The BacTiter-Glo kit (Promega, Madison, WI) was used to determine relative ATP levels in nondividing yeast. After exposure to hit compounds for 24 h in 384-well filter plates, cells were washed twice in PBS and resuspended in 50 µL PBS. Half of this suspension was transferred to a 96-well plate (half-area wells) where 25 µL of the reconstituted BacTiter-Glo reagent was added and luminescence measured after 10 min.
Mammalian Cell Culture and ATP Levels
Mammalian cells were cultured in white wall/clear-bottom 96-well plates before measuring ATP levels with the CellTiter-Glo kit (Promega). For Sol8 myoblasts, wells were precoated with Matrigel, and upon reaching confluence, 20% FBS-containing medium was replaced for 3 days with medium supplemented with 2% horse serum to allow for myotube formation. PC-12 cells were grown into Dulbecco’s modified Eagle’s medium (DMEM)–Hi supplemented with 15% fetal bovine serum (FBS) on wells precoated with collagen, then differentiated 5 to 7 days by supplementation with 50 µg/L of nerve growth factor. Cells grown to confluence were exposed to compounds (details in text), washed with PBS, and suspended in 50 µL of reconstituted CellTiter-Glo reagent, and luminescence was measured after 10 min.
Gene Expression Profiling
HepG2 cells were exposed to 0.003% of compounds ST0053241 and ST0053256 (Timtec, Newark, DE) or two control experiments with 1% DMSO. After a 90-min or 18-h exposure, the increase in ATP induced by either compound was verified and total RNA was extracted using the RNeasy Plus Mini Kit (QIAGEN, Valencia, CA). RNA quantity and integrity were measured on an Agilent BioAnalyzer (SUNY Albany Microarray Facility), and processed samples were hybridized to Affymetrix (Santa Clara, CA) Human Gene 1.0 ST arrays. The CEL files were quantile-normalized using PLIER (Probe Logarithmic Intensity ERror algorithm, Affymetrix, Santa Clara, CA), and data were baseline transformed to the median of the DMSO control data. The entities were subjected to a 1.5-fold filter to include those entities that were differentially expressed between any two treatments.
Mitochondrial iTraq Shotgun Proteomics
Cells grown in T-75 or T-150 flasks were scraped and subjected to fractionation using the Pierce/Thermo Fisher Scientific Mitochondria Isolation Kit (89874; Rockford, IL) with detergent lysis (Reagent B) and differential centrifugation at 700, 3000, and 12,000 g. Subcellular fractionation was verified by Western blot using antibodies against coxIV (mitochondria), fibrillarin (nucleus), calnexin (ER), and β-tubulin (cytoplasm). Strong mitochondrial enrichment was obtained at 3000 g, with calnexin associated with all pelleted fractions. The fibrillarin signal verified the nuclear fraction to be pelleted at 700 g, whereas most β-tubulin was pelleted at 12,000 g. For iTraq shotgun proteomics, large-scale mitochondrial enrichment was performed. HepG2 cells were grown into 16 T-150 flasks and exposed for 24 h to 0.75% DMSO in two sets of 4 flasks, 0.003% ST053241 in a third set of 4 flasks, and 0.003% ST053256 in a fourth set of 4 flasks. The increase in ATP induced by either compound was verified, and mitochondrial fractions were purified as described above and resuspended in 60 µL of 0.5 M triethylammonium bicarbonate buffer (pH 8.5; Sigma, St. Louis, MO) containing 0.1% sodium dodecyl sulfate (SDS) for protein solubilization, as recommended for the iTraq protocol. Samples were processed at the Cornell University Proteomics Facility according to the iTraq recommended protocols. 24 Briefly, samples were quantified by SDS–polyacrylamide gel electrophoresis (PAGE) against an Escherichia coli protein standard, and then each sample (100 µg) was reduced to block cysteines by adding 1 µL of 200 mM methyl methanethiosulfonate. Proteins were digested overnight at 36 °C with trypsin (1:10 enzyme to substrate ratio) and then labeled with the iTraq reagents 114 (DMSO control 1), 115 (compound ST053241), 116 (compound ST053256), and 117 (DMSO control 2). The four samples were pooled, passed through SCX cartridges (AB Sciex), desalted on Sep-Pak cartridges (Waters Corp., Milford, MA), and then fractionated by high pH reverse-phase chromatography on a Dionex UltiMate 3000 (Dionex, Waltham, MA) high-performance liquid chromatography (HPLC) system. The iTraq-tagged tryptic peptides were then loaded on an XTerra MS C18 column (Waters Corp.). Collected fractions were subjected to nano liquid chromatography–tandem mass spectrometry (LC-MS/MS) analysis using a LTQ-Orbitrap Velos (Thermo Fisher Scientific, Waltham, MA) mass spectrometer. Raw data files acquired from the Orbitrap were converted into MGF files (Proteome Discover 1.2 (Thermo Fisher Scientific, Waltham, MA) and data searches carried out by Mascot Daemon 2.3 (Matrix Science, London, UK).
Protein Immunoblots
Proteins were extracted from HepG2 cells grown in 6-well plates with the QProteome Mammalian Protein Prep Kit (QIAGEN) and quantified with the BCA Protein Assay Kit (Pierce). Proteins (10 µg) were separated by electrophoresis on PreCast Tris-HCl 5% to 14% gradient gels (Bio-Rad, Hercules, CA) and blotted on PVDF membranes (Bio-Rad). Blots were blocked in 5% milk-TBS-Tween and then exposed to primary antibodies (1:500 dilutions) against the following proteins: FTL (SC-74513; Santa Cruz Biotechnology, Santa Cruz, CA), IGFBP1 (SC-55474; Santa Cruz Biotechnology), β-Klotho (LS-B3568; Lifespan Biosciences, Seattle, WA), and calnexin (#2679; Cell Signaling, Danvers, MA). Detection used alkaline phosphatase-conjugated secondary antibodies and the BCIP/NBT substrate system (Sigma) or Alexa-Fluor 488 secondary antibodies (Molecular Probes, Eugene, OR). The signals were quantified with a Typhoon 9410 Imager and ImageQuant software (GE Life Sciences, Piscataway, NJ).
Statistics
The primary screen in 384-well duplicated plates with the yeast DiOC6(3) assay used a combination of three methods in which a compound was selected if meeting one of three conditions based on within-plate z score: (1) an average z score ≥ +1.65 σ between both replicates, (2) one replicate with a z score ≥ +1.65 σ and the other ≥ +0.5 σ, or (3) both replicates with a z score ≥ +1.0 σ. This low-stringency method was designed to reduce the rate of false negatives when searching for compounds inducing relatively small changes. It produces a high rate of false primary hits, which are counterselected by retesting with the DiOC6(3) assay. All secondary tests using the DiOC6(3) fluorescence and BacTiter/CellTiter luminescent microplate assays were completed in three or four replicate wells, with statistical significance established for p values <0.05 and a minimal increase in mean signal of 15%. In microarray and proteomic analyses, significant changes were defined as genes (corresponding RNA) or proteins with an abundance signal modified by at least 1.5-fold as a result of treatment by two different test compounds corresponding to a same scaffold compared with the mean signal of two control experiments. The approach comparing two treatments with two controls counterselects against nonspecific changes produced in any of the four samples.
Results
Mitochondrial Membrane Potential Assays
Several mitochondrial dyes were evaluated in the automated 384-well format for signal strength, responsiveness to known mitochondrial drugs, and mitochondrial localization. DiOC6(3), with a signal-to-background averaging 6.0, outperformed Rhodamine B and Rhodamine 123 (1.5 to 2.0). Mitochondrial staining was visualized by confocal imaging (data not shown) comparing yeast stained with DiOC6(3) with yeast expressing mitochondrial GFPm, 25 showing in both instances mitochondria localizing to the periphery of the cells, a characteristic of yeast in the stationary phase as opposed to the organization in filament-like networks characteristic of growing cells. 26 Control treatments with carbonyl cyanide p-trifluoromethoxyphenylhydrazone (FCCP), quercetin, and sodium azide reduced the mitochondrial membrane potential, while oligomycin increased the membrane potential (data not shown).
Screening Campaign
The Timtec collections NPL-640 (640 compounds), NDL-3000 (3,040 compounds), and ActiProbe-10K (10,000 compounds) were selected based on structural diversity and drug-like properties. Collections in DMSO were diluted 5.56-fold in water and then added (5 µL) to 85 µL of yeast suspension in 384-well filter plates, bringing DMSO to 1% and compounds to 0.036% (w/v) (100 µM for NDL-3000). Outer wells were not exposed to compounds and used to verify the signal-to-background consistency throughout the campaign. To efficiently identify relatively small increases in the mitochondrial membrane potential in a high-throughput format, compound collections were screened in duplicate plates and three hit selection strategies were compared. A compound was considered a putative primary hit if meeting one of three conditions: (1) an average z score ≥ +1.65 σ between both replicates, (2) one replicate with a z score ≥ +1.65 σ and the other ≥ +0.5 σ, or (3) both replicates with a z score ≥ +1.0 σ. The combined methods identified 793 putative primary hits out of 13,680 compounds, or 5.80%. All 793 putative primary hits were retested in triplicate wells, and 101 were confirmed with fluorescence at least 15% above the control well, for a rate of 0.74% and a false-positive rate of 5.06%. Of these, 10 exhibited auto-fluorescence when tested without DiOC6(3), leaving 91 confirmed primary hits. The three hit selection methods identified 39, 70, and 73 hits, respectively, with neither method identifying alone the 91 hits. Figure 1A shows an example of a confirmation experiment identifying two primary hits from the NDL-3000 collection.
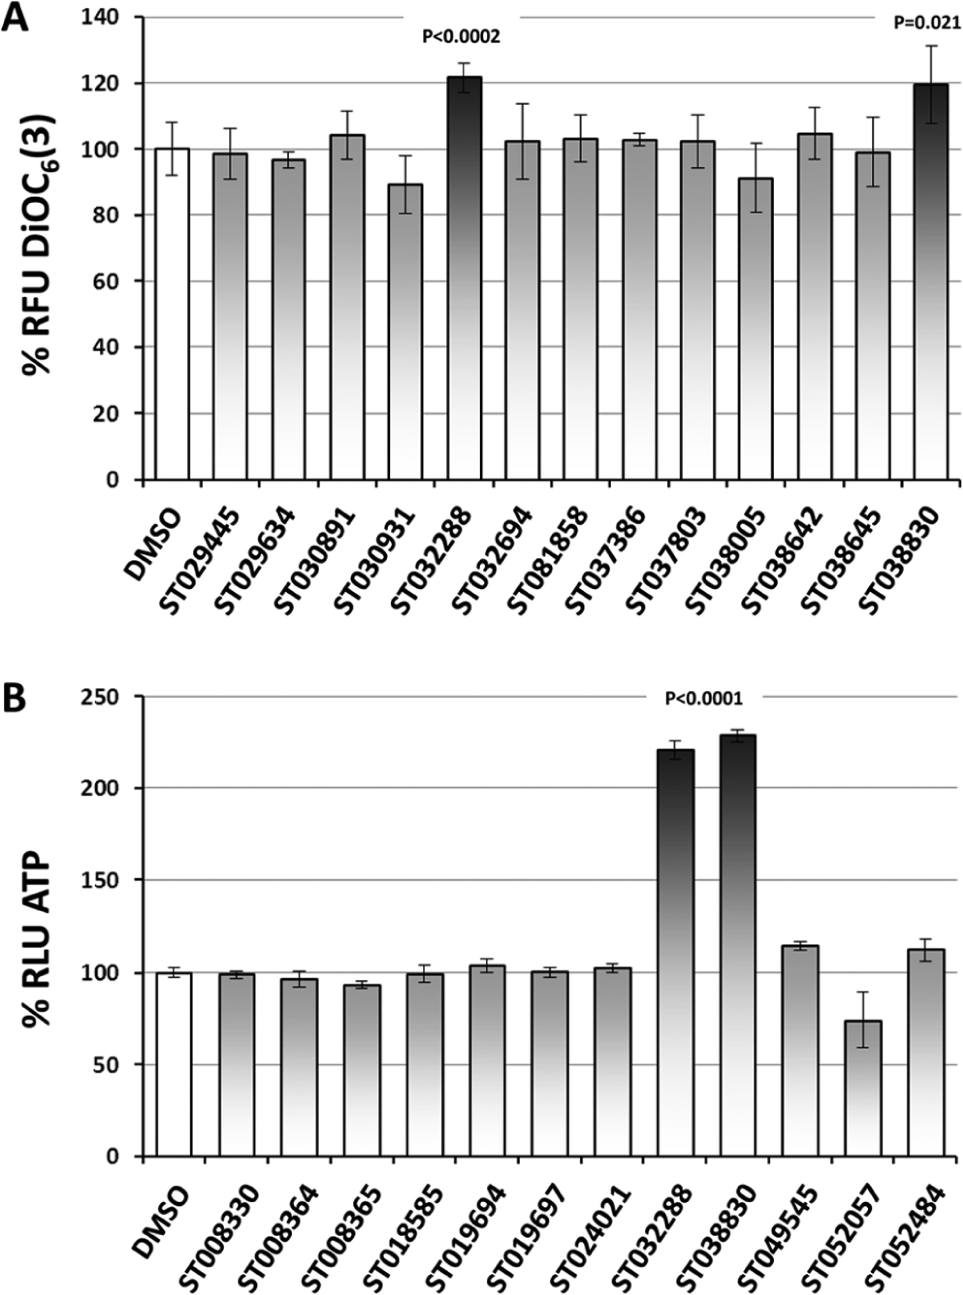
Confirmation of primary and secondary hits in nondividing yeast cells. A total of 793 putative primary hits were defined as compounds increasing the mitochondrial membrane potential according to three hit selection methods used during the screening campaign (see text). The 793 putative primary hits were retested for confirmation with the same DiOC6(3) assay used during the screen. Ninety-one compounds were confirmed. (
Secondary Confirmation: ATP Levels
The luminescent measure of ATP in nondividing yeast was used to confirm hits increasing mitochondrial function against false positives (e.g., ATPase inhibitors that increase the mitochondrial membrane potential but not ATP levels). Of the 91 primary hits, 14 were confirmed to increase ATP content by 15% or more and were referred to as secondary hits ( Fig. 1B ). The ATP luminescent assay exhibited very low variability (% coefficient of variation <5.0%), a strong signal-to-background ratio, and a strong effect induced by hit compounds: the 91 primary hits induced an increase in DiOC6(3) staining fluorescence ranging from 15% to 60%, while the 14 secondary hits increased ATP from 15% to more than 100%. This difference in signal strength is seen when comparing the effect of hits ST032288 and ST038830 in Figure 1B and Figure 1A . These observations indicate that using the ATP assay in primary screens and the DiOC6(3) assay in secondary screens would be a valid approach. The 14 hits increasing ATP levels could be grouped into six scaffolds ( Figure 2 ), unequivocally validating the results of the primary screen. The three hit selection methods in the primary screen, if used as stand-alone methods, would have identified 6, 13, and 10 of the 14 compounds later confirmed as secondary hits. The elucidation of the mechanism of action by which these compounds are able to increase the yeast mitochondrial membrane potential and cellular ATP content using genomic and proteomic approaches could lead to valuable insight into how small molecules can modulate mitochondrial function.
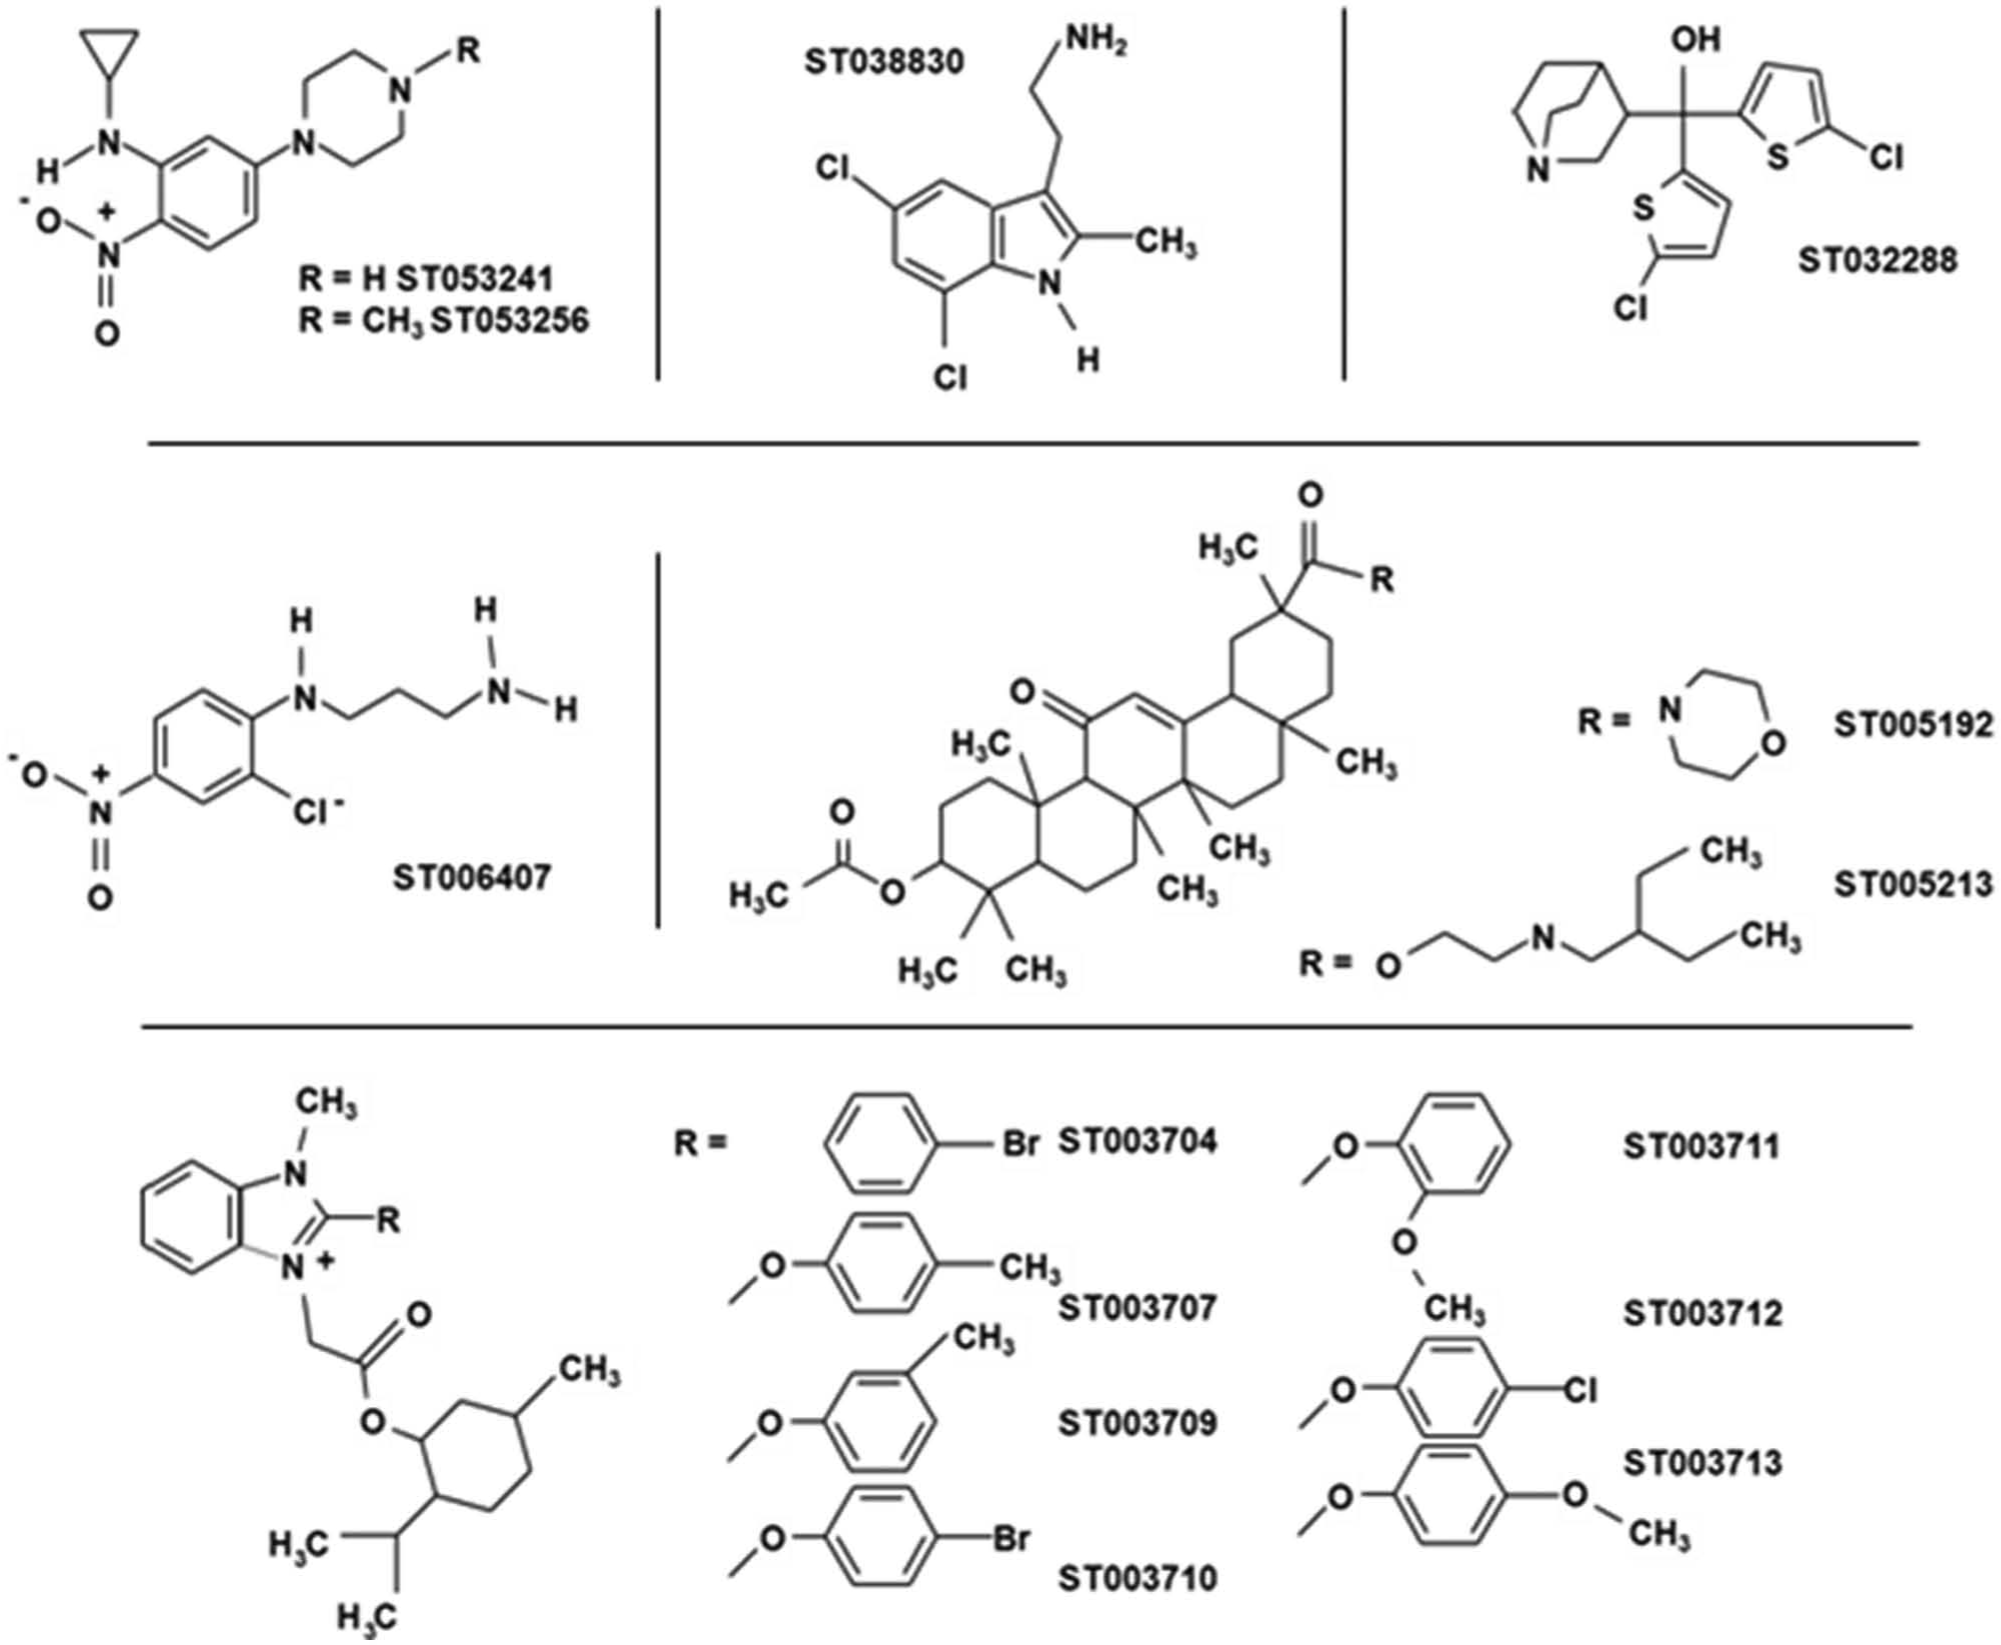
Structure of secondary hits. The 14 hits increasing the yeast mitochondrial membrane potential and adenosine triphosphate levels were grouped into six scaffolds: three scaffolds with a single member, two scaffolds with two members, and a scaffold with seven members.
The ability of a yeast-based screen to identify a subset of compounds with a strong likelihood of affecting mitochondrial function in mammalian cells was demonstrated by measuring ATP levels in four mammalian cell lines. All secondary hits were used in these studies except for the seven-compound scaffold ( Fig. 2 ) represented by compounds ST003709 and ST003711. Sol8 myotubes, HepG2 hepatocytes, differentiated PC-12, and 3T3 fibroblasts were exposed for 24 h to compounds at concentrations of 0.001%, 0.002%, and 0.004% (v/w). Figure 3A shows the results obtained for the nine compounds at 0.004%. Related compounds ST003709 and ST003711, as well as ST032288, had strongly deleterious effects on all cell lines, while ST038830 had deleterious effects on myotubes and fibroblasts. Related compounds ST005192 and ST005213, as well as ST006407 and related compounds ST053241 and ST053256, had negative effects on myotubes and fibroblasts. Lowering compound concentrations reduced these effects, but no increase in ATP could be observed (data not shown). With several compounds appearing toxic to different cell lines, it is possible that some induced a mitochondrial dysfunction or mitochondria-dependent apoptosis. Interestingly, both ST005192 and ST005213 (same scaffold) produced a slight increase in fibroblast ATP content when tested at 0.001% and 0.002% (not shown in Fig. 3 ). Because of the strong qualities of the ATP assay and because both compounds are related, the increase in ATP was verified using five replicates of four different levels of compound “randomly” distributed at the center of a 96-well plate to eliminate any potential position effect. These experiments confirmed an increase in fibroblast ATP by 5.2% (p = 0.004) when either compound was added (maximum effect was obtained at 0.002%; data not shown). The positive effects on HepG2 cells were stronger, with compound ST038830 and related compounds ST053241 and ST053256 increasing ATP by 20% to 40% ( Fig. 3A ). The dose response on HepG2 cells was established for these three compounds ( Fig. 3B ), with the strongest increase in ATP obtained with 0.0035% compound. It should be noted, however, that during subsequent attempts to study these three compounds, the effect of ST038830 shown in Figure 3A , B could not be reproduced despite repeated attempts. The effect of ST038830 on yeast and HepG2 was observed consistently with the initial compound collection microplate but could not be reproduced after fresh stocks were ordered for further studies. The discrepancy in results could be due to a mislabeling of the compound in the initial collection plate or a contamination during the automated dilution/replication of this initial collection plate. In this context, compounds ST053241 and ST053256 were used in subsequent gene expression profiling and mitochondrial proteomics experiments designed to identify the effects induced by the two compounds on hepatocytes.
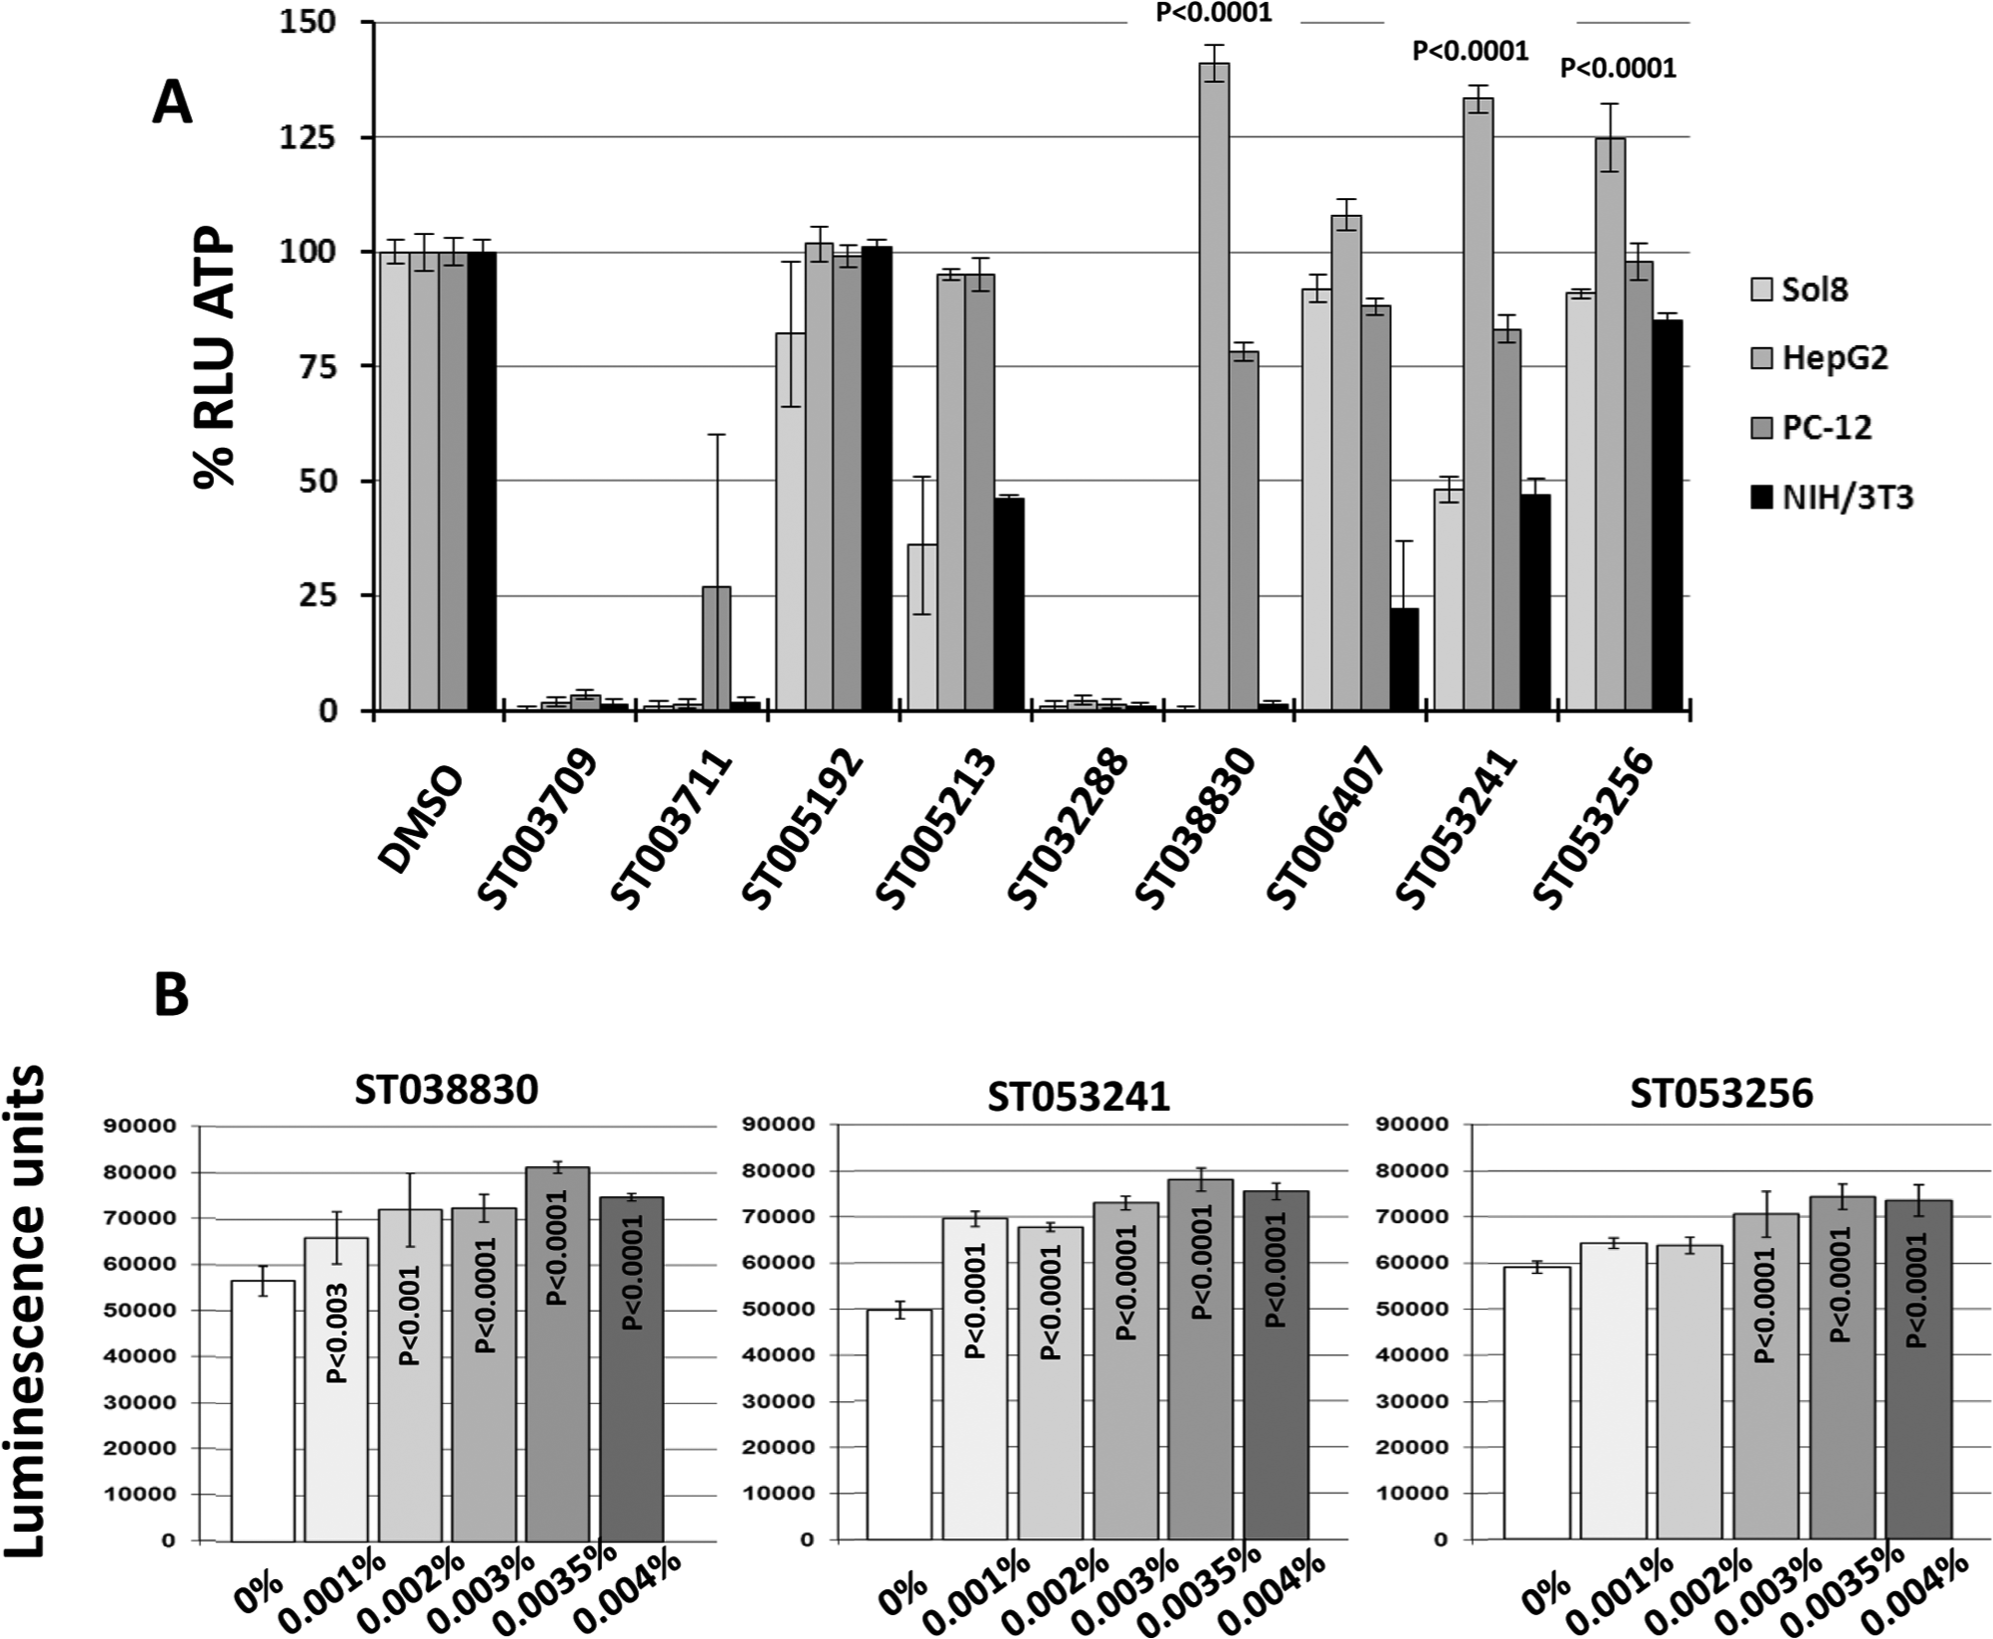
Effect of secondary hits on adenosine triphosphate (ATP) levels in cultured mammalian cells. (
Gene Expression Profiling in HepG2 Cells
ST053241 and ST053256 are phenyl piperazine derivatives ( Fig. 2 ). Their effect on gene expression was investigated. HepG2 cells were exposed to compounds for 90 min and 18 h to identify early and late responses. The experimental setup included two independent controls exposed to 1% DMSO, and notable changes in gene expression were defined as genes affected by both compounds against both controls to efficiently eliminate outliers. Scatter plots of log2 ratios for compound treatments over DMSO controls identified a group of genes upregulated or downregulated in response to both compounds ( Table 1A , B ). Compound ST053241 consistently induced stronger changes than ST053256. Several genes appeared downregulated after 90 minutes ( Table 1A ), while different genes were both upregulated and downregulated after 18 h ( Table 1B ). The repression of ANKRD1 and CYR61 was observed in both experiments. Among the genes listed in Table 1A , B , several encode known or putative actors in mitochondria-related functions, including apoptosis and cellular metabolism, or with key functions such as transcription factors. These genes and their links to mitochondrial function are described in the Discussion.
Effects of Compounds ST053241 and ST053256 on Gene Expression and on Protein Accumulation in Mitochondrial Fractions of HepG2 Cells.
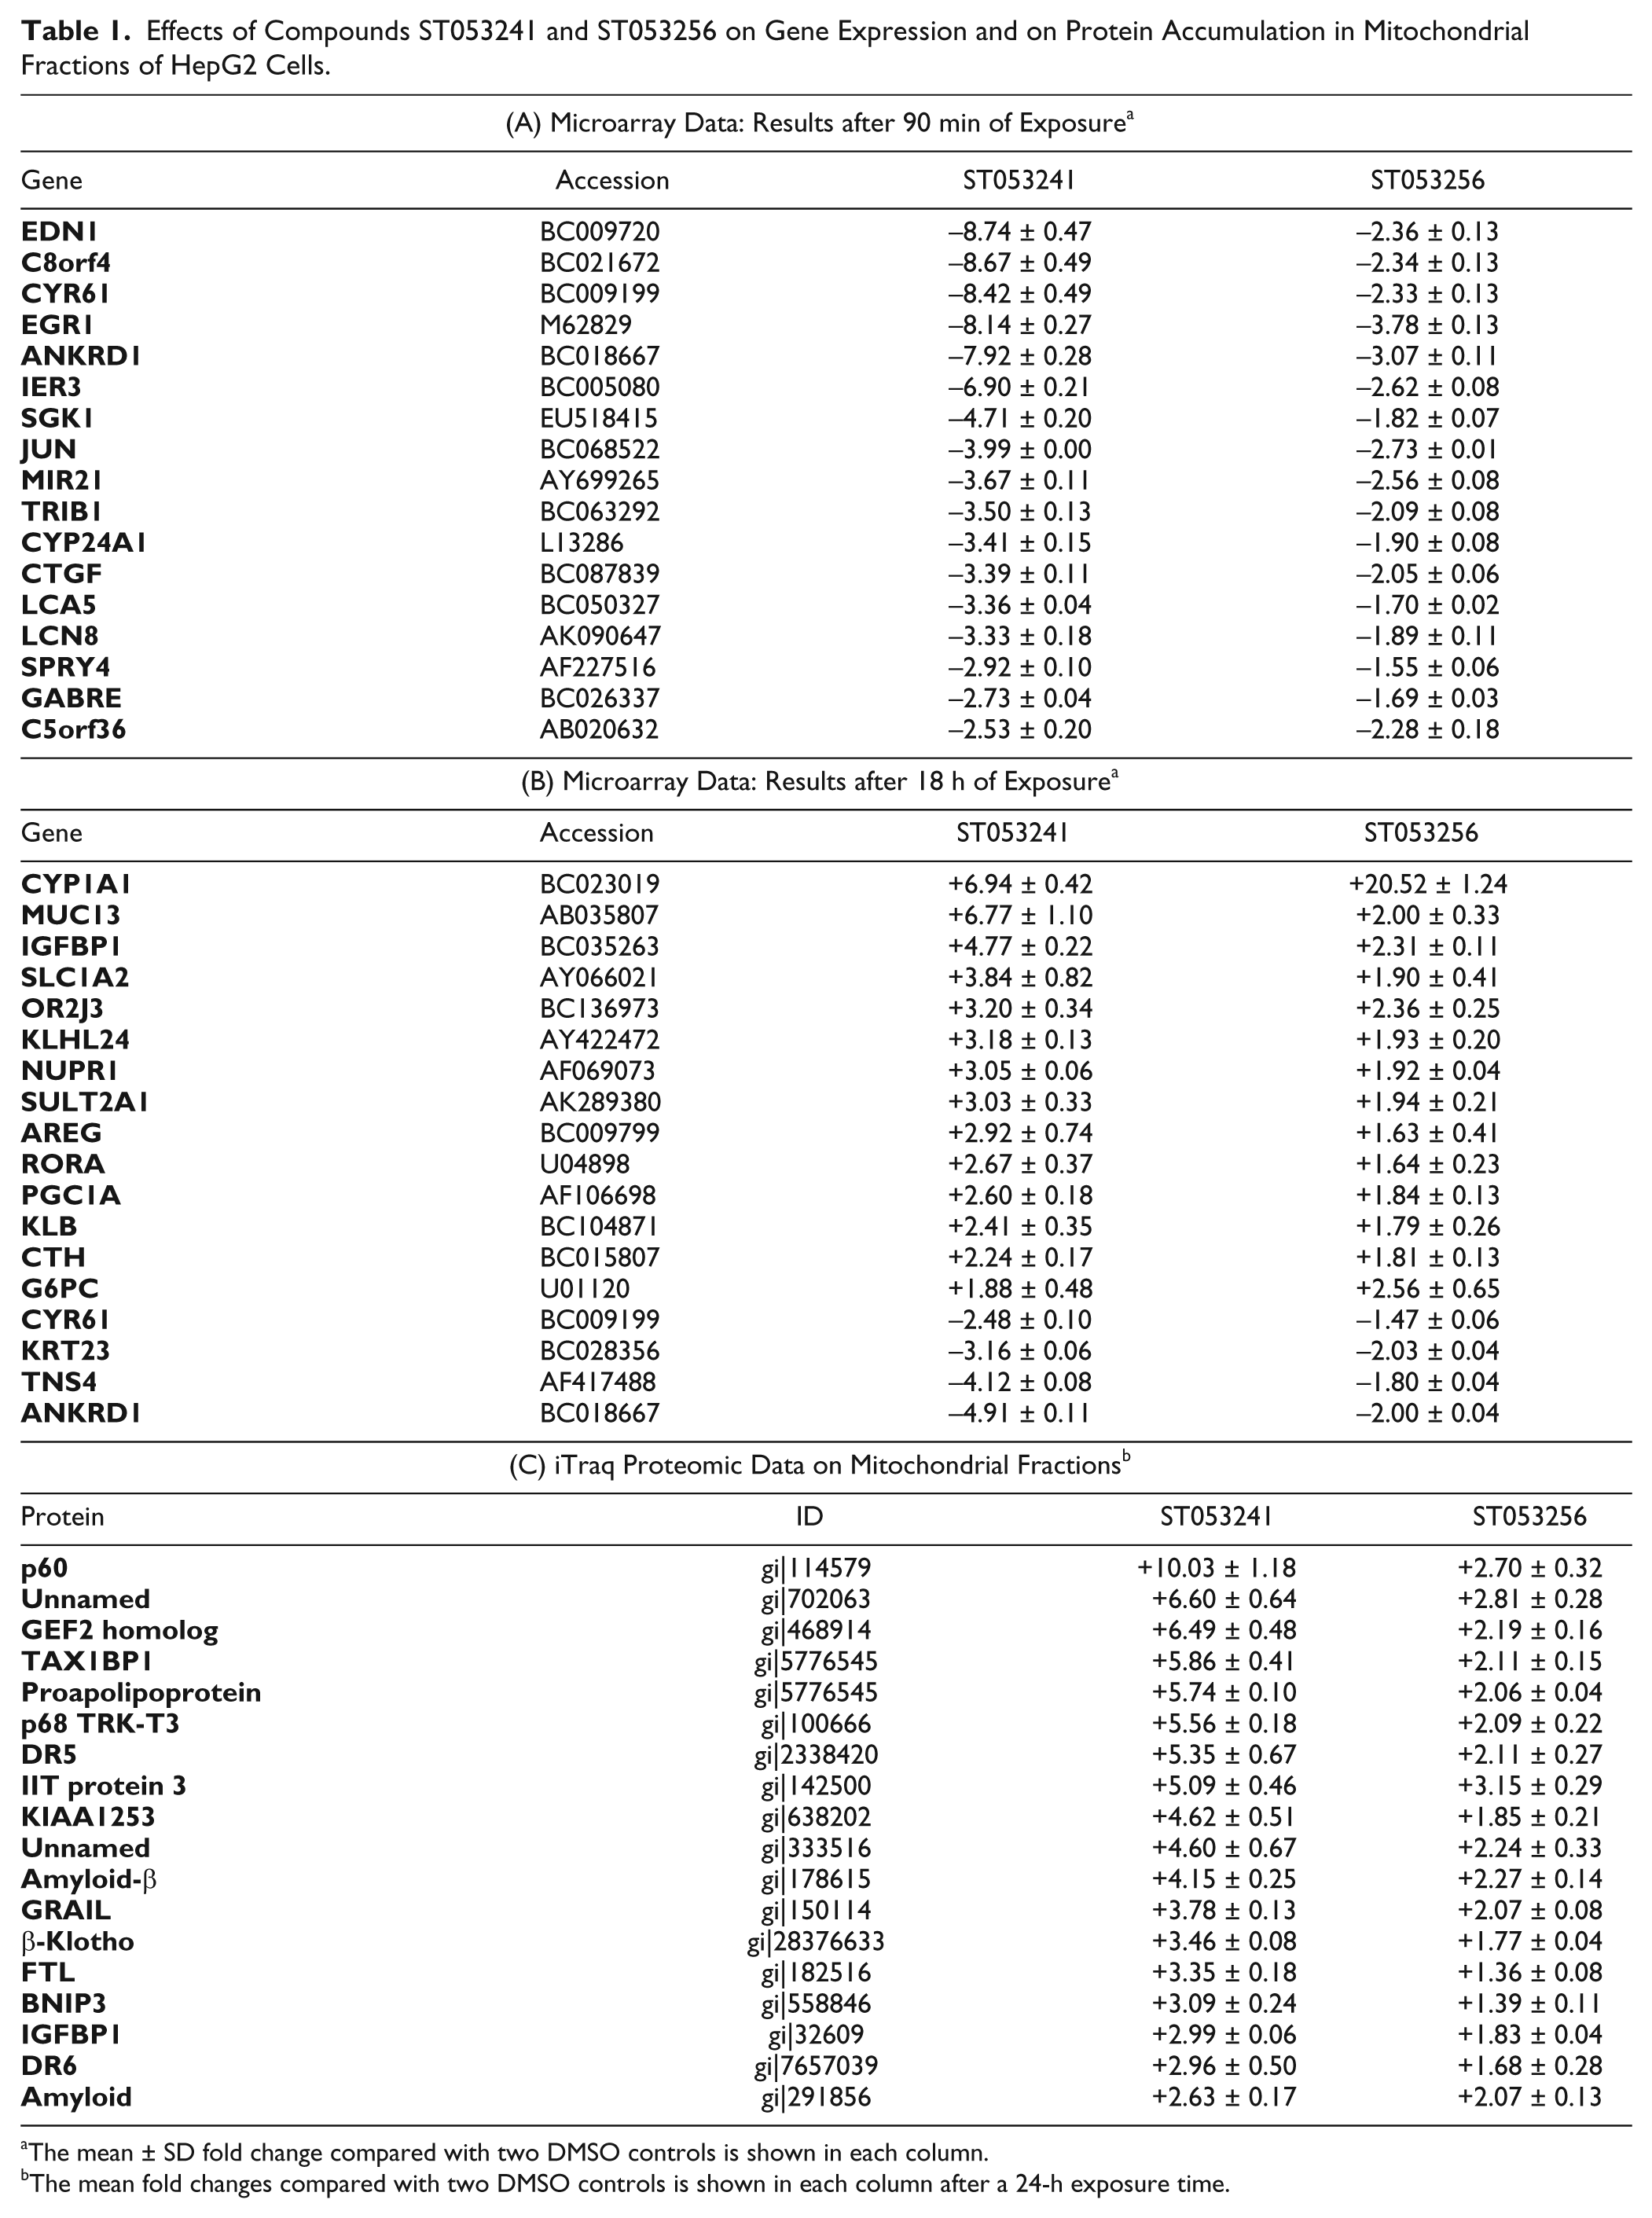
The mean ± SD fold change compared with two DMSO controls is shown in each column.
The mean fold changes compared with two DMSO controls is shown in each column after a 24-h exposure time.
Mitochondrial iTraq Shotgun Proteomics in HepG2 cells
Next, the effect of the two compounds on HepG2 cells was established by proteomic analysis of mitochondrial fractions. The experimental setup was similar to the one used for gene expression analysis, in which the 24-h exposure to compounds ST053241 and ST053256 was compared with two independent control samples exposed to DMSO. Notable changes in protein accumulation were defined as proteins affected by both compounds against both controls to eliminate statistical outliers. A “control versus control” analysis identified only two obvious outliers with a fold change higher than 2. The method provided quantitative results for a total of 2231 unique proteins in the NCBI human database. The scatter plots shown in Figure 4 illustrate several findings: A group of ~20 proteins accumulated in response to both compounds against both controls, while no protein exhibited a lower level in response to both compounds (the dot seen in the lower left quadrant of Fig. 4A and the two dots in Fig. 4B do not correspond to each other and as such are outliers produced by the control data). Also seen in Figure 4 is the stronger effect induced by ST053241 compared with ST053256 (compare the x-axis with the y-axis in Fig. 4A , B ), in agreement with the gene expression data ( Table 1A , B ) and ATP experiments ( Fig. 3 and data not shown). The proteins accumulating in response to the compounds are listed in Table 1C . Some have a known role in mitochondrial function, apoptosis, or cellular metabolism. Two of the proteins accumulating at 24 h (IGFBP1 and β-Klotho) confirmed changes seen at the RNA level at 18 h ( Table 1B ), further validating the data produced by the genomic and proteomic approaches. A complete overlap of RNA and protein data was not expected for several reasons: Exposure times were different, regulation at the RNA and protein levels do not always correlate, and the proteomic approach investigated enriched mitochondrial fractions while the genomic approach investigated the nuclear genome.
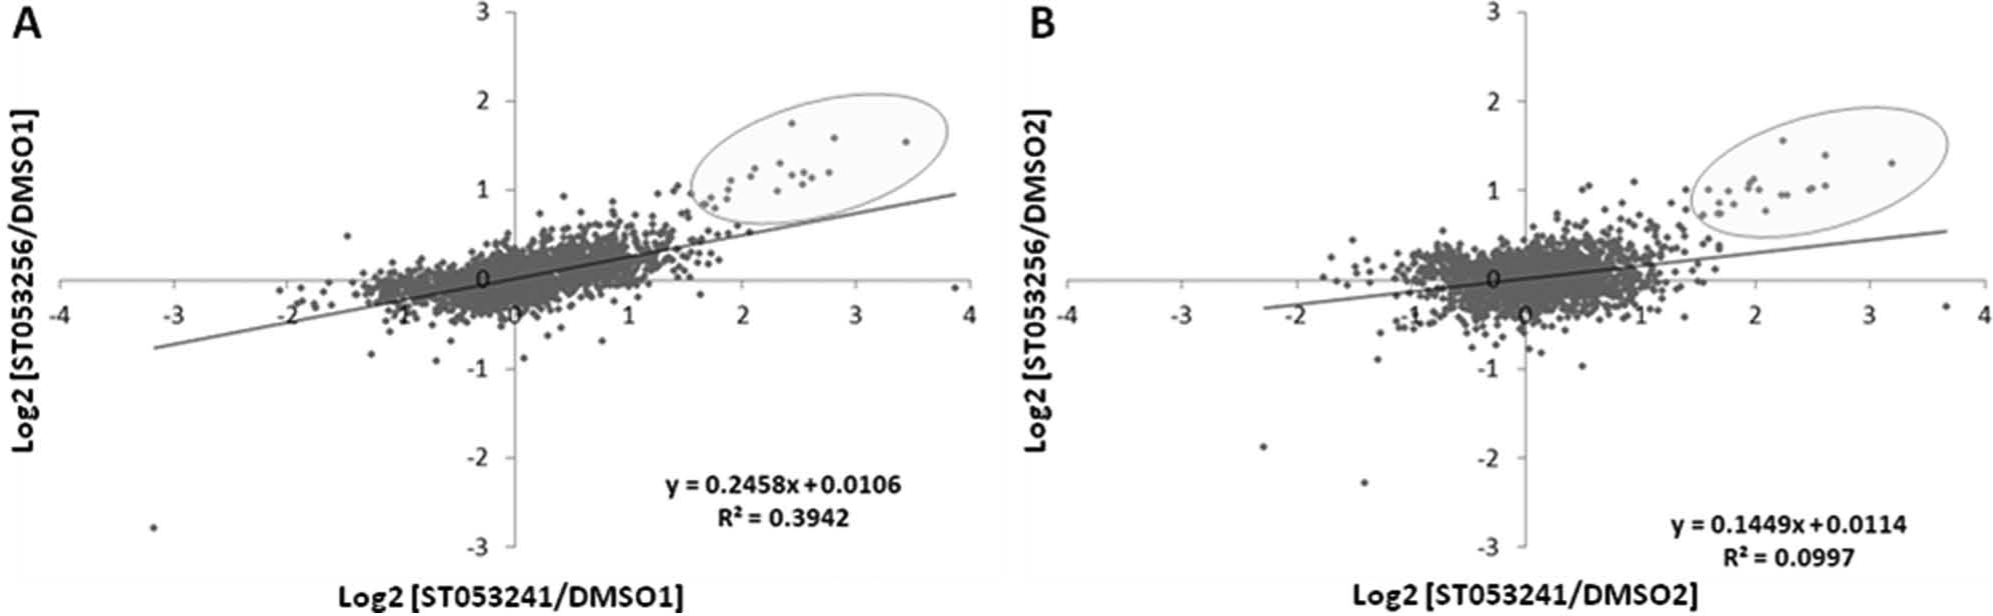
Comparison of iTraq proteomic Log2 ratios. Data for 2231 proteins identified in enriched mitochondrial fractions from HepG2 cells exposed to DMSO controls 1 and 2, ST053241, or ST053256 at 0.003% (w/v) for 24 h. Effect of ST053241 and ST053256 against DMSO1 (
Among the proteins listed in Table 1C , several are known to be involved in mitochondria-related functions, including apoptosis and cellular metabolism. The relevance of these proteins in this study is presented in the Discussion. Overlaps in results between the 90-min RNA data, the 18-h RNA data, and the 24-h iTraq proteomic data validate the overall approach and results. Western blot analysis was used for some of these proteins to further confirm the microarray and iTraq proteomic data. Figure 5 shows the results obtained for FTL, β-Klotho, and IGFBP1 (other commercial antibodies against c-JUN, IER3, or EGR1 failed to produce quantifiable signals). The signals in Figure 5 show that ST053241 increased the FTL signal 2-fold, whereas ST053256 had a limited effect, confirming the iTraq data in Table 1C . For β-Klotho, both compounds increased the signal 2.5-fold, confirming both the 18-h RNA data and 24-h proteomic data in Table 1B , C . For IGFBP1, protein accumulation increased 4.7- and 3.3-fold in response to ST053241 and ST053256, respectively, again confirming data in Table 1B , C and the general observation that ST053241 induces stronger changes.
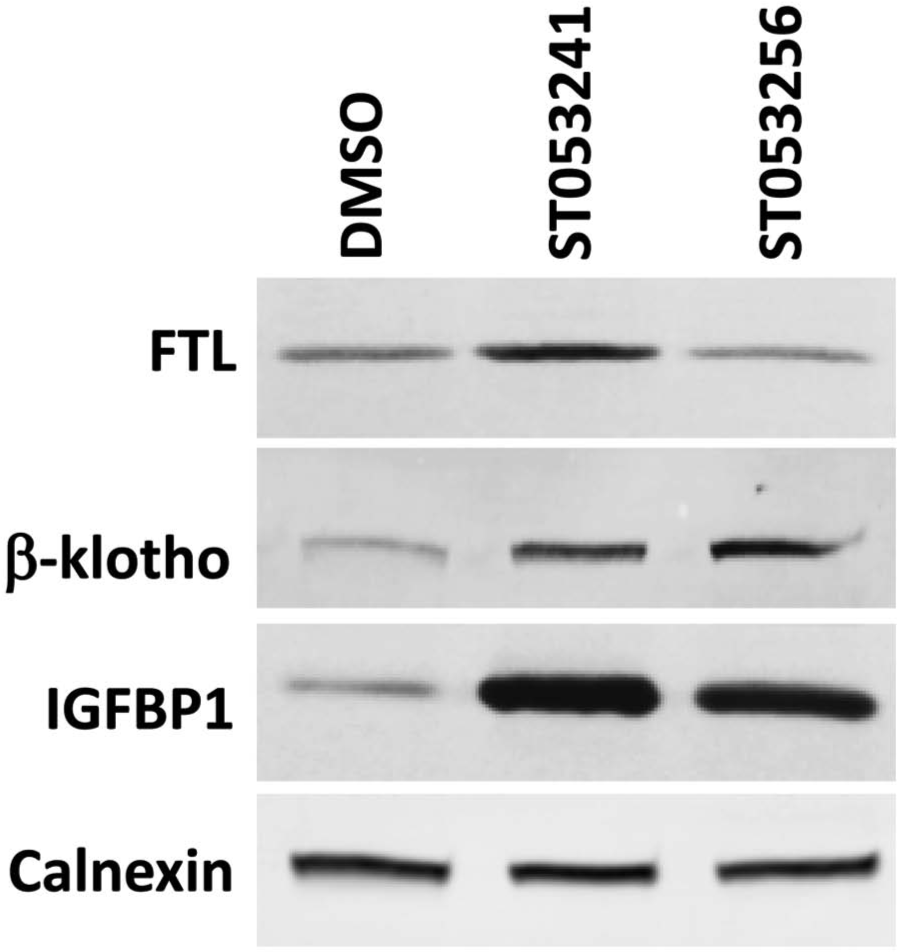
Effect of ST053241 and ST053256 on FTL, β-Klotho, and IGFBP1 accumulation in HepG2 cells. Immunoblots were carried out on proteins extracted from HepG2 cells exposed for 24 h to DMSO, ST053241, or ST053256 at 0.003% (w/v). Calnexin detection serves as control.
Discussion
Yeast High-Throughput Screen
The duplicate screening of 13,680 compounds tested three hit selection methods designed to identify relatively small changes in mitochondrial DiOC3(6) staining. The combined methods identified 793 putative primary hits, 91 of which were confirmed for their ability to increase fluorescence by at least 15%. The subsequent identification of 14 compounds also increasing ATP levels and representing 6 scaffolds validated the approach. None of the three hit selection methods identified the 91 primary hits or the 14 secondary hits, but the last two methods (one replicate with a z score ≥ +1.65 σ and the other ≥ +0.5 σ, or both replicates with a z score ≥ +1.0 σ) performed best. The 14 secondary hits could be used to further study regulation of mitochondrial function in yeast and gain insight into fundamental regulatory mechanisms. Changes in yeast gene expression profiles could be a method of choice due to the relative low cost and simplicity. The present study focused on testing the secondary hits in mammalian cells to demonstrate the value of a yeast-based primary screen in identifying a subset of compounds with a strong likelihood of affecting model systems more relevant for drug discovery.
Hit Compound Testing in Mammalian Cells
Testing of the six scaffolds in different mammalian cells led to several key findings. A modest but reproducible positive effect on ATP was observed for two related compounds in 3T3 fibroblasts, while a strong effect on HepG2 hepatocytes was established for two other related compounds. These results confirm that a primary screen in yeast can successfully reduce a large collection to a set of compounds of interest, which in turn can be tested against a wide variety of cell types. A notable observation on the effect of hit compounds on ATP content is the consistent stronger responses observed in yeast compared with mammalian cells: Figure 1B shows two compounds increasing ATP in yeast by more than 100%. One of these compounds is ST038830, which increased ATP in HepG2 cells by no more than 40% in any of the tested conditions. Similarly, when ST053241 and ST053256 were confirmed with the yeast assay (data not shown), the increase in ATP was measured at 110% and 40% higher than control wells, higher than any of the responses seen in HepG2 cells. These stronger effects confirm the stated hypothesis that the high density of nondividing yeast cultures produces assays with larger signal windows, an advantage over mammalian cells and an important element in a screen attempting to identify moderate changes in the highly regulated mitochondrial function. This is despite the fact that the yeast cell wall is less permeable to small molecules, and keeping in mind that for any given compound, the affinity for a specific target may or may not be stronger in mammalian cells depending on sequence and structure variability.
Importantly, the fact that most hits found in yeast did not increase ATP levels in any of the cell lines tested, and none increased ATP in two different cell lines, shows that although mitochondrial function is conserved across cell types and organisms, susceptibility to small molecules may differ significantly. This could be explained, for example, in part by differences in nuclear gene regulation between cell types and is of significant importance in the development of screens related to mitochondrial function.
The positive effect of compounds ST053241 and ST053256 on HepG2 cells was selected to demonstrate how hits can be further studied to gain valuable insight into key actionable regulatory mechanisms related to mitochondrial function. The combination of gene expression profiling with a proteomic analysis of mitochondrial fractions identified an array of changes induced by the two compounds. Remarkably, ST053241 consistently induced stronger changes than ST053256 at the ATP, RNA, and protein levels. This, combined with the overlapping results obtained between the three data sets ( Table 1A – C ), and the use of two different compounds compared with two independent controls, validates the observations made in the genomic and proteomic approaches.
The gene expression profiling data summarized in Table 1A , B identified factors involved in gene expression, mitochondrial function, and metabolism (see list of relevant references in the supplemental data). Within 90 min, several genes were downregulated. CYR61 (CCN1) and CTGF (CCN2) code for immediate early response genes that induce reactive oxygen species (ROS) levels and FAS-mediated mitochondria-dependent apoptosis. ANKRD1 codes for a possible activator of apoptosis in hepatoma cells. The expression of END1 (endothelin 1) was also strongly repressed after 90 min. Endothelin 1 is a survival factor during myocardial mitochondria-dependent apoptosis, during which its expression is induced. Also repressed is the expression of the early growth response 1 (EGR1), a transcriptional activator and repressor of numerous genes, many of which are involved in cell differentiation and mitogenesis. EGR1 has been linked to calcium homeostasis, cytochrome c expression and mitochondria, induction of apoptosis in mitochondria, and the inactivation of DR5. IER3, the immediate early response 3, is an antideath protein that shuttles between the nucleus and cytosol but is also localized in the mitochondrial membranes. Its repression is a drug target in colon and pancreatic cancer. It is repressed by vitamin D3, which plays a role in calcium homeostasis and apoptosis, with possibly dual pro- and antiapoptotic roles linked to partial localization to mitochondria and a decrease in ROS levels. JUN is an early response transcription factor regulating various pathways, including apoptosis and the inflammatory response. It regulates the expression of EGR1 and is activated by interacting with EGR1. SGK1 activates potassium, sodium, and chloride channels and is involved in antiapoptotic cell survival in response to stress. It localizes predominantly to the mitochondrial outer membranes. MIR21, also repressed after 90 min, codes for a microRNA implicated in cancer development and heart disease. Among known targets for MIR21 is Bcl-2, a key effector in mitochondria-dependent apoptosis. The expression of MIR21 is repressed by estradiol, resulting in increased Bcl-2 levels. Finally, the repression of CYP24A1 was observed. This cytochrome P450 localizes to mitochondria and initiates the degradation of 1,25-dihydroxyvitamin D3, the physiologically active form of vitamin D3, by hydroxylation of the side chain. In regulating the level of vitamin D3, this enzyme plays a role in calcium homeostasis and the endocrine system. Vitamin D3 was noted above as a repressor of IER3 expression and positively regulates the expression of CYP24A1.
At 18 h, continuing repression of CYR61 and ANKRD1 and the repression of TNS4 were observed. Tensin 4 (Cten) is involved in cellular adhesion and is a caspase-3 substrate cleaved during apoptosis. A series of upregulated genes were linked to cellular metabolism or apoptosis: NUPR1, which binds to p53 and protects cells against apoptosis; AREG, which inhibits BAX expression and apoptosis; and the hepatic IGFBP1, a fraction of which localizes to mitochondria, where it blocks the BAK protein involved in p53-mediated apoptosis. Interestingly, vitamin D has been linked to the expression of IGFBP1. Besides the upregulation of these antiapoptotic effectors, the induced expression in liver cells of IGFBP1, G6PC, RORα, PGC-1α, and β-Klotho by the two phenylpiperazine derivatives is remarkable: G6PC, the glucose-6 phosphatase localized to the endoplasmic reticulum, catalyzes the hydrolysis of D-glucose 6-phosphate into D-glucose during gluconeogenesis and glycogenolysis. β-Klotho is expressed in the liver, where it activates FGF15/19 (reduction of acid bile synthesis) and FGF21 (stimulation of glucose uptake in adipocytes, induced by fasting). PGC-1α is a master player in stimulation of mitochondrial function. It is induced in liver when fasting and is a key mediator in energy expenditure under the control of SIRT1 and the AMPK. Interestingly, it appears to be involved in a negative feedback loop with FGF21 by repressing FGF21 expression, which in turn induces PGC-1α expression. PGC-1α induces the gluconeogenic pathway, including glucose-6 phosphatase, and is in fact a coactivator of RORα, a nuclear receptor with multiple functions, including increasing FGF21 expression and secretion.
In the mitochondrial proteomic data after 24 h of exposure, IGFBP1 and β-Klotho accumulated, confirming the RNA analysis after an 18-h exposure. Also notable were amyloid and amyloid-β. Amyloid-β is well known for forming aggregates outside of brain neurons and localizing to mitochondria, where it is involved in p53-mediated apoptosis and early development of Alzheimer disease. In the liver, factors such as IGFBP1 prevent the role of amyloid-β in p53-mediated apoptosis. The proapoptotic effectors of the extrinsic apoptotic pathway death receptor DR5 and DR6 (TNFRSF21), as well as the proapoptotic factor BNIP3 located in the mitochondrial outer membrane and interacting with the antiapoptotic protein BCL-2 and the antiapoptotic effector TAX1BP1 (TXBP151), also accumulated. Finally, the accumulation of the ferritin light subunit FTL was observed. It is involved in iron homeostasis and, when defective, in degenerative processes such as mitochondrial oxidative damage. FTL has been found to complement the effect on aging and excessive iron accumulation of yeast mitochondrial frataxin mutants. References linking these different proteins to mitochondrial function are listed in the supplemental data.
Overall, strong patterns were observed with effects on the regulation of early response genes, pro- and antiapoptotic effectors, and key effectors in vitamin D metabolism and liver metabolism. Further studies will be needed to establish what the direct targets of compounds ST053241 and ST053256 are and how they indirectly trigger other changes in gene expression. The known role of upregulated proteins such as FTL for iron storage in mitochondria; the overexpression/accumulation of G6PC, RORα, PGC1α, IGFBP1, and β-Klotho with implications on sugar and lipid metabolism, diabetes, and obesity; and the changes in pro- and antiapoptotic effects warrant further studies with cultured hepatocytes and mice. It should be noted that the identification of certain proteins in the enriched mitochondrial fractions was unexpected. Contaminants such as histones are typically found in mitochondrial fractions, and the identification of some of these proteins in this study may reflect similar co-purification artifacts, but the investigation of a possible and unknown mitochondrial localization using, for example, cell imaging could lead to exciting new discoveries.
The goal of this study was to demonstrate the value of using nondividing yeast in establishing a high-throughput assay capable of identifying small molecules increasing mitochondrial function, which in turn can be used to study key functions in mammalian cells or other model systems. The key advantages in using yeast include the very low cost, low labor, high scalability, and rapid assay execution. In addition, it may provide stronger signal windows of importance for a more sensitive primary screening method.
The main challenge in monitoring mitochondrial membrane potential in a primary screen is the fact that relatively small changes are expected as oxidative phosphorylation is highly regulated. A compound strongly affecting a specific molecular target involved in mitochondrial function will trigger much more moderate changes in the membrane potential. The ability to screen for these moderate changes offers a unique opportunity to discover these new molecular targets that are responsive to regulation by small molecules. The identification of small changes in a high-throughput format is directly affected by variability of the primary assay in place. The DiOC3(6) assay performed very well in this context. The identification of primary hits increasing the fluorescence of the membrane potential subsequently confirmed by secondary testing for increased ATP levels validated the screening campaign. The lower variability and stronger effects observed with the yeast ATP assay suggest that a screening campaign using ATP as the primary assay and the DiOC3(6) fluorescence in secondary assays would have performed equally well or better. Reagent cost, however, is significantly lower for DiOC3(6) as a more economical option for large-scale screens.
The hit confirmation results obtained with different mammalian cell lines established the success of the screen in identifying small subsets of compounds with a strong likelihood of affecting a model system relevant for target identification and drug discovery. These results also underscore strong differences in susceptibility to small molecules across cell types, despite the generally recognized conservation of the mitochondrial function, which constitutes a challenge in drug discovery related to mitochondrial function.
The focused study on two related hit compounds affecting cultured hepatocytes, combining gene expression profiling and shotgun proteomic analysis with enriched mitochondrial fractions, revealed a series of notable changes linked to liver metabolism and established a path toward understanding how novel hit compounds affect mitochondria. Following up on this pilot scale study, larger collection screens using yeast and secondary testing with a broader range of cultured cell types will yield a significantly larger number of high-value compounds.
Footnotes
Acknowledgements
We thank Professor Tom D. Fox (Cornell University) for yeast strains and scientific discussions, Professor Carl Batt (Cornell University) for scientific discussions, Dr. Sheng Zhang (Director of the Cornell University Proteomics and Mass Spectrometry Core Facility), Dr. Sridar Chittur (Director of the Microarray Core Facility Center for Functional Genomics at SUNY Albany), and Dr. Micheline Strand at the U.S. Army Research Laboratory.
Declaration of Conflicting Interests
The authors declared no potential conflicts of interest with respect to the research, authorship, and/or publication of this article.
Funding
The authors disclosed receipt of the following financial support for the research, authorship, and/or publication of this article: This work was funded by an STTR grant to Agave BioSystems and Cornell University from the U.S. Army Research Laboratory (Award Number W911NF-09-C-0104).