
Abstract
Tumor cell proliferation assays are widely used for oncology drug discovery, including target validation, lead compound identification, and optimization, as well as determination of compound off-target activities. Taking advantage of robotic systems to maintain cell culture and perform cell proliferation assays would greatly increase productivity and efficiency. Here we describe the establishment of automated systems for high-throughput cell proliferation assays in a panel of 13 human tumor cell lines. These cell lines were selected from various types of human tumors containing a broad range of well-characterized mutations in multiple cellular signaling pathways. Standard procedures for cell culture and assay performance were developed and optimized in each cell line. Moreover, in-house developed software (i.e., Toolset, Curvemaster, and Biobars) was applied to analyze the data and generate data reports. Using tool compounds, we have shown that results obtained through this panel exhibit high reproducibility over a long period. Furthermore, we have demonstrated that this panel can be used to identify sensitive and insensitive cell lines for specific cancer targets, to drive cellular structure-activity relationships, and to profile compound off-target activities. All those efforts are important for cancer drug discovery lead optimization.
Keywords
Introduction
Human cancer cell lines provide physiologically relevant models for oncology drug discovery since they maintain the uncontrolled growth property of cancer cells and were derived from a variety of human tumor types. Furthermore, multiple signaling pathways important in tumor genesis and progression are also deregulated in cancer cell lines.1–3 Therefore, generating cytotoxicity profiles by screening compounds across a panel of tumor cell lines with known signaling pathway deregulation would allow in-depth understanding of compound mechanisms of antitumor activities and address compound off-target activities. This approach has been successfully used to identify anticancer therapeutic reagents,4,5 discover mechanisms of toxicity, 6 investigate off-target effects of drugs, 7 and determine biomarkers and sensitivity of certain tumors.8,9
We selected a total of 13 cell lines for an oncology cytotox panel ( Table 1 ) based on three criteria: tumor type diversity, inclusion of validated major oncologic pathways, and the capacity to screen hundreds of compounds each week. All cell lines were originally established from primary human carcinoma and consist of six major tumor types: A2780 was derived from human ovarian cancer; A549, NCI-H2087, and NCI-H661 were originated from lung cancer cells; CCRF-CEM was obtained from human acute lymphoblastic leukemia; SET2 was generated from human megakaryoblastic cells; HCT116, LS174T, and Colo205 were established from primary colon carcinomas; LNCaP-FGC was obtained from human prostate cancer cells; MDA-MB231 and MDA-MB468 were originated from breast adenocarcinoma; and Du4475 was derived from a metastatic module of breast cancer. In addition, we selected cell lines containing mutations in oncogenes and tumor suppressors, which led to deregulated critical signaling pathways involved in cell growth and survival, apoptosis, and cell cycle regulations (http://sanger.ac.uk/genetics/CGP/cosmic/CellLines).10,11 The mutations within the cytotox panel cell lines are mostly associated with (1) the RAS/RAF/MEK/ERK pathway, (2) the phosphatidylinositol 3-kinase (PI3K) pathway, (3) the p53 pathway, (4) the Wnt pathway, (5) the cell cycle pathway, and (6) the cytokine signaling pathway. Finally, we selected a tumor cell line number that was amenable to perform dose-response analysis for about 500 compounds per run, considering our automation and data analysis capabilities.
List of the Oncology Cytotox Panel with Related Tumor Types, Pathways Affected, and Key Mutations.
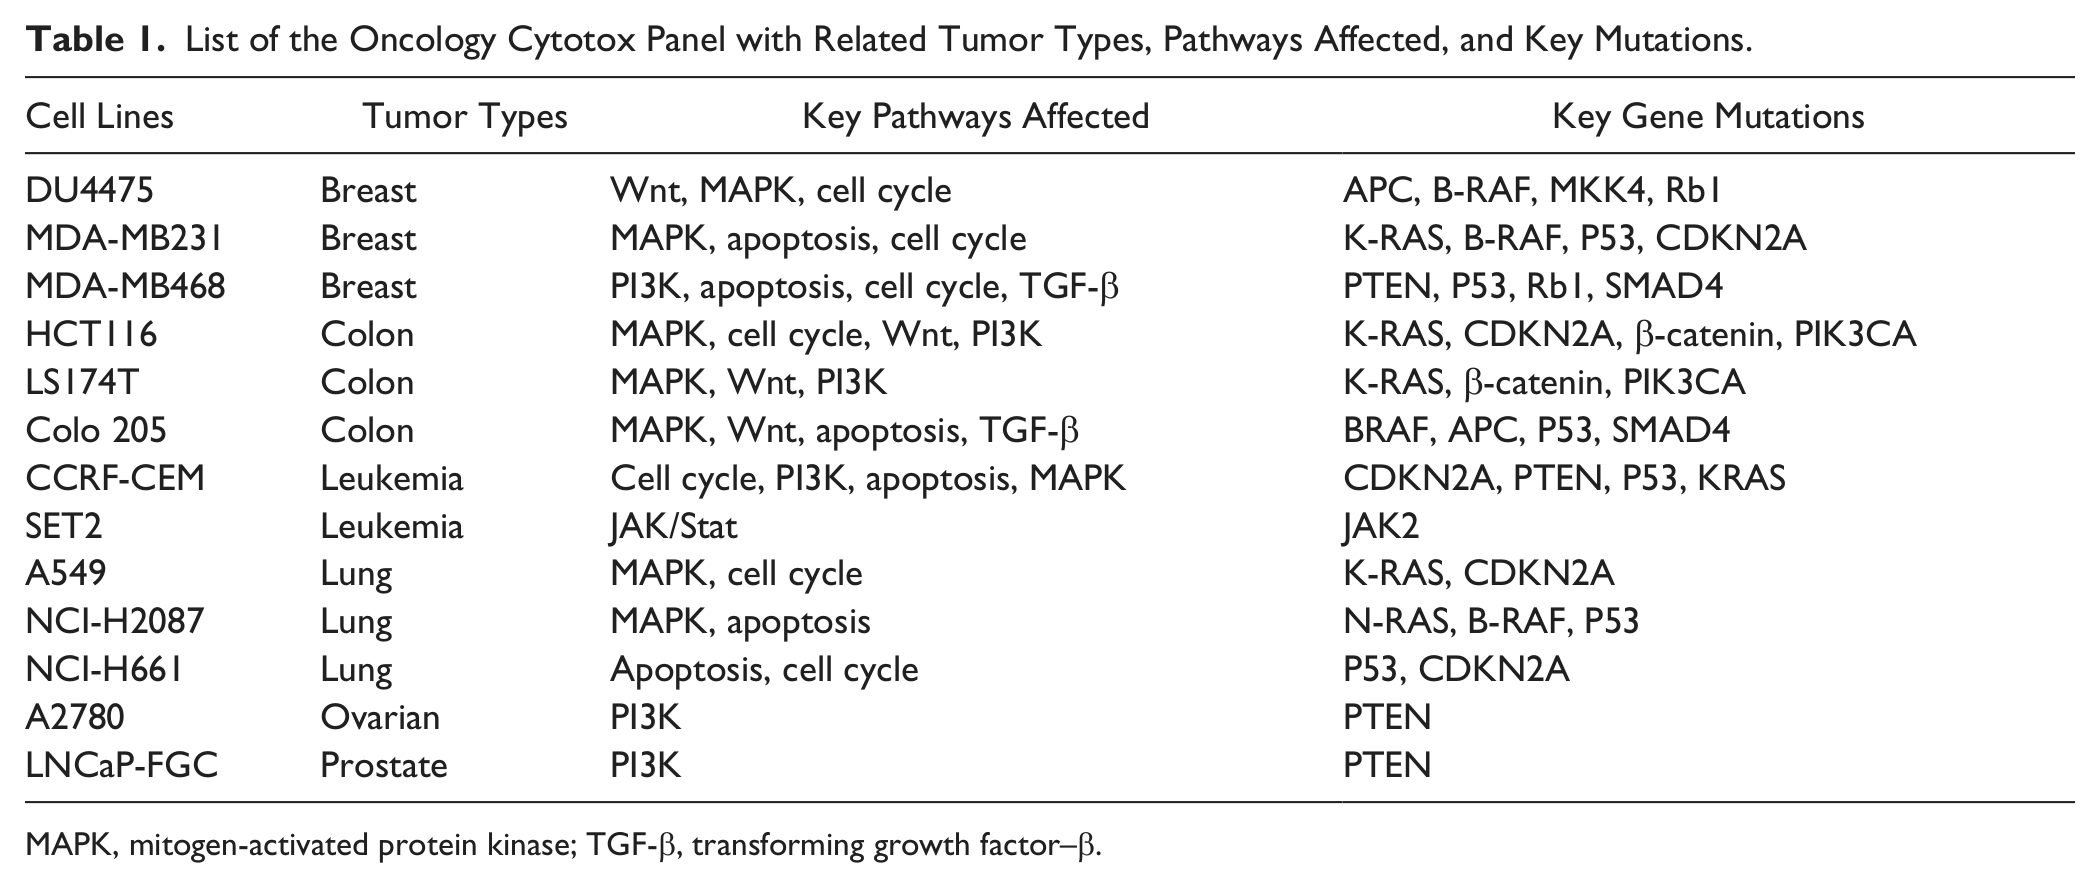
MAPK, mitogen-activated protein kinase; TGF-β, transforming growth factor–β.
Several well-established methods have been applied to assess cell proliferation and viability. MTS/MTT assays measure cell metabolic activities, 3H-thymidine incorporation and bromodeoxyuridine incorporation assays monitor DNA synthesis, and Cell Titer-glo (Promega, Madison, WI), CyQUANT and CellTrace CFSE (Molecular Probes, Eugene, OR) assays assess cellular adenosine triphosphate (ATP) levels, total DNA content, and cellular protein content, respectively. In addition, flow cytometry–based instruments such as the Guava (EMD Millipore, Billerica, MA) or the Cellometer (Nexcelom Bioscience, Lawrence, MA) count cells directly. We chose a homogeneous MTS assay based on its amenability to being automated, its low cost, and our past experience in evaluating cancer drug candidates using this method. In this assay, MTS tetrazolium salt is bioreduced by live cells to form a formazan product that is soluble in aqueous solution, and the absorbance value of formazan at 490 nm is directly proportional to the living cell numbers in the culture. 12
The value of evaluating anticancer agents in a large panel of cell lines has recently been demonstrated.13,14 Advancements in cell culture and assay platform automation, as well as related technology improvements, enabled the implementation of large-scale cell-based screening systems. However, applications of the cell panel strategy in lead optimization are still limited. A common challenge is the strict requirement of data consistency over a long period in a panel of cell lines since drug discovery programs usually last for years. The reliability and consistency of cellular reagents are essential for launching a successful cell proliferation and cytotoxicity panel in lead optimization processes. Cell lines have different characteristics and hence need optimization and quality checks at all phases of the process to ensure high performance of the assay. 15 Here we describe the methodologies of developing high-throughput cell cytotox panels on a fully automated platform for a lead optimization process with consistent data output over a period of more than 4 years. Standard operational procedures (SOPs) were established for each tumor cell line to ensure quality control with checkpoints in place. The cell quality and stability were obtained through stringently controlled, standardized protocols to reduce variations in assay results. The assays were running weekly on a custom-built robotic system using a Thermo robotic platform and Polara scheduling software (Thermo Scientific, Waltham, MA). Screening data from hundreds of compounds each run were processed and analyzed by in-house developed software (Toolset, Curvemaster, and Biobars). This provided a proof-of-concept for using large-scale automated cell culturing systems and fully automated robotic systems to support lead optimization in a panel of multiple tumor cell lines.
In sum, we have established a cell proliferation and cytotoxicity panel named the Oncology Cytotox Panel (OCP). This panel is fully automated with high throughput for lead optimization processes, designed to support structure-activity relationship (SAR) studies for oncology discovery programs, identify sensitive and resistant cell lines/tumor types for oncology exploratory programs, select tool compounds for target validation and mechanistic analysis, and address off-target effects as well as nondesired general cellular toxicities.
Materials and Methods
Cell Lines
Tumor cell lines A549, CCRE-CEM, Colo205, Du4475, NCI-H2087, NCI-H661, HCT116, LNCaP-FGC, LS174T, MDA-MB231, and MDA-MB468 were purchased from American Type Culture Collection (Manassas, VA). A2780 cells were obtained from European Type Culture Collection (Salisbury, UK). SET2 cells were obtained from DSMZ (Braunschweig, Germany).
Cell Culture and Characterization
RPMI 1640 supplemented with 10% fetal bovine serum (FBS) was used to culture all cell lines, except for SET2 cells, which were cultured in RPMI 1640 supplemented with 20% FBS. Du4475 and SET2 cells were cultured manually; the other 11 cell lines were cultured by the SelecT system manufactured by TAP Biosciences (TAP, Hertfordshire, UK). When harvesting and counting cell lines LNCaP-FGC and LS174T, 0.1% pluronic acid was added into 0.05% trypsin-EDTA to achieve an optimal effect of cell breakdown.
Cell characterization was performed as follows: Cell morphology was monitored under the microscope. The clumpiness was scored by assay developers (from “–” as nonclumpy cells to 4 “+” as the most clumpy cells). Cell growth curves were generated by monitoring cell number change every day up to 5 days to identify linear growth range. The cell doubling time was calculated for cells growing in linear range using the following equations:
At a constant growth rate, the number of cells at time t, N(t), is

where N0 is the initial number of cells, and d is the time it takes for cell number to double.
Given two measurements of cell numbers, N1 at time t1 and N2 at time t2, the cell doubling time is

Automation Liquid-Handling Devices
The integrated system consisted of a Thermo CRS F3 robot running Polara (Thermo Scientific). All peripherals were integrated for fully automated, walk-away functionality. These included a Echo 550 (Labcyte, Sunnyvale, CA) for low-volume compound transfer into the cell plates and a Multidrop combi (Titertek, Huntsville, AL) for MTS addition at 0 and 72 h and a Liconic STX220 (Linconic US, Woburn, MA) for online incubation. Cells were cultured and plated 24 h before the assay with an Automation Partnerships (TAP) SelecT cell culture robot (TAP Biosystems).
MTS Cell Proliferation Assay
The CellTiter 96 Aqueous Non-Radioactive Cell proliferation kit from Promega (Madison, WI) was used to determine the number of viable cells in the cell proliferation assay. Tumor cells were plated at optimized seeding densities in sterile 384-well black clear-bottom Matrix plates at 40 µL per well and incubated overnight at 37 °C in 5% CO2 before assaying. On the next day, one set of cell plates (T0 plates) was used to determine time zero cell density, and 3-(4,5-dimethylthiazol-2-yl)-5-(3-carboxymethoxyphenyl)-2-(4-sulfophenyl)-2H-tetrazolium was added at 4 µL/well into T0 plates followed by incubation at 37 °C in 5% CO2 for 3 h. This tetrazolium reagent was bioreduced by cells to form a formazan product that is soluble in aqueous solution. Absorbance at 490 nm was measured on an EnVision reader (PerkinElmer, Boston, MA). On the same day, compounds were added into remaining cell plates (T72 plates) and incubated at 37 °C in 5% CO2. After 72 h, 4 µL MTS reagents were then added into those cell plates. The plates were further incubated at 37 °C in 5% CO2 for 3 h, and the absorbance values at 490 nm were measured on an EnVision reader.
Data Analysis
Compound activity was reported as percentage control response, which is related to the cell net growth from cells without compound treatment over the course of the assay,


where T72DMSO and T0DMSO are the MTS assay counts in untreated cells at time 72 h and time zero, respectively.

where T72compound is the MTS assay counts in compound-treated cells at 72 h.
Dose-response curves of compounds were fitted by XL-fit (IDBS, Guildford, Surrey, UK). IC50 values were calculated by XL-fit (built into our proprietary software Curvemaster). Heat map analysis was generated by Spotfire (TIBCO, Somerville, MA). A novel BMS proprietary IT tool, Biobars, was created for data reporting and further sensitivity profile analysis.
Results
Optimization of Cell Growth and Proliferation Assay Conditions
Key to a successful cell proliferation assay panel is to fully characterize each cancer cell line. Our initial characterization of the OCP focused on evaluating cell morphology, growth pattern, doubling time, and plating density for each cell line. Cell growth curves were generated by monitoring cell number changes every day for 5 days, and on the fifth day, cells from each line entered a stationary phase of growth. Based on the results, linear growth ranges from the obtained cell growth curves were identified to calculate cell doubling time (see Materials and Methods, equations (1) and (2)). Finally, cell seeding densities for 384-well proliferation assays were chosen based on cell growth characteristics over 72 h and raw MTS counts at the beginning as well as the end of the assay (T0 and T72). The final assay seeding densities were chosen to keep cells in linear growth range during the assay time frame as well as to obtain a favorable assay signal-to-noise ratio.
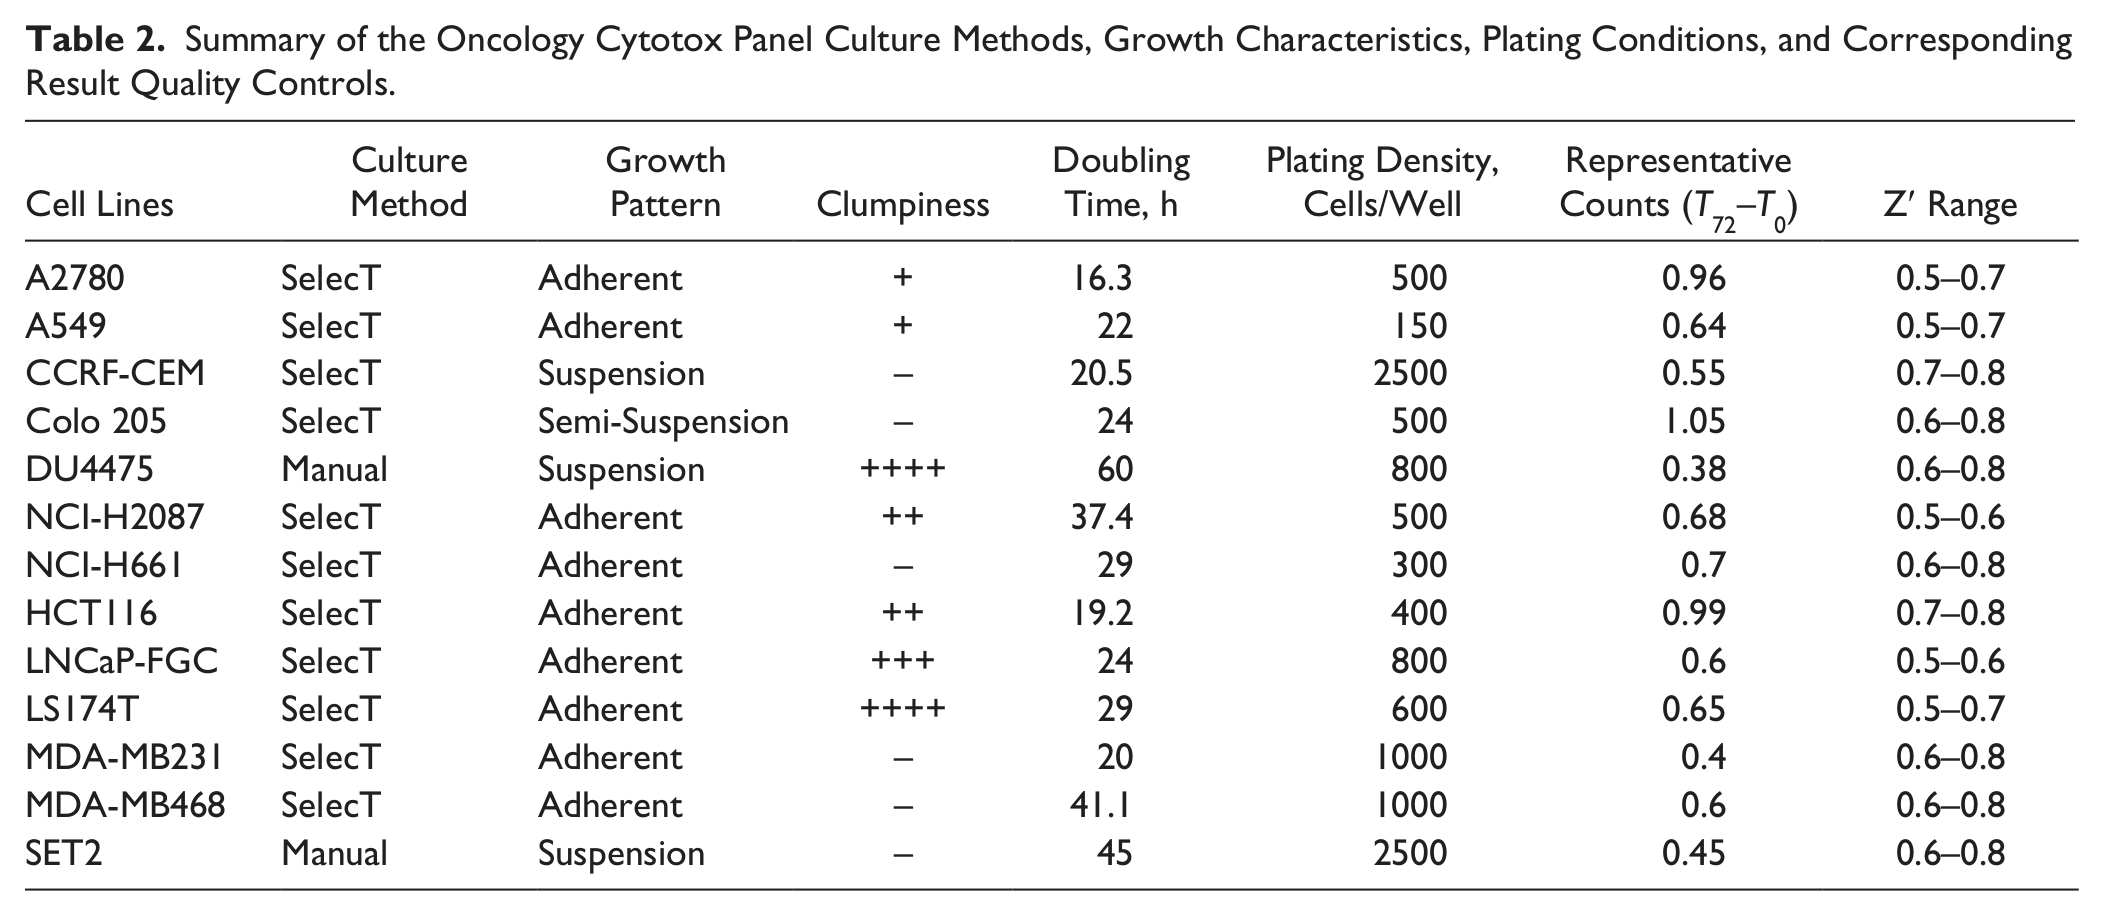
The results demonstrate diverse characteristics of the cell lines in oncology ( Table 2 ). Our OCP covers the major cell growth patterns: suspension culture for CCRF-CEM, Du4475, and SET2 cells; semi-suspension culture for Colo205 cells; and adherent mode for all other cell lines. The OCP also shows different levels of clumpiness: although A2780, A549, NCI-H661, Colo205, MDA-MB231, and MDA-MB468 grow as a monolayer, NCI-H2087, LNCaP-FGC, LS174T, and Du4475 tend to form clusters. In addition, the doubling time for the 13 cell lines varied from 16 to 60 h, indicating a wide range of cell growth rates. Interestingly, the optimized plating density (cells/well) for each cell line does not necessarily correlate with the doubling time, as shown in Table 2 . A detailed cell number titration was required for each cell line to ensure cell linear growth over 72 h and maximum T72–T0 values. It was observed that suspension cell lines CCRF-CEM and SET2 require a higher start cell density than other cell lines to ensure that cells enter the log growth phase. These careful titrations ensured consistent data quality. Indeed, we observed that reproducible results were obtained over time for each cell line with Z′ above 0.5 ( Table 2 ).
Summary of the Oncology Cytotox Panel Culture Methods, Growth Characteristics, Plating Conditions, and Corresponding Result Quality Controls.
Automated Cell Culture and Assay Process Implementation
Automated cell culture systems such as SelecT from TAP Biosciences and MACCS from MatriCal (Spokane, WA) have been used widely in drug discovery. We used SelecT to culture and plate 11 tumor cell lines. Two additional cell lines in the panel DU4475 and SET2 were cultured manually since they require a centrifuge step during subculture that is not amenable to SelecT. Individual protocols for each cell line on the SelecT were generated based on the growth parameters to synchronize the splitting and assay cycles. To achieve stringent quality assurance and consistent cell physiology for the panel screening, two major checkpoints were implemented during cell maintenance and cell plating. The data captured at each checkpoint were compared with reference values and used to make go/no-go decisions. At the first checkpoint, the cells were evaluated by their morphology and viability in flasks as well as by their growth rate. Also, cell passage numbers were monitored to ensure data were generated within the desired ranges. At the second checkpoint, the confluency level of flasks was checked before plating, doubling time was calculated based on seeding and harvesting cell numbers from the SelecT record to confirm that there was no unexpected growth alteration, and images from the Cedex cell counter were used to monitor cell clustering. Cell morphology in plates was also monitored routinely during the process of the assay. Finally, the absorbance values from the cell proliferation assays at 0 and 72 h were compared with the reference values for each assay run.
MTS assays for the 13 cell lines that passed the checkpoints were integrated into a fully automated system, including a Thermo CRS arm, a Liconic incubator, an Echo 550, a Multidrop Combi, a plate carousel, and an EnVision Reader. The Polara schedule had been optimized at each step of the assay based on the stagger time to achieve maximum productivity and uniform plate processing time. Using a robotic system not only increased the throughput of the assay but also ensured a consistent treatment of each assay plate for each cell line. The flow of the assay is as follows: on day 1, the cells were plated in 384-well plates at the indicated cell density. On day 2, MTS assay reagents were added into one set of cell plates by the Mutildrop Combi to generate T0 results. The remaining assay cell plates were treated with compounds using Echo and then returned to the Liconic incubator for a 72-h incubation. Finally, MTS reagent was added and T72 absorbance values at 490 nm were measured on EnVision for each cell line.
With the optimized automated cell maintenance and assay conditions, all cell culture and assay plates generated by SelecT maintained the properties of manually cultured cells. The viability numbers are consistently >95% without detectable cell morphology change (data not shown). As shown in Figure 1 , four representative cell lines maintained and seeded by SelecT exhibited linear growth pattern over the time of the assay, including two adherent cell lines A549 ( Fig. 1A ) and NCI-H661 ( Fig. 1B ), one suspension cell line CCRF-CEM ( Fig. 1C ), and one semi-adherent cell line Colo205 ( Fig. 1D ). Moreover, we validated a method to enable culture and plate automation for cell lines with clumpiness problems. Two cell lines, LNCaP-FGC and LS174T, tended to form clusters during culturing, which increased the difficulty of counting cells accurately during splitting and plating. As shown in Figure 1E , LS174T cells tended to cluster, causing high variations in cell counting. In contrast, adding 0.1% pluronic acid made the cells break up easily ( Fig. 1F ). Proliferation assay data from cells cultured by SelecT using pluronic acid correlated well with cells cultured manually without pluronic acid ( Fig. 1G ). Similar results were obtained for LNCaP-FGC cells (data not shown).
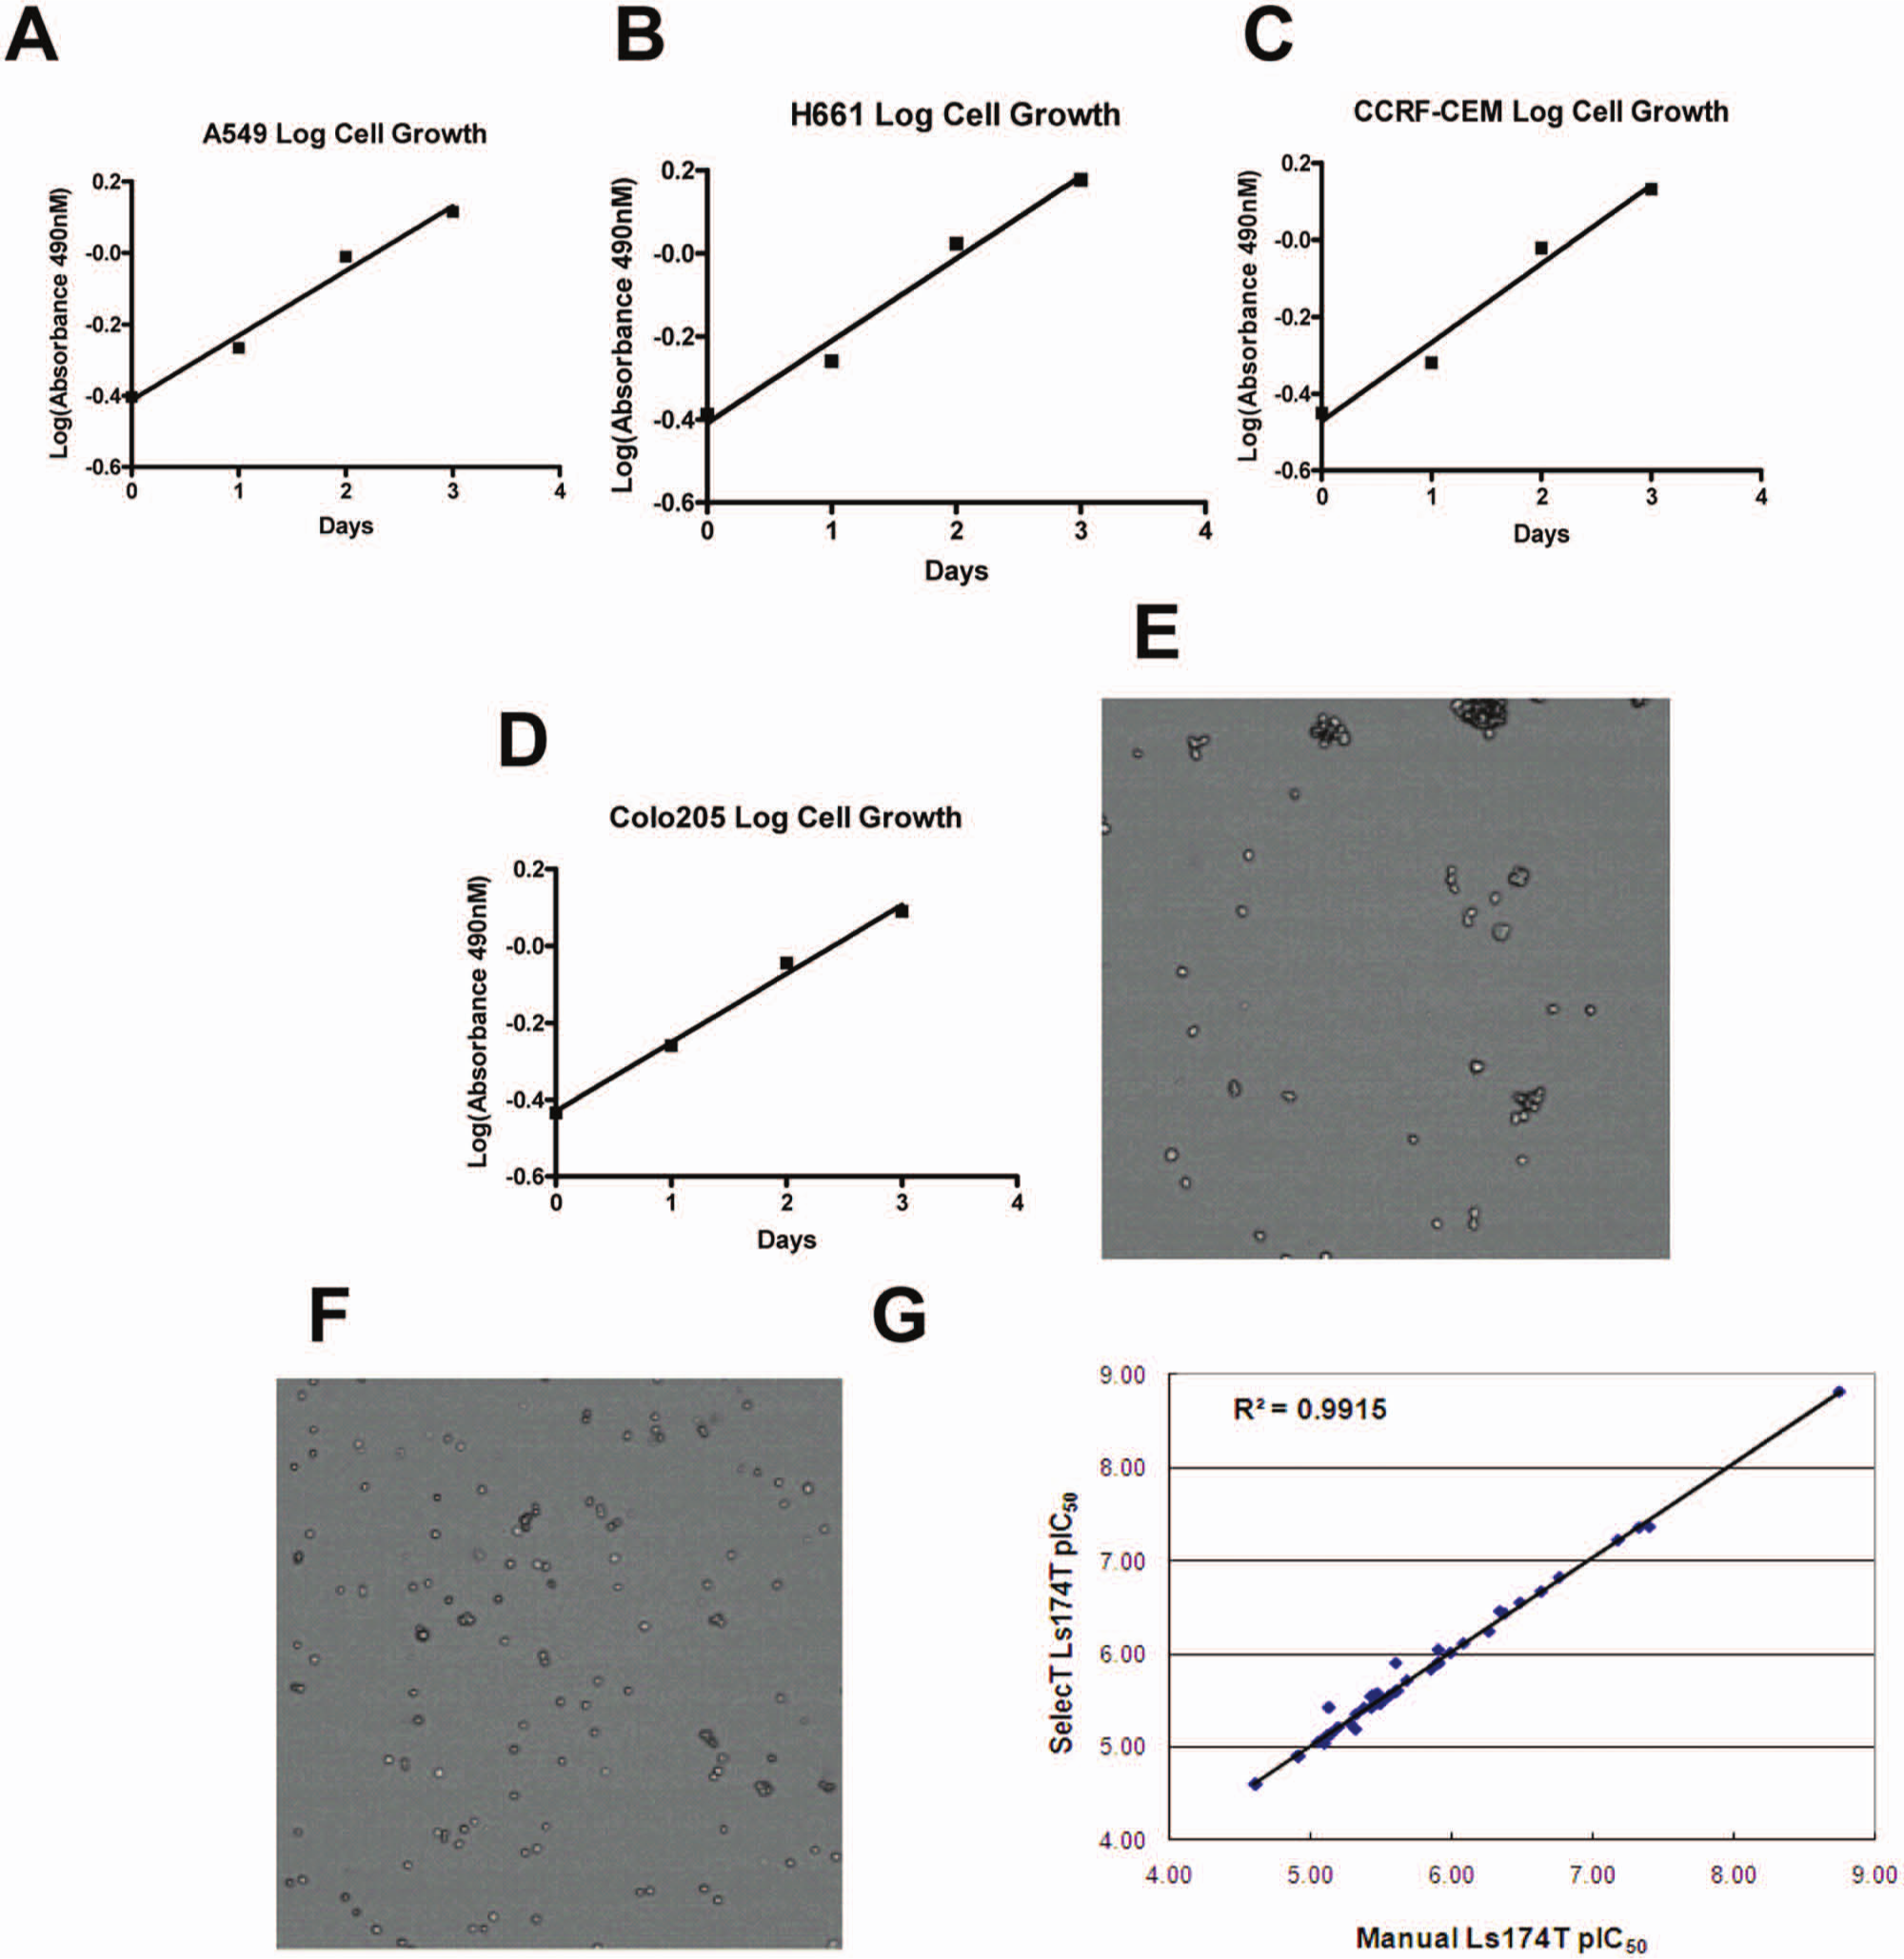
Results from cell line characterization and compound evaluation. Cell growth curves were monitored by MTS colorimetric assay for 96 h with four representative cell lines: (
Cytotox Assay Panel Screening Implementation
To validate the automated process established for the 13 cancer cell lines in the OCP, a total of 21 anticancer compounds were selected, including 11 Food and Drug Administration–approved drugs and 10 compounds for in-house targets ( Fig. 2A ). All compounds were tested at 11 concentrations ranging from 25 µM to 42 pM. Compound activities were evaluated as percentage growth inhibition, relative to the cell net growth with control DMSO treatment over the course of the assay (see Materials and Methods, equation (3)). The potency index IC50 (50% growth inhibition) was determined by concentration-response curves of compounds. There IC50s were calculated by XL-fit, which is built into the BMS proprietary software Curvemaster. If any given cell line activity was outside of the testing concentration range, the IC50 value was estimated and reported as greater than or less than the extremes of the concentration range.
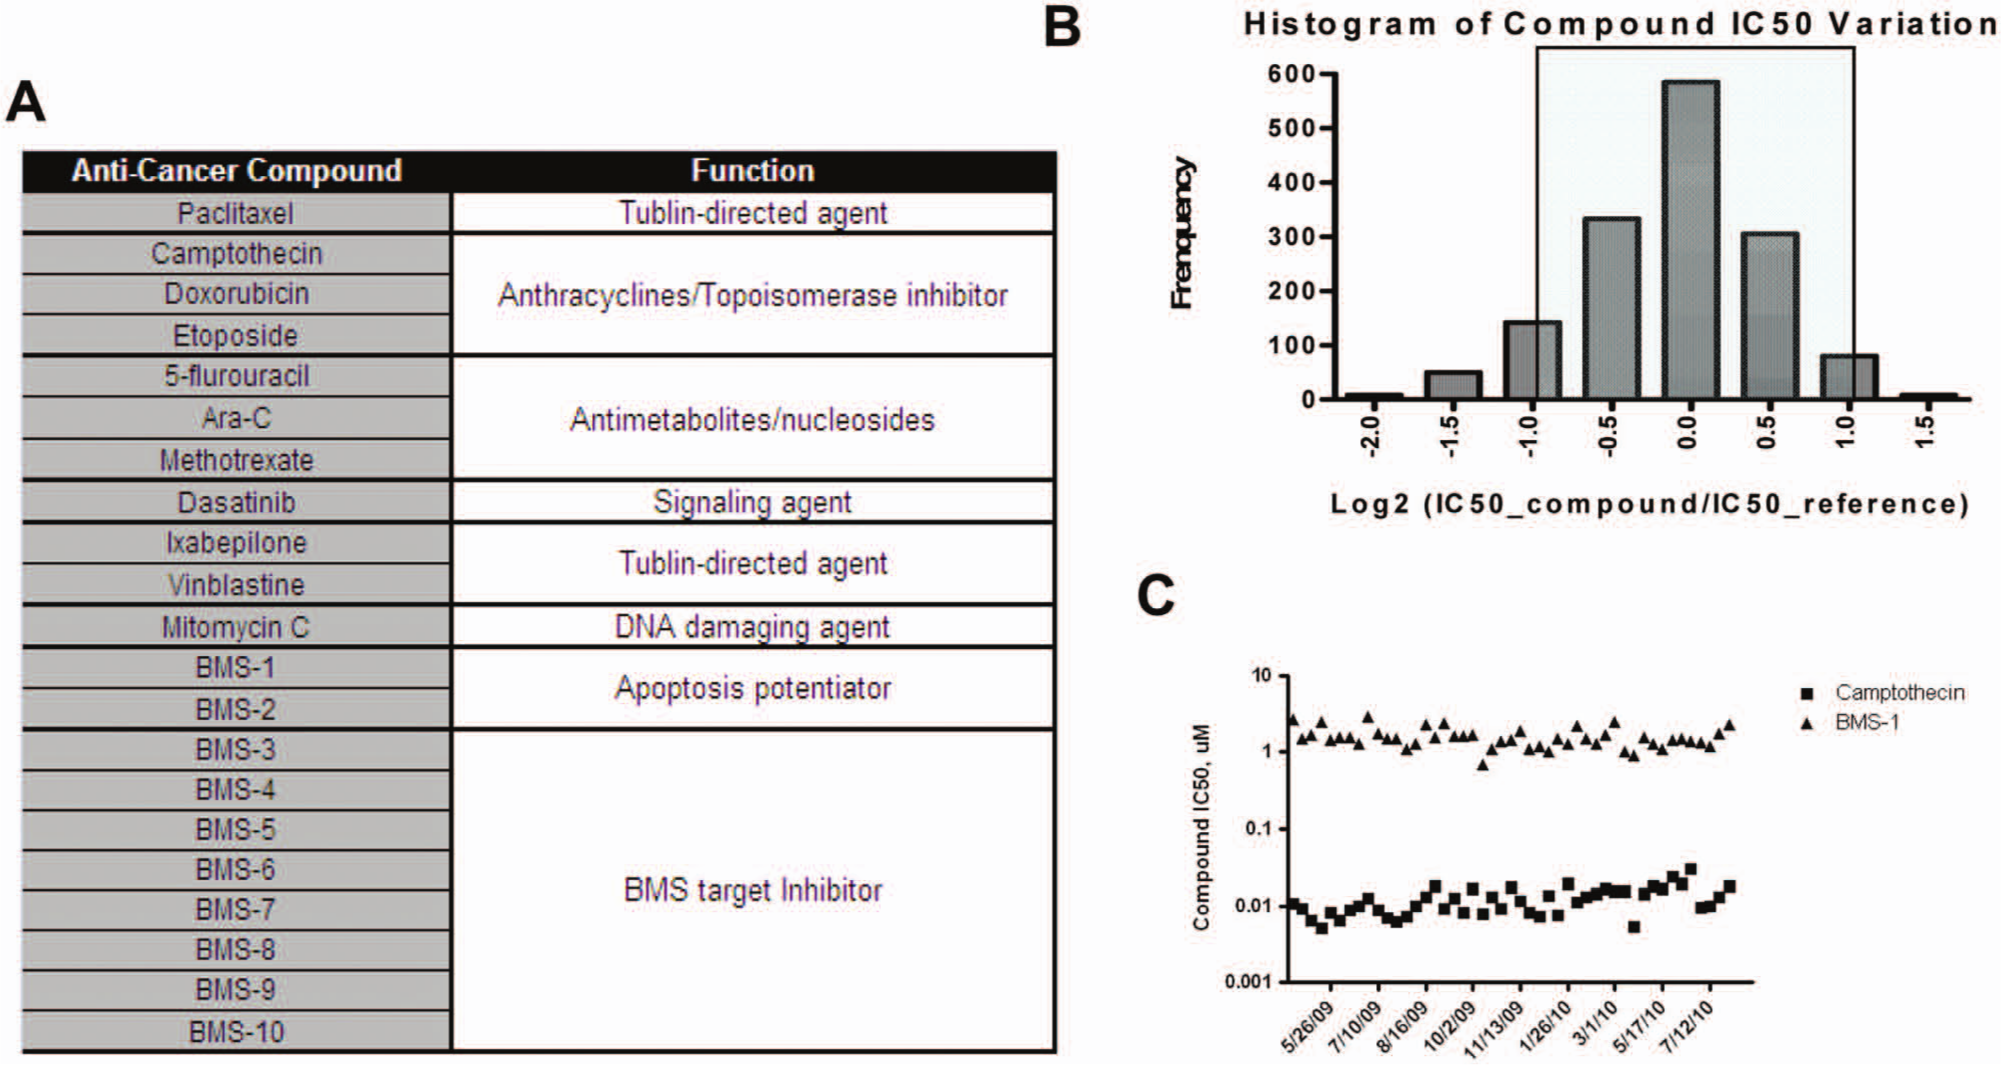
Assay validation of the Oncology Cytotox Panel panel. (
One important aspect of assay validation is to demonstrate assay reproducibility, which is essential for supporting long-term SAR studies. We tested a list of 21 compounds four to six times in 13 cell lines within a 2-month period. The variation of this data set is illustrated in Figure 2B . Approximately 90% of the IC50s (1361 of 1516 the IC50 graphs) are less than 2-fold of the mean IC50 value (shaded area). This level of consistency gave us the confidence to launch the production of the OCP and led to the identification of two cell proliferation inhibitors that could be used as controls every time we run our assays. A topoisomerase I inhibitor, camptothecin, was used as a nanomolar range control, and compound BMS-1 served as a micromolar range control. Figure 3C illustrates the consistency of those two compounds in our OCP panel over 15 months, from April 2009 to July 2010. Those two compounds have since been used for quality checks for each of our OCP runs, and the results from a small percentage (<1%) of assays with references not in the expected IC50 ranges were not verified and published.
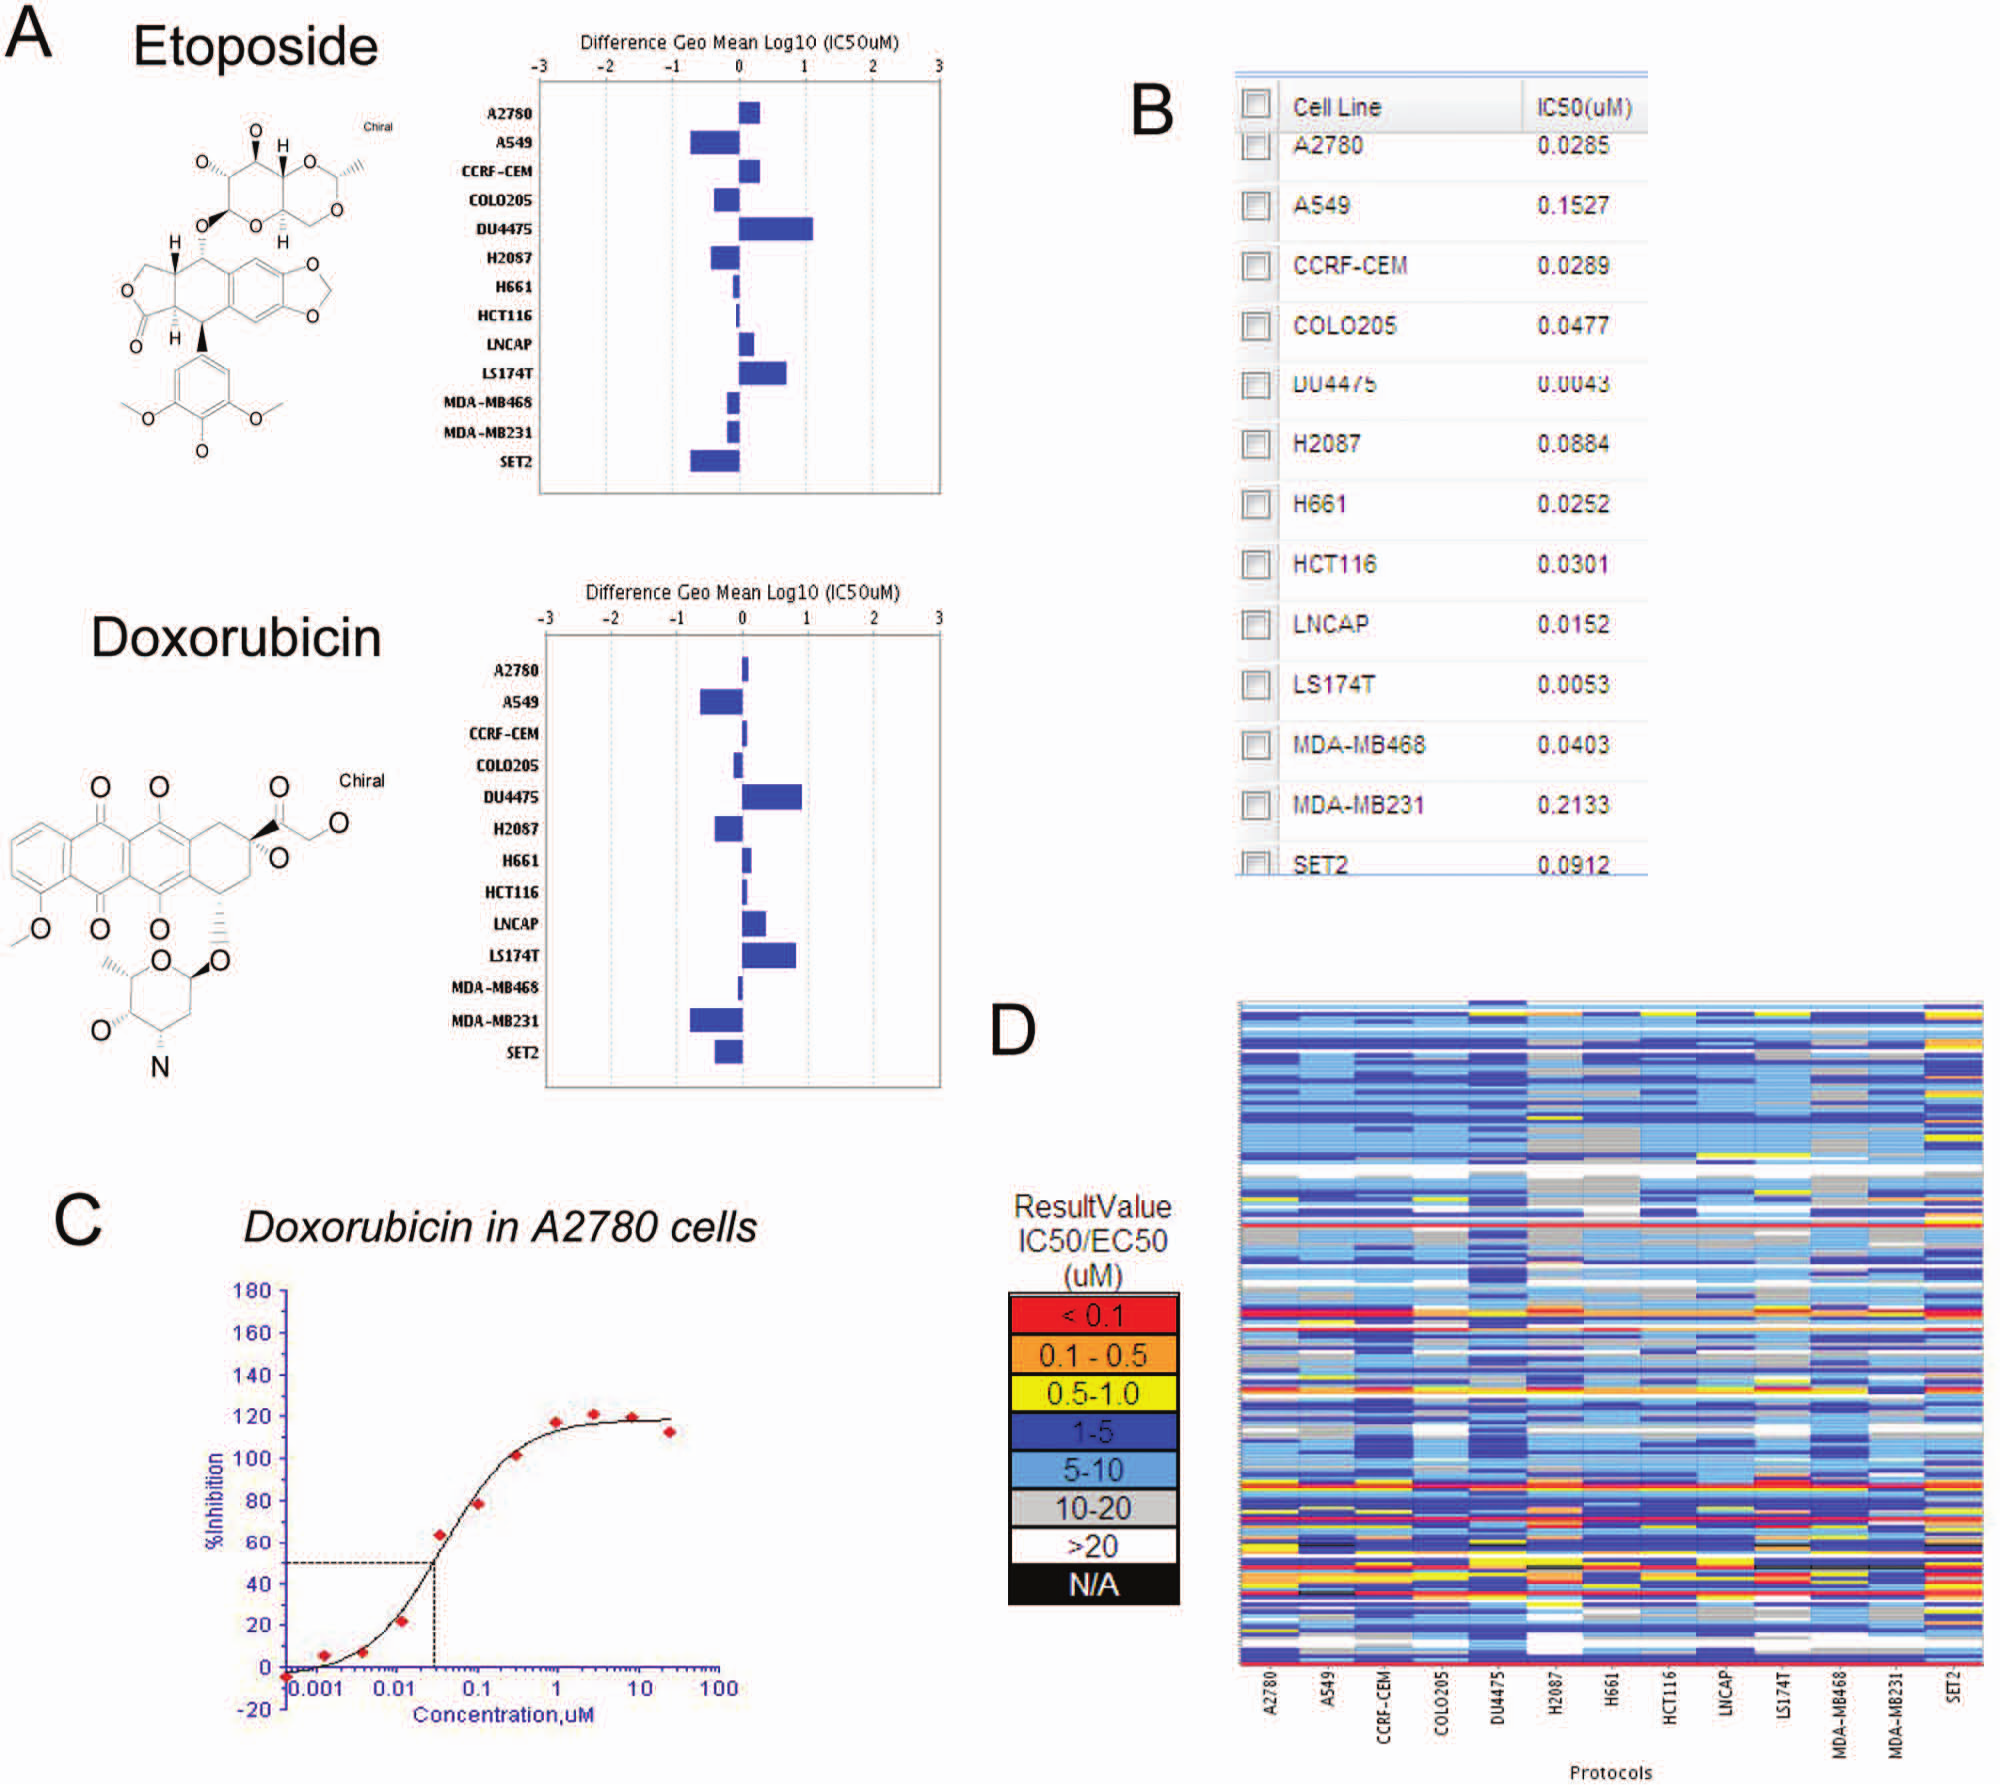
Applications of BMS proprietary software Biobars for compound activity visualization and tumor profiling. (
Generation of a Multifaceted Informatics Tool: Biobars and Applications for Tumor Profiling
The OCP generates large IC50 data sets for a number of cell lines. Using the appropriate algorithms to integrate, analyze, and interpret the data is important for lead optimization processes. We have developed a multifaceted data informatics tool named Biobars, which can integrate data from multiple sources to facilitate decision making. When processing cytotox panel screening data through the Biobars graphing tool, the classification of sensitive and resistant cell lines is based on the mean IC50 values of all 13 cell lines. Cell lines with IC50 values below mean IC50 are classified as sensitive cell lines, whereas cell lines with IC50 values above mean IC50 are defined as resistant cell lines. This software tool also allows us to choose a compound of interest and query the database for compounds with similar patterns of cellular activities. Using topoisomerase II inhibitor etoposide as an example, we queried the screening database for cellular profile similarity. Another known topoisomerase II inhibitor, doxorubicin, demonstrated a similarity score of 99.6% ( Fig. 3A ). Indeed, those two compounds demonstrated similar sensitivity profiles: DU447 and LS174T are the most sensitive cell lines (pointing to the right on the bar graph) for both compounds, and A549 and MDA-MB231 are the most resistant cell lines (pointing to the left on the bar graph) for both as well. Another major feature of this tool is to generate custom data reports that suit individual investigators’ needs. This includes drill-down detail view capability to review supporting data such as IC50 values per cell line ( Fig. 3B ) and individual IC50 curves (Fig. 3C), as well as a tabular or heat map layout for quick overview of large numbers of compounds for trends ( Fig. 3D ).
Applying Biobars, we examined program-related compounds in the OCP for the identification of sensitive and resistant cell lines. The identified sensitive cell lines can be used for program SAR, and the resistant cell lines can be used to monitor the structure-liability relationship (SLR). This Biobars tool also provides different aspects of data visualization to facilitate result interpretation and to identify links between compounds with similar properties. It not only significantly reduces data manipulation steps but also maximizes result impact through multifaceted data reporting.
Use of Cytotox Panel to Support Oncology Program SAR and SLR
Testing compounds across a panel of cell lines provides a comprehensive profiling of both efficacy and liability activities in well-characterized cellular backgrounds. This would enable the chemists to not only drive SAR but also identify and dial-off any unwanted cytotoxicity early to address SLR. Figure 4A elucidates an example of how a tumor cell panel can drive lead compound optimization for a BMS cancer drug target. Triple negative breast cancer cell line MDA-MB231 was identified as the sensitive cell line for this target. An on-target lead compound would show good potency in the MDA-MB231 cell line without having unwanted general cytotoxicity in other cell lines. Three lead compounds—BMS-A, BMS-B, and BMS-C from three different chemotypes—are all potent in biochemistry binding assays (data not shown) and active in the MDA-MB231 cell cytotox assay; however, they had very different cellular assay activities. Compound BMS-A exhibited desired activity in MDA-MB231 cells with an IC50 of 9 nM. In all other cell lines, the IC50 values for this compound were 11.3 µM or higher; the difference in the potency of compound BMS-A between targeted cell lines and off-target cell lines was more than 1000-fold. Compound BMS-B had a better MDA-MB231 IC50 of 0.7 nM; however, it also affected the CCRF-CEM cell line with an IC50 of 40 nM. The potency ratio between MDA-MB231 and CCRF-CEM cells was 58. Compound BMS-C had similar activity in MDA-MB231 as compound BMS-A; however, it had general cytotox activity across all other cell lines, ranging from 150 nM to 1.12 µM. We flagged BMS-C, which demonstrated cytotoxicity in multiple cell lines during the SAR screening, and chose two different compounds affecting targeted cell lines with less toxicity for further SAR and SLR. This approach is used to make go/no-go decisions on specific chemotypes for multiple BMS oncology drug working programs. Only the compounds with desired cytotox profiles were chosen to advance to in vivo studies.
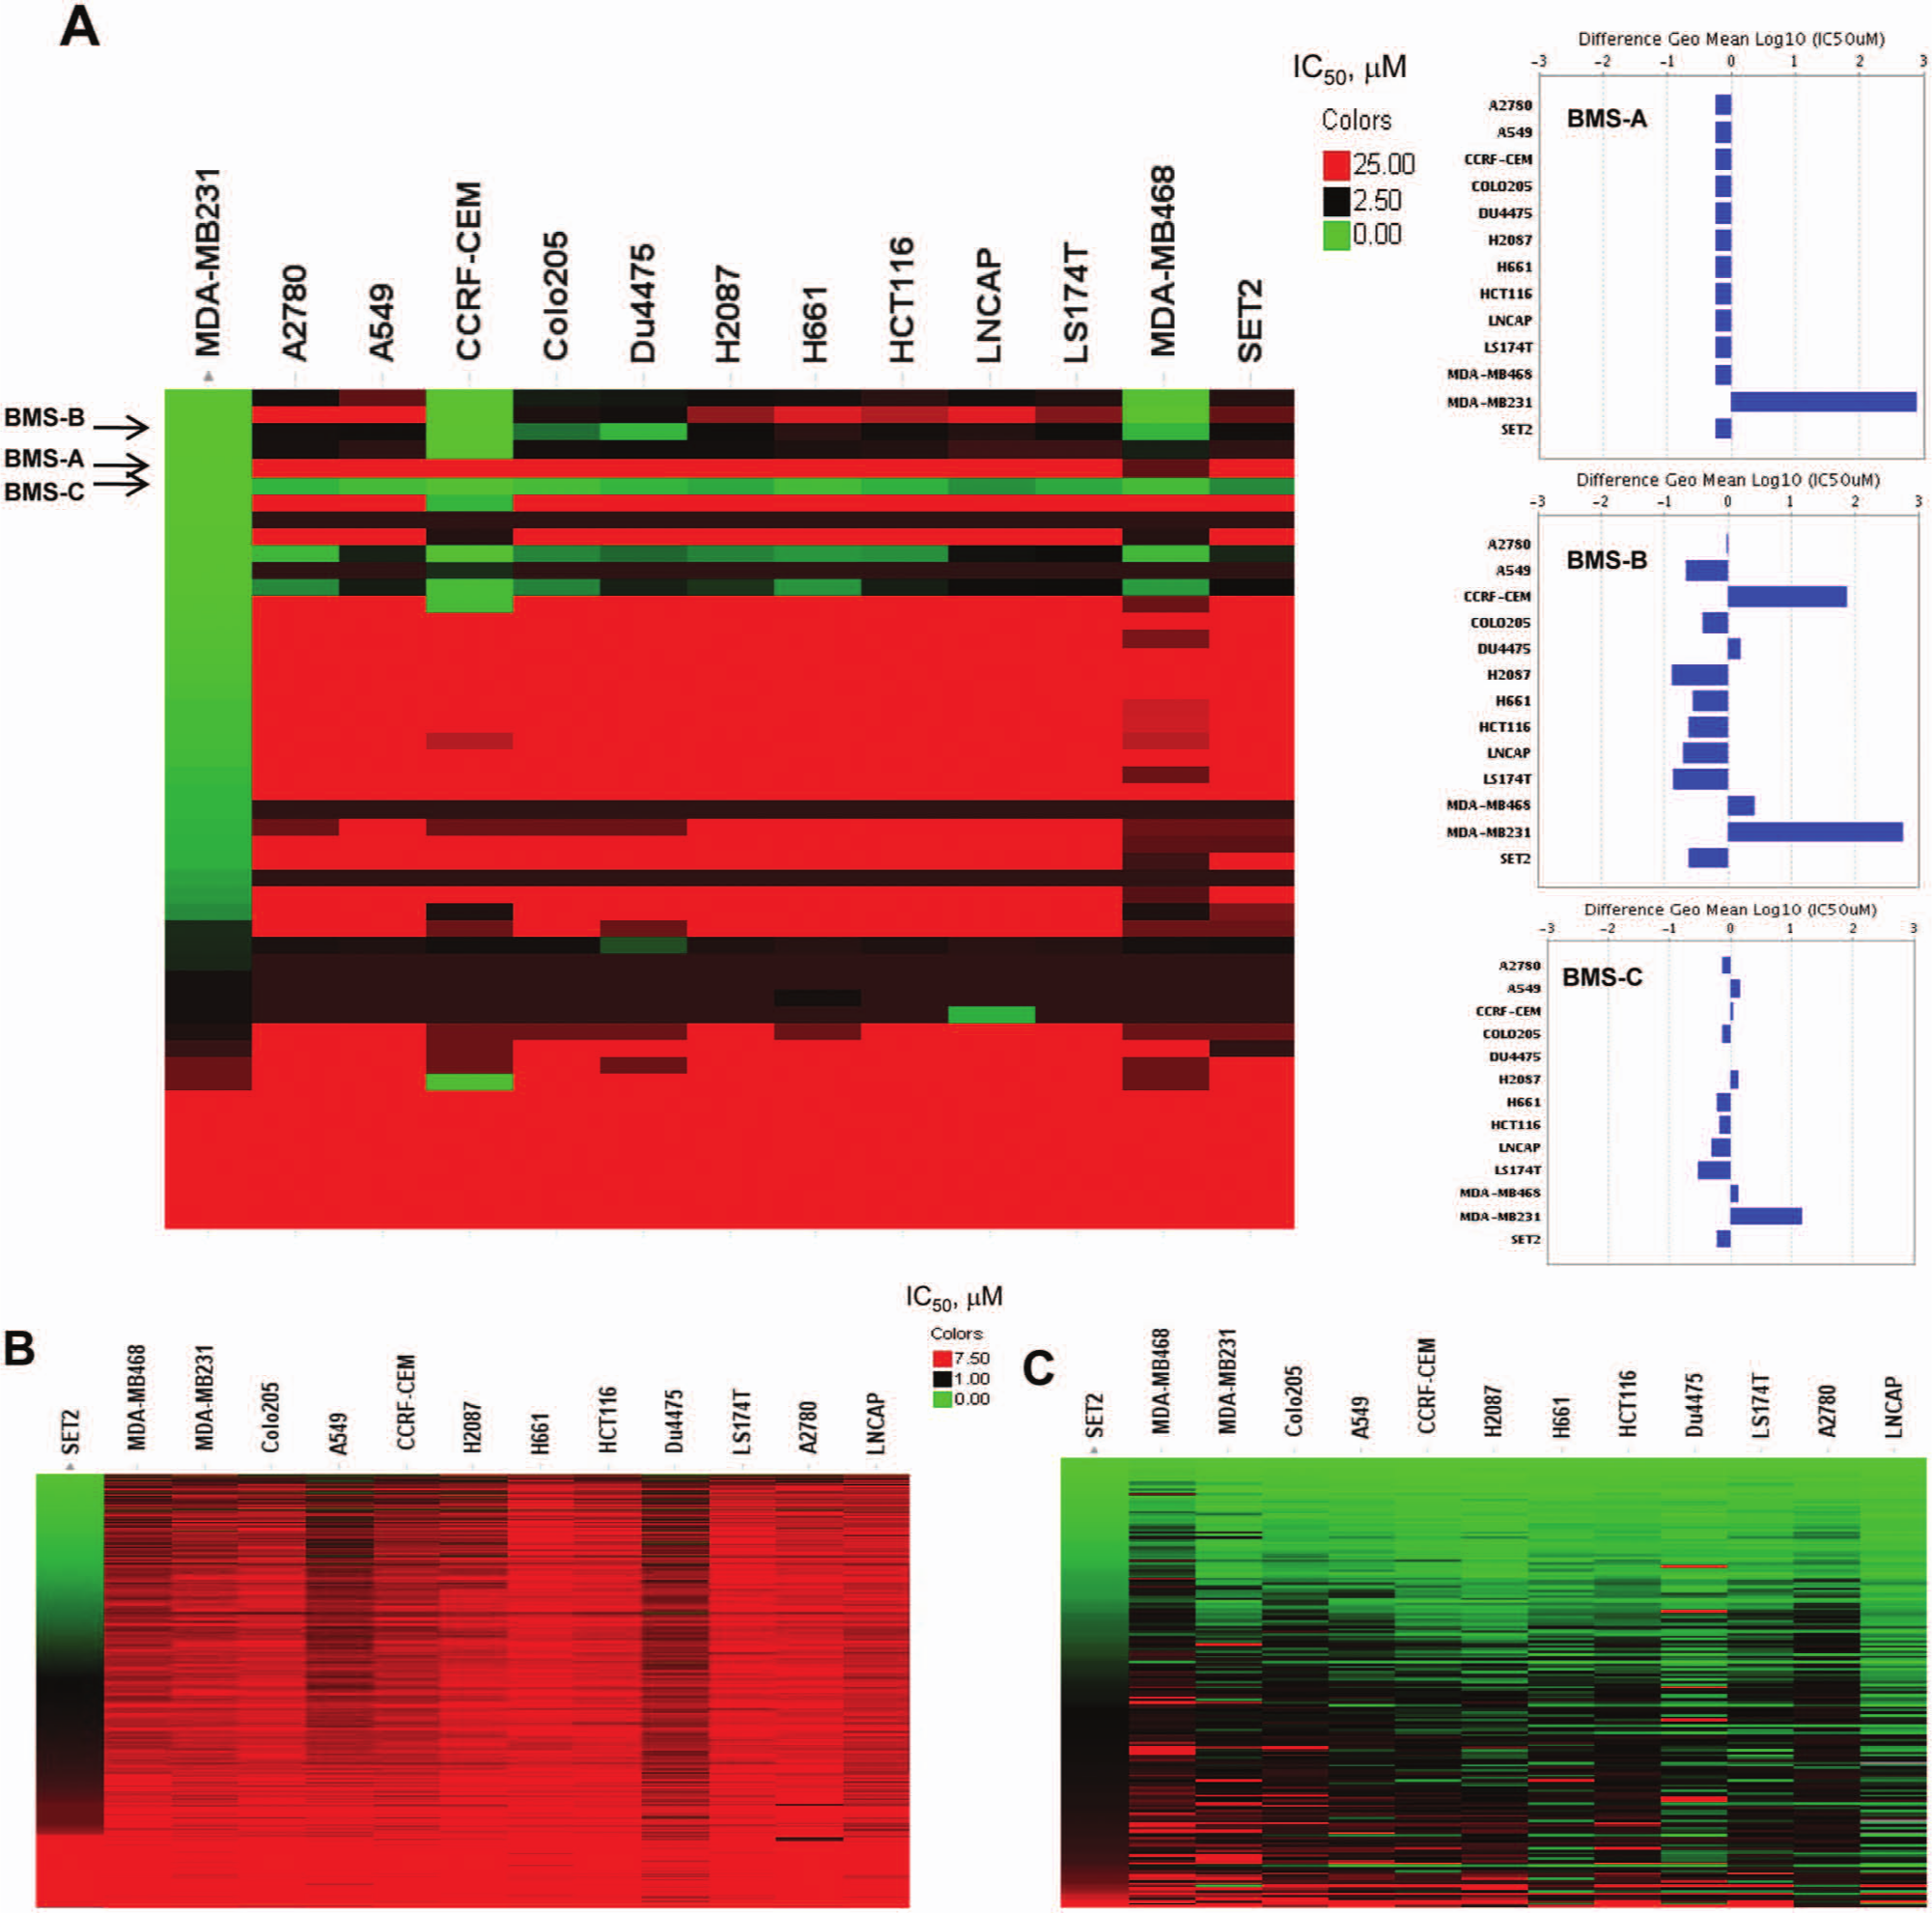
Applications of the Oncology Cytotox Panel in the lead optimization process. (
Linking Cytotox Panel Results with Cellular Context of Deregulated Signaling Transduction Pathways
Since our cytotox panel consists of tumor cell lines with known signaling pathway deregulation, we leveraged this knowledge to dissect compound mechanisms of action for specific signaling pathways. For example, Janus kinase 2 (JAK2) inhibitors exhibited on-target activity in the SET2 human megakaryoblastic cell line, heterozygous for the JAK2 V617F allele ( Fig. 4B ), in which we know the activated JAK2 is the driver for SET2 proliferation. As expected, JAK2 inhibitors resulted in inhibition of cell proliferation in this specific cell line, but they showed no activities in other cell lines where JAK2 inhibition had no effects. On the other hand, when examining another oncology kinase involved in multiple signaling pathways, including cell cycle and apoptosis pathways, it was observed that inhibitors of this kinase in general had activities in multiple tumor cell lines ( Fig. 4C ), including SET2. Cell lines (such as MDA-MB468 and MDA-MB231) with mutated status of cell cycle and apoptosis pathways exhibited the least sensitivity, which can be explained based on the understanding of the roles of this particular kinase. Aligned with this observation, cell lines lacking p53 mutations demonstrated higher sensitivity to program compounds.
Based on the well-illustrated compound mechanisms and the clearly defined cellular context, the OCP can confirm the hypothesis of sensitive versus resistant cell lines, drive SAR in physiologically relevant cellular models, and also identify any compound off-target activities for SLR efforts. The effects of linking cellular deregulated signaling pathways and target mechanisms of action enabled the lead optimization processes not only to follow the phenotypical readouts but also to track the on-target mechanistic activities.
Discussion
High-throughput cancer cell line panel screening offers tremendous potential for the identification of potent and selective therapeutic reagents. There is reported evidence that tumor-derived cell lines largely retain the genomic features of the primary tumor.16,17 However, these types of efforts face notable challenges from multiple aspects such as developing standard operation procedures on automated cell culture platforms, integrating assays on robots, and establishing sophisticated IT tools to analyze and display high-volume data. In this work, we demonstrate that by integrating novel technology and assay process design, we were able to run large-scale cell panel screenings for multiple programs simultaneously on a regular basis for more than 4 years. With hundreds of compounds tested in 13 cell lines, we could generate thousands of dose-response curves each week, and this enables us to screen tens of thousands of compounds per year. We implemented standard check points for cell line quality controls, automated cell assay processes, and generated novel data analysis tools to enable a cytotox panel approach. Our cytotox panel establishment addressed the challenges of panel approaches and demonstrated effectively the potentials and efficiency of this platform, taking advantage of multiple cellular backgrounds.
A homogeneous MTS assay was applied to measure the activities of cellular enzymes that reduce the tetrazolium dye in the OTP. However, this assay format is susceptible to colorimetric interference, and metabolically active compounds might provide biased assessment for cellular proliferation activities.12,18 Therefore, we routinely follow up the MTS results with related mechanistic-based analysis, such as signaling pathway activity measurement and direct cell count for colorimetric compounds, as well as measurements of ATP levels and DNA synthesis for metabolically active compounds. So far, we have experienced minimum levels of interference from all the compounds tested.
Compared with large panel approaches,13,14 our cytotox panel has the advantages of screening many more compounds in a fully characterized and rational-designed cytotox panel. It links phenotypical readouts with corresponding oncologic signaling pathways, which we can follow up with further mechanism-of-action studies such as pathway-specific readouts using high-content analysis. On the other hand, since our cell line number is not large enough to cover all scenarios of oncologic signaling pathway deregulation, we may not obtain as comprehensive a picture as other reported large panels.13,14
The initial purpose of building the cytotox panel was to support weekly SAR and SLR for oncology targets. To date, we have expanded the applications of this panel to many other areas, including target identification, sensitive/resistant cell line and tumor type selection, drug mechanism study, biomarker identification, and cellular toxic effects monitoring for nononcology disease areas. One of the most important applications is to integrate the cellular context with deregulated signaling pathways. With increased understanding of the deregulation of signaling pathways in each cellular context, we can apply this panel to dissect compound mechanisms of action for specific signaling pathways. In addition, cellular panels and pathway technology platforms have been proposed to play an important role in drug discovery processes. 19 We have further leveraged this cytotox panel to establish pathway-related readouts in these cell lines. Finally, these cellular processes have been linked to genomics, proteomics, and metabolomics data. In this way, we can identify “molecular signatures” to provide compound differentiation, to dissect unknown mechanisms of action, and to facilitate drug candidate clinical development. For example, a strategy has been designed in the dasatinib clinical study 20 in which a set of tumor cell lines was used to build a 6-gene signature prediction model based on cellular sensitivity and gene expression profile. Furthermore, this signature was applied to drive patient selection. With the establishment of OCP, we can provide cellular models for these types of applications. As a result, we can incorporate molecular signature generation into our lead optimization processes.
Genomic heterogeneity of cancers leads to variable clinical outcomes for an oncology drug from patient to patient. One consensus is that lead optimization in a small number of tumor cell lines is not adequate to ensure the success of clinical trial outcomes. After completing the OCP implementation, we have also expanded our cell line coverage to more tumor types and tumor cell lines. The methodology and tools described in this article were subsequently used to build many other in-house cellular panels such as specific tumor-type panels and other disease-specific panels. Our high-throughput and large-scale approaches provide a substantial amount of data, not only enabling lead optimization efforts but also supporting our work in new target validation, target deconvolution, lead identification, and translational research aspects.
Footnotes
Acknowledgements
We thank the following: BMS oncology drug discovery for participating in the OCP panel selection, CMDD for compound process, and CRG and other members in the lead evaluation department for their support and helpful discussion.
Declaration of Conflicting Interests
The authors declared no potential conflicts of interest with respect to the research, authorship, and/or publication of this article.
Funding
The authors received no financial support for the research, authorship, and/or publication of this article.