
Abstract
Myostatin, a member of the transforming growth factor (TGF)-β family of secreted ligands, is a strong negative regulator of muscle growth. As such, therapeutic inhibitors of myostatin are actively being investigated for their potential in the treatment of muscle-wasting diseases such as muscular dystrophy and sarcopenia. Here, we sought to develop a high-throughput screening (HTS) method for small-molecule inhibitors that target myostatin. We created a HEK293 stable cell line that expresses the (CAGA)12-luciferase reporter construct and robustly responds to signaling of certain classes of TGF-β family ligands. After optimization and miniaturization of the assay to a 384-well format, we successfully screened a library of compounds for inhibition of myostatin and the closely related activin A. Selection of some of the tested compounds was directed by in silico screening against myostatin, which led to an enrichment of target hits as compared with random selection. Altogether, we present an HTS method that will be useful for screening potential inhibitors of not only myostatin but also many other ligands of the TGF-β family.
Keywords
Introduction
The transforming growth factor (TGF)-β family consists of more than 30 secreted ligands that regulate a variety of important biological processes both during embryogenesis and in adult tissues. These ligands are structurally similar dimers that can be subdivided into three main classes: activin/inhibin, bone morphogenetic protein (BMP)/growth and differentiation factor, and TGF-β (reviewed in Shi and Massague 1 ). Ligands signal by simultaneously binding two type I and two type II transmembrane kinase receptors at the cell surface, which then activates a signaling cascade through the phosphorylation of SMAD proteins. Because these ligands are involved in a vast number of physiological processes, signaling is tightly controlled through several intracellular and extracellular mechanisms, many of which involve blocking or modulating interactions of ligands with receptors. 2
Myostatin, a member of the activin class, is a staunch negative regulator of muscle growth. 3 For this reason, many pharmaceutical companies are aggressively pursuing myostatin inhibitors for the potential treatment of muscle-wasting diseases such as muscular dystrophy and sarcopenia. A number of small-molecule inhibitors targeting the kinase domain of the type I receptor have been developed.4–6 Unfortunately, these inhibitors are not specific for myostatin signaling and also block activin A and TGF-β signaling. Currently, small-molecule inhibitors have not been identified that directly bind to any TGF-β family ligands. Therefore, recent strategies have focused on blocking myostatin signaling specifically by neutralizing the ligand with various binding proteins such as monoclonal antibodies, receptor decoys, and extracellular antagonists (e.g., follistatin).7,8 However, specifically targeting myostatin over other TGF-β ligands is still difficult due to the similarity in structure between the ligands. This is especially true for the close family member of myostatin, activin A, which shares high affinity for the same type II receptors and naturally occurring antagonist proteins. One area of divergence between these two ligands is the type I receptor-binding site on the ligand. 9 Particularly important in this pocket is a feature termed the prehelix region, which has been shown to be highly variable between ligands and an important determinant of type I receptor usage ( Fig. 1 ).9,10 This site is therefore an attractive target in the development of specific ligand inhibitors.
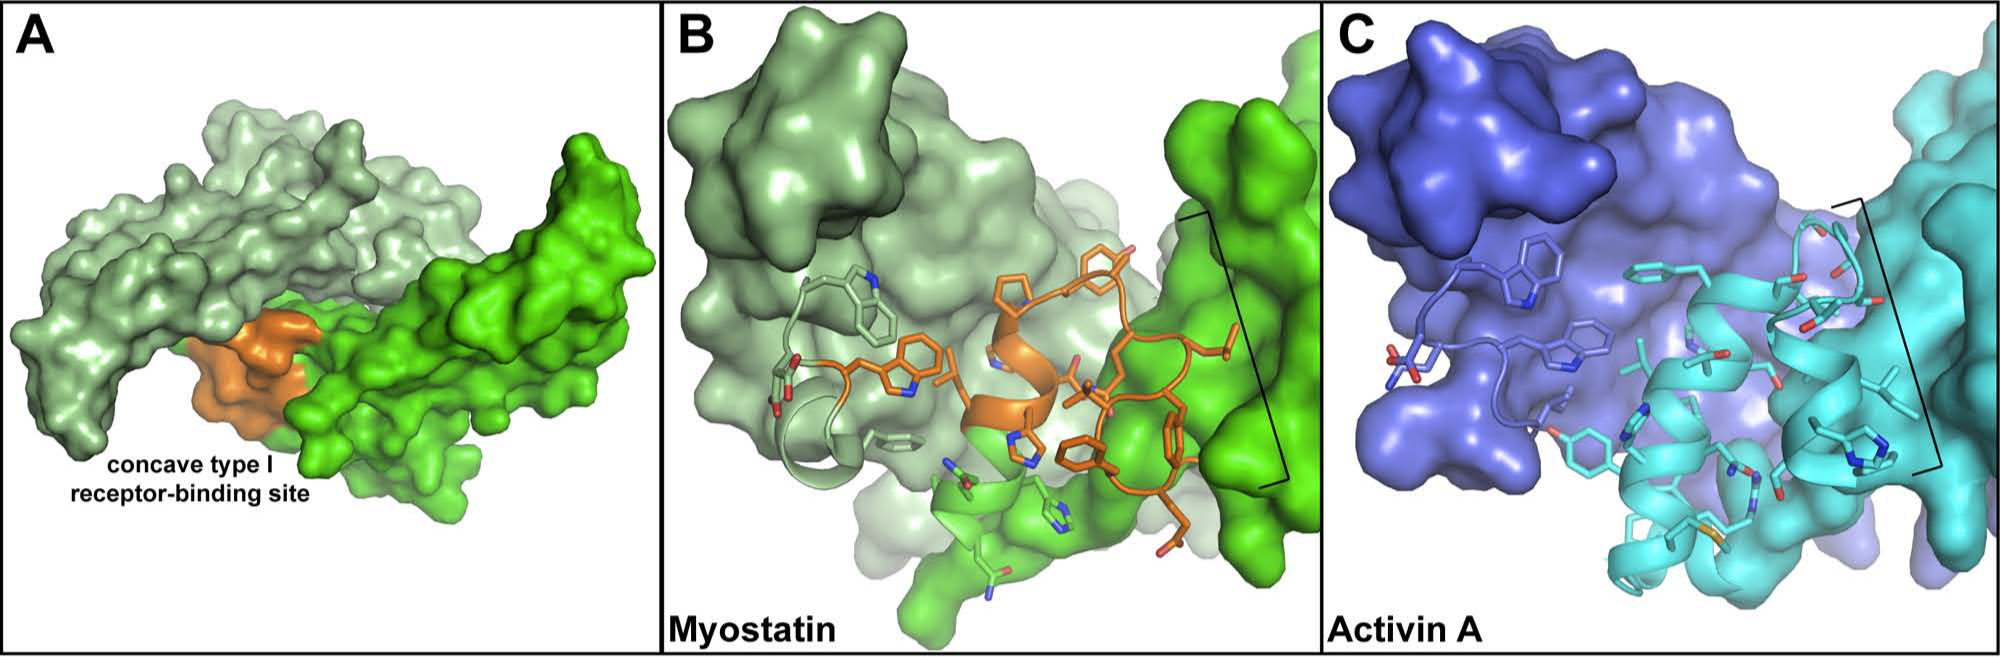
The structures of myostatin and activin A. (
Here, we have developed a cell-based high-throughput screening (HTS) method for potential inhibitors of myostatin and activin A. Development of these types of assays has been challenging due to the inherent difficulties in working with TGF-β family ligands. Using HEK293 cells and a (CAGA)12-luciferase reporter construct, we created a stable cell line that robustly responds to signaling by activin and TGF-β class ligands and employed it in an assay measuring inhibition of ligand activity. We present an optimized procedure for maximizing the cellular response to ligand signaling upon miniaturization of this assay to a 384-well HTS format. Our method also incorporates the use of resazurin to monitor off-target cytotoxic effects. In silico screening targeting the type I receptor-binding site of myostatin was performed, which effectively enriched for target hits against myostatin. Altogether, we have developed a robust HTS method that has shown promise in identifying compounds that inhibit myostatin. Furthermore, this method can be readily adapted to other TGF-β family members, enabling HTS and discovery of small-molecule inhibitors against the multitude of these ligands, which so far have not been developed.
Materials and Methods
Cell Culture
Luciferase reporter assays were performed with our HEK293-(CAGA)12 cell line that stably expresses a (CAGA)12-luciferase reporter gene, which was generated as previously described (unless otherwise stated). 11 Cells were grown in Dulbecco’s modified Eagle’s medium (DMEM) High Glucose with L-Glutamine (cat. SH30022.01; Thermo HyClone, Logan, UT), 10% fetal bovine serum (FBS; cat. S01520; Biowest, Kansas City, MO), 100 IU/mL penicillin, 100 µg/mL streptomycin, and 100 µg/mL G418 (cat. 61-234-RG; Mediatech, Manassas, VA) unless otherwise stated. In all assays using the Bright-Glo Reagent (Promega, Madison, WI), cells were grown in medium lacking phenol red to prevent interference with the luciferase assay. Cells were maintained at 37 °C, 95% relative humidity, and 5% CO2.
24-Well Luciferase Reporter Assay
Cells were plated in 24-well clear tissue culture plates (cat. 92424; TPP, Trasadingen, Switzerland) and grown for 24 h. If applicable, HEK293 cells (cat. CRL-1573; ATCC, Manassas, VA) were transiently transfected with 200 ng of the (CAGA)12-luciferase reporter construct using Mirus TransIT-LT1 reagent (cat. MIR 2300; Mirus Bio LLC, Madison, WI) according to the manufacturer’s protocol and grown for 24 h. Cells were washed with Dulbecco’s phosphate-buffered saline (DPBS, cat. SH30264.1; Thermo HyClone) and treated with 4 ng activin A in serum-free medium for 24 h. Cells were lysed with 100 µL 1× passive lysis buffer (cat. E1941; Promega) for 20 min. Then, 20 µL of lysate was mixed with 40 µL of luciferase assay reagent (LAR, cat. E1501; Promega) and luminescence measured on a Glomax 20/20 luminometer (cat. E5311; Promega).
96-Well Luciferase Reporter Assay
Cells were plated in 96-well clear tissue culture plates with or without various coatings (Greiner Bio-One, Monroe, NC). For transient luciferase reporter assays, 100 ng of the (CAGA)12-luciferase reporter construct was transfected as described above. Cells were treated with varying amounts of activin A or myostatin (cat. 788-G8; R&D Systems, Minneapolis, MN) in serum-free medium for 24 h. Cells were washed with DPBS between removal of growth medium and addition of ligands. When applicable, follistatin 288 (Fst) or the type I kinase inhibitor SB431542 hydrate (cat. S4317; Sigma-Aldrich, St. Louis, MO) was mixed with ligand in bovine serum albumin (BSA)–coated 96-well plates and incubated together for 3 min before addition to cells. Following treatment, medium was removed and cells were lysed with 20 µL/well of 1× passive lysis buffer and shaking for 20 min. Lysates were then transferred to 96-well IsoPlates (cat. 6005030; PerkinElmer, Waltham, MA) and mixed with 100 µL/well of luciferase assay reagent. Luminescence was measured on a Luminoskan Ascent (Thermo Scientific, Waltham, MA) or an EnVision multilabel reader (PerkinElmer).
For optimized 96-well luciferase assays, cells were grown in black poly-D-lysine (PDL)–coated plates with clear well bottoms (cat. 655946; Greiner Bio-One) in medium with 2% FBS. Ligands and Fst were diluted in medium containing 10% FBS, and when applicable, Fst was added to cells prior to adding ligand. Ligand treatment was done for 24 h without medium removal or wash steps. Cells were treated with resazurin (cat. AC41890-0010; Fisher Scientific, Waltham, MA) for 4 h to monitor cell viability and normalize cell number. The conversion of resazurin to resorufin was measured by fluorescence with excitation at 530 nm and emission at 580 nm. Cells were then lysed using Bright-Glo Reagent (cat. E2520; Promega) according to the manufacturer’s protocol, and luminescence was read on a Wallac Victor 2 1420 Multilabel Counter (PerkinElmer) or an EnVision multilabel reader.
University of Cincinnati Compound Collection
The University of Cincinnati (UC) compound collection contains more than 350,000 unique drug-like compounds based on the World Drug Index. Most of the compounds are broadly diverse and evenly distributed across the “structural space” defined by the compounds in the World Drug Index, omitting those that are reactive or contain substructures associated with undesirable characteristics (such as toxicity). A set of approximately 960 compounds representing the structural diversity of the UC compound library was used for this screen. In silico screening was performed using the entire library, which led to the identification of an additional ~1580 compounds that were also used in HTS.
In Silico Compound Screening for Myostatin Inhibitors
High-performance computing was used to simulate the interaction of UC compound library molecules at up to 400 conformations each with the surface of myostatin. The type I receptor-binding pocket of myostatin was targeted, specifically the prehelix loop region ( Fig. 1 , highlighted orange). Small-molecule docking was performed in several stages. First, rigid conformers were docked against the target site and results were scored using the default consensus scoring method in FRED (Fast Rigid Exhaustive Docking) (Openeye Scientific Software, Santa Fe, NM). 12 The top-scoring 10,000 molecules were re-docked with FRED using higher resolution translational and rotational steps. Finally, the top 2000 molecules were docked using Glide extra precision (XP; Schrödinger, New York, NY) and ranked by their Glidescore. From the top 450 of these compounds, ~1130 similar compounds were selected based on Tanimoto distances using ECFP6 and FCFP6 fingerprints in Accelrys’s Pipeline Pilot software (Accelrys, San Diego, CA). 13
Initial 384-Well Screening Assay
Overall, the luciferase reporter assay can be performed in 3 days. On day 1, 1.25 × 10⁴ HEK293-(CAGA)12 cells suspended in 25 µL growth media (5 × 10⁵ cells/mL) were seeded in 384-well white clear-bottom tissue culture plates coated with PDL (cat. 781944; Greiner Bio-One).
On day 2, myostatin and activin A were suspended in serum-free culture media, and 30 µL/well was dispensed to columns 1 to 23 of individual ligand plates, 384-well microplates (cat. 781091; Greiner Bio-One), using a MultiDrop dispenser (ThermoFisher, Waltham, MA). Dispenser cassette tubing and microplates were precoated with 1% BSA in phosphate-buffered saline (PBS) to prevent ligand adherence. For compound screening, myostatin and activin A concentrations were 40 ng/mL and 20 ng/mL, respectively. Test compounds at 10 mM dissolved in 100% DMSO were transferred from 384-well polypropylene compound plates (cat. 353265; BD Biosciences, Franklin Lakes, NJ) to columns 1 to 20 of ligand plates containing myostatin or activin A using a Cybi-Well 384-channel pipettor (CyBio, Woburn, MA) with pintools (V&P Scientific, San Diego, CA) delivering 53 nL. Two microliters of 120 ng/mL Fst or 6 µM SB431542 hydrate prepared fresh in serum-free media was added to column 23, and 30 µL serum-free media was added to column 24 using a MultiDrop dispenser. Cells grown for 24 h in the assay plates were washed twice with 50 µL PBS using a Bio-Tek plate washer (Bio-Tek, Winooski, VT) programmed to leave 15 µL remaining in each well. Fifteen microliters of each ligand and test compound mixture was transferred from the ligand plates to assay plates using a Cybi-Well pipettor equipped with 384/25 pipet tips (CyBio, Jena, Germany). Final concentrations were 20 ng/mL myostatin, 10 ng/mL activin A, 4 ng/mL Fst, and 0.2 µM SB431542 hydrate. Controls also received DMSO totaling 0.1% to match that in the compound-containing wells. Final concentration of test compounds was 8.8 µM for the primary single-point and triplicate confirmation screens. Following addition of ligand ± test compounds, cells were incubated for 24 h.
On day 3, luciferase activity was measured. Cells were lysed with 7 µL 5× passive lysis buffer added using a MultiDrop dispenser. The plate was shaken for 20 s and incubated for 10 min before 45 µL luciferin substrate was added using an onboard injector. Luminescence was measured using enhanced luminescence detection on an EnVision multilabel reader.
Modified 384-Well Screening Assay
On day 1, 1.5 × 10⁴ HEK293-(CAGA)12 cells suspended in 30 µL culture media containing 2% FBS were seeded in assay plates, which were 384-well white clear-bottom tissue culture plates coated with PDL. Cells were grown for 24 h.
On day 2, test compounds in 100% DMSO were transferred from 384-well compound plates to columns 1 to 20 of assay plates in triplicate using a Cybi-Well 384-channel pipettor with pintools delivering 47 nL. Five microliters of myostatin (112 ng/mL) or activin A (56 ng/mL) prepared in culture media with 2% FBS was then transferred from a 384-well microplate to all wells in columns 1 to 22 using Cybi-Well 384-well 25 µL pipet tips. Final concentrations of myostatin and activin A were 16 ng/mL and 8 ng/mL, respectively. Five microliters of culture media plus 2% FBS was added to column 24 (inhibitor controls) and 5 µL of 0.56 ng/µL Fst prepared in culture media with 2% FBS was added to column 23 (standard controls; final concentration = 70 pg/µL) using a MultiDrop dispenser. Controls also received DMSO totaling 0.1% to match that in the compound-containing wells. Cells were then incubated for 24 h.
On day 3, 4 µL of 0.02 mg/mL resazurin was added to each well and cells were incubated for 4 h. Fluorescence was detected by excitation at 530 nm and emission at 580 nm using the EnVision reader. Two microliters of 0.42 M dithiothreitol was then added to reduce remaining resazurin, followed by addition of 40 µL Bright-Glo Reagent. Luminescence was measured following 10 min incubation at room temperature using the enhanced luminescence detection on the EnVision reader.
Data Analysis
Data were normalized by GeneData (Basel, Switzerland) to the median luminescence of wells containing myostatin or activin A only (neutral controls) as 0% activity and the median of wells containing untreated cells (inhibitor control) as −100% activity. Assay performance and robustness were evaluated using the Z′ factor. 14 The signal-to-background (S/B) ratio is the mean of neutral controls/mean of inhibitor controls. The Z′ and S/B ratio were calculated for each microplate. Cell viability (resorufin fluorescence, measured as described above) data were normalized to the median fluorescence of wells containing ligand only as 0% activity and media only as −100% activity.
Results and Discussion
Miniaturization and Initial Optimization of a Cell-Based Luciferase Reporter Assay
To perform HTS on compounds for activin A and myostatin inhibition, we needed to have in place a sensitive, cell-based assay that could effectively measure ligand signaling in a 384-well format. We created a stable cell line that robustly responds to these ligands, as this removes the added task, time, and expense of transiently transfecting our reporter gene of interest before measuring ligand activity. To do this, we used HEK293 cells and the (CAGA)12-luciferase reporter construct, which is well established in its response to TGF-β family ligand signaling. We created this stable cell line and carried out clonal selection based on luciferase activation to identify a cell line that robustly responds to ligand signaling, as previously described.
11
HEK293 cells express the necessary receptors for myostatin, activin A, and TGF-β, which signal through different receptors yet all activate SMAD3 and, hence, the same promoter. As shown in
Figure 2A
, as compared with either cells transiently expressing the reporter gene or the initial pool of stably transfected cells, selected cell lines show a greatly increased response to activin A. Simultaneous to this, we transitioned from our 24-well assay format to test and optimize the assay in a 96-well format, which is a necessary step toward the 384-well HTS format. As shown in
Figure 2B
, although the 96-well assay format did not work well for cells transiently expressing the reporter gene, possibly due to the difficulties in low-volume transient transfections, our stable cell line nicely responded to activin A in this format, particularly the C4 stable cell line, which had undergone clonal selection. Since HEK293 cells are loosely adherent to tissue culture plates, we next wanted to examine the effects of different plate coatings on the performance of our assay, as only uncoated or collagen I–coated plates had been used initially. Of the coatings tested, PDL and poly-L-lysine showed the highest S/B ratio and Z′ values (
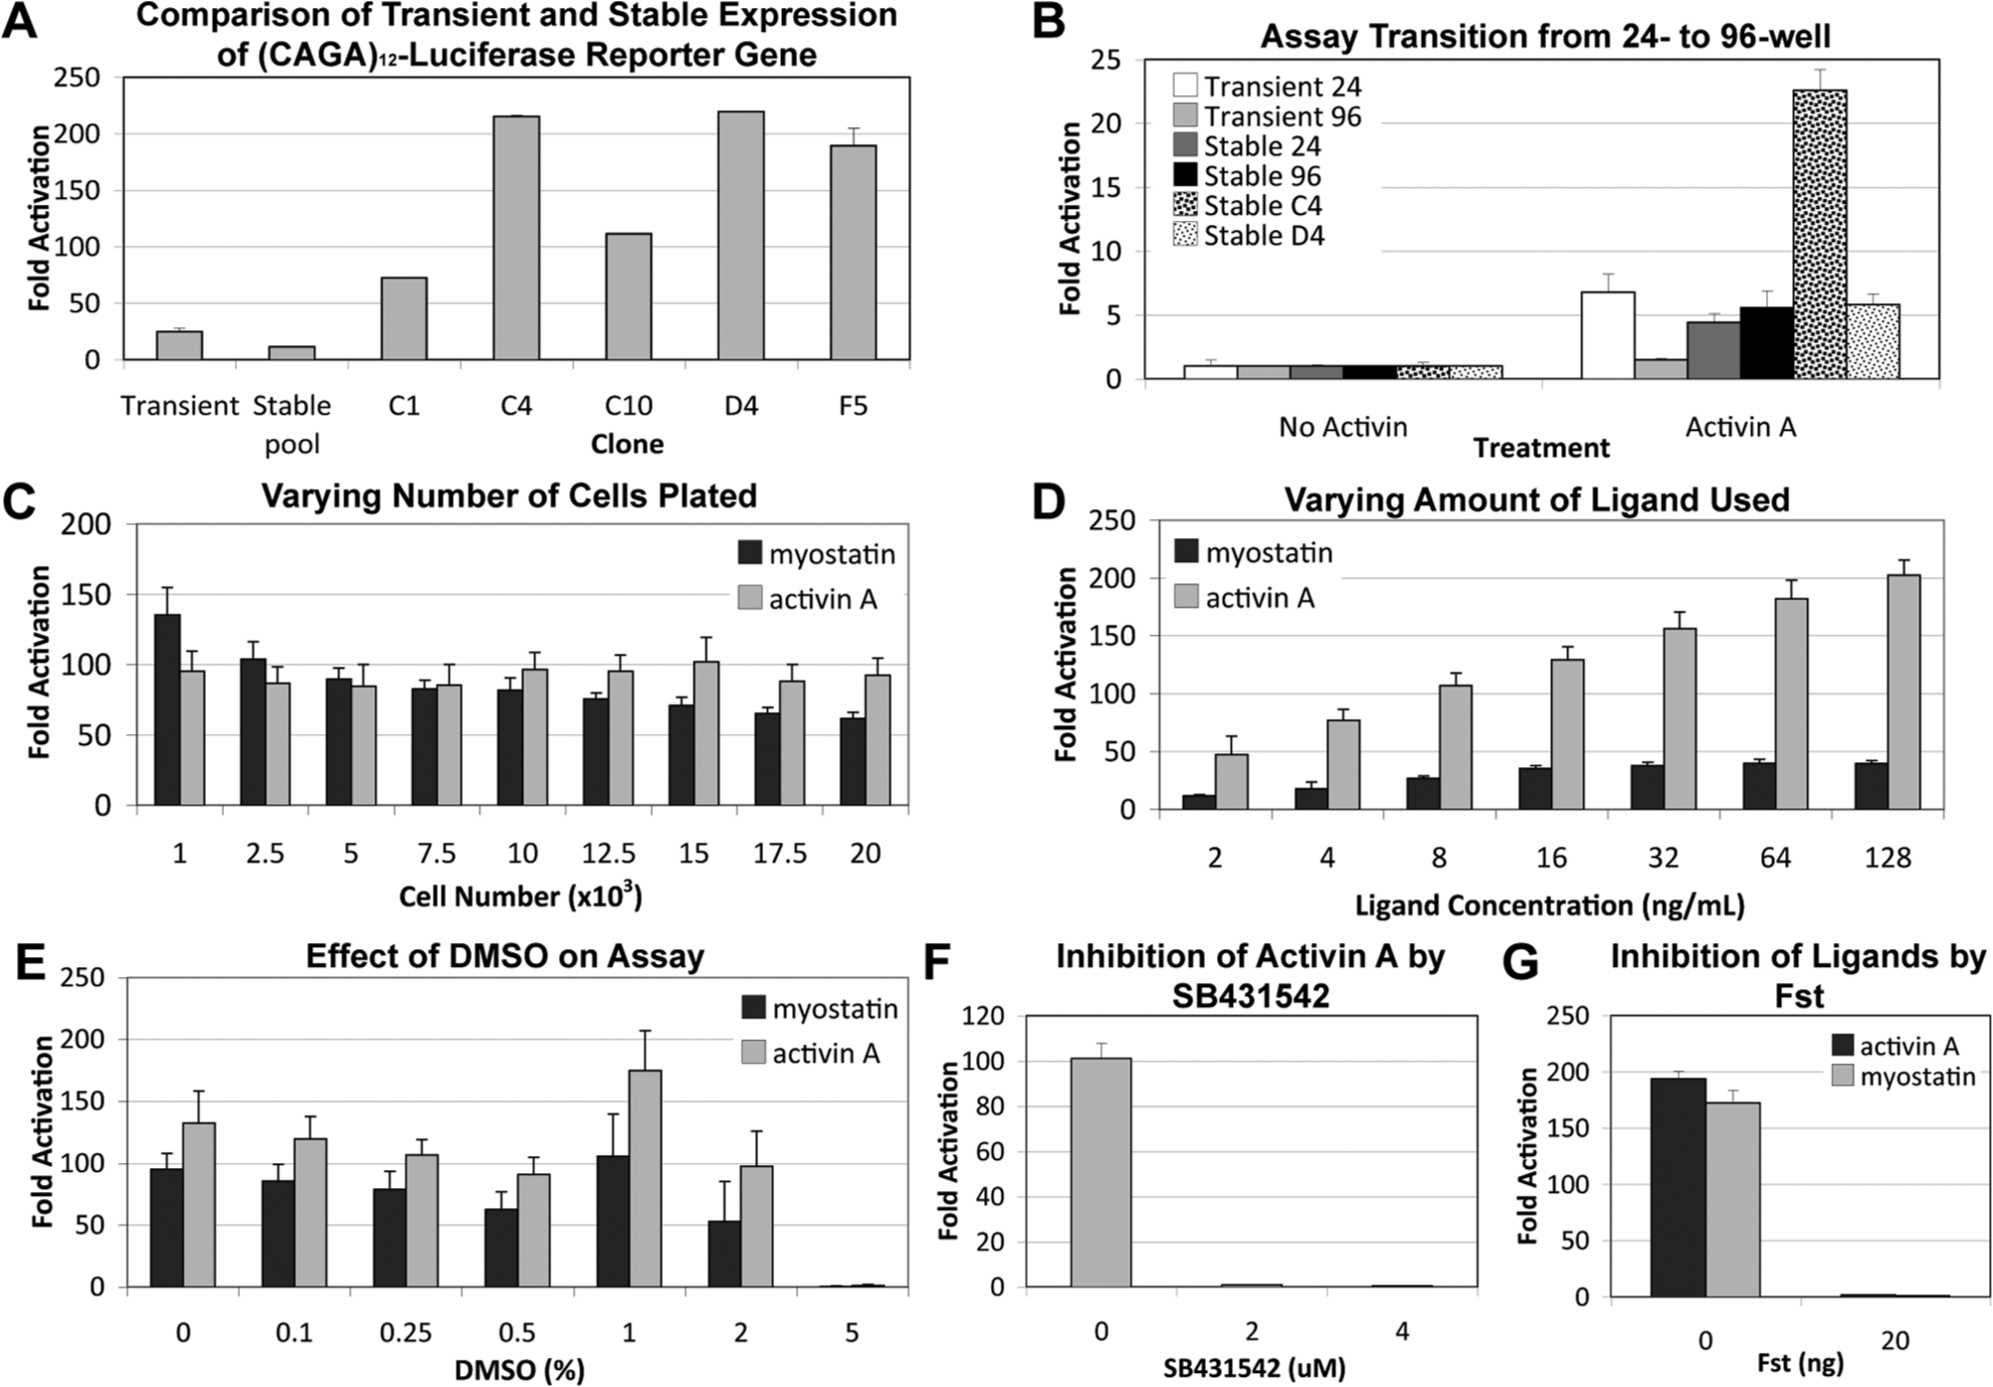
Miniaturization and optimization of a cell-based luciferase reporter assay. For each set of cells, fold activation represents relative light units (RLU) of cells treated with activin A/cells with no activin A treatment. Error bars represent + SEM. (
We next optimized a variety of assay parameters, including the number of cells plated, the amount of ligand used, and compatibility with DMSO. Optimization was performed using the C4 cell line, which showed the greatest overall response in our initial assays (
Fig. 2A
,
B
). The assay was initially optimized in 96-well plates (data not shown except for statistics in
Table 1
, “Preliminary 96-Well”), which then led to optimization in a 384-well HTS format (
Fig. 2C
–
E
). Increasing the number of cells plated did lead to a corresponding increase in signal (data not shown). However, background also increased such that the overall S/B ratio was similar across the cell numbers tested (
Fig. 2C
). Z′ scores indicated that higher cell numbers should be used (
Statistics Associated with Assay Development and Optimization.
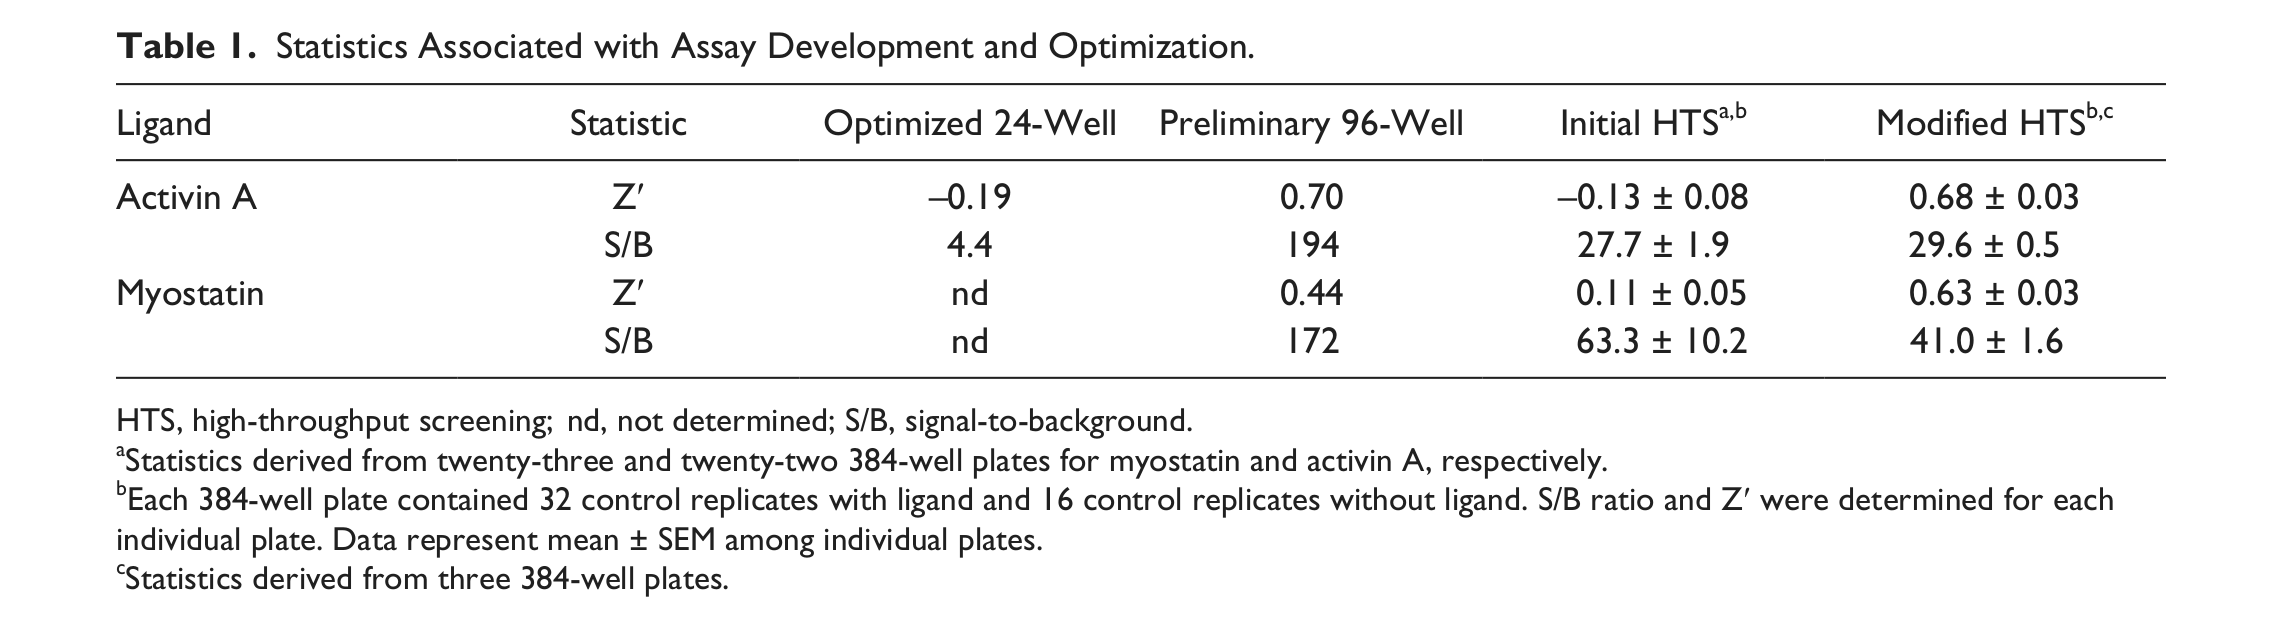
HTS, high-throughput screening; nd, not determined; S/B, signal-to-background.
Statistics derived from twenty-three and twenty-two 384-well plates for myostatin and activin A, respectively.
Each 384-well plate contained 32 control replicates with ligand and 16 control replicates without ligand. S/B ratio and Z′ were determined for each individual plate. Data represent mean ± SEM among individual plates.
Statistics derived from three 384-well plates.
Once we had a number of optimized parameters in place, we began analyzing control conditions for HTS. Because screen compounds are diluted in DMSO, we wanted to test the effect of DMSO on the assay. As shown in
Figure 2E
, at concentrations higher than 0.25%, DMSO reduces the response of the cells to ligand as well as the robustness of the assay (
HTS Optimization
In conjunction with the initial HTS performed in a 384-well format, we also continued to further optimize our assay in the 96-well format (data not shown) to increase the quality of the response as indicated by Z′ score analysis (
Table 1
, “Initial HTS”). These modifications in the optimized 96-well protocol (described under Materials and Methods) were later applied to and optimized in the modified 384-well HTS assay. These included using resazurin to correct for cell number variability between wells as well as to monitor for cytotoxic effects of compounds. Changes were also made to the media used during the assay, to the mixing of ligands with inhibitors, and to incorporate the use of Bright-Glo Reagent. Incorporation of these modifications led to an optimized protocol that is described in detail under Materials and Methods and outlined in
HTS Analysis of Myostatin and Activin A Inhibitors
We performed a pilot HTS study using the approximate 2500 compounds selected either from in silico screening (~1580) or as a set representing the structural diversity of the UC compound library (~960). We present a two-tiered screen consisting of a primary screening tier where each compound was tested at 8.8 µM for its effect on myostatin and activin A activity and a hit confirmation screening tier where each primary hit was tested in triplicate at 8.8 µM against each ligand. In the primary screen, 716 compounds were identified as potential myostatin inhibitors and were further tested in triplicate in the hit confirmation screen. The effect that each of these compounds had on myostatin and a correlation to the effect each had on activin A are shown in
Figure 3
. In general, many compounds exhibit similar effects on myostatin and activin A, as shown by the clustering of compounds around the diagonal line, which signifies identical changes in the activities of the two ligands. However, several compounds also differentially affected each ligand. For example, some compounds had little to no effect on activin A activity but changed myostatin activity by −50% or more, which is the optimum target effect. Moreover, virtual screening against myostatin led to a greater than 8-fold enrichment in target hits (causing <−50% myostatin activity) as compared with compounds from the diversity set (
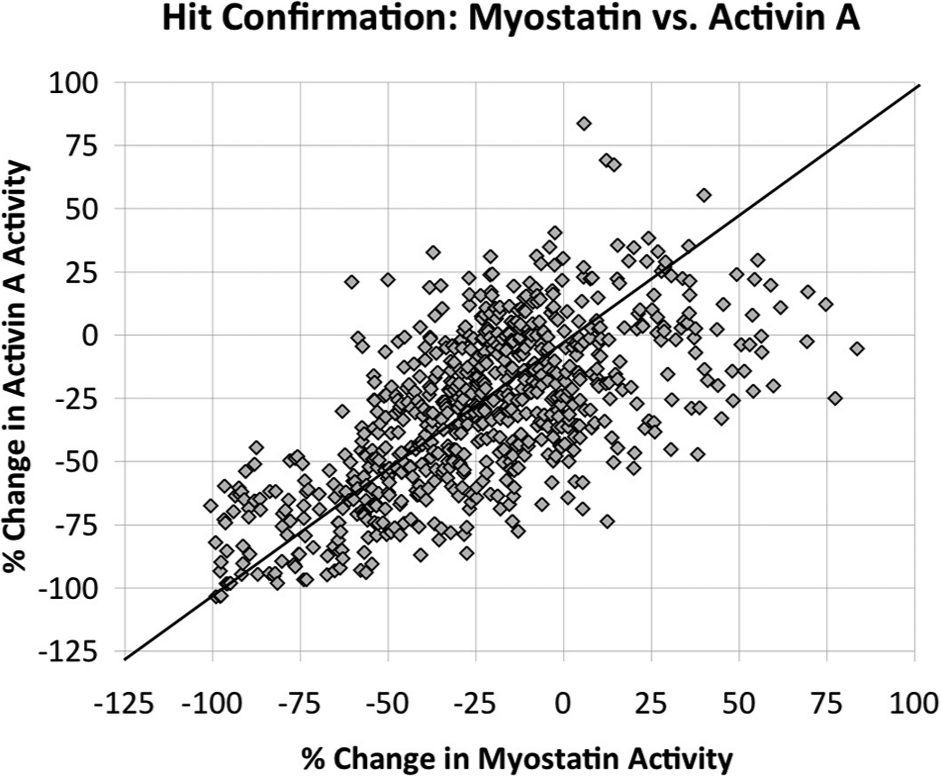
Correlation of the effects of compounds on luciferase reporter activity induced by myostatin and activin A. Shown are the results of the Hit Confirmation Screening Tier performed on three replicate plates for each ligand. A 0% change in ligand activity indicates that a compound had no effect on ligand signaling, whereas a −100% change indicates that a compound completely inhibited ligand signaling. Compounds lying on the diagonal line exhibit identical effects on both myostatin and activin A.
A third screening tier may be carried out in which select compounds move on to a dose-response screening tier and are tested for effects on both ligands. In addition to the effects of compounds on ligand activity, cell viability should also be monitored to assess possible off-target cytotoxicity, as described in the Materials and Methods section. To furthermore control for off-target effects or those that are not limited to the activin A/myostatin signaling pathway, a constitutively expressed Renilla luciferase construct can be used (
Currently, there exists a high demand for developing therapeutics that modulate TGF-β signaling for the treatment of a variety of diseases. Although more than 30 individual ligands exist, signaling is funneled into a handful of receptors and intracellular signaling molecules. This bottleneck creates a challenge in identifying inhibitors that specifically target a particular ligand without completely inhibiting one of the two major signaling branches. For this reason, additional tools are needed that will promote the selection and identification of small-molecule and other types of inhibitors that specifically target individual ligands. In this study, our strategy was to take advantage of a well-established gene reporter assay and optimize it for closely related ligands that use the same downstream SMAD branch. Then, by simultaneously screening for small-molecule inhibitors to both myostatin and activin A, we began to enrich for small molecules that preferentially inhibit one ligand over the other. This strategy will provide a high-throughput assay format to identify small molecules that directly bind and block myostatin or activin A signaling, as these molecules so far have been elusive. These types of experiments will be paramount to the development of small-molecule therapeutics that may be used in the treatment of muscle-wasting disorders. Furthermore, it has become clear in recent years that pathophysiological levels of other TGF-β family ligands are associated with many major human diseases, including cancer, cardiovascular disease, osteoporosis, and diabetes, 6 and therapeutics for these are also being developed. 15 This underlines the utility of the assay developed here, as it could easily be adapted to other TGF-β family ligands to rapidly screen potential inhibitor molecules.
Footnotes
Declaration of Conflicting Interests
The authors declared no potential conflicts of interest with respect to the research, authorship, and/or publication of this article.
Funding
The authors disclosed receipt of the following financial support for the research, authorship, and/or publication of this article: This work was supported by the US National Institutes of Health (NIH) (GM084186), the University of Cincinnati Interdisciplinary Research Support Program, and the Muscular Dystrophy Association (MDA) (93887 and 240087) granted to T.B.T.
References
Supplementary Material
Please find the following supplemental material available below.
For Open Access articles published under a Creative Commons License, all supplemental material carries the same license as the article it is associated with.
For non-Open Access articles published, all supplemental material carries a non-exclusive license, and permission requests for re-use of supplemental material or any part of supplemental material shall be sent directly to the copyright owner as specified in the copyright notice associated with the article.