
Abstract
Control of mRNA translation plays a critical role in cell growth, proliferation, and differentiation and is tightly regulated by AKT and RAS oncogenic pathways. A key player in the regulation of this process is the mRNA 5′ cap-binding protein, eukaryotic translation initiation factor 4E (eIF4E). eIF4E contributes to malignancy by selectively enabling the translation of a limited pool of mRNAs that generally encode key proteins involved in cell cycle progression, angiogenesis, and metastasis. Several data indicate that the inhibition of eIF4E in tumor cell lines and xenograft models impairs tumor growth and induces apoptosis; eIF4E, therefore, can be considered a valuable target for cancer therapy. Targeting the cap-binding pocket of eIF4E should represent a way to inhibit all the eIF4E cellular functions. We present here the development and validation of different biochemical assays based on fluorescence polarization and surface plasmon resonance techniques. These assays could support high-throughput screening, further refinement, and characterization of eIF4E inhibitors, as well as selectivity assessment against CBP80/CBP20, the other major cap-binding complex of eukaryotic cells, overall providing a robust roadmap for development of eIF4E-specific inhibitors.
Introduction
The regulation of translation is a mechanism used to modulate gene expression in a wide range of biological situations. This regulation is effected primarily at the level of translation initiation rather than elongation or termination. Eukaryotic initiation factor 4E (eIF4E) is part of a protein complex (eIF4F) that binds to the 5′ cap of mRNAs (a 5′ terminal m7GpppN, in which a 5′-5′-triphosphate bridge links the first mRNA nucleoside to the m7 methylguanosine) and then scans through the 5′-untranslated region (5′-UTR), revealing the translation initiation codon and enabling ribosome loading and polypeptide synthesis. The other two components of the eIF4F complex are eIF4A and eIF4G. eIF4A is an adenosine triphosphate (ATP)–dependent RNA helicase that facilitates the unwinding of the secondary structures in the 5′-UTR region of mRNAs, whereas eIF4G is a large scaffolding protein that acts as a docking site for other proteins and allows the formation of the preinitiation complex and the binding to the 40S subunit of the ribosome. 1
In normal cells, the amount of eIF4E is limiting, and mRNAs have to compete to have access to the eIF4F complex. Housekeeping genes mRNAs are characterized by short and unstructured 5′-UTR sequences and can be efficiently translated even in the absence of active eIF4F complex. Instead, mRNAs encoding for proteins that regulate growth and survival frequently harbor a long, highly structured 5′-UTR, which renders them completely dependent on the eIF4F unwinding activity for ribosome loading. 2 The amount of eIF4E in the cell that can form the eIF4F complex is tightly regulated by a family of repressors, termed eIF4E binding proteins (eIF4E-BP1, BP2, and BP3). When non-phosphorylated, these proteins strongly bind eIF4E, therefore preventing eIF4F complex formation. Mitogens, hormones, and growth factors activate the PI3K/AKT/mTor signaling pathway, resulting in hyperphosphorylation of eIF4E-BPs. This displaces the interaction between eIF4E and 4E-BPs, allowing the binding of eIF4E to eIF4G and the formation of the active eIF4F complex.
eIF4E plays a role in tumor development by enabling the translation of a limited pool of mRNAs that encode key proteins involved in cellular growth, survival, and angiogenesis (e.g., c-myc, VEGF, ODC, cyclinD1, MMP9, ribonucleotide reductase). 3
Several studies have shown eIF4E overexpression in a number of human tumors, frequently correlated with the overexpression of other tumor markers (cyclin D1, VEGF, FGF2, MMP9). In some cases, a correlation was also seen between the level of eIF4E overexpression and tumor grade, suggesting that eIF4E overexpression might be a marker for poor prognosis.4,5
Artificial overexpression of eIF4E in normal cell lines (NIH3T3, CHO, rat embryo fibroblasts) results in a transformed phenotype, whereas inhibition of eIF4E in tumor cell lines and animal models impairs tumor growth and induces apoptosis.6,7
Given that all the described functions of eIF4E rely on its cap-binding activity, a small molecule preventing cap binding is expected to induce a strong antitumoral effect.
The cap structure has another major interactor in eukaryotic cells: the nuclear cap-binding complex CBP80/CBP20 or CBC. This complex can bind capped RNA only as heterodimer and is composed of CBP80, a large regulatory subunit, and of CBP20, a small cap-binding subunit. The CBP80/CBP20 complex is involved in nonsense-mediated RNA decay and regulates the splicing of 5′ proximal introns, the stability of 3′ end of RNAs, and the nuclear export of snRNA and mRNAs. 8 Due to these important housekeeping functions, it is mandatory that eIF4E inhibitors, targeting the cap-binding pocket, do not interfere with CBP80/CBP20 roles.
This article describes the production of recombinant eIF4E protein complexed to an eIF4G peptide and the development of different in vitro assays to monitor for cap displacement. The following assays can support the identification of cap competitors in high-throughput screening (HTS) with potency ranging from µM to low nM, the confirmation of the identified hits using a different approach based on surface plasmon resonance (SPR), and a study of the mechanism of action of the inhibitors.
Finally, the development of a CBP80/CBP20 specificity assay will allow the profiling of the selected eIF4E inhibitors against the other main cap-binding complex present in eukaryotic cells.
Materials and Methods
Materials
All solvents and reagents, unless otherwise stated, were of the best grade, were commercially available (Sigma Aldrich, St. Louis, MO; Fluka, Buchs SG, Switzerland), and were used without further purification.
Protein Expression and Purification
The human eif4e full-length [GI:1352435] was cloned into pGEX vector using BamHI + XhoI restriction sites, incorporating a ribosome binding site between the stop codon and XhoI, obtaining the vector pGEX-eIF4E FL-RBS. Two peptides of human eIF4G [GI:41019505] with a different N-terminus (amino acids 569–647 and 574–647) were inserted into the XhoI site of pGEX-eIF4E FL-RBS. The following dicistronic vectors were obtained: pGEX- eIF4E FL-eIF4G (569–647) and eIF4E FL-eIF4G (574–647). The proteins were expressed in Escherichia coli BL21pLysS (DE3) strain in LB in the presence of 50 µg/mL carbenicillin. Cultures were inoculated at 37 °C and grown to an OD600 of 0.8 at 37 °C, then induced with 0.75 mM Isopropyl-β-D-thio-galactoside (IPTG) and grown overnight at 21 °C. Cells were harvested by centrifugation, cell pellets were resuspended in buffer A (50 mM Tris-HCl [pH 7.6], 150 mM NaCl, 10% glycerol, 20 mM dithiothreitol [DTT], Protease Inhibitor Cocktail Tablets from Roche Biochemicals, Mannheim, Germany), and lysozyme and benzonase were added to the cell suspension before lysis. Cells were lysed by a Gaulin homogenizer (GEA Niro Soavi, Parma, Italy), and the lysate was cleared by centrifugation. eIF4E full-length protein, either alone or in complex with the different eIF4G peptides, was purified by glutathione (GST) affinity chromatography and subjected to on-column cleavage of the GST tag with PreScission Protease (GE Healthcare, Piscataway, NJ) overnight in buffer B (50 mM Tris-HCl [pH 7.6], 100 mM NaCl, 10% glycerol, 1 mM DTT, 0.5 mM EDTA). The cleaved complexes were eluted with the same buffer and diluted three times with buffer C (50 mM Tris-HCl [pH 8.0], 10% glycerol, 1 mM DTT) and further purified by ion exchange (Mono Q chromatography from GE Healthcare) with a gradient from 5 to 300 mM NaCl in a 40-column volume. The fractions containing eIF4E (or the 1:1 eIG4E/4G complex) were pooled separately and gel filtered on a Superdex75 (GE Healthcare) in buffer D (20 mM HEPES [pH 7.5], 100 mM KCl, 0.5 mM tris(2-carboxyethyl)phosphine [TCEP]).
The human full-length cbp20 [GI:1705651] and cbp80 [GI:1705654] were cloned in pVL1393 with an His tag at the N-terminus of CBP20 using Gateway technology (Invitrogen, Carlsbad, CA). Recombinant CBP80/CBP20 complex was then prepared from High Five insect cells coinfected with the CBP20 and CBP80 baculoviruses. Cells were lysed in buffer E (50 mM Tris [pH 8.0], 300 mM NaCl, 20 mM imidazole, 10% glycerol, 5 mM β-mercaptoethanol, Protease Inhibitor Cocktail Tablets) and cleared by centrifugation. The complex was purified by Ni-affinity chromatography and eluted with a gradient of imidazole from 35 to 200 mM. The fractions containing the CBP80/CBP20 complex were loaded onto a Superdex 200 (GE Healthcare) using buffer F (50 mM Tris [pH 8.0], 150 mM NaCl, 5 mM DTT). The gel-filtered CBP80/CBP20 complex was further purified by ion exchange on Resource Q (GE Healthcare) with a gradient from 150 mM to 1M NaCl.
Development of Fluorescence Polarization Assays
The Atto-610-m7GDP and Atto-610-m7GpppppG (Atto-610-m7Gp5G) probes used to develop the fluorescence polarization (FP) technique were purchased from Jena BioScience (Jena, Germany).
The FP assay was carried out in a total volume of 70 µL. Equilibrium experiments were performed in 50 mM HEPES (pH 7.2), 100 mM KCl, 0.5 mM EDTA, 1 mM DTT, and 1% DMSO.
FP measurements were carried out at room temperature (RT) using black 384-well microplates (Corning Incorporated, Corning, NY) on a Fusion α-FP HT plate reader (Packard Instruments Company, Meriden, CT); an excitation filter at 590/20 nm and an emission filter FP632/45 were used for the Atto-610 probes. All FP values are expressed in mP units.
Titration experiments were performed by adding increasing amounts of eIF4E/4G to a constant concentration of probes. The mixture was incubated at RT for 10 min before reading the mP signal. 9
The following reference compounds were used to validate the assay: m7GMP, 7-pCl-Bn-GTP, m7Gp5G, and m7GpppC (Jena BioScience); m7GDP and m7GTP (Sigma Aldrich); and m7GpppG and m7GpppA (New England Biolabs, Ipswich, MA).
Assay performance was evaluated following the signal-to-background (S/B) ratio, dynamic range (DR), Z′, and Z factor.
The following equations were used:

and

where (
The Z value was determined using the following equation:

The signal stability was assessed upon different incubation times, and the impact of DMSO was evaluated.
Experimental data were fitted using the program DynaFit, version 3.28.039 (BioKin Ltd, Watertown, MA); Microsoft Excel (Microsoft Corporation, Redmond, WA); and SigmaPlot (SSI, San Jose, CA). 11
m7GDP and m7Gp5G were dissolved in water or 1% DMSO, and the equilibrium dissociation constants (KD) were measured.
Increasing amounts of m7GDP and m7Gp5G were added to the protein solution (50 nM and 3 nM, respectively) with a fixed probe concentration (10 nM for Atto-610-m7GDP; 3 nM for Atto-610-m7Gp5G).
Simulation Studies
Using the program SigmaPlot, the following equations were used:
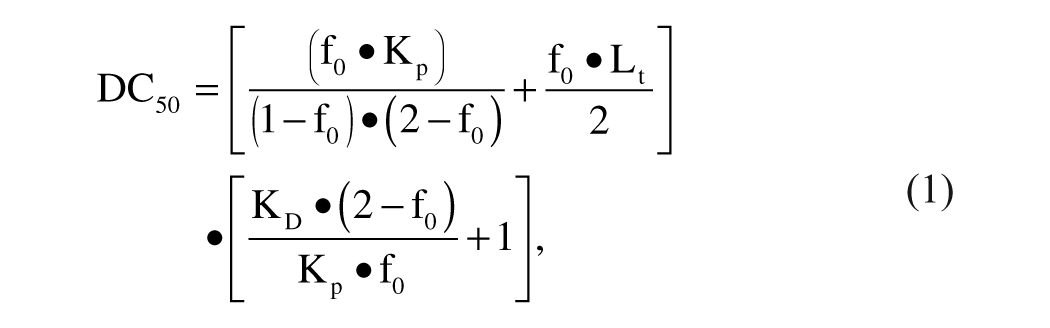
where Kp is the affinity of the probe for the receptor, f0 is the fraction of ligand bound to the receptor over the total, and Lt is total ligand concentration.
This equation, according to Huang, 12 is limited to inhibitors binding competitively to the receptor with a stoichiometry of 1:1 and describes the relationship between the DC50 and the KD of an inhibitor using a given probe.
The relationship between DC50 and the percentage of inhibition for a competitive 1:1 binding model is
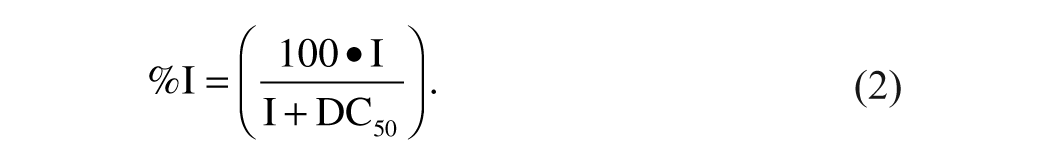
By reconfiguring and merging equations (1) and (2), equation (3) can be obtained:
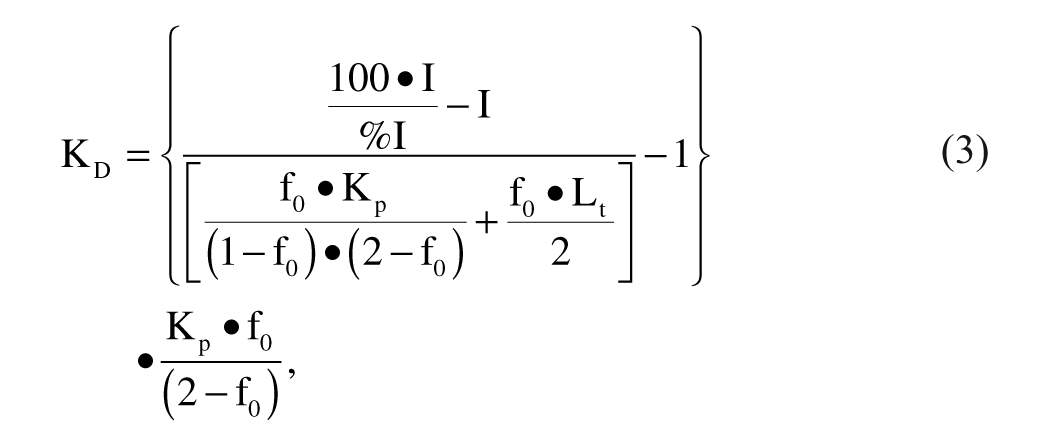
where %I is the percentage of inhibition when the inhibitor is tested at the concentration I and the inhibitor binds to the receptor with a 1:1 Langmuir competitive binding model. 13
CAP-2′-O-Me RNA Oligonucleotides Synthesis
The 5′ phosphorylated O-2′-methylated RNA oligonucleotide 5′GACACCAACAACAACAUCA3′ was prepared by the standard phosphoramidite solid-phase method using a ABI394 DNA Synthesizer (Applied Biosystems, Foster City, CA)14,15 and further purified by gel filtration on a Sephadex G50 NAP-10 column (GE Healthcare Europe GmbH).
Biotinylation was performed using 3′-BiotinTEG-CPG (Glen Research, Sterling, VA) following the manufacturer’s recommendations. The 3′ biotinylated oligo obtained is referred to as Oligo 1, whereas the non-biotinylated control is referred to as Oligo 2.
A capping reaction was performed on purified oligonucleotides. The 5′-5′ coupling between 10 equivalents excess of 7-methylguanosine, 5′-diphosphate imidazolide (m7GppIm) and the oligonucleotides was performed in 0.2 M N-ethylmorpholine, in HCl buffer (pH 7.0), 10 mM MnCl2, producing CAP-Biotin Oligo, referred to as Oligo 3, and CAP non-biotinylated oligo, referred to as Oligo 4. After 4 days at 30 °C, the reaction mixture was purified by gel filtration chromatography, characterized by electrospray (ESI) mass spectrometry, and further purified according to the following method.
Oligonucleotide Purification and Characterization
Following the capping reaction, Oligo 4 displayed 85% purity and was used without further purification. Oligo 3, instead, did not yield an acceptable purity and was subjected to an anion exchange analytical column (DNAPac PA200 4 × 250 mm; Dionex, Sunnyvale, CA). Chromatographic separations were carried out on an Ettan LC system (Amersham Biosciences, Piscataway, NJ), with a linear gradient elution from 0.31 M to 0.56 M NaCl (25 mM Trizma buffer, pH 8.0) for 15 min at a flow rate of 1.2 mL/min. Fractions containing the purified oligo were pooled and desalted using a gel filtration NAP-10 column.
The oligonucleotides were analyzed by liquid chromatography/mass spectrometry (LC/MS) using a quadrupole time-of-flight (Waters Q-TOF Ultima; Waters, Milford, MA) mass spectrometer operating in negative ion mode and connected to a micro high-performance liquid chromatography (HPLC) system (Agilent 1100; Agilent, Santa Clara, CA). Purity was assessed on a Waters XTerra MS C18 analytical column (50 × 1.0 mm, 2.5-µm particle size) and thermostated at 40 °C, using a hexafluoroisopropanol (HFIP) 0.1 M/triethylamine (TEA) mobile phase (pH 8.2) and a methanol gradient at a flow rate of 40 µL/min. The HPLC purity of Oligo 3 was 95% (UV 260 nm).
Surface Plasmon Resonance Assay Setup
SPR analyses were performed using a BIAcore 2000 (Biosensor; Biacore, Piscataway, NJ). The Sensorchip SA (Biacore) was used to immobilize 36 resonance units (RUs) of purified Oligo 3 on flow cell 2 and of Oligo 1 on flow cell 1. Kinetic experiments were carried out in HBS-P buffer (10 mM HEPES [pH 7.4], 150 mM NaCl, 0.005% Surfactant P20 [Biacore]), injecting 50 µL of eIF4E/4G at a flow rate of 50 µL/min. eIF4E/4G complex and four sensor chips were used for kinetic and affinity-in-solution (AIS) studies.
The signal was monitored during injection, subtracting the signal of flow cell 1 from the signal of flow cell 2. The KDs of reference compounds were determined by injecting a constant protein concentration (25 nM) with varying concentrations of the compounds. In total, 10 nM protein concentration was used to determine the KD in solution for non-biotinylated Oligo 4 and m7Gp5G. The free eIF4E/4G concentration was determined from a standard curve constructed through the measurement of the signal at steady state (SS) after the injection of known concentrations of protein. The data were visualized on a Scatchard plot of RUSS/[eIF4E/4G] versus RUSS and compared with the 1:1 Langmuir model. Data obtained from the sensorgrams were fitted using the program DynaFit (BioKin, Watertown, MA).
The absence of systematic errors in the kinetic analysis was verified by comparing the Kon at different protein concentrations (dilution errors) and at different flow rates (mass transport limitations). Injection of eIF4E/4G and Oligo 2 mixture was used as negative control (data not shown). The chip signal stability was repeatedly determined over time by injecting 50 µL of 25 nM eIF4E/4G at 50 µL/min.
A specificity SPR assay for the CBP80/CBP20 complex was set up using the AIS technique. The steady state was reached for all concentrations of the CBP80/CBP20 complex by injecting 25 µL at a flow rate of 10 µL/min on a low-density chip bearing 9 RUs of Oligo 3 on flow cell 2 and Oligo 1 on flow cell 1.
To determine the protein concentration in solution, a standard curve was constructed as described for eIF4E/4G.
The determination of the KD of reference compounds and all the analysis were performed as described for eIF4E/4G but by injecting 20 nM CBP80/CBP20 protein and using a lower chip density, flow rate, and volume of injection.
Results
Protein Purification
The production and purification of recombinant eIF4E have been reported by several groups: Generally, the purified protein is obtained either by refolding from inclusion bodies or by applying the soluble lysate to an m7GTP resin, followed by elution with a cap analogue.16–20 Hsu et al. 21 reported the production of Gst-eIF4E. However, the tag was not removed and the affinity values measured for cap analogues were slightly higher. Ghosh et al. 22 succeeded in purifying a DHFR-eIF4E protein by methotrexate affinity chromatography, followed by DHFR tag removal by thrombin cleavage.
In the present work, recombinant eIF4E was purified from a bacterial culture as Gst-tagged protein, followed by tag removal upon PreScission Protease cleavage and ion exchange chromatography. eIF4E was also purified in complex with two different eIF4G1 peptides (eIF4G1 569-647; eIF4G1 574-647).
23
The protocol used was the same for the different proteins. The final purity was comparable across the three constructs (
The production and purification of the CBP80/CBP20 were previously described either by in vitro reconstitution of the complex from His-tagged CBP20 (expressed in E. coli) and CBP80 (expressed in insect cells) or by the coexpression of the two untagged subunits in insect cells.8,24 In this study, His-CBP20 and native CBP80 were coexpressed in insect cells. The presence of the His-tag on the smaller subunit allowed an easy purification of the complex through affinity chromatography on Ni++ resin. A gel filtration and ion exchange step were performed to improve the final purity (
eIF4E Binding Assay
To accomplish its cellular functions, eIF4E must be loaded with its target mRNAs through the interaction with the cap structure. We reasoned that the most specific way to exploit eIF4E-mRNA interaction is to directly quantitate the binding of the recombinant protein to a ligand mimicking the capped mRNA.
FP and SPR are binding techniques where the detection of the bound ligand occurs in the absence of separation steps, thus preventing potential perturbations of the equilibrium due to fast ligand dissociation. These techniques enable the measurement of low-affinity interactions by exploiting the increase in size due to the formation of the protein-ligand complex. To this purpose, in the present work, the FP technique is based on a cap analogue conjugated to an appropriate fluorophore; the SPR technique is based on a cap oligo conjugated to a biotinylated moiety that interacts with a streptavidin-coated chip.
FP Binding Assay: Probe Evaluation
FP-based assays are widely used for the identification of small molecules that bind to biological targets and are suitable for HTS. The FP signal reflects the binding of a fluorescent-labeled ligand to a receptor protein and is proportional to the fraction of receptor bound to the ligand. Important factors to be evaluated for an FP-based assay setup include the choice of the most appropriate ligand (probe) and the robustness of the assay (stability of the signal over time in the presence of DMSO). The probe is selected according to its affinity for the receptor, and this affinity will then affect the receptor concentrations in the assay. Finally, the affinity of the selected probe for the receptor will determine the range of resolvable inhibitor potency. 12
Atto-610-m7GDP and Atto-610-m7Gp5G, which have the same fluorophore, Atto-610, but different affinities for eIF4E/4G, were evaluated as probes. 9 The two probes were tested in the same format and the concentrations were chosen so that, after determining their affinity for the receptor protein eIF4E/4G, the fraction f0 was approximately 0.5 according to the Huang equation:

where R0 is the receptor concentration, Kp is the affinity of the fluorescent probe for the receptor, and Lt is the total ligand concentration. 12
Once the Kps of the selected probes have been determined, the probe’s concentration must not exceed twofold the Kp. Under these experimental conditions, a good compromise between sensitivity and signal is attained. 12
Comparison between eIF4E/4G (569-647) and eIF4E/4G (574-647) Using Atto-610-m7GDP
To select the most suitable protein, we performed a preliminary characterization of the binding properties of different eIF4E/4G complexes. The affinity of eIF4E/4G (569–647) and eIF4E/4G (574–647) for the Atto-610-m7GDP probe and for different cap analogues was determined (see following paragraph; Tables 1A , B and 2 ).
As shown in Table 1 , the affinity of the two complexes for Atto-610-m7GDP is very similar. In a different set of experiments, the affinity of eIF4E alone for m7GDP closely matched the values calculated for eIF4E/4G (569–647) and eIF4E/4G (574–647) (data not shown), which indicates that the presence of these eIF4G peptides does not affect the cap-binding properties of eIF4E alone.
Probes KD Values as Determined by FP or SPR Assays for Different Proteins
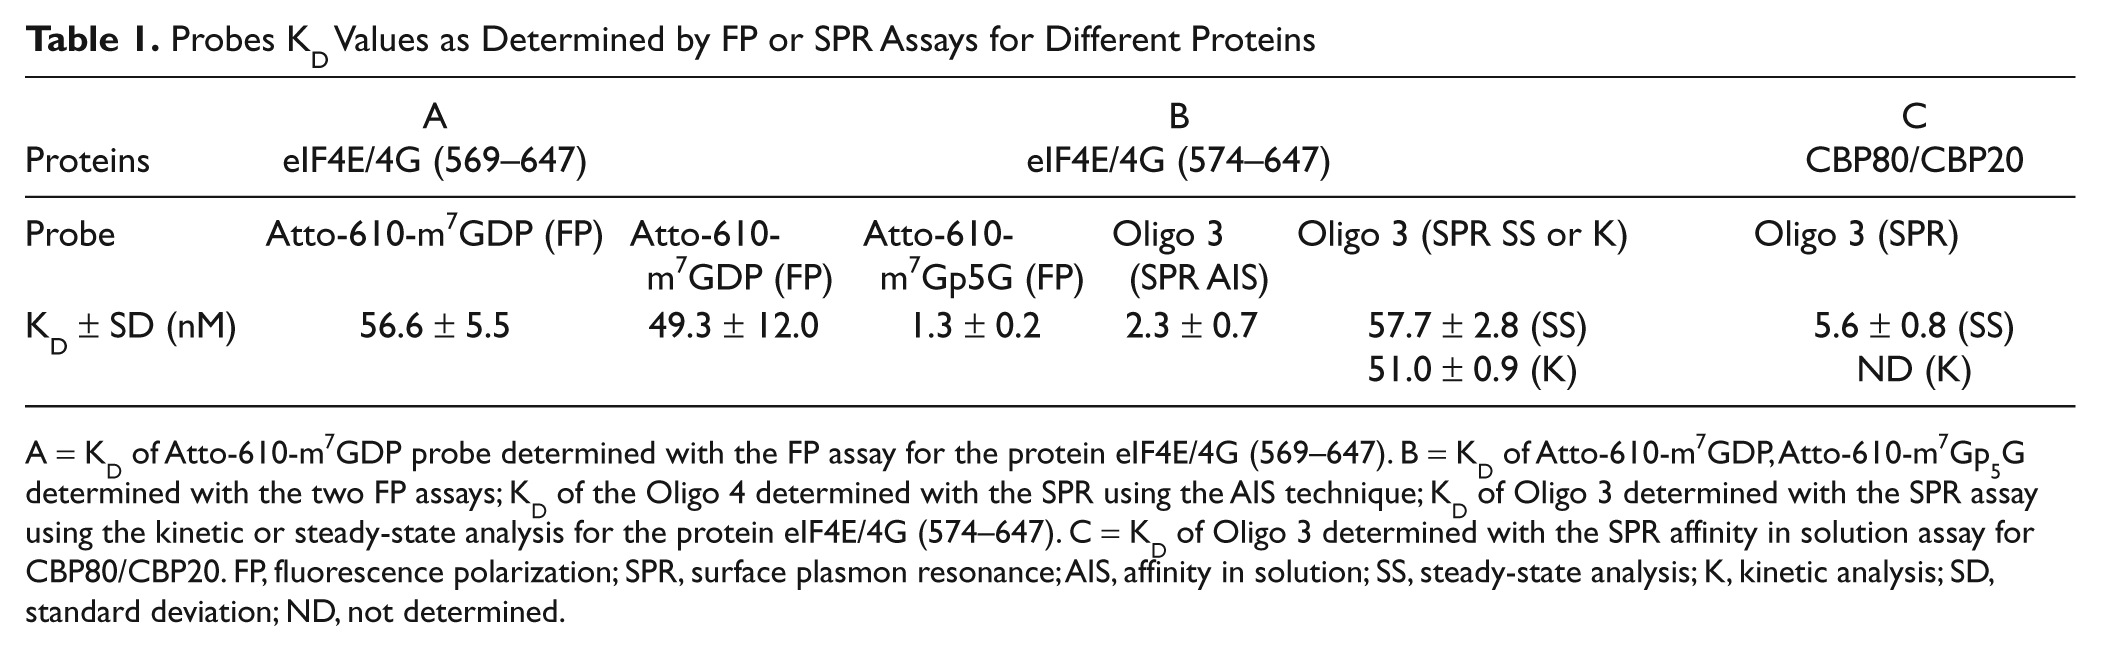
A = KD of Atto-610-m7GDP probe determined with the FP assay for the protein eIF4E/4G (569–647). B = KD of Atto-610-m7GDP, Atto-610-m7Gp5G determined with the two FP assays; KD of the Oligo 4 determined with the SPR using the AIS technique; KD of Oligo 3 determined with the SPR assay using the kinetic or steady-state analysis for the protein eIF4E/4G (574–647). C = KD of Oligo 3 determined with the SPR affinity in solution assay for CBP80/CBP20. FP, fluorescence polarization; SPR, surface plasmon resonance; AIS, affinity in solution; SS, steady-state analysis; K, kinetic analysis; SD, standard deviation; ND, not determined.
Cap Analogue KD Values as Determined by FP- or SPR-Based Competition Assays for Different Complexes
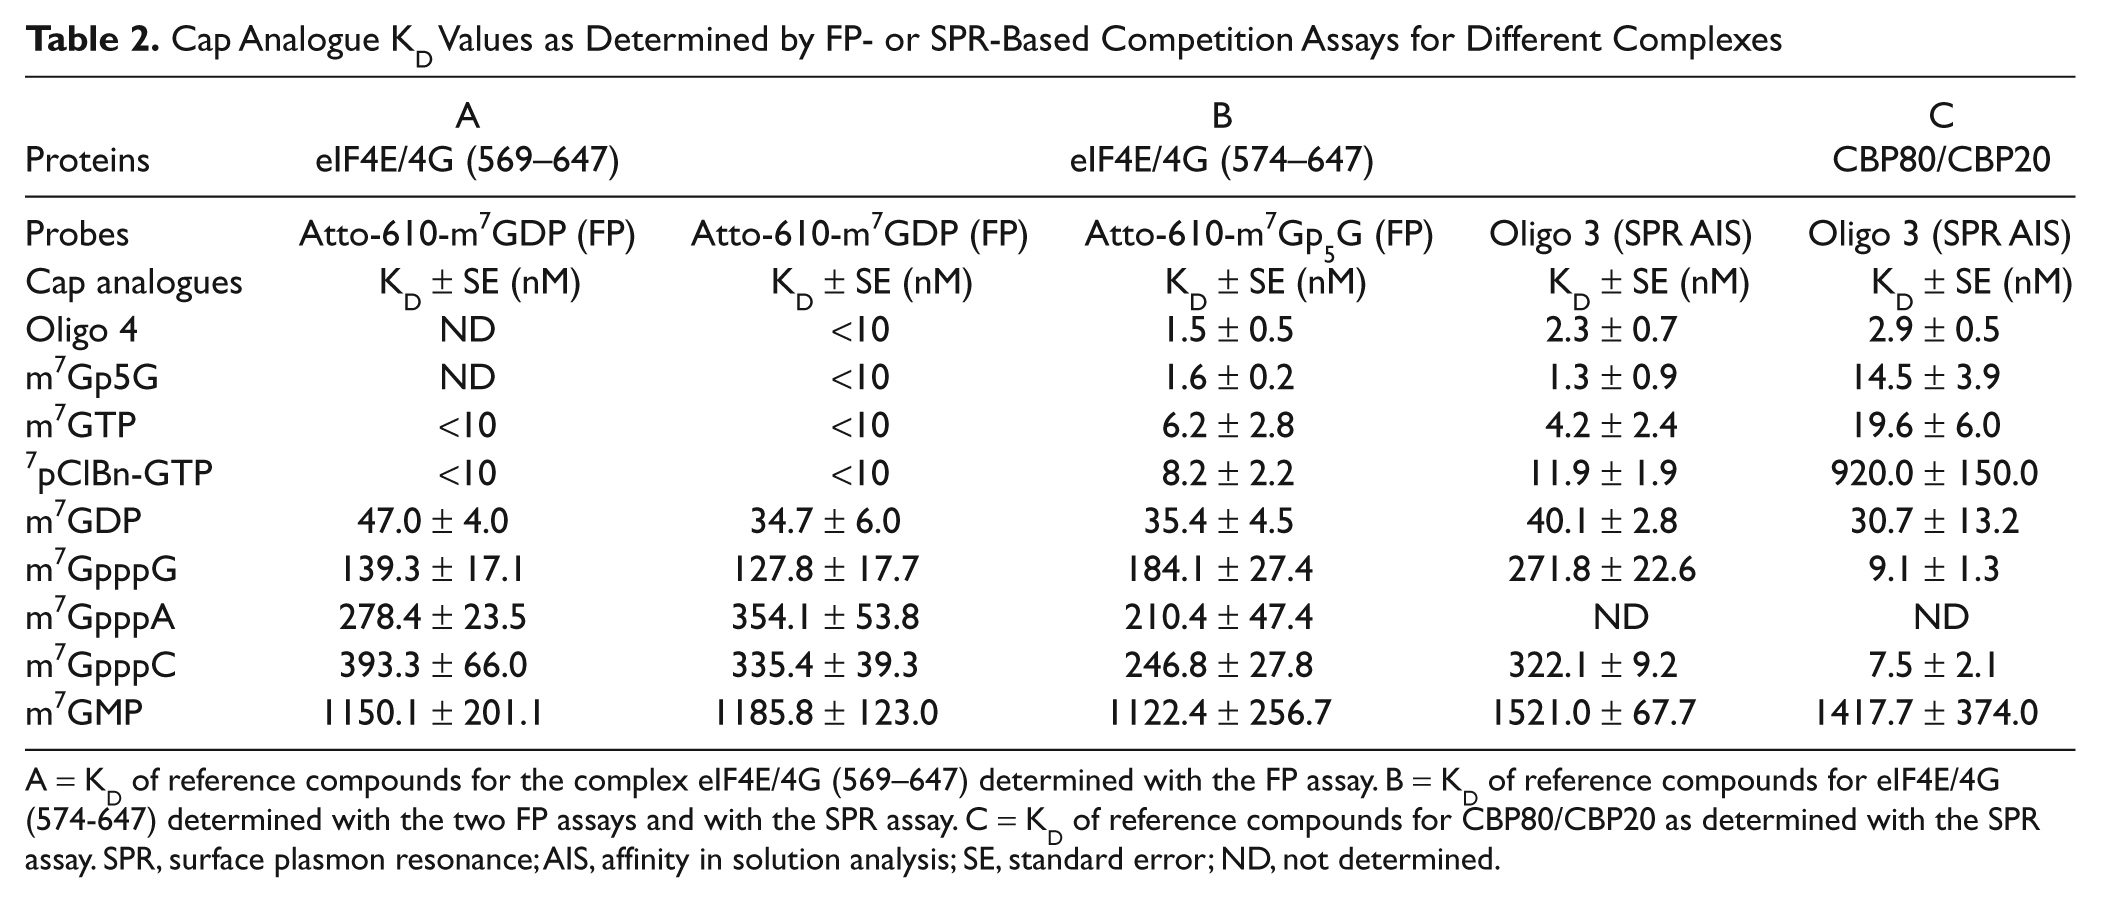
A = KD of reference compounds for the complex eIF4E/4G (569–647) determined with the FP assay. B = KD of reference compounds for eIF4E/4G (574-647) determined with the two FP assays and with the SPR assay. C = KD of reference compounds for CBP80/CBP20 as determined with the SPR assay. SPR, surface plasmon resonance; AIS, affinity in solution analysis; SE, standard error; ND, not determined.
Therefore, the eIF4E/4G (574–647) complex, which was produced with the highest yield, was selected for further assay development and will be hereafter referred to as eIF4E/4G.
Probe Titration and Competition Experiments
The affinity of the selected complex for the two probes was determined by setting the probe concentration and increasing the eIF4E/4G concentration up to signal saturation. The initial probe concentrations (10 nM for Atto-610-m7GDP and 3 nM for Atto-610-m7Gp5G) were selected based on internal exploratory experiments and literature data reporting the affinity for the methylated cap analogues m7GDP and m7Gp5G. 9 The variation of polarization over time was determined, thereby identifying the time to equilibrium for each combination of protein and probe concentrations (data not shown). Figure 1A exemplifies the KD determination for Atto-610-m7GDP with eIF4E/4G (similar values were obtained with eIF4E/4G [569–647], as seen in Table 1 ). Experimental data were fitted using the quadratic equation for the saturation isotherm that takes into account the probe depletion due to protein binding. 13
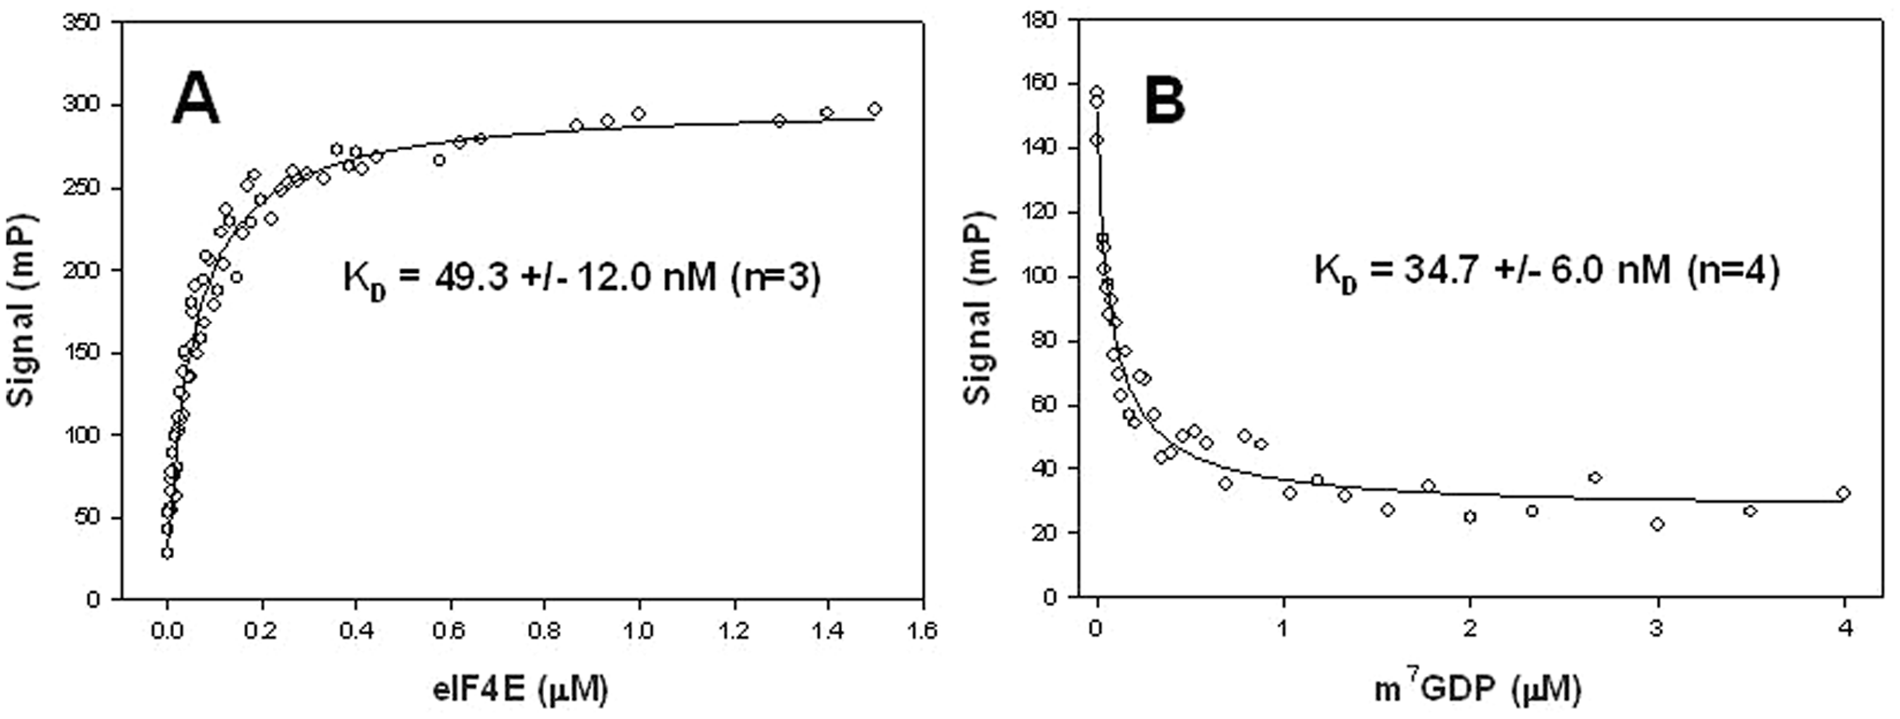
Titration of Atto-610-m7GDP with eIF4E/4G and displacement with m7GDP. (
Parent unlabeled ligands, m7GDP and m7Gp5G, were then used to determine their KDs by displacement of the corresponding labeled probe ( Fig. 1B ). Displacement data were fitted using the program DynaFit with a script file describing a competitive reaction mechanism.
The order of reagents addition did not affect the calculated KDs for the cap analogues. For each competition experiment, the mP signal was followed over time. As a result, a 10-min incubation period was selected as an adequate time to reach equilibrium (data not shown).
Affinity data obtained for the two probes and for the two corresponding parent compounds are consistent with each other and with previously reported data ( Fig. 1 , Tables 1 and 2 ). 7 Therefore, the fluorescent moiety does not affect the binding properties of the parent compounds, and both probes are suitable for screening activities.
Assay Performance and Simulation Studies
An exploratory screening was performed in the presence of unbiased compounds dissolved in DMSO, with the aim of defining the Z factor. This parameter takes into account the signal variation associated with the presence of nonactive compounds together with the signal variation associated with a reference active compound. Using the two probes with different affinities, simulation studies were performed applying equation (1) to assess the lower end limit of resolvable inhibitor potency. Equation (3) was instead used to simulate the assay’s detection limits for low-affinity compounds.
To define the hit threshold, we tested 350 randomly selected, unrelated compounds in the FP assay, and their signal variation is shown in Figure 2A . The sample variability band defines the intrinsic signal variability and in our experiments corresponds to a displacement <30%. Therefore, this displacement value can be considered the hit threshold for a significant signal. All displacement values greater than 30% fall into the separation band and identify potentially positive compounds. In addition, using m7GTP at 10 µM as a positive control, it was possible to explore the robustness of the Atto-610-m7GDP FP assay. The calculated Z was, as expected, lower than Z′ but higher than 0.6 and therefore good for HTS. 10
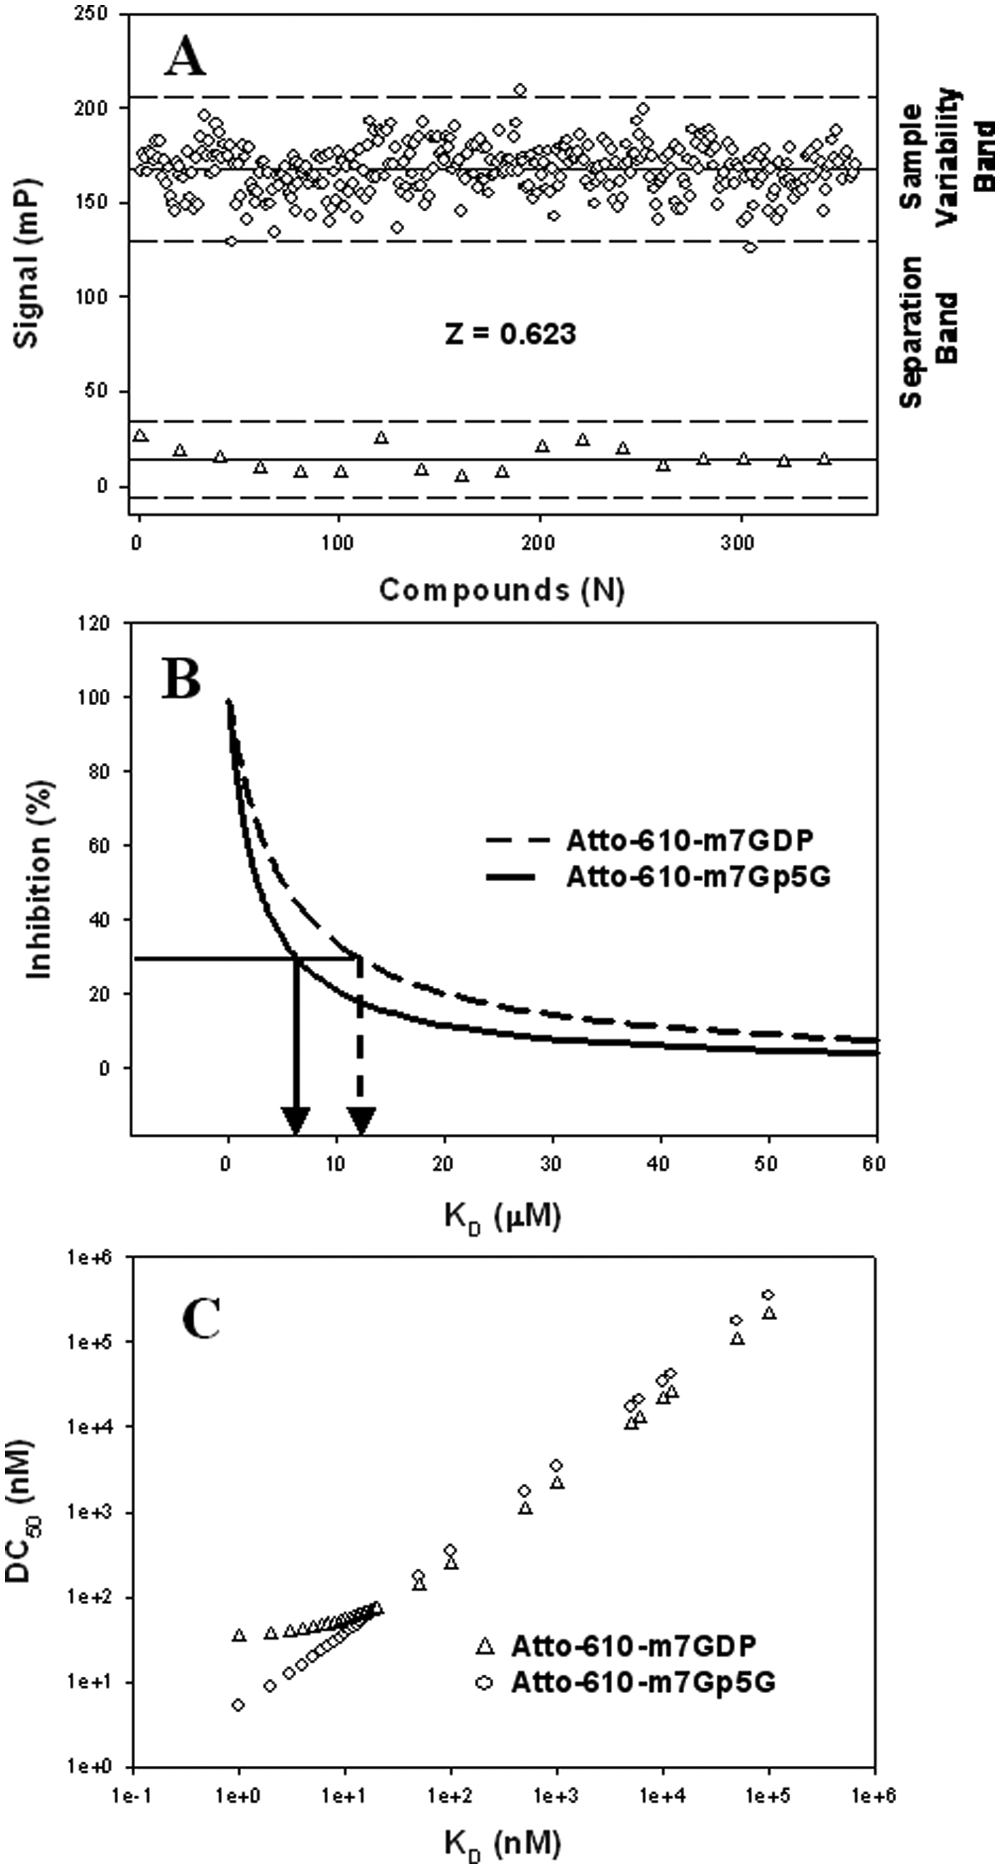
Z determination and simulation studies. (
A simulation study was then performed to define the upper and lower limits of resolvable potency with the two probes.
Figure 2B shows the simulated plot of %I versus KD at a 10-µM compound concentration: 30% displacement was achieved when the compound KD was either 12 µM with Atto-610-m7GDP or 6 µM with the Atto-610-m7Gp5G probe. Therefore, under these conditions, the use of the Atto-610-m7GDP probe would allow the identification of less potent compounds.
According to equation (3), the identification of low-affinity compounds (KD of 12 µM) with the Atto-610-m7Gp5G probe would require protein and ligand concentrations far below 1 nM, with a fraction of ligand bound over the total (f0) of approximately 0.25. Under these experimental conditions, however, the assay would not robustly support a primary screening.
In Figure 2C , the simulated plot of KD versus DC50 is shown: Using the Atto-610-m7GDP probe, all the compounds with a KD lower than 50 nM display a flattened DC50 regardless of their potency. Conversely, using the Atto-610-m7Gp5G probe, the range of resolvable potency is wider, and the DC50s of compounds with KD up to 1 nM might be accurately determined. Indeed, the resolvable inhibitor potency for the high-affinity compounds is estimated to be at the probe Kp—namely, approximately 1 nM for the Atto-610-m7Gp5G probe and 50 nM for the Atto-610-m7GDP probe. 12
According to the prediction reported above, using the probe Atto-610-m7GDP, it is not possible to precisely determine the KD of the highly potent reference compounds m7Gp5G, m7GTP, 7-pCl-Bn-GTP, and Oligo 4. In fact, due to their high affinity with respect to the probe Kp, the data could not be properly fitted, therefore indicating tight binding conditions. Instead, it was possible to accurately determine their KDs with the higher affinity probe Atto-610-m7Gp5G, as shown in Table 2 .
The simulated study is corroborated by the experimental data: As shown in Table 3 , using the Atto-610-m7GDP probe and equation (3) under the selected experimental conditions, it was possible to predict the percentage of displacement of m7GMP and m7GpppC each at two different concentrations. The predicted values ( Table 3 , top) were in agreement with the displacement values determined experimentally in two independent measurements ( Table 3 , bottom).
Simulated and Experimental Data for m7GMP and m7GpppC Using Atto-610-m7GDP Probe
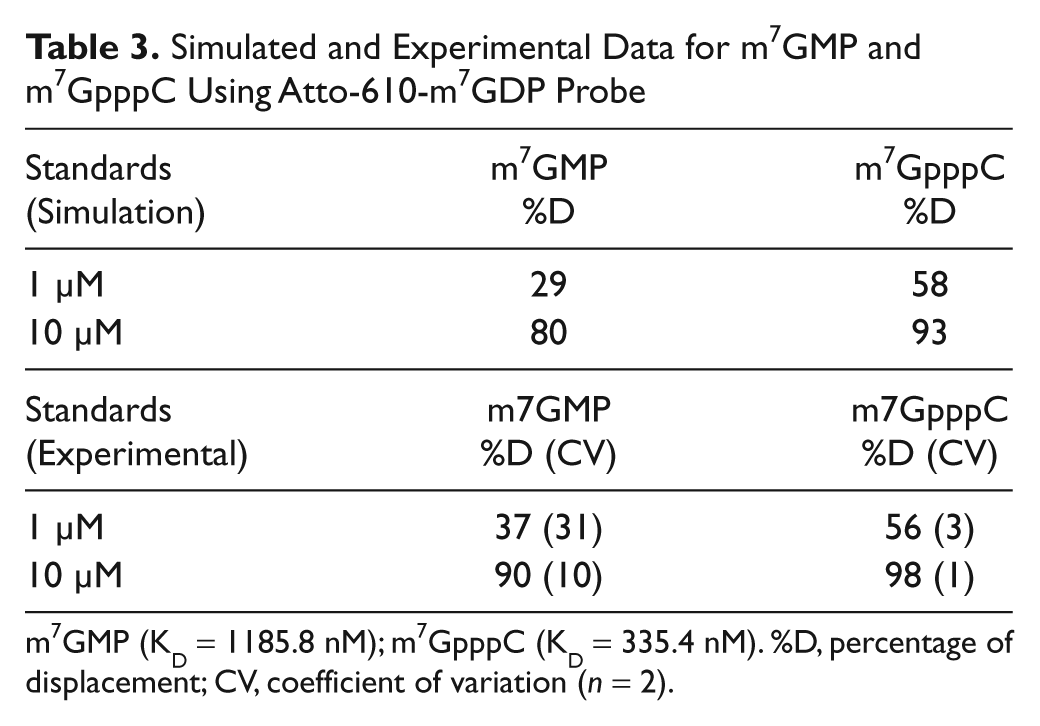
m7GMP (KD = 1185.8 nM); m7GpppC (KD = 335.4 nM). %D, percentage of displacement; CV, coefficient of variation (n = 2).
Assay Performance Using Two Different Probes
Table 4 shows the assay performance of the Atto-610-m7GDP and the Atto-610-m7Gp5G probes. As discussed, the difference in protein concentration reflects the different affinities for the two probes. The f0 was set to similar values for both probes. As shown, the S/B was greater than 4 and the Z′ greater than 0.7 independently from DMSO. Moreover, the signal was stable for at least 180 min.
Experimental Conditions and Statistical Parameter Evaluation for the Assay’s Quality and Robustness with the Two Probes Atto-610-m7GDP and Atto-610-m7Gp5G Used for the Fluorescence Polarization Assays
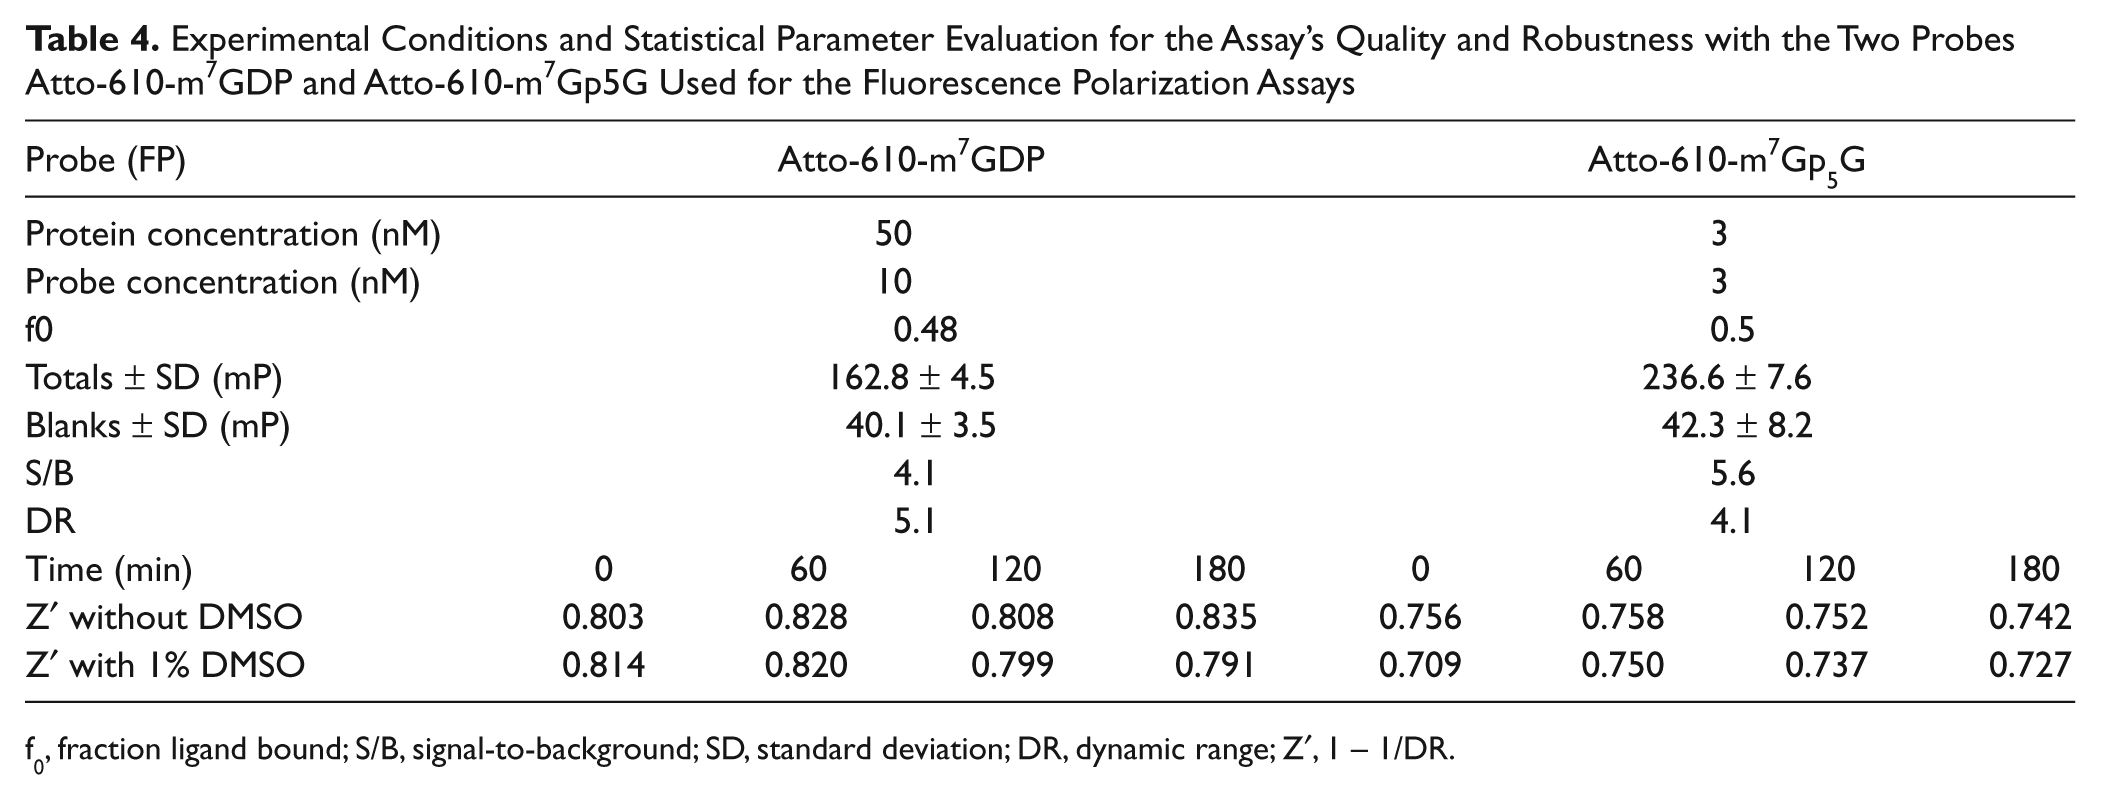
f0, fraction ligand bound; S/B, signal-to-background; SD, standard deviation; DR, dynamic range; Z′, 1 − 1/DR.
Therefore, the two probes have different features: Atto-610-m7GDP should allow the identification of weak inhibitors but not the discrimination of compounds with a potency stronger than 50 nM. Atto-610-m7Gp5G, instead, should better resolve potent compounds but would not highlight over the 30% threshold hits with a KD higher than 6 µM.
The interaction between the eIF4E cap-binding pocket and the cap itself is sustained by polar interactions,17,18,21 features usually not highly represented in chemical drug collections. Therefore, if an unbiased chemical library is being screened, it is reasonable to speculate that the hit rate will be low and the potency of primary hits not very high. Consequently, the primary screening assay has been set up using conditions where the identification of (also) low-affinity binders is feasible. This can be achieved using the Atto-610-m7GDP, low-affinity probe.
The availability of several eIF4E crystal structures will certainly help structure-activity relationships to work once the scaffolds are identified.17,18 Further on in compound development, an assay based on the high-affinity probe Atto-610-m7Gp5G would be more appropriate to support potency refinement.
Feasibility of the FP-Based Assay for CBP80/CBP20
The development of an FP-based assay for the CBP80/CBP20 complex was not feasible because the affinities of the Atto-610-m7Gp5G and Atto-610-m7GDP determined by titration experiments were in the µM range (data not shown). Nevertheless, it was possible to develop an SPR-based assay (see below) that could also be used to determine the KD of the reference compounds m7Gp5G and m7GDP. As shown in Table 1 , these KDs were in the low nM range, suggesting that the affinities of the probes for the CBP80/CBP20 complex determined in the FP assay might be biased by unfavorable interactions and/or steric hindrance caused by the Atto-610 fluorophore moiety.
Development of the eIF4E/4G Secondary SPR-Based Assay
The SPR technique, different from the FP-based assay, uses an oligonucleotide probe, which better mimics the physiological eIF4E/4G binding substrate. Using a Biacore 2000 instrument, it was possible to monitor the direct binding of eIF4E/4G to Oligo 3 immobilized on a streptavidin-coated sensor chip. This RNA oligonucleotide was synthesized and further purified by an anion exchange chromatographic method. This analytical procedure was specifically set up to separate the 5′ capped oligonucleotides from the noncapped analogue. In fact, the purification of mononucleotide and dinucleotide cap analogues was previously reported, but the methylation and subsequent purification directly performed on an oligonucleotide were never described.14,25,26 Thus, a more efficient chromatographic separation was necessary to purify the biotinylated RNA (in this case, 19mer). Given that only a low amount of oligonucleotide was required to prepare an SPR chip, the Oligo 3 could be purified using an anion exchange analytical column instead of a preparative one, improving the chromatographic efficiency. We used an anion exchange column specifically designed for the high-resolution separation of single-stranded nucleic acids (DNAPac PA200). Starting from 48 µg Oligo 3 with an HPLC purity of 70% (UV 260 nm), 8 µg of highly pure (95%) oligonucleotide was obtained. The purified oligos were then used to develop eIF4E/4G SPR-based assays.
In Figure 3A , the interaction between the eIF4E/4G complex and the immobilized Oligo 3 can be seen: This interaction is characterized by rapid binding and release, as previously reported. 27 A standard curve was constructed and then used to determine the protein concentration in solution upon injection of eIF4E/4G in the presence of small capped oligos. The standard curve was obtained by measuring the binding level at steady state as a function of receptor concentration ( Fig. 3B ). Upon inspection of the residual plot of the sensorgrams ( Fig. 3A , bottom) along with the Scatchard plot ( Fig. 3B insertion), it was possible to select the 1:1 Langmuir model as the one with the highest likelihood of eIF4E/4G interaction with the immobilized Oligo 3. No signal decrease was detected when eIFE/4G was injected with the noncapped Oligo 2 (negative control).
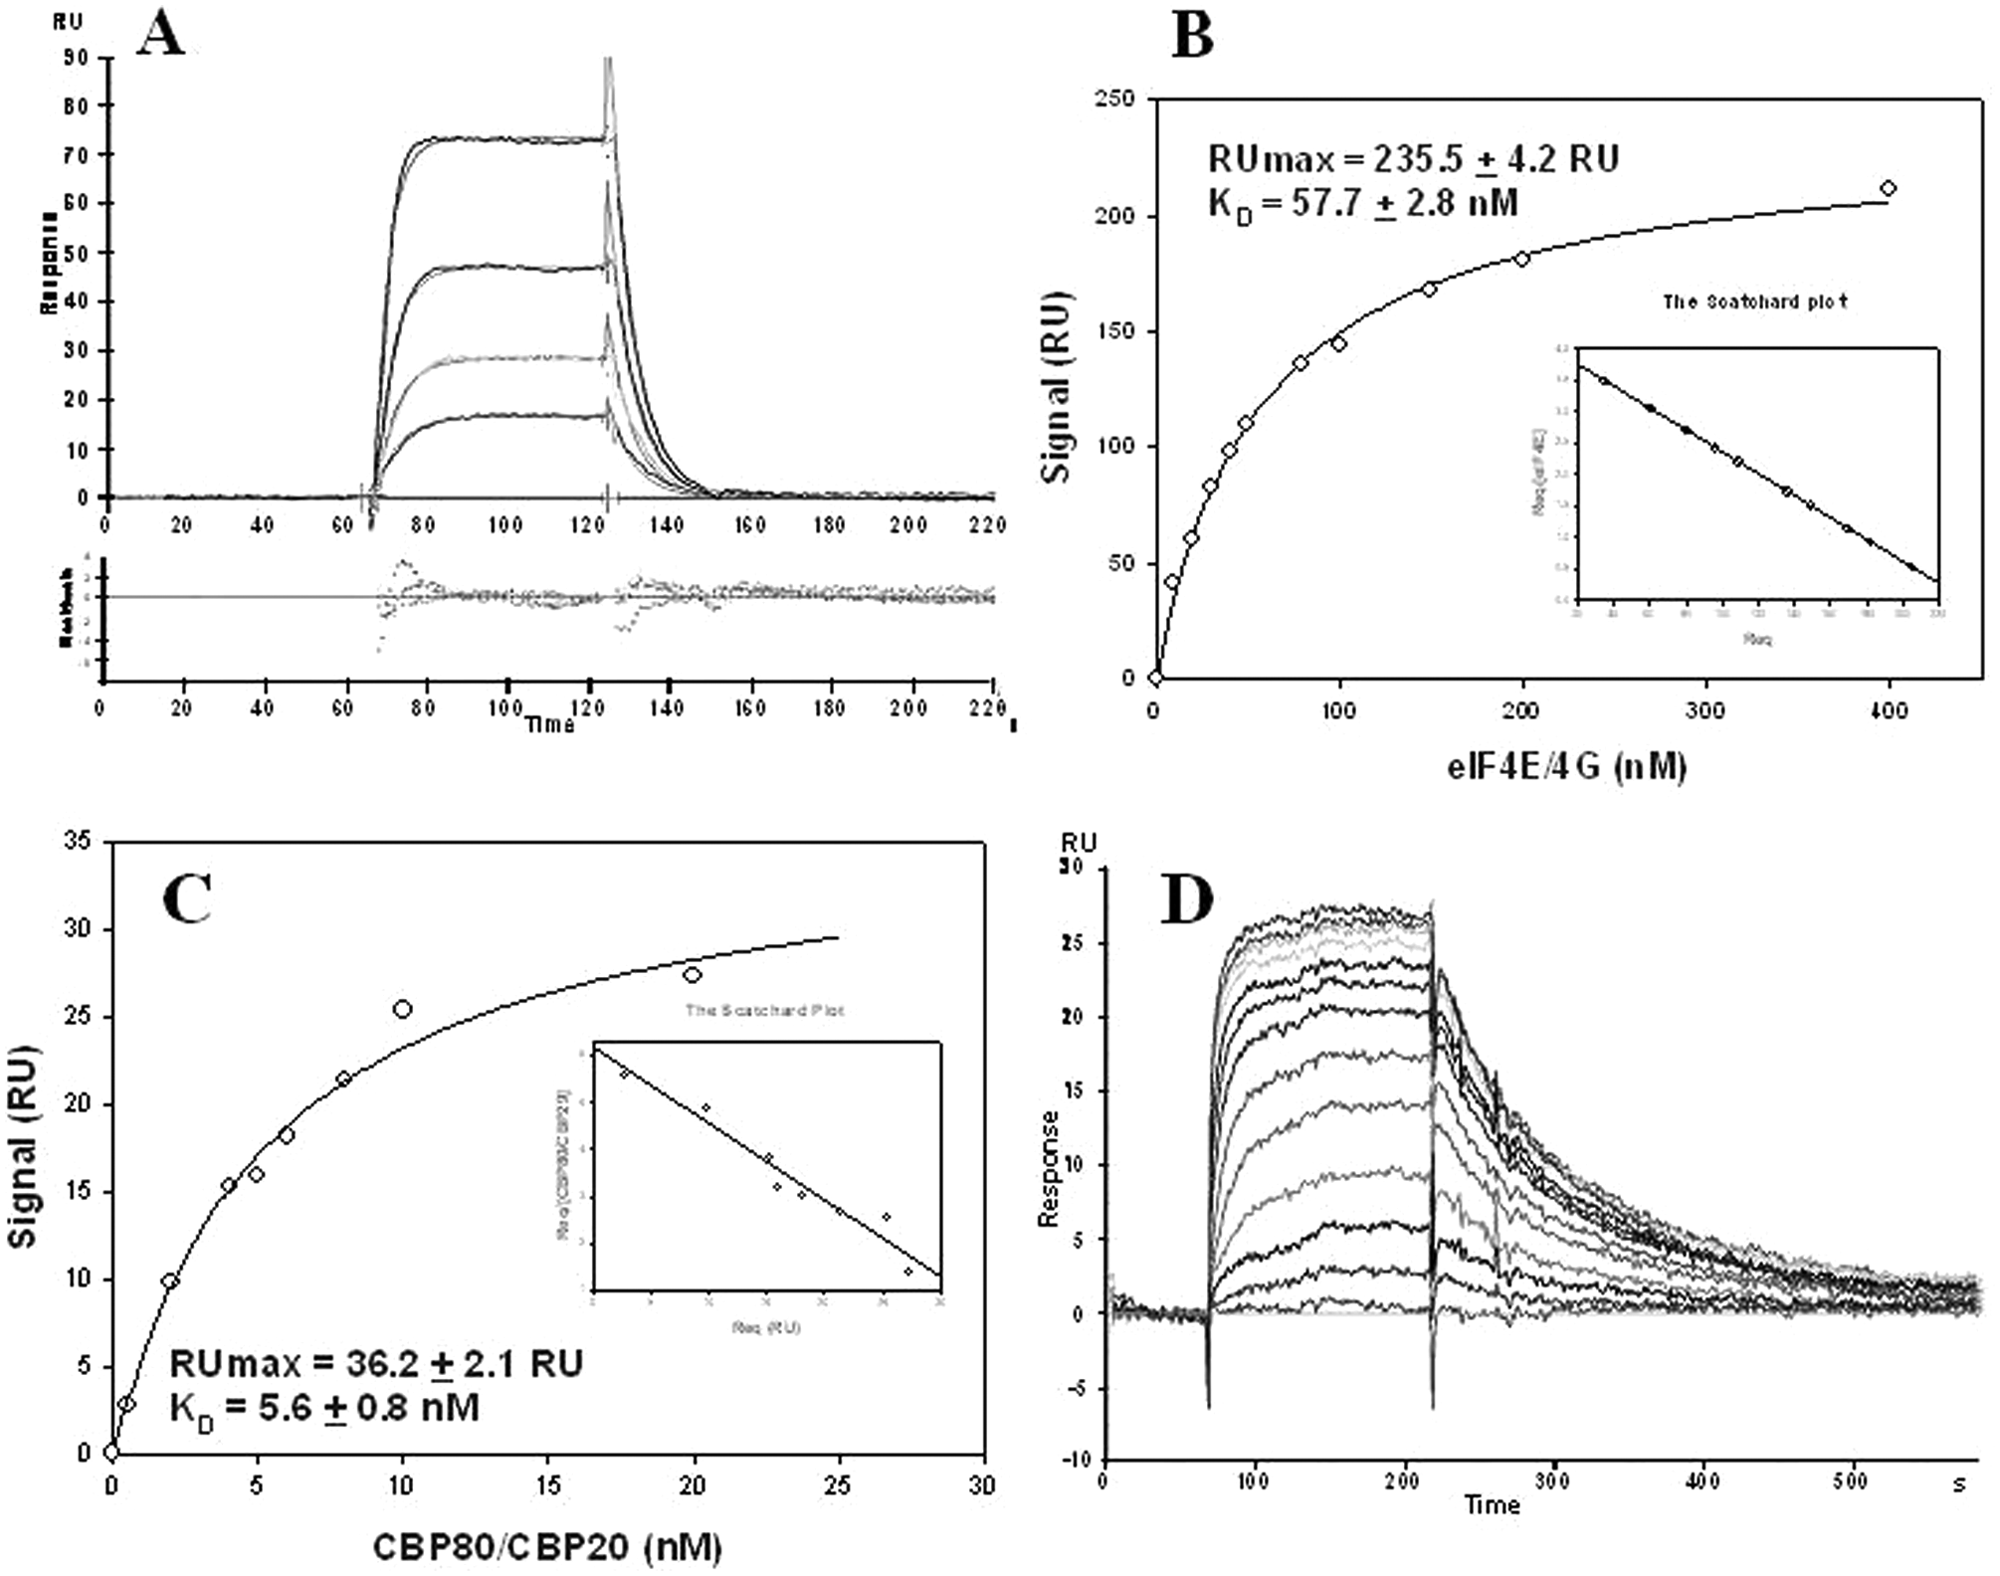
Kinetic and steady-state analysis of eIF4E/4G and CBP80/CBP20. (
Using the SPR technique, three different approaches can be used for KD determination. The steady-state analysis (SS) and the kinetic analysis (K) reflect the interaction of the receptor with the immobilized ligand on the chip surface. The third approach, AIS, reflects the receptor-ligand interaction in solution and uses receptor binding to the immobilized ligand only as a detection system. If the measurement of free eIF4E/4G on the chip surface does not affect the equilibrium in solution, and no additional interactions occur between eIF4E/4G and the chip matrix, the three techniques should measure the same KD.
As shown in Table 1 , however, the KDs determined using the SS analysis or the kinetic analysis were more than 25-fold higher than the dissociation constant determined with the AIS technique.
This discrepancy might be explained by a repulsion effect between the carboxymethylated dextran of the chip surface and the eIF4E/4G complex, both of which are negatively charged at working pH. 28 Using the AIS assay, the repulsion effect should not affect the KD measurement because the equilibrium is measured in solution and the chip surface is used only to detect the free eIF4E/4G.
Interestingly, the KD measured for the non-biotinylated Oligo 4 with the AIS technique is consistent with the KD determined using the homogeneous FP assay ( Table 2 ).
This observation would suggest that the discrepancies among different techniques are probably due to the chip surface–protein electrostatic interactions rather than real differences in affinities.
Should this be the case, one would expect the KDs of other cap analogues determined with the AIS technique to be consistent with the KDs determined with the FP assays.
The KDs of seven cap analogues along with the Oligo 4 were determined using the SPR AIS assay. Indeed, all the values obtained were consistent with those determined with the FP assay ( Table 2 ).
On the whole, the comparison of results obtained with different techniques suggests that adverse electrostatic interactions might interfere with eIF4E binding to cap oligo when this is bound to the chip but not when it is in solution.
For the compounds with very high affinity, a lower protein concentration was used to avoid stoichiometric titration of the competing cap analogue. To assess the KD of the high-affinity compounds, the SPR technique requires a lower protein concentration, exactly like the FP technique requires a lower protein concentration with the shift to the more affine probe Atto-610-m7Gp5G.
The sensorgrams of m7GMP are given in Figure 4 as an example. The evaluation of the binding level was done after subtracting the reference surface and the zero concentration. For each KD determination, at least one concentration of cap analogue was in duplicate. Typically, the compound concentration ranged from 0.03 times KD to 150 times KD. In the insert in Figure 4 , the re-plot of free eIF4E/4G versus m7GMP is reported. Due to the rapid binding and release, the steady state was reached at all concentrations and no regeneration was necessary. The signal was stable after several injections per day for a minimum of 30 days. A good reproducibility was observed when a new chip was prepared (data not shown).
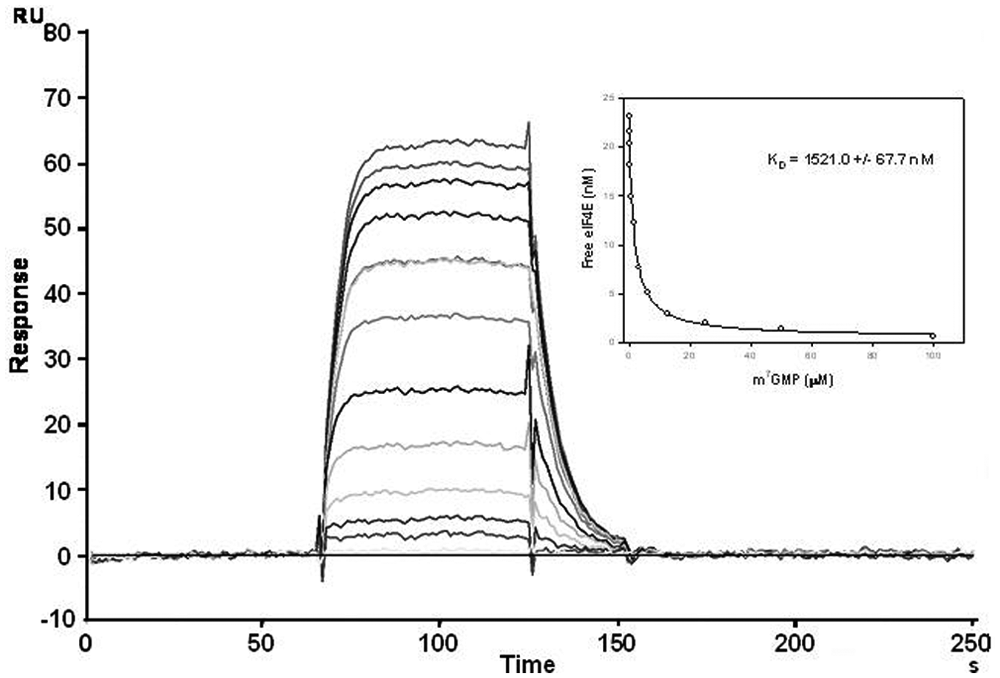
KD determination of m7GMP for eIF4E/4G determined using the surface plasmon resonance assay with the affinity in solution technique. The sensorgrams were generated by injecting constant concentrations of protein with an increasing amount of cap oligo. Using the standard curve reported in Figure 3B , the real protein concentrations in solution were calculated and plotted versus the m7GMP concentrations (see insert).
Cross-Validation of the eIF4E/4G Assays
To cross-validate the FP- and SPR-based assays, the KDs of Oligo 4 and different cap analogues were determined in parallel with the previously described methods. As shown in Table 2 , the calculated KDs are in good agreement among the SPR and the two FP assays as well as with those reported in the literature.9,29
Development of a CBP80/CBP20 Secondary Assay
To develop an SPR-based assay with CBP80/CBP20, we calculated the binding of the complex to immobilized Oligo 3 by measuring the binding level at the steady state after injections of different complex concentrations ( Fig. 3C , KD = 5.6 ± 0.8 nM). A set of sensorgrams is shown in Figure 3D for the KD determination of the compound m7GMP. Unlike the eIF4E/4G, the KD of Oligo 3 at steady state was very similar to the KD of Oligo 4 calculated using the AIS technique, as shown in Tables 1 and 2 . The discrepancy in KDs determined by the different techniques might be a consequence of the electrostatic repulsion between proteins and the negatively charged matrix. Indeed, at pH 7.4, eIF4E/4G (pI 5.8) should have a negative surface charge, whereas CBP80/CBP20 (pI 8.4 and 6.0, respectively) should not. This difference in isoelectric points might explain why the discrepancy in KDs measured at steady state versus AIS was observed only for eIF4E/4G.
In Table 2C , the calculated CBP80/CBP20 KDs for different methylated cap analogues are reported. Interestingly, despite having a similar affinity for m7GTP, the two proteins show different specificity for other tested compounds. For example, 7-pCl-Bn-GTP displays an affinity 100-fold greater for eIF4E/4G than for CBP80/CBP20, whereas m7GpppG shows a 20-fold higher affinity for CBP80/CBP20 than for eIF4E/4G. These data fit with structural observations 24 indicating differences in the cap-binding pockets of the two proteins.
Therefore, the SPR-based assays described above provide a method to select and develop compounds that specifically inhibit eIF4E/4G.
Discussion
This work describes the development and validation of FP- and SPR-based assays to monitor the interaction between eIF4E and the cap structure.
Two probes with different affinities for eIF4E were evaluated and their range of sensitivity toward inhibitor potency was defined.
The primary screening aims at the identification of compounds that hit eIF4E with a broad range of potency and likely include weak inhibitors. Therefore, the use of the Atto-610-m7GDP probe, which is sensitive to weaker inhibitors, should increase the chances of success. Hits with high affinity for eIF4E will need to be further characterized with the Atto-610-m7Gp5G-based assay, due to the more favorable lower end limit of resolvable inhibitor potency of this probe.
Affinity data for the more interesting compounds can then be assessed with the SPR assays using both eIF4E/4G and the CBP80/CBP20 complexes.
The assay for CBP80/CBP20, based on the SPR technique, will allow the selection of inhibitors specifically directed against eIF4E and that do not interfere with CBP80/CBP20 complex function.
In summary, different assays were developed not only to sustain HTS for the identification of eIF4E inhibitors but also to further refine them up to very potent compounds. As previously reported in the literature and also confirmed by our experiments, the affinity of eIF4E for capped mRNA is in the low nM range, thus requiring cap-competitive inhibitors to be extremely potent.
eIF4E-specific inhibitors are expected to be effective anticancer agents in a number of human tumors. However, no small-molecule inhibitors targeting the eIF4E cap-binding pocket with cellular activity have been described so far. 30 This article provides the tools for the identification and development of eIF4E cap competitors that do not interfere with the housekeeping function of CBP80/CBP20.
Footnotes
Acknowledgements
We thank Jan Malysko for oligonucleotides synthesis, as well as Nilla Avanzi and Luisa Rusconi for helpful discussion and manuscript reading.
The authors declared no potential conflicts of interest with respect to the research, authorship, and/or publication of this article.
The authors received no financial support for the research, authorship, and/or publication of this article.
References
Supplementary Material
Please find the following supplemental material available below.
For Open Access articles published under a Creative Commons License, all supplemental material carries the same license as the article it is associated with.
For non-Open Access articles published, all supplemental material carries a non-exclusive license, and permission requests for re-use of supplemental material or any part of supplemental material shall be sent directly to the copyright owner as specified in the copyright notice associated with the article.