
Abstract
The development of cell-free high-throughput (HT) methods to screen and select novel lead compounds remains one of the key challenges in G protein-coupled receptor (GPCR) drug discovery. Mutational approaches have allowed the stabilization of GPCRs in a purified and ligand-free state. The increased intramolecular stability overcomes two major drawbacks for usage in in vitro screening, the low receptor density on cells and the low stability in micelles. Here, an HT fluorescence polarization (FP) assay for the neurotensin receptor type 1 (NTS1) was developed. The assay operates in a 384-well format and is tolerant to DMSO. From a library screen of 1272 compounds, 12 (~1%) were identified as primary hits. These compounds were validated in orthogonal assay formats using surface plasmon resonance (SPR), which confirmed binding of seven compounds (0.6%). One of these compounds showed a clear preference for the orthosteric binding pocket with submicromolar affinity. A second compound revealed binding at a nonorthosteric binding region and showed specific biological activity on NTS1-expressing cells. A search of analogs led to further enhancement of affinity, but at the expense of activity. The identification of GPCR ligands in a cell-free assay should allow the expansion of GPCR pharmaceuticals with antagonistic or agonistic activity.
Keywords
Introduction
G protein-coupled receptors (GPCRs) represent the largest superfamily of integral membrane proteins in the human genome. 1 These seven-helical-transmembrane receptors transduce extracellular signals to trigger an intracellular response and are therefore involved in many intracellular signaling and regulatory processes. The physiological relevance and exposed location of GPCRs at the boundary of the cell brings them into focus as highly attractive targets for drug discovery campaigns. 2 However, the poor biophysical properties of GPCRs, their limited natural abundance, and their low intrinsic stability when isolated from the cellular environment still present major challenges for this target class. As a consequence, the number of techniques to study GPCR interactions with their ligands are limited. Whole-cell screening, cell membrane preparations, or vesicle-based approaches are all excellent strategies to preserve GPCR stability and integrity in an environment close to the natural one, but these systems often lack sufficient receptor levels for ligand screening experiments, especially with the typical initial low-affinity hits found in high-throughput screening (HTS).
The original approaches in industry to GPCR screening campaigns mainly relied on radioactivity-based assays, such as the scintillation proximity assay (SPA). 3 Although widely used and well established, such assays have serious drawbacks regarding cost-effectiveness, radioactive waste creation, and effective handling of expensive reagents, especially the SPA beads. During the last decade, fluorescence-based screening techniques have started to provide a low-cost and simple nonradioactive alternative. Among others, assays based on fluorescence polarization (FP) enable the detection of two binding partners in homogeneous solution, one of which is fluorescently labeled, and this assay is especially suitable when the molecular weight difference between the ligand and receptor is large. 4 Upon binding of a fluorophore-labeled ligand to its interaction partner, the effective molecular radius of the fluorophore ligand increases, as it is now complexed to the receptor, resulting in a slower intramolecular tumbling rate. The emitted light of the fluorophore complex retains more intensity in the polarization plane, whereas the unbound fluorophore ligand emits less polarized light due to rapid tumbling. Consequently, the detection of the polarization intensities of a fluorophore–ligand conjugate in the presence and absence of its cognate receptor serves as a direct measurement of the bound fraction of a ligand. In addition, it is straightforward to use such an assay principle for competition binding experiments, thus allowing measurements of the binding of nonlabeled ligands and identification of new interaction partners in a screening format.
The application of FP assays in HTS campaigns against a variety of protein targets, 5 including GPCRs,6,7 has already been demonstrated. However, the lack of appropriate fluorescent probes and the narrow dynamic range due to relatively low receptor densities after expression, unspecific binding events, and intrinsic cell fluorescence have hampered the utilization of FP-based HTS campaigns for GPCRs. 8 Recent breakthroughs in the molecular engineering of GPCRs 9 opened up new avenues for in vitro analysis of this protein class with biophysical methods by generating receptor variants with significantly increased expression yields and stability in solubilized and purified form.
The neurotensin receptor type 1 (NTS1) belongs to GPCR subfamily A (rhodopsin-like receptors) and binds the neurotransmitter neurotensin (NTS), a 13-amino-acid peptide, which acts as a natural agonist and is distributed throughout the central nervous system. 10 Although NTS1 is involved in several diseases, including hypothermia, inflammation, cancer, addiction, and Parkinson’s disease,11–13 cell-based screening approaches have yet to improve the availability of small-molecule entities specifically targeting NTS1. 14 Recently, the generation of stabilized and purified NTS1 receptor forms suitable for screening studies has been optimized through various rounds of directed evolution, leading to the isolation of highly stable and soluble receptor mutants.15–18 Crystal structures of several agonist-bound mutants, generated by directed evolution, revealed that the mutations do not influence the known orthosteric binding pocket of NTS1. 19 This makes the generated NTS1 receptor variants ideal protein reagents for in vitro applications such as FP-based HTS in order to identify novel agonists and antagonists of this important target.
Here, we describe the development of a cell-free HT FP assay to detect novel small-molecule binders of the GPCR NTS1. We selected the NTS1 mutant NTS1-H4 17 as a proof-of-concept receptor due to its superior stability in detergent and the ready availability of a fluorescently labeled peptide agonist of neurotensin (NTS). Competition binding experiments with known NTS1 ligands were carried out to optimize the assay for 384-well HT format and determine relative compound binding affinities. A competitive HT-compatible pilot screen was performed using a subset of the Library of Pharmacologically Active Compounds (LOPAC 1280). Competitive binding hits from the FP measurements were validated in an orthogonal in vitro assay based on surface plasmon resonance (SPR). Confirmed hits were further characterized for downstream signaling activity in cells expressing the NTS1 wild-type receptor.
Materials and Methods
Materials
Tris and DMSO were obtained from Carl Roth GmbH + Co. KG (Karlsruhe, Germany). NaCl, SR142948, and LOPAC 1280 were obtained from Sigma-Aldrich Chemie GmbH (Munich, Germany). The detergents dodecyl-β-
NTS1 Expression Construct
The rat NTS1 variant, NTS1-H4, was expressed in Escherichia coli, as described previously.
20
NTS1-H4 was N-terminally truncated at amino acid E44 and at G390 at the C-terminus, where it was fused via a glycine–glycine–glycine–serine (GGGS)6 linker to an Avi-tag. Amino acids E273-T290 of intracellular loop 3 were deleted and the two potential free cysteines, C386 and C388, at the C-terminus of the receptor were both mutated to alanine to facilitate protein purification and subsequent experiments without perturbing signaling functionality of NTS1-H4. E. coli cells harboring NTS1-H4 were grown overnight at 37 °C in 1 L of 2YT medium supplemented with 1% (w/v) glucose and 100 µg/mL ampicillin. A fermenter (Bioengineering D558, Wald, Switzerland) containing 50 L of 2YT, 0.5% (w/v) glucose, and 100 µg/mL ampicillin was inoculated using the entire 1 L preculture and grown to an OD600 of 2.5 at 37 °C. Receptor expression was induced with 1 mM isopropyl-β-
NTS1 Purification
To purify the receptor, 25 g of frozen E. coli pellet was thawed and resuspended at room temperature in 50 mL of solubilization buffer, containing 100 mM HEPES, pH 8.0, 20% (v/v) glycerol, and 400 mM NaCl. All the following steps were carried out at 4 °C. A half milliliter of 1 M MgCl2 (5 mM), 2 mg of DNase I, 200 mg of lysozyme, and 20 mL of a detergent mixture composed of 0.2% (w/v) cholesteryl hemisuccinate Tris salt (CHS) and 2% (w/v) DDM were added to the resuspended cell pellet. The mixture was incubated for 30 min, followed by cell lysis via mild sonication for 30 min in an ice-water bath. After cell lysis, 0.4 mL of 5 M imidazole was added and the mixture was incubated for another 30 min. The suspension was centrifuged for 30 min at 28,000 rcf. The supernatant was mixed with 5 mL of TALON resin (Clontech, Mountain View, CA), which had been preequilibrated with IMAC binding buffer (25 mM HEPES, pH 8.0, 10% [v/v] glycerol, 600 mM NaCl, 0.3% [w/v] DDM, and 15 mM imidazole) and incubated for 2 h on a rolling device. Subsequently, the mixture was loaded into an empty PD10 column (GE Healthcare, Uppsala, Sweden), which was then washed with 50 mL of IMAC binding buffer. Elution of bound protein was performed with 15 mL of IMAC elution buffer containing 25 mM HEPES, pH 8.0, 10% (v/v) glycerol, 150 mM NaCl, 0.3% (w/v) DDM, and 250 mM imidazole. Five hundred microliters of 1.6 mg/mL HRV 3C protease was added to the elution and incubated for 1 h at 4 °C, followed by addition of 250 µL of 10% (w/v) MNG-3 and incubation for 1 h at 4 °C. The cleaved protein was diluted threefold with SP binding buffer (10 mM HEPES, pH 7.0, 10% [v/v] glycerol, and 0.01% [w/v] MNG-3) and was loaded onto a PD10 column containing 2.5 mL of sulfopropyl (SP) Sepharose beads (Sigma-Aldrich) preequilibrated with SP binding buffer. The resin was washed with 15 mL of SP binding buffer, followed by 12.5 mL of SP wash buffer (10 mM HEPES, pH 7.7, 10% [v/v] glycerol, 35 mM NaCl, and 0.01% [w/v] MNG-3) and 2 mL of SP binding buffer. NTS1-H4 was eluted with 12 mL of SP elution buffer (10 mM HEPES, pH 7.0, 10% [v/v] glycerol, 350 mM NaCl, and 0.01% [w/v] MNG-3). Eluted receptor was concentrated in an Amicon-15 Ultra concentrator with a 50 kDa cutoff (Millipore, Billerica, MA) to a final volume of less than 1 mL. Concentrated NTS1-H4 was subjected to preparative size exclusion chromatography using a Superdex 200 10/300 GL column (GE Healthcare), which had been preequilibrated with 10 mM HEPES, pH 8.0, 150 mM NaCl, and 0.01% (w/v) MNG-3. Peak fractions corresponding to NTS1-H4 were pooled (final volume 3–4 mL) and concentrated in an Amicon-4 Ultra concentrator with a 50 kDa cutoff to a final protein concentration of approximately 50 µM. Purified and concentrated NTS1-H4 was mixed with 10 mM HEPES, pH 8.0, 150 mM NaCl, 0.01% (w/v) MNG-3, and 50% (v/v) glycerol to yield a final glycerol concentration of 25%. Aliquots of 10–100 µL were frozen in liquid nitrogen and stored at −80 °C for later usage.
FP Assay Development
A concentration series of NTS1 receptor was incubated in the presence of 5 nM labeled peptide (NTS8-13–HiLyte647) in assay buffer containing 20 mM Tris, pH 8.0, 150 mM NaCl, and 0.01% (w/v) MNG-3 to determine a suitable receptor concentration. In order to assess the effect of DMSO on the assay readout, solvent concentrations ranging from 0% to 3% (v/v) were tested. Binding competition was tested at increasing concentrations of the truncated natural receptor agonist (NTS8-13) and a receptor antagonist (SR142948) in the presence of 12.5 nM NTS1 and 5 nM NTS8-13–HiLyte647 (competition assay format). FP was detected for all experiments after 1 h of incubation at 25 °C and 80% humidity on an EnVision Multimode reader (PerkinElmer, Waltham, MA) using a Cy5 FP-Filter set. Based on the emission data, FP values were calculated for each well. FP values are expressed in units of milli-P (mP), where P = (F|| – F⊥)/(F|| + F⊥). For the final assay configuration, automated liquid dispensing (MultiDrop Combi, Thermo Fisher Scientific, Waltham, MA) was used to reduce the total assay volume from 20 µL to 10 µL per well.
HT-Compatible FP Competition Assay
For screening of the LOPAC set, compounds were transferred to black, 384-well, low-volume plates using an Echo 555 (Labcyte, San Jose, CA) liquid handler. Each compound was tested in duplicate at a final concentration of 10 µM and 1% (v/v) DMSO in the assay buffer. NTS1 receptor (12.5 nM final concentration) and NTS8-13–HiLyte647 (5 nM final concentration) were dispensed with a MultiDrop Combi Reagent Dispenser and incubated for 60 min at 25 °C and 80% humidity in the presence of compound, control 1% (v/v) DMSO (vehicle control), or 100 nM SR142948 (positive control). Five nanomol of HiLyte647 (10 µL/well) or 5 nM labeled peptide (NTS8-13–HiLyte647, 10 µL/well) were included as additional controls in all assay plates. Data were processed with ActivityBase (IDBS, Guildford, UK) and were normalized against signals of the control wells (vehicle and positive control). Z′ values were calculated, 21 where Z′ describes the relation of the separation between positive and negative controls and their spreads according to Z′ = 1 – (3σp – 3σn)/|μp – μn|, where σ is the standard deviation, μ is the mean, and subscripts p and n denote positive and negative controls, respectively. A Z′ factor greater than 0.5 represents an optimal difference between positive and negative controls, below 0.5 is still an acceptable ratio, whereas a Z′ factor less than 0 constitutes signal overlap of the positive and negative controls.
The most potent and pharmacologically interesting compounds from the primary screen were tested in 11-point dose–response studies (four replicate wells per condition). Dose–response curves were fitted using a sigmoidal four-parameter fit and pIC50 values were determined (GraphPad Prism, GraphPad Software, San Diego, CA).
SPR Screening
The best-performing compounds were investigated in an orthogonal approach using SPR. All SPR measurements were performed on a BiacoreT100 instrument (GE Healthcare) at 20 °C. A CMD500L chip (XanTec, Düsseldorf, Germany) was prepared according to the manufacturer’s instructions. For receptor immobilization, a 50 µg/mL neutravidin solution in 50 mM MES, pH 5.0, was used. The receptor was then captured by neutravidin via the in vivo biotinylated C-terminal Avi-tag in running buffer (50 mM Tris, pH 7.4, 150 mM NaCl, 0.1% [w/v] DDM, 2% DMSO), achieving 2000–3000 RU. NTS1 integrity and binding activity after coupling were verified by injections of a mutated NTS8-13 peptide comprising two alanine mutations at positions 11 and 12, with previously determined binding characteristics. 22 All compounds were initially screened at concentrations of 50 µM in duplicates. Screening was performed against immobilized apo-receptor and a blank reference surface. Ligand association was monitored over 60 s and dissociation over 300 s at a flow rate of 50 µL/min. Measurements were double-referenced and processed with Scrubber2 software (BioLogic Software, Campbell, Australia). After visual inspection of the binding curves, seven compounds were chosen for further evaluation in dose–response experiments with concentrations ranging from 0.04 to 10 µM on free and blocked receptor surfaces. Blocking of the orthosteric NTS1 binding site was achieved by preinjections of 200 nM NTS8-13 (agonist) or 200 nM SR14948 (antagonist); both are high-affinity binders with remarkably slow off-rates. 22
Functional Assays
For functional assays, HEK293 cells, stably expressing rat NTS1 wild-type, were produced using the HEK293 T-Rex Flp-In cell system (Thermo Fisher Scientific). Cells were cultured in Dulbecco’s modified Eagle’s medium (DMEM) supplemented with tetracycline-free 10% fetal calf serum (FCS). NTS1 expression was induced by addition of 1 µg/mL tetracycline to the medium. After 24 h, cells were harvested and signaling activity was measured in 384-well plates with competitive homogeneous time-resolved fluorescence (HTRF) assays for cyclic AMP (cAMP) using the cAMP Dynamic 2 kit, and for inositol-1 phosphate (IP1) (a metabolite of inositol trisphosphate [IP3]) using the IP-One TB assay kits (both from Cisbio, Codolet, France), according to the manufacturer’s instructions. The truncated peptide agonist NTS8-13 and the small-molecule antagonist SR142948 served as assay controls.
Search for Analogs
Two of the profiled compounds served as a source for the identification of structural analogs: compound 06 (loratadine) and compound 08 (eprosartan mesylate). Respective SMILES strings were identified and profiled on the public access database ZINC (http://zinc15.docking.org/). 23 Using the Tanimoto coefficient, 24 a set of compounds based on structural similarity to compounds 06 and 08 were determined. The final set included analogs with a Tanimoto coefficient ranging from 1 to 0.67 for compound 06 and from 1 to 0.6 for compound 08, which corresponds to a structure similarity between 100 – 67% and 100 – 60%, respectively. From these identified compounds, five analogs (four based on 06 and one from 08) were chosen for an additional round of experimental analysis in FP, SPR, and functionality assays.
Results
FP Assay Development
To determine the amount of NTS1-H4 receptor needed for an adequate FP signal window, a broad range of receptor concentrations were tested at constant NTS ligand concentrations. An NTS1 concentration of 12.5 nM in the presence of 5 nM NTS8-13–HiLyte647 resulted in an FP signal increase by ~50 mP compared with negative controls, which represented an acceptable assay window for HT studies. To evaluate the specificity of the NTS1/NTS8-13–HiLyte647 interaction, nonlabeled NTS8-13 (agonist) and SR142948 (antagonist) were added as competitors to fixed concentrations of NTS1 (12.5 nM) and labeled NTS8-13 peptide (5 nM). Both agonist and antagonist competed with the labeled ligand and the FP signal was reduced to baseline (~180 mP) at the highest added concentrations ( Suppl. Fig. S1 ). Calculated IC50 values for the unlabeled NTS8-13 and SR142948 were 4.5 ± 0.1 nM and 11.3 ± 0.2 nM, respectively. To exclude any subsequent effects of the conventionally used solvent DMSO on signal quality, the measurements were repeated in the presence of 0%–3% (v/v) DMSO. The FP signal showed no change at DMSO concentrations up to 3.0%. Overall, the assay was compatible with HTS requirements ( Suppl. Fig. S1 ).
FP Assay Screening
Based on the benchtop assay configuration, an NTS1 competition assay protocol was developed for semiautomated screening with SR142948 (at 100 nM, 1% DMSO final) as positive control and DMSO (1% v/v) as the vehicle/negative control. The LOPAC (1272 compounds) was screened for potential interaction with NTS1-H4. Screening was performed in duplicates for each compound and the duplicates were positioned on different assay plates ( Fig. 1 ). In order to assess data quality, Z′ values were calculated for all assay plates using the screening software ActivityBase. Z′ values were between 0.33 and 0.52, slightly higher than previously reported values of an NTS fluorescein-based HT assay. 25
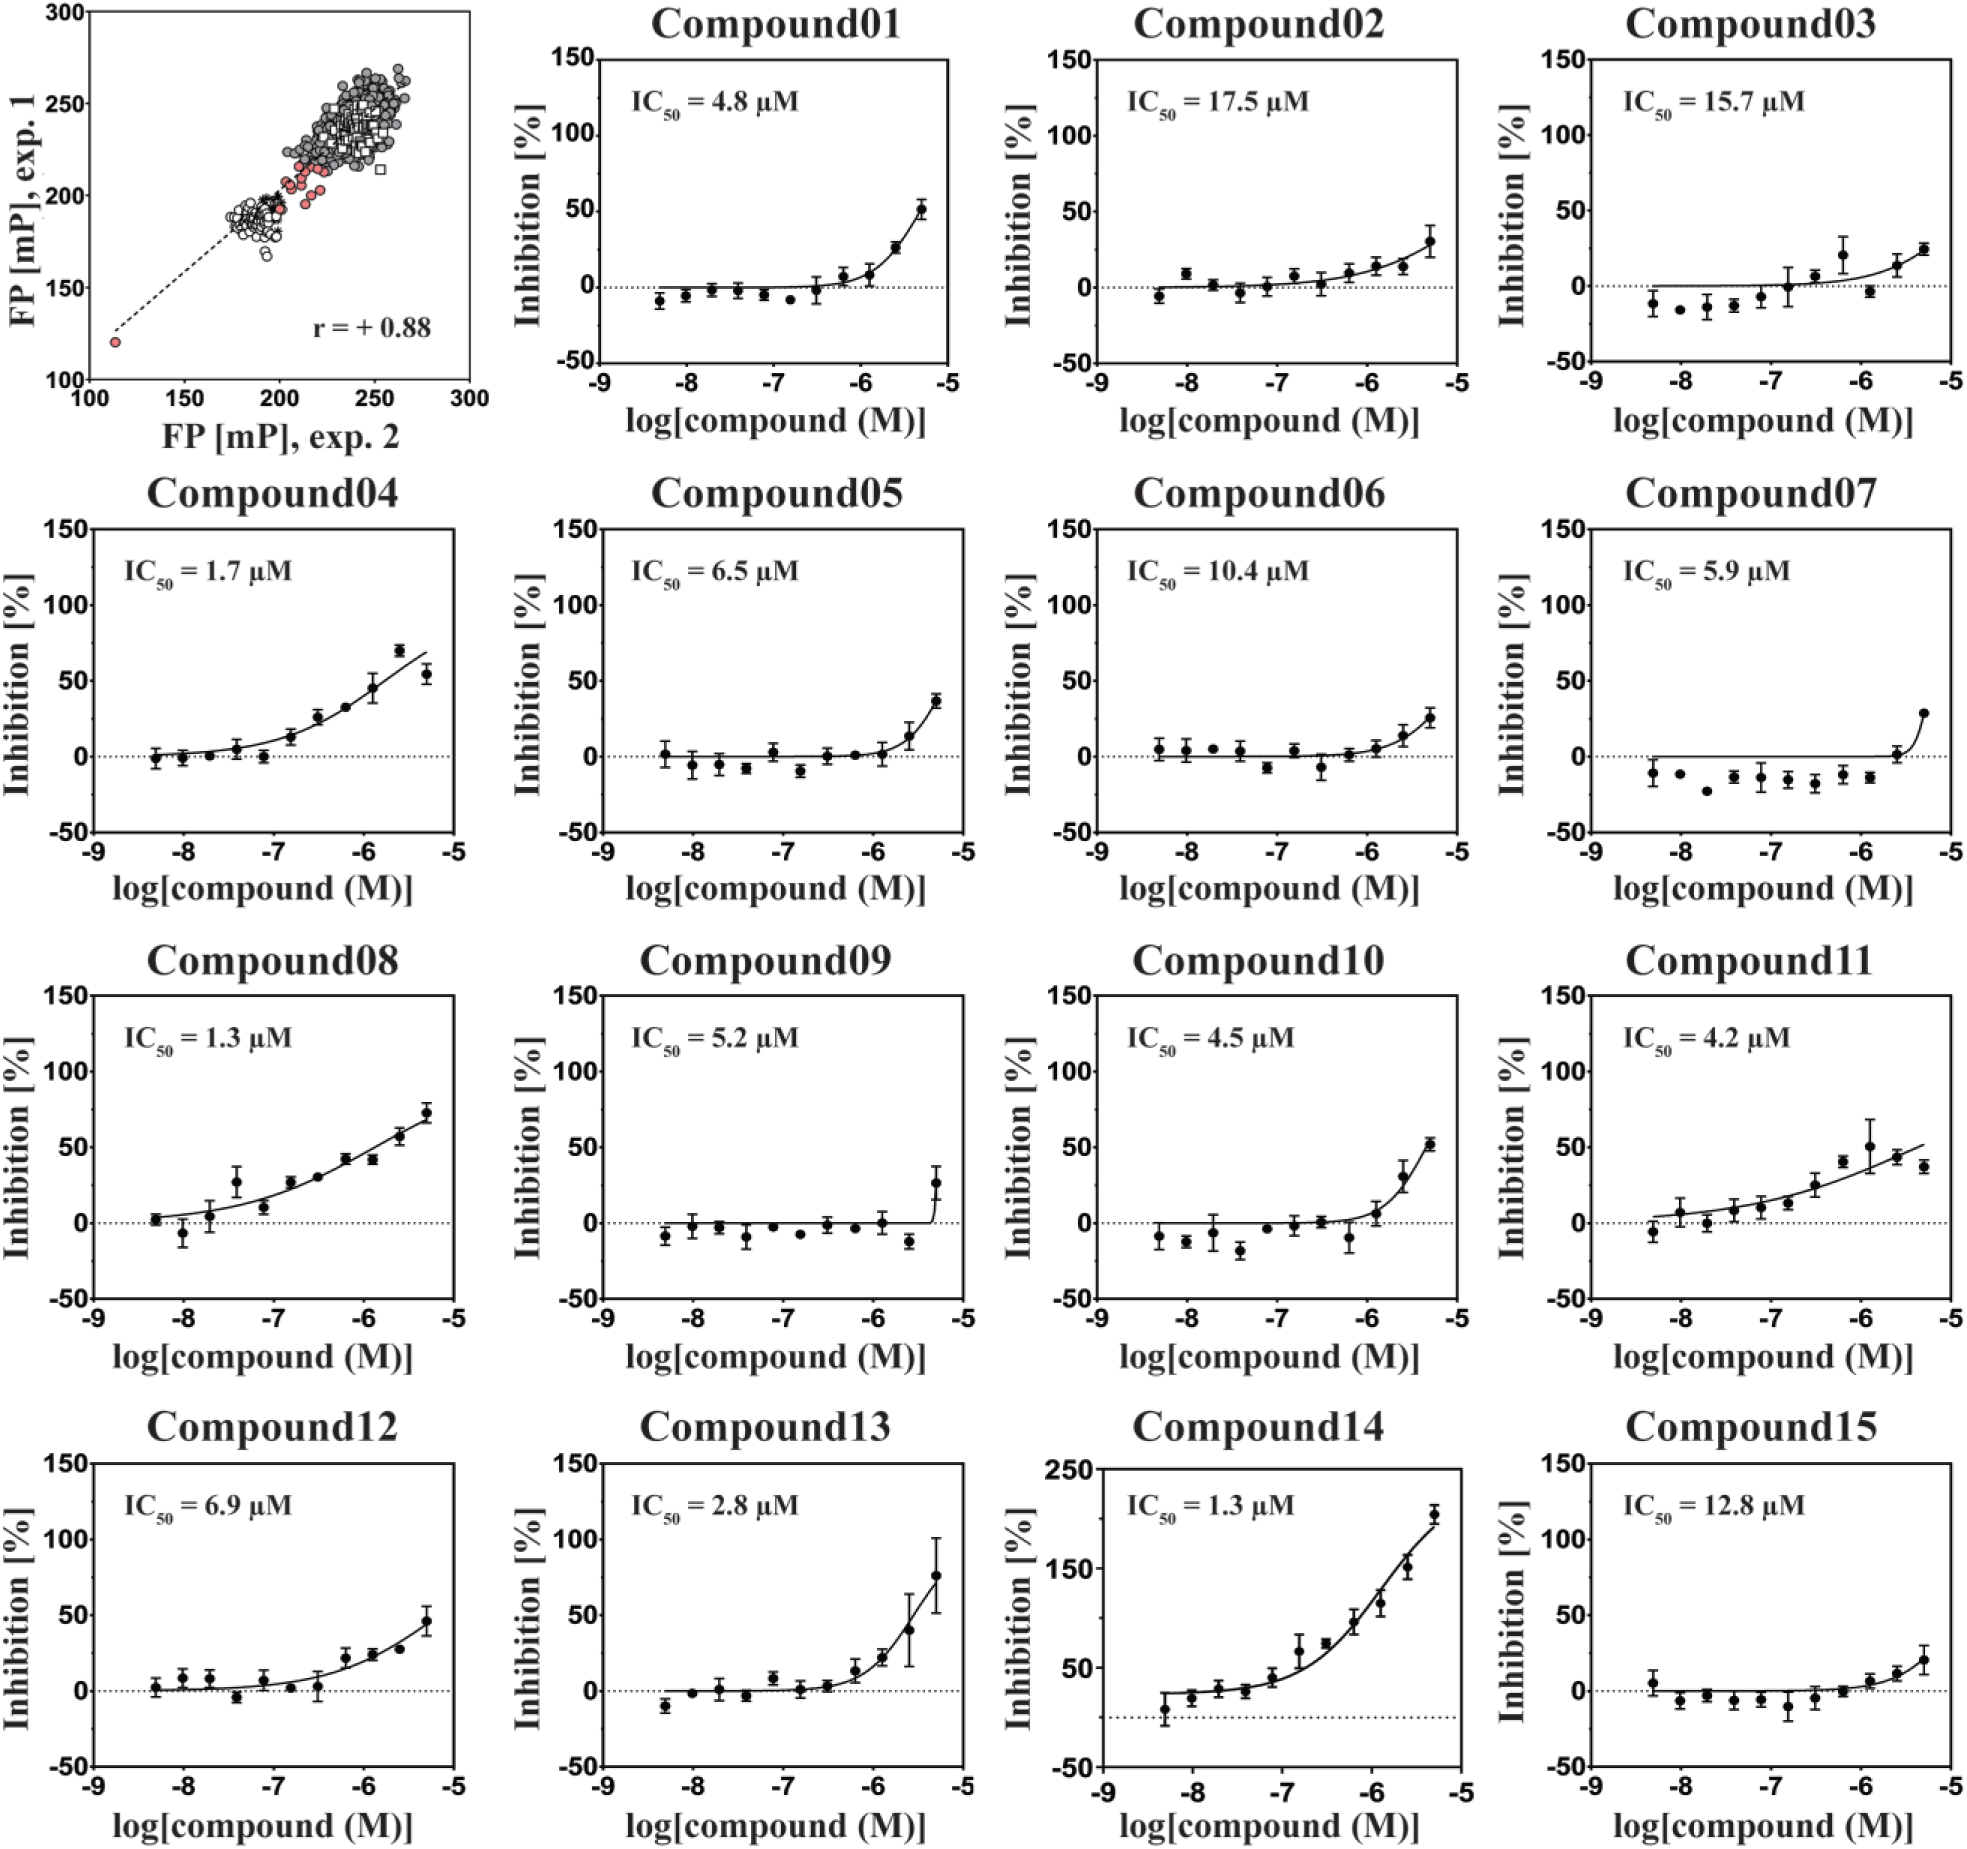
Results of the FP screen against NTS1. Upper left panel: A subset of the LOPAC was tested in duplicates at a concentration of 10 µM (filled circles); each axis depicts one replicate. The following controls were included on all assay plates: DMSO (vehicle control, □) and SR142948 (positive control, ○). As reference, several wells containing only HiLyte647 (✸) were also included. Fifteen candidates were chosen based on their inhibition potencies in the primary screen (filled red circles) (see text for selection criteria). Pearson’s correlation coefficient r between the two experiments was calculated with GraphPad Prism. Other panels: Dose–response studies of the chosen compounds were measured in titration curves up to a 10 µM concentration. Data points represent the mean ± SEM from duplicate measurements. Curves were fitted using a four-parameter fit in GraphPad Prism.
Each of the plates used for screening contained 16 negative (GPCR + NTS8-13–HiLyte647) and 16 positive (GPCR + NTS8-13–HiLyte647 + SR142948) control wells. The average FP values of the positive and negative control wells (n = 64; 4× plates in total) were 236 ± 7 and 186 ± 5 mP, respectively, thus resulting in a screening window of up to 50 mP. Furthermore, the average inhibition from compound duplicates was calculated and a compound was assigned as a hit when the FP value dropped to <205 mP, corresponding to a potential inhibition of NTS8-13–HiLyte647 binding by >50%. When applying such a threshold, 12 compounds could be identified, which resulted in a hit rate of 0.9%. In total, 12 compounds with inhibition above 50% and a further 3 compounds with FP inhibition between 35% and 50% were selected for dose–response analysis. The highest compound concentration in dose–response experiments was 10 μM. For most of the tested compounds, this concentration was not high enough to achieve full inhibition of the NTS8-13–HiLyte647 binding and consequently the dose–response curves were not always fully defined ( Fig. 1 ).
SPR Screening and Hit Conformation
Selected hits were evaluated in an orthogonal screening using SPR with the same NTS1 variant, NTS1-H4. 22 After immobilization of NTS1-H4 and during the screening procedure, receptor integrity was monitored by injections of an NTS8-13 peptide variant (NTS8-13_A11,A12), which could be eluted due to its lower affinity compared with the wild-type peptide. 22 All putative NTS1 FP screen hits were initially tested in duplicates at a concentration of 50 µM against the immobilized NTS1-H4 receptor. A blank reference without any immobilized protein was included in all SPR experiments to assess nonspecific surface interactions. The single-concentration SPR studies confirmed 8 of the 15 hits (compounds 02, 03, 04, 06, 08, 13, 14, and 15), and these were progressed to dose–response analyses. KD values were calculated with a kinetic fit using both a 1:1 Langmuir binding model and equilibrium analysis ( Fig. 2 , Suppl. Fig. S2 ). A broad range of affinities was found for the tested compounds, spanning from 0.8 µM up to 40 µM. In some cases, determined KD values are considered only as estimates of binding affinity since saturation of binding could not be achieved at the applied compound concentrations ( Suppl. Fig. S2 ). Concentrations higher than 10 µM resulted in a pronounced shift of the SPR response, most likely due to compound aggregation effects. For four compounds, reliable KD values could be determined (compounds 03, 08, 13, and 15), of which compounds 08 and 15 showed the strongest binding affinity with KD values of around 0.9 µM. For three compounds, only approximate KD values could be estimated (02, 06, and 14), and for the remaining compound (04), a KD could not be determined. The experimental data for the analyzed compounds are summarized in Figure 3 .
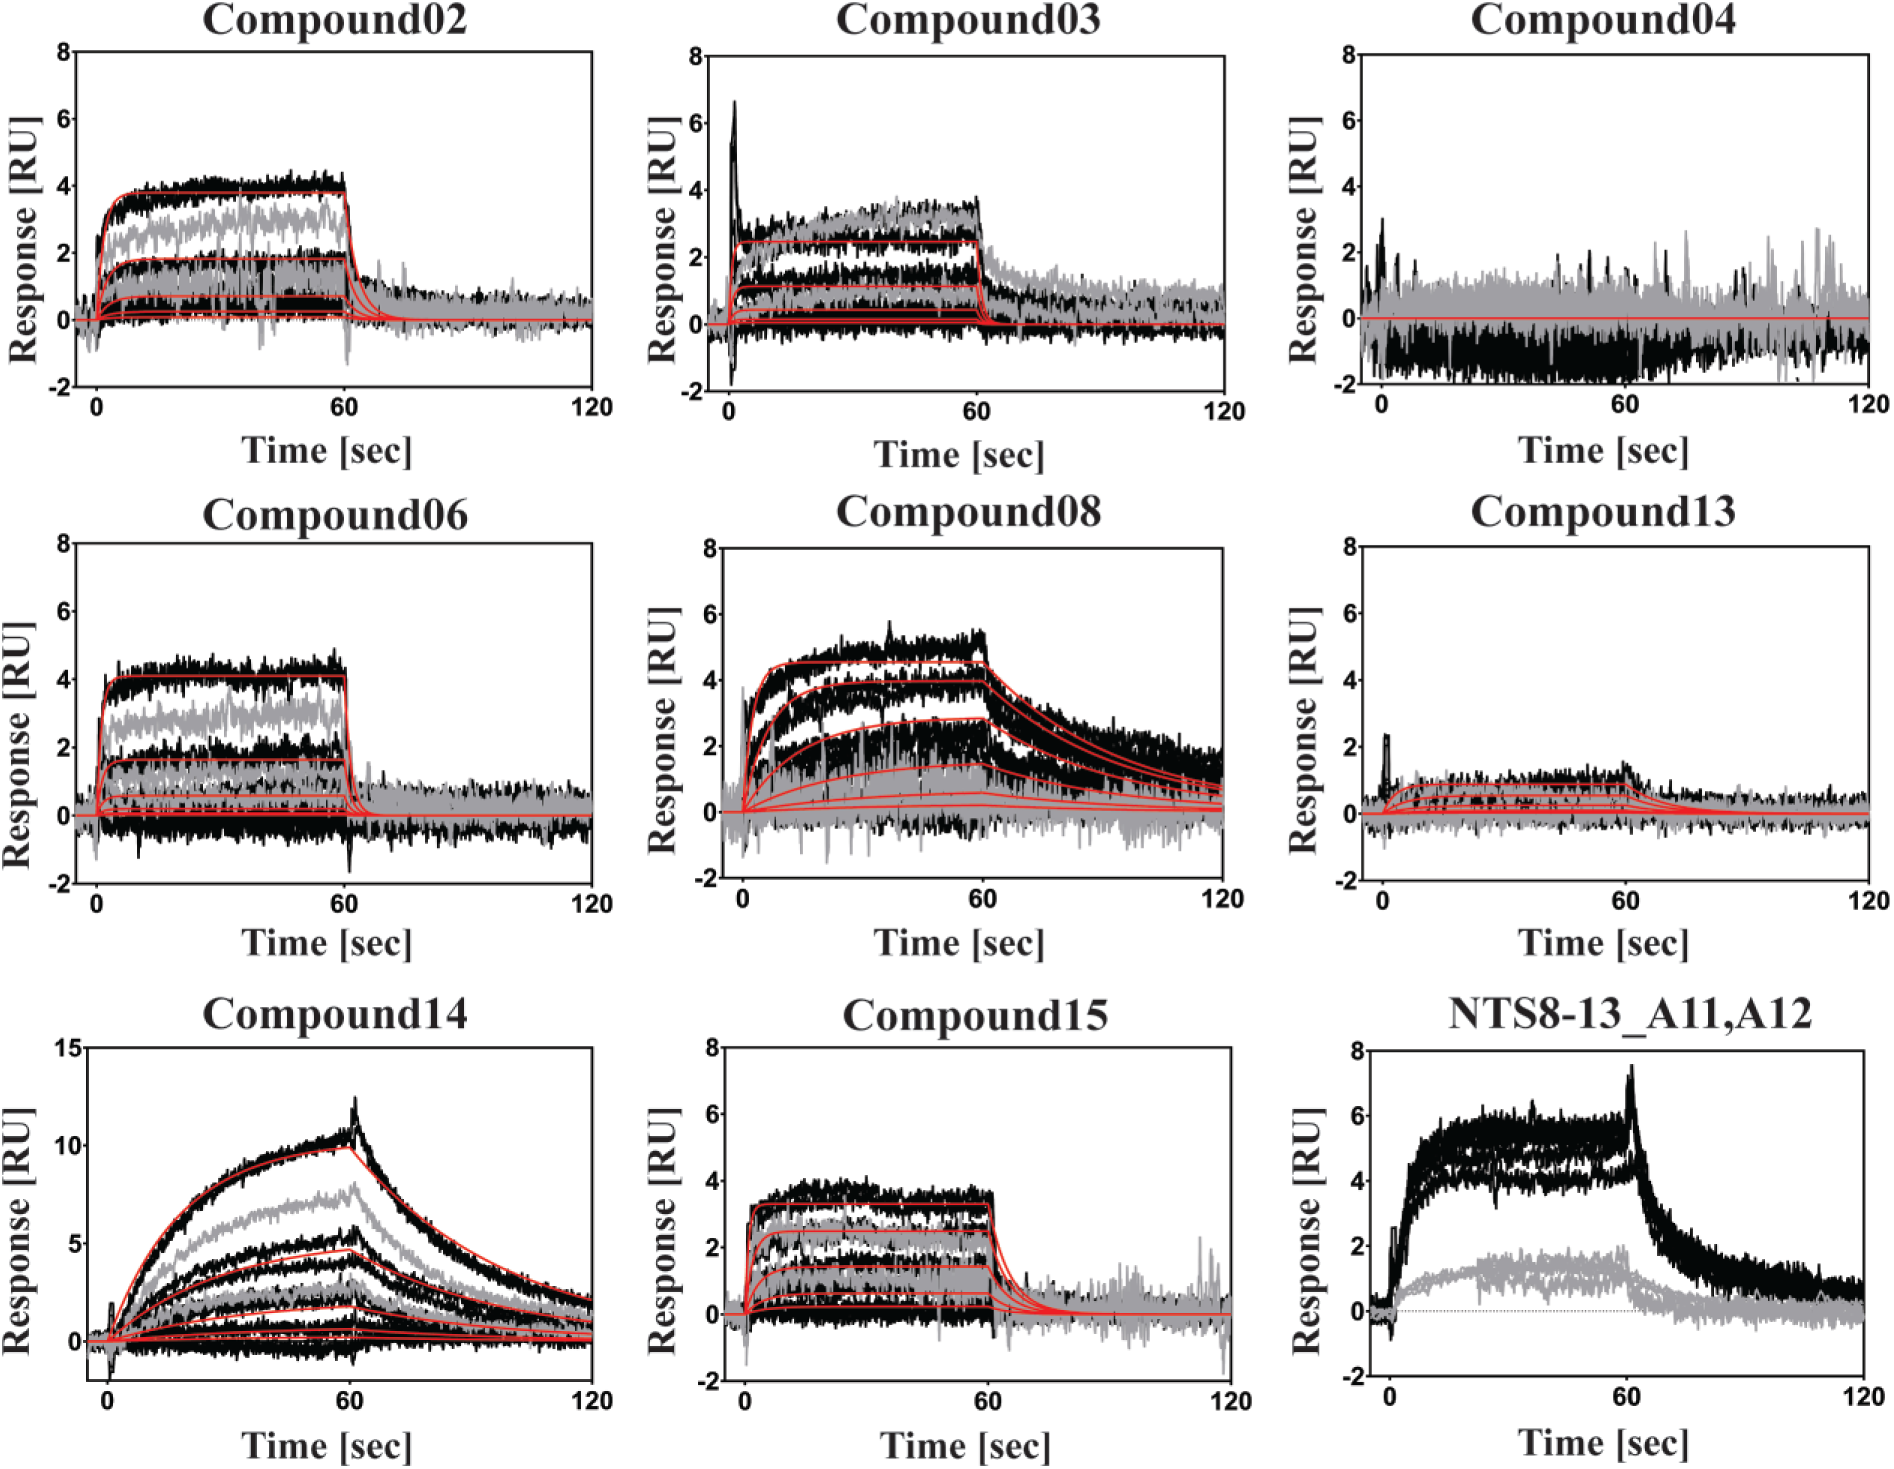
SPR kinetic binding data for compounds 02, 03, 04, 06, 08, 13, 14, and 15, with and without competition by a tight-binding orthosteric ligand. Black curves represent the titration series of each compound in duplicates on a free receptor surface. Red lines represent kinetic fits using a 1:1 Langmuir binding model. Grey curves represent the three highest concentrations as single injections on an agonist-blocked (NTS8-13) receptor surface. Lower right panel: The peptide NTS8-13_A11,A12 served as the control for blocking and the integrity of the surface over time. The peptide (200 nM) was injected between each titration series before blocking (black curves) and after blocking (grey curves).
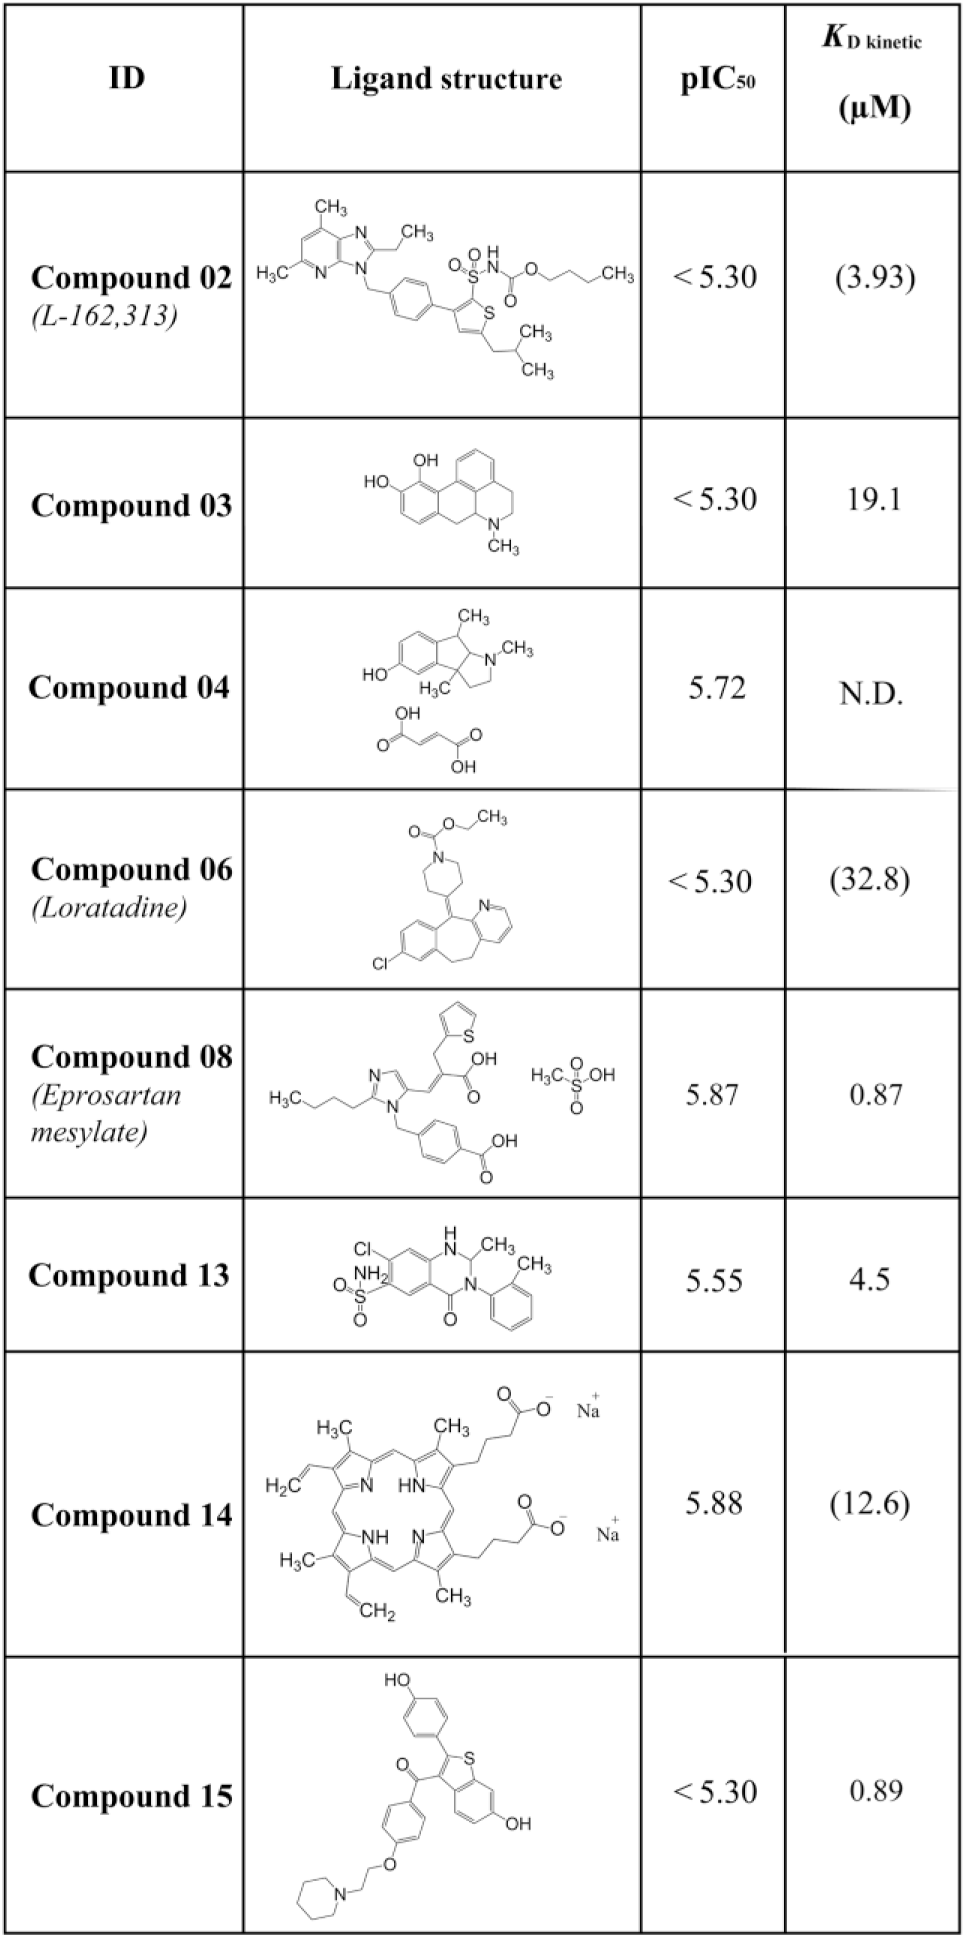
Summary of measured FP and SPR data. The figure shows all binding compounds with their screening name (ID), molecular structure, pIC50 values, and KD values calculated from a kinetic fit using a 1:1 Langmuir binding model or equilibrium-based analysis. Compounds without any binding or inhibition are marked with N.D. Values in parentheses are estimates that correspond to compounds showing no saturation at the concentrations that could be reached.
SPR Competition Screening
SPR-based competition binding assays were performed to determine the potential specificity of the compounds for the orthosteric binding pocket of the NTS1 receptor. For this purpose, dose–response experiments with the three highest concentrations of soluble compounds were repeated in the presence of a preblocked binding pocket. Blocking was accomplished by injecting an excess of agonist (truncated peptide NTS8-13) or antagonist (SR142948) before each injection of compound. Both controls NTS8-13 and SR142948 bind orthosterically, and a recent study has shown that their competitive behavior can be seen in SPR. 22 Injections of the low-affinity NTS8-13 derivative NTS8-13_A11,A12 confirmed completeness of blocking as no binding of NTS8-13_A11,A12 was observed after treatment of the receptor with either NTS8-13 or SR142948. All tested compounds showed almost identical binding behavior in the NTS- and SR-blocked measurements ( Fig. 2 , Suppl. Fig. S3 ) with the exception of compound 08, which shows a complete loss of binding on both blocked receptor surfaces. The remaining six compounds (compounds 02, 03, 06, 13, 14, and 15) showed very similar binding responses on both blocked and unblocked receptor surfaces. This observed RU signal at the blocked surface suggests that binding does not occur at the orthosteric pocket. Compound 04 showed no binding at all.
Functional Activity on Mammalian Cells
A potential effect of identified hit compounds on intracellular signaling was assessed in functional assays using HEK293 cells stably expressing the rat NTS1 wild-type. The NTS1 receptor is known to elicit intracellular responses mainly via G proteins Gq and Gs.26,27 Stimulation of these pathways can be measured by changes either in the level of IP1 (a metabolite of IP3) for Gq or in the level of cAMP for Gs. Both pathways are known to be activated by the natural peptide NTS, which preferentially stimulates the Gq pathway. The signal stimulation of each compound for the Gq- and Gs-mediated pathway was measured at a single concentration of 100 µM. To test for unspecific signaling (independent of NTS1), compounds were tested in parallel on parental HEK293 cells without NTS1 gene integration (control cells). NTS8-13 and SR142948 served as controls for agonistic and antagonistic functionality.
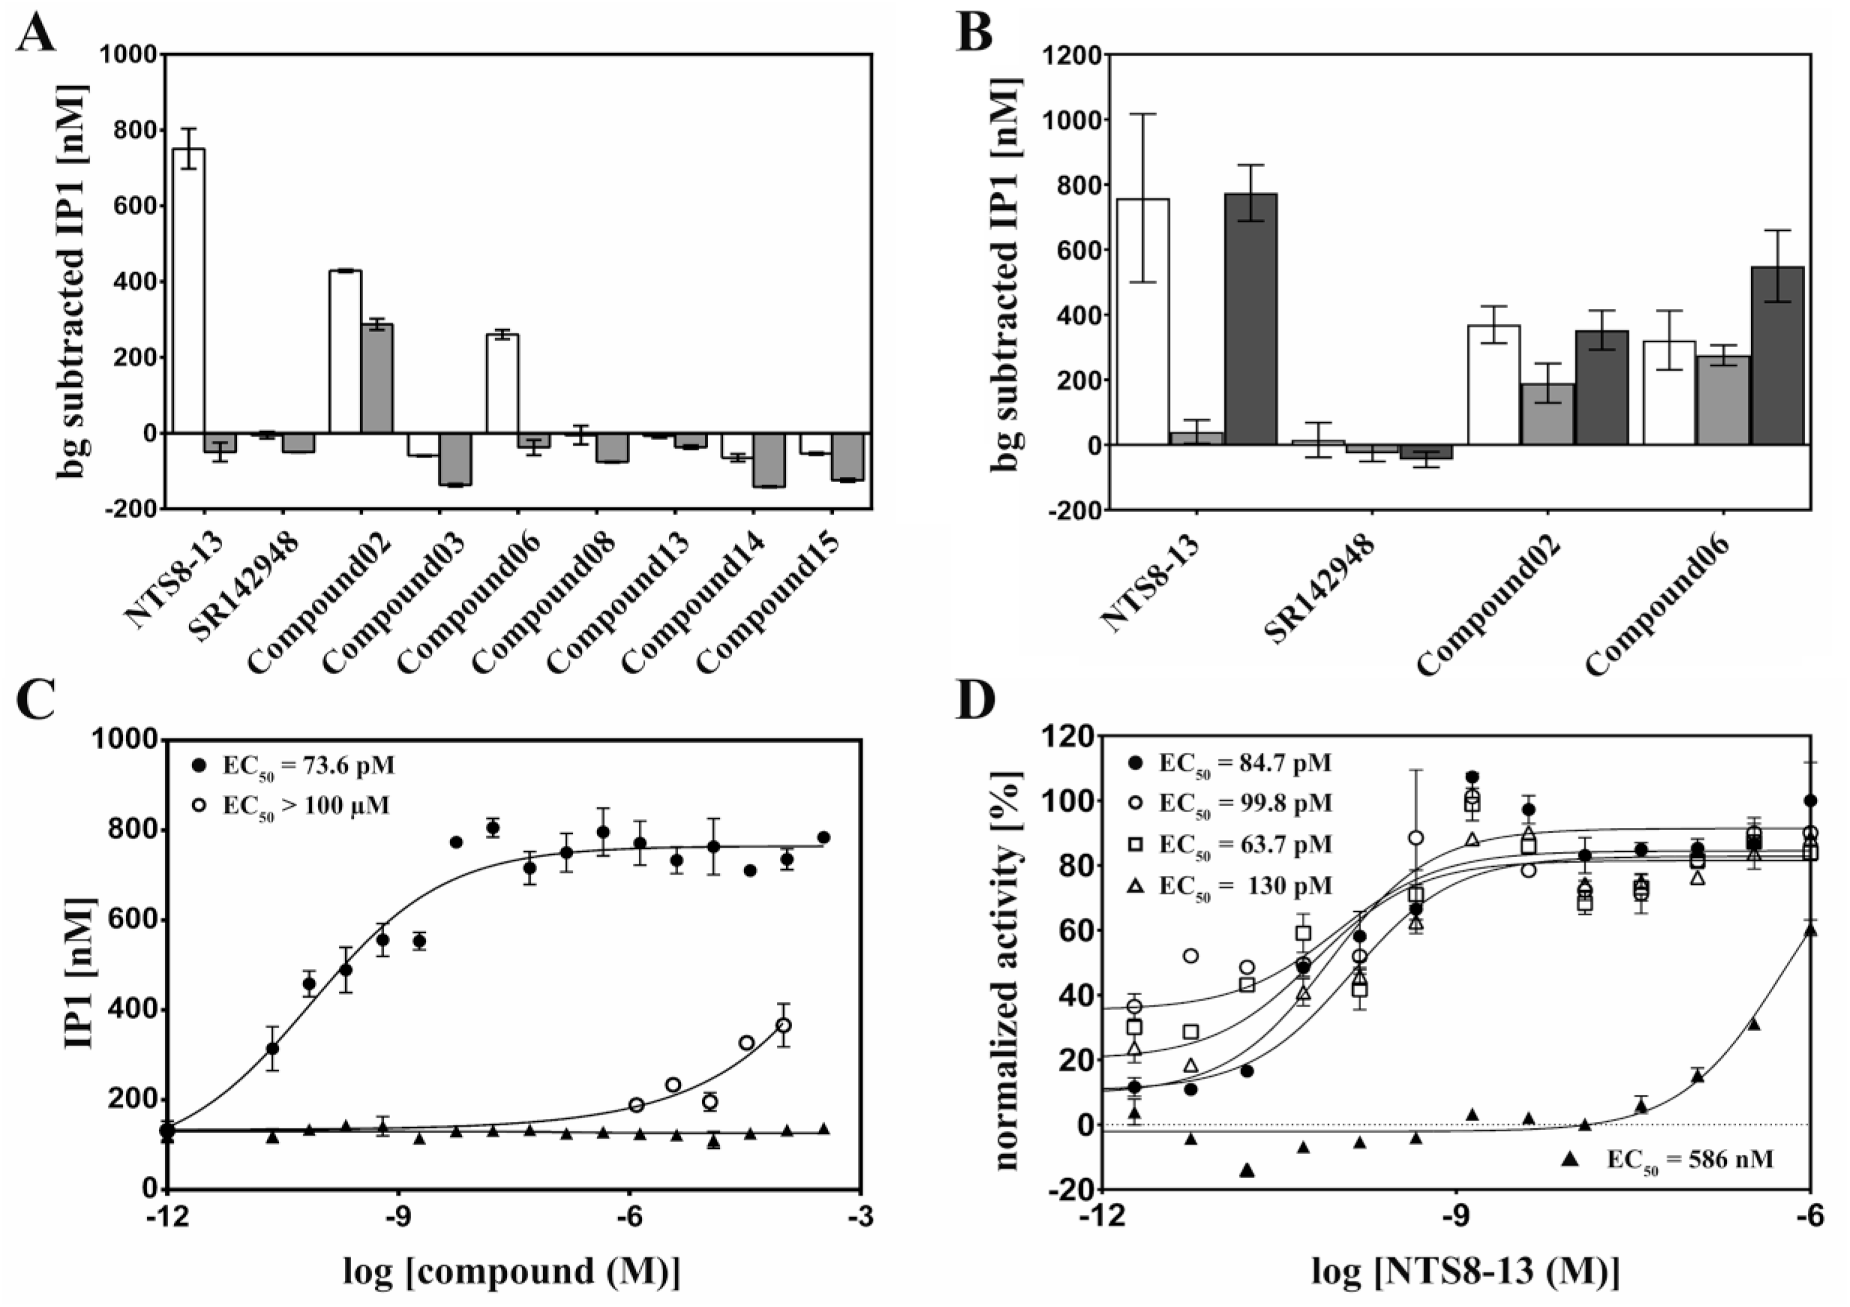
Two compounds (compounds 02 and 06) resulted in increased IP1 levels, pointing toward activation of the Gq pathway ( Fig. 4A ). Not surprisingly, both compounds are not as effective as the positive control NTS8-13. Compound 02 triggers levels of 450 nM IP1 and compound 06 levels of 300 nM IP1, thus achieving half or one-third of the NTS18-13 level (800 nM), respectively, and they have to be applied at substantially higher concentrations (100 μM) than the native peptide agonist (1 µM).
Functional assays on cells. (
In the case of compound 02, a small increase of IP1 level (300 nM) was detected in the control cells as well ( Fig. 4A , grey bars), whereas compound 06 displayed agonistic activity of the Gq pathway only on cells with expressed NTS1 receptor. Interestingly, none of the initially selected compounds displayed an increased level of intracellular cAMP level at the measured concentration. Thus, none of them appear to stimulate signaling via the Gs pathway ( Suppl. Fig. S4 ). To exclude any cell line-specific effects, the experiments stated above were repeated using CHO cells. All measurements with CHO cells stably expressing rat NTS1 wild-type showed identical signaling results as observed for HEK293 cells (data not shown).
An orthosteric or possibly allosteric activity of the compounds was investigated by competitive assays. For this purpose, the functional activity of compounds 02 and 06 and the controls was measured via the Gq/IP3 pathway in the presence of the antagonist SR142948 or compound 08, as potential antagonistic binders ( Fig. 4B ). The addition of SR142948 led to a signal reduction of the natural control agonist NTS8-13, and clearly demonstrated the ability to effectively disrupt the signaling activity of this high-affinity agonist, as expected for a competitive antagonist with high affinity itself. Compound 02 displayed a slightly decreased IP1 concentration of around 200 nM in the presence of SR142948. Interestingly, compound 06 was still able to produce the same amount of IP1 in the SR-blocked cells. Thus, the antagonist SR142948 blocks the orthosteric binding site for NTS8-13 and reduces the signal of compound 02 by a factor 2, but does not impair compound 06 binding and signaling activity. Compound 08 has no effect on the functional activity of the four tested compounds. Only in the case of compound 06 was an increase from 400 nM to 600 nM IP1 in the presence of 08 detected.
Functional Activity and Mode of Action
In the functional experiments described above, compound 06 displayed Gq signaling specifically via NTS1. The signaling behavior of compound 06 and control ligands was further tested in a dose-dependent activity assay. Six concentrations up to 100 µM of compound 06 were used. Higher compound concentrations could not be applied due to solubility issues of the compound. Control ligands NTS8-13 and SR142948 were titrated in 18-point dilution series to cover a broader concentration range. NTS8-13 revealed an EC50 in the picomolar range (100 pM), whereas SR142948 did not elicit signaling activity, as expected for an antagonistic binder. Although the used concentrations of compound 06 were not sufficient to reach saturation, a clear dose-dependent activity at higher micromolar concentrations was observable. An accurate EC50 calculation was thus not possible, but an EC50 value in the high micromolar range is expected ( Fig. 4C ).
Competitive functional assays implied an allosteric agonist activity of compound 06. Therefore, a potential modulatory effect of compound 06 on NTS8-13 signaling was tested directly. For this purpose, cells were preincubated with a constant concentration of compound 06, before adding NTS8-13 peptide in a titration series ( Fig. 4D ). Addition of compound 06 did not result in any shift of the EC50 of NTS8-13 (~100 pM), but increased the basal signaling activity of cells, characterized by higher IP1 level at low NTS8-13 concentrations, as expected for a functional agonist.
Search for Analogs
To explore a possible structure-guided improvement of the identified NTS1 targeting hits, a computational screen of analogs was performed. Based on our screening, hit confirmation, and functional assay results, compounds 06 and 08 were chosen as the basis of the search for structurally related analogs. Although a reliable binding affinity could not be determined for compound 06, it appeared attractive due to its NTS1-specific agonistic activity, whereas compound 08 showed the strongest orthosteric affinity of all hits. In total, five new potential analogs with a molecular structure related to compound 06 (four analogs) or 08 (one analog) were selected for a repeated hit characterization procedure. None of the five selected analogs resulted in an increased binding inhibition when tested in FP-based dose–response measurements ( Suppl. Fig. S5 ). Analogs 01 and 05 showed no inhibition of NTS8-13 binding at all, whereas compounds 02, 03, and 04 revealed IC50 values around 5 µM, which are comparable to the parental molecules ( Fig. 5 ). In contrast, binding affinity measurements indicated that two of the four selected analogs of compound 06 showed an improvement in their binding affinities, with analog 01 displaying a nearly 40-fold enhancement from an estimated 40 µM to 0.9 µM, and analog 02 showing a 10-fold enhancement to 4 µM. Analog 03 showed no binding, and analog 04 gave similar binding affinities to the parental molecule ( Fig. 6A ). Performed functionality assays showed a loss of signaling activity for all four tested analogs of compound 06 ( Fig. 6B ). Thus, an affinity enhancement for some of the analogs was achieved, albeit at the expense of the agonistic functionality. Analog 05, the sole analog of compound 08, did not show any binding to NTS1 in SPR experiments and no influence on signaling activity was observable. The IC50 and kinetic data of all analyzed analogs are summarized in Figure 5 .
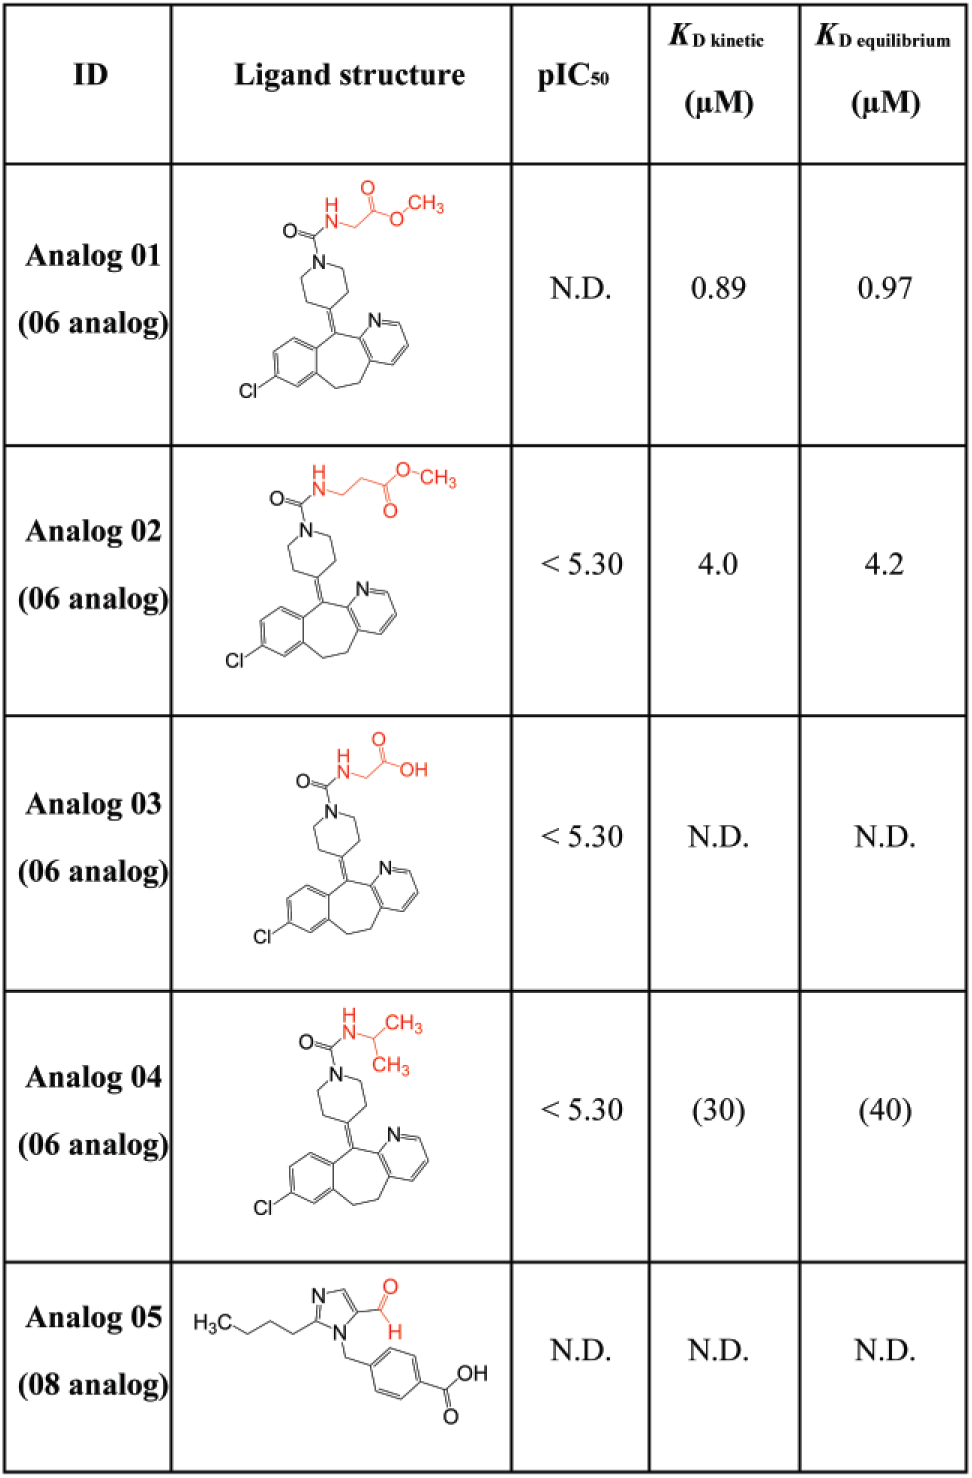
Summary of measured FP and SPR data for the analogs of compound 06. The figure shows all analog compounds with their screening name (ID), ligand structure, pIC50 values, and KD values calculated from a kinetic fit of SPR data using a 1:1 Langmuir binding model or equilibrium-based analysis. Compounds without any binding or inhibition are marked with N.D. Values in parentheses are estimates that correspond to compounds without saturation at the highest concentrations reachable. The parts marked in red represent the molecular changes from the corresponding parental molecule.
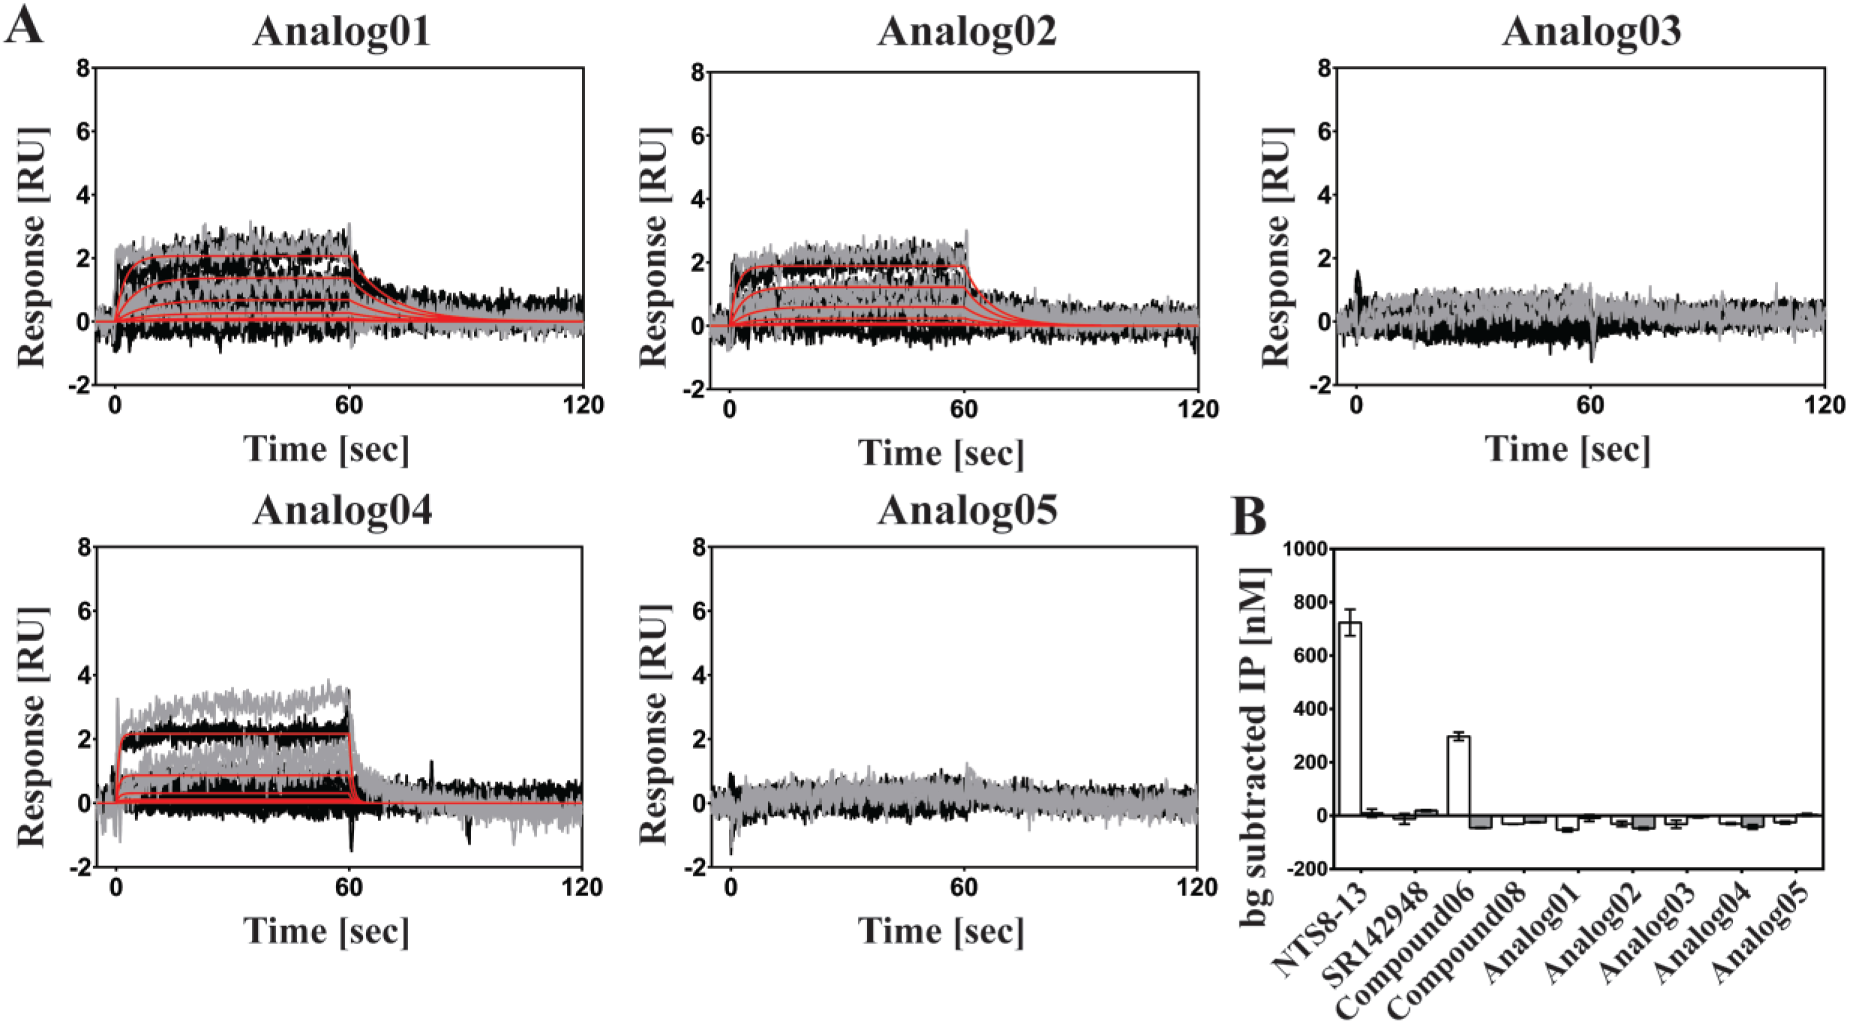
Kinetic binding and functional data for the five analogs. (
Discussion
The solubilization and purification of a functionally active receptor from the cell membrane should overcome most of the limitations of current HT FP screenings carried out with whole cells, particularly to reduce autofluorescence signals and to remove potential unspecific cellular contaminants. In this study, we used the interaction of NTS1 with its peptidic agonist NTS as a readout with the aim of developing an FP HT assay free of cellular components to identify novel inhibitors of the receptor–peptide interaction. As the target protein, the stabilized mutant NTS1-H4, which evolved by cellular high-throughput encapsulation for screening and selection (CHESS), 18 was used. This mutant showed the highest stability in the apo state, 18 and its structure has been determined. 19 This mutant has already proven to be suitable for several in vitro screening techniques, such as nuclear magnetic resonance (NMR) and SPR, to validate novel binding entities.20,22 The focus of the present work was to determine the compatibility of a stabilized GPCR variant in an FP-based screening setup and to extend the scope toward in vitro HTS efforts of this class of membrane proteins.
An effective screening performance in an FP assay format requires an optimal signal window that is dictated predominantly by the selected fluorescently labeled ligand. To identify the ideal ligand for the anticipated NTS1 receptor screening, we evaluated two key parameters, ligand binding affinity and the spectral behavior of the conjugated fluorophore. First, strong binding is a requirement to resolve a wide range of potential inhibitor potencies, 28 but it should still allow the binding and competition of weakly interacting compounds when screening large small-molecule compound libraries. Therefore, the first seven amino acids of the natural peptide NTS were truncated to maintain the high affinity of the peptide in the picomolar range and concomitantly focus the mode of competition toward the amino acids that are buried within the receptor binding pocket. Second, studies showed a reduced sensitivity of red-shifted fluorophores to colored compounds in FP screenings, 29 which tend to absorb at shorter wavelengths. Thus, a HiLyte647 dye was conjugated at the nonburied N-terminus of the NTS8-13 peptide. 19 The resulting conjugate still binds NTS1 with a low nM affinity (data not shown). Various concentrations of NTS1 were analyzed to identify the optimal fluorescent ligand/receptor ratio for a suitable screening window. Based on our findings, the assay was further miniaturized for a 384-well format to potentially allow HTS of large compound libraries. Initial competition studies against unlabeled peptide NTS8-13 and the small-molecule antagonist SR149248 resulted in inhibition potencies (IC50) of 5 nM (NTS8-13) and 11 nM (SR149248). Although the absolute IC50 values were not corrected for potential ligand depletion and thus should not be taken as true affinities, the loss of polarization in the presence of both ligands demonstrated the specific detection and measurable inhibition of the peptide–receptor interaction.
The optimized assay setup was used to perform a pilot screen using the LOPAC with a total of 1272 compounds. The developed assay has an acceptable utility for screening, demonstrated by its calculated Z′ value (~0.4), which represents a satisfactory signal difference between positive and negative controls for an HTS assay.
21
Twelve compounds (0.9% hit rate) with a cutoff inhibition rate of >50%, and a further three attractive compounds with inhibition between 35% and 50%, were identified. Subsequent FP dose–response measurements confirmed the inhibition effect of the molecules with IC50 values between 1 and 15 µM, a typical range for primary hits. Furthermore, the initial hits were confirmed by orthogonal screening (
Fig. 1
). The orthogonal screening was necessary to remove “false positives,” since the competitive nature of the FP-based readout in principle does not discriminate between compounds that compete with the natural peptide or potentially disturb receptor integrity. The binding of seven compounds (0.6% hit rate) was reconfirmed in SPR screenings with binding affinities in the range of 0.9 µM for the most affine binders (compounds 08 and 15) to ~40 µM for the weakest (compound 06) (
Figs. 2
The predominantly observed allosteric binding behavior of hits was rather unexpected. Due to the competitive nature of the initial FP screening, we assumed that we would select binders that predominantly block the orthosteric binding pocket and interfere with the NTS peptide upon binding. Our SPR competition experiments, however, revealed that binding of most of the hits was not affected by either the reagents used for blocking the orthosteric receptor binding pocket, the peptidic agonist NTS8-13, or the small-molecule antagonist SR149248 ( Fig. 2 , Suppl. Fig. S3 ). Obviously, the major difference in the two screening approaches is the presence of a fluorescent dye in the FP assay setup. A repetition of competitive SPR measurements with the NTS–HiLyte647 peptide used in FP clearly demonstrated that in the presence of compound 06 the binding of the dye-conjugated peptide is inhibited, whereas this effect is not seen for the unlabeled peptide itself ( Suppl. Fig. S6 ). Although the respective peptide was point-mutated (Y11A) to weaken its affinity (30 pM to 2 nM), which shortens its dissociation time to achieve a fast SPR screening of several concentrations, the mutation does not influence its binding epitope. 22 Consequently, the bulky HiLyte647 dye outside the peptide binding pocket must have contributed to the observed competition behavior of compounds for the NTS1-NTS interaction and has thus, fortuitously, allowed it to probe nonorthosteric binding regions. Nevertheless, we could also identify one compound (compound 08) that acts as an expected orthosteric competitor, as highlighted by competition with both labeled and unlabeled peptides ( Suppl. Figs. S6 and S7 ). Interestingly, at lower compound concentrations the binding competition was more effective for NTS1-H4 than for NTS1_wt ( Suppl. Fig. S8 ), which might be explained by conformational stabilization of the NTS1-H4 19 and thus a more accessible binding epitope for compound 08.
Furthermore, biological activity of the seven SPR-confirmed NTS1 binders was examined. None of the tested compounds showed Gs signaling activity, but compounds 02 and 06 triggered IP1 production, corresponding to activation of Gq-mediated signaling. Compound 02 showed the highest IP1 production of all tested compounds, although IP1 production was not diminished entirely in the NTS1-negative cells. Compound 02, or L-162,313, is a small-molecule angiotensin receptor (AT1) agonist and is known to signal there via the Gq signaling pathway. 30 Thus, the compound might bind and activate endogenous AT1 receptor in HEK293 cells and contribute to the observed IP1 levels. Nevertheless, the comparison of the IP1 levels of antagonist-blocked and nonblocked NTS1-positive cells suggests that L-162,313 also activates NTS1, since the production of IP1 is significantly lower when NTS1 is blocked by its antagonist SR142948.
Compound 06, or loratadine, is a small-molecule histamine H1 receptor inverse agonist and has no known effects on increasing the IP1 level by itself. 31 The competition assays further indicate that loratadine most likely acts as an NTS1 allosteric agonist. Loratadine appears to be able to shift NTS1 into a Gq signaling-active conformation even in the presence of SR142948. Such a finding is supported by our SPR experiments with orthosterically blocked NTS1, in which loratadine binding remains unaffected. Further functional experiments indicated that loratadine induces Gq signaling but has no modulatory effect on NTS8-13 potency, as the EC50 of NTS8-13 (100 pM) was not altered in the presence or absence of loratadine.
The third compound tested in more detail was eprosartan mesylate (compound 08), which acted as an inhibitor of the NTS peptide interaction with NTS1 in both in vitro assays (SPR and FP). An agonistic functionality of this compound was not detected. However, the binding inhibition of known NTS1 agonists in competitive functional cell assays did not result in a loss of signaling activity. As compound 08 inhibited binding of tritium-labeled NTS in radioligand binding assays, for both the stabilized variant NTS1-H4 and NTS1_wt at the given concentration used in the functional assay (
Suppl. Fig. S8
), an inherent effect of mutations present in NTS1-H4 on compound 08 binding could be excluded. Moreover, the lack of an inhibitory effect on NTS-induced NTS1 activity most likely results from the difficulty to block the downstream signaling cascade upon binding of the very potent peptide agonist (EC50 of 100 pM) with a very weak antagonist, as an occasional occupancy of the receptor by the agonist can hardly be prevented. As observed in competition experiments (
Suppl. Figs. S7
As a first step to characterize the structure–activity relationships (SARs) of the confirmed hits in more detail, we selected structurally related compounds with a similarity of around 60% based on the Tanimoto coefficient 24 and characterized their behavior in the same assay formats as for the original hit substances. In this respect, we focused on the two most promising hits, eprosartan mesylate as the strongest binder and loratadine as the only NTS1-specific compound with agonistic activity, to obtain a new subset of structural analogs. Analogs 01 and 02 of loratadine indicated an improved binding affinity in SPR, but inhibition levels in FP assays remained >5 µM. More strikingly, the agonistic activity was lost for all loratadine analogs. It appears that the ethyl ester group of loratadine’s piperidine ring helps to improve binding potency but abolishes the ability to activate Gq signaling via NTS1. Analog 05, as sole representative of eprosartan mesylate, loses its inhibition and binding ability completely. The modification of the imidazole ring seems to diminish the binding properties of this compound class.
In conclusion, we could demonstrate the compatibility of a stabilized NTS1 receptor variant with an FP-based HTS in a cell-free environment. The combination of the two in vitro screening techniques, FP and SPR, allows fast screening of large numbers of molecules by FP, followed by a more detailed characterization of the nature of hit binding using SPR. Furthermore, the competitive screening by FP with an attached bulky fluorescent dye did not result in the selection of orthosteric binders only, as anticipated, but did enable the detection of compounds that appear to target allosteric sites on the receptor, around the orthosteric binding site, and interfered with binding of the attached dye. Thus, the FP competition screening apparently allows simultaneous screening for orthosteric and allosteric compounds in an HT fashion. By doing this, we identified several molecular entities with previously unknown NTS1 binding properties and, in one case, even activation of NTS1-mediated signaling. Consequently, the methodological approach established here could easily be expanded to larger compound libraries and other members of the GPCR family for which stabilized receptor variants exist, with the potential to facilitate the development of new tool compounds and therapeutic modalities to challenge or previously undruggable GPCR drug targets.
Supplemental Material
Supplemental_Material_final – Supplemental material for High-Throughput Fluorescence Polarization Assay to Identify Ligands Using Purified G Protein-Coupled Receptor
Supplemental material, Supplemental_Material_final for High-Throughput Fluorescence Polarization Assay to Identify Ligands Using Purified G Protein-Coupled Receptor by P. Heine, G. Witt, A. Gilardi, P. Gribbon, L. Kummer and Andreas Plückthun in SLAS Discovery
Footnotes
Acknowledgements
We are grateful to Matthias Hillenbrand for helpful advice during the functional profiling of hit compounds and analogs. We further acknowledge the support of Gabriela Nagy-Davidescu for cell culture work.
Supplemental material is available online with this article.
Authors’ Note
P. Heine and L. Kummer are currently affiliated with Heptares Therapeutics Zurich AG, Grabenstrasse 11a, 8952 Schlieren, Switzerland.
Declaration of Conflicting Interests
The authors declared no potential conflicts of interest with respect to the research, authorship, and/or publication of this article.
Funding
The authors disclosed receipt of the following financial support for the research, authorship, and/or publication of this article: This work was funded by the Schweizerische Nationalfonds Grant 31003A_153143 to A.P.
References
Supplementary Material
Please find the following supplemental material available below.
For Open Access articles published under a Creative Commons License, all supplemental material carries the same license as the article it is associated with.
For non-Open Access articles published, all supplemental material carries a non-exclusive license, and permission requests for re-use of supplemental material or any part of supplemental material shall be sent directly to the copyright owner as specified in the copyright notice associated with the article.