
Abstract
Cyclic adenosine monophosphate–phosphodiesterases (cAMP-PDEs) regulate the cellular level of cAMP by selectively catalyzing the hydrolysis of the phosphodiester bond in the cAMP molecule. They play important roles in modulating cellular and physiological functions. There is a growing interest in the study of cAMP-PDEs as therapeutic targets. We describe a novel method for measuring the enzyme activity of cAMP-PDEs that is based on a homogeneous fluorescence assay employing a cAMP-dependent DNA-binding protein (CAP). We demonstrate that the assay is quick and robust compared to traditional methods and is expected to be cost-effective for high-throughput screening of cAMP-PDE inhibitors. The usefulness of the assay is demonstrated by measuring IC50 values of three nonselective PDE inhibitors and by kinetic measurements of cAMP-PDEs from various rat tissues.
Introduction
Cyclic adenosine monophosphate–phosphodiesterases (cAMP-PDEs) comprise a group of enzymes that catalyze the hydrolysis of the phosphodiester bond in the second-messenger molecule, cAMP. The PDE superfamily of enzymes is classified into 11 families with several gene products and splice variants. 1 PDEs 4, 7, and 8 are cAMP specific. PDEs 1, 2, 3, 10, and 11 hydrolyze both cAMP and cyclic guanosine monophosphate (cGMP). cAMP-PDEs are widely expressed in mammalian tissues and are regulated by various factors, including phosphorylation/dephosphorylation, allosteric binding of cAMP, binding of Ca2 +/calmodulin, and protein–protein interactions. 2 cAMP-PDEs are closely associated with different physiological functions and have been implicated in a variety of diseases, including pulmonary diseases, neurodegenerative diseases, vascular diseases, diabetes, and cancer. 3 A convenient method for measuring cAMP-PDE activity will greatly aid PDE-related research and drug development. The traditional method for measuring cAMP-PDE activity is to use radioisotope [3H]cAMP as the substrate. 4 Although this method achieves high sensitivity with a low substrate concentration, handling the isotope is time-consuming and environmentally hazardous. Other formats of PDE assays have been described. For example, a cell-based PDE4 assay was reported using an HEK293 cell line expressing heterogeneous PDE4 and a cyclic nucleotide-gated (CNG) cation channel as a biosensor. 5 In addition, a fission yeast-based screening method was reported using a simple growth assay in yeast strains expressing PDE2A, PDE4A, PDE4B, and PDE8A. 6 These cell-based assays provide a better assessment of compound activity in a more physiological context, but they normally involve complicated assay procedure and have relatively limited screening throughput. Other fluorometric assays7,8 and colorimetric assays 9 have also been described. However, there is still a need for assays that are sensitive and convenient for measuring cAMP-PDE activities and for high-throughput screening (HTS) of their inhibitors.
Heyduk et al. 10 have previously developed a simple fluorescence-based assay for cAMP measurement using a cAMP-dependent DNA-binding protein (CAP) DNA-binding protein. CAP is a bacterial DNA-binding protein reported to be specifically cAMP ligand dependent and DNA sequence dependent. It has a Kd around 0.1 nM to a consensus DNA site 5′-AAATGTGATCTAGATCACATTT-3′. 11 The assay design is illustrated in Figure 1 . Two DNA fragments, each containing half of the CAP binding site, are prepared with short complementary single-stranded overhangs as reported 10 and labeled with the fluorescent probe “FAM” and the quencher “Dabcyl,” respectively. The role of these overhangs is to provide some propensity for the two DNA fragments to associate. However, the length of the overhangs is selected such that in the absence of CAP, very little association between DNA fragments occurs. The presence of cAMP induces conformational change of CAP and greatly increases the binding affinity of the CAP to the annealed DNA fragments, which contain the complete functional binding site for CAP. Such preferential binding drives the annealing of the two DNA fragments and brings the probe and quencher into close proximity, resulting in fluorescence quenching. 12 Because the hydrolysis of cAMP is directly related to the cAMP-PDE activity, we hypothesized that this fluorescence assay could be adapted to measure cAMP-PDE activity and to quantitatively evaluate the activity of cAMP-PDE inhibitors. Herein, we present data demonstrating a new method to quickly determine the activity of cAMP-PDEs and the potency of their inhibitors.
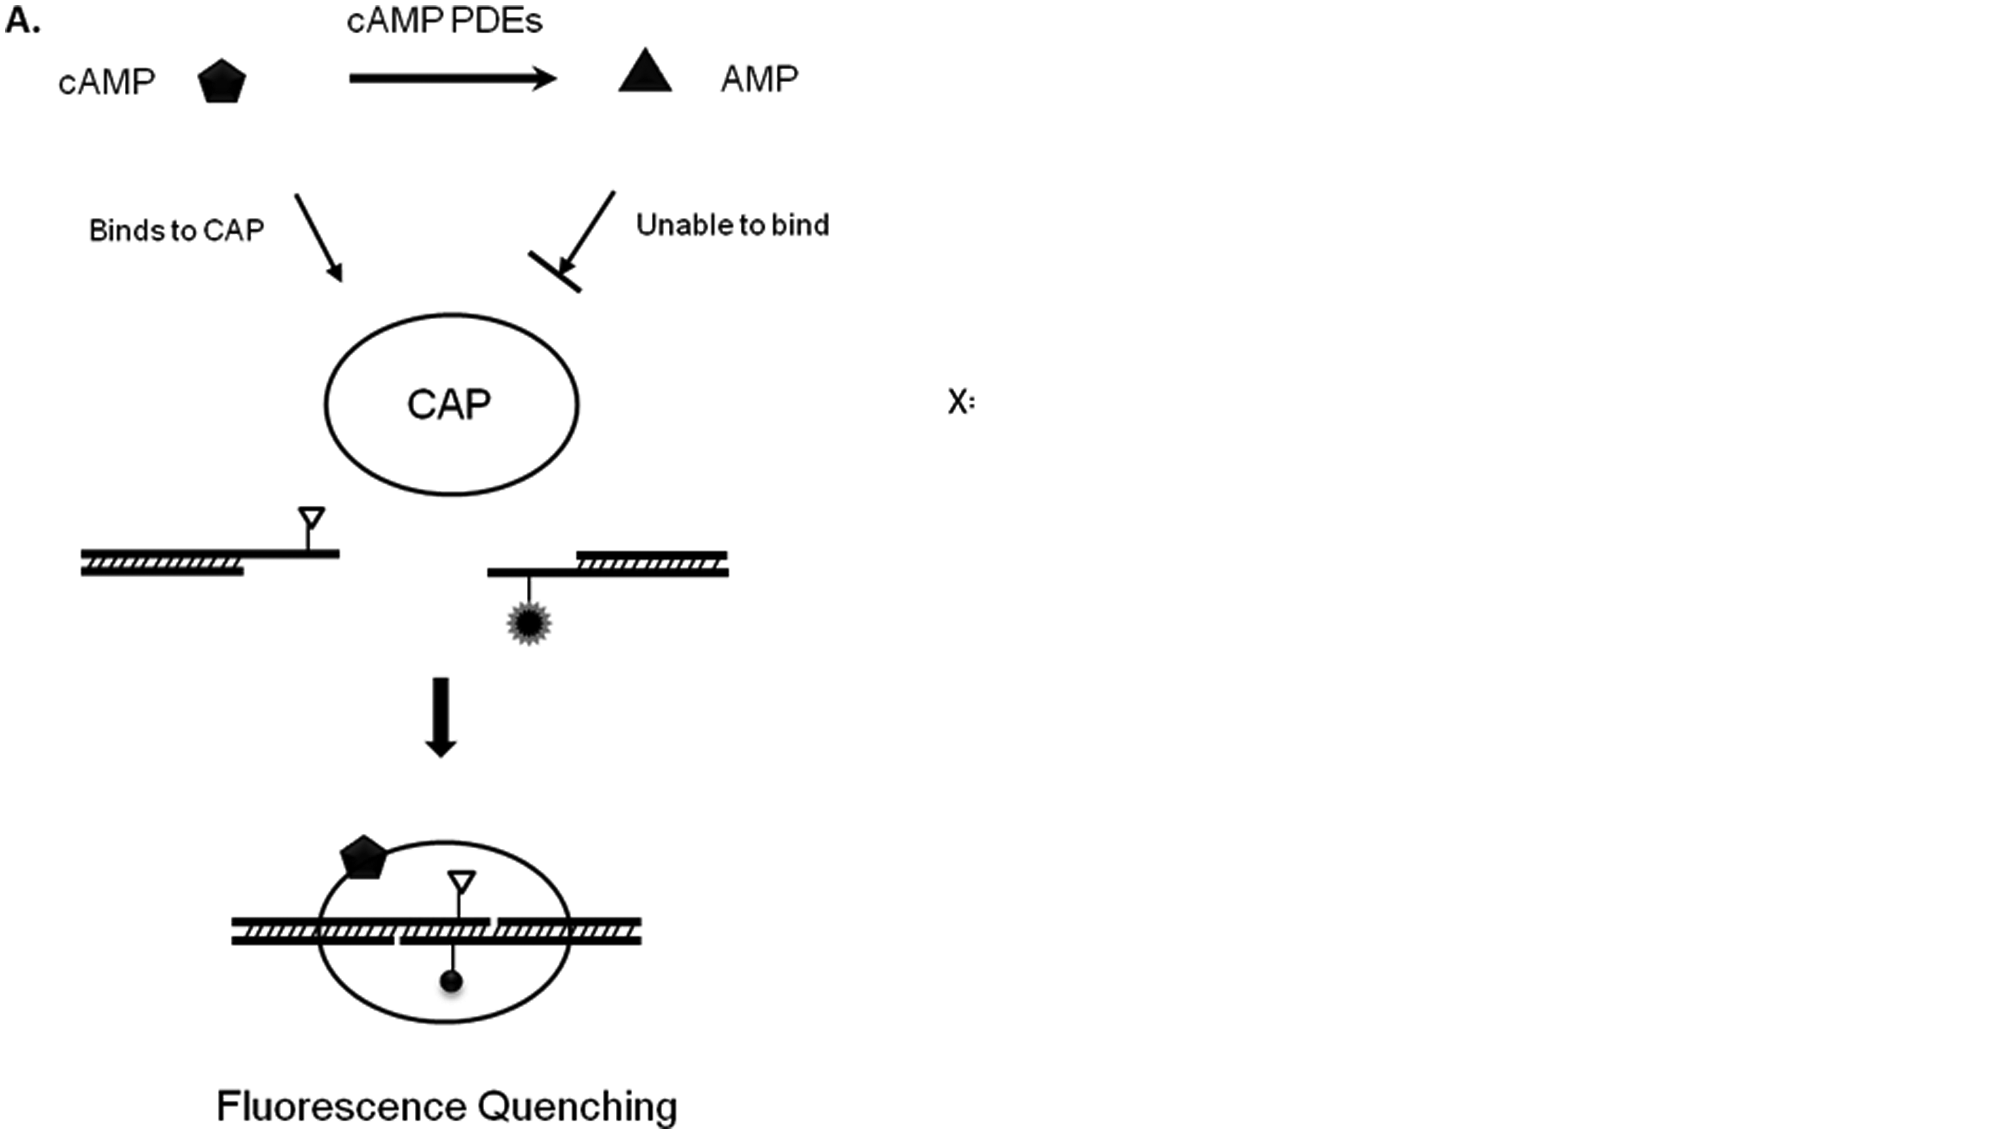
(A) Assay principle. Two DNA fragments, each containing half of the cAMP-dependent DNA-binding protein (CAP) binding site, are labeled with a fluorescence donor and a quencher, respectively. The presence of cAMP induces conformation changes of CAP and greatly increases its binding affinity to the annealed DNA fragments. The annealing of the two DNA fragments brings the probe and quencher into close proximity, resulting in fluorescence quenching. The hydrolysis of cAMP by phosphodiesterases (PDEs) decreases cAMP concentration and consequently results in less CAP-DNA complex formation and an increase in fluorescence intensity. (B) The sequences of DNA with probe structures. The DNA-binding domain for CAP is underlined. X stands for a dT modified by FAM at position 3. Y stands for a dT modified by Dabcyl at position 3.
Materials and Methods
Materials
All oligonucleotides were purchased from IDT (Coralville, IA), and the dye-labeled oligonucleotides were purified by high-performance liquid chromatography (HPLC). The sequences of the oligonucleotides are described as follows:
A1: 5′ AAG XAG ATC ACA TTT TAG GCA CC 3′ (X = T-FAM)
A2: 5′ GGT GCC TAA AAT GTG 3′
A3: ATC YAC TTC ACA TTT ATT GCG TT 3′ (Y = T-Dabcyl)
A4: 5′ AAC GCA ATA AAT GTG 3′
The CAP binding “half-sites” were prepared by annealing oligonucleotides A1 with A2 and A3 with A4, respectively. Equal molar concentrations of to-be-annealed oligonucleotides were mixed in Tris-buffered saline (TBS) buffer (20 mM Tris [pH 8.0], 100 mM NaCl). The mixture was heated at 95 °C for 1 min and cooled to room temperature over 1 h. Bacterial CAP protein was expressed and purified according to previously published procedures. 10 Purified PDE from bovine brains, calmodulin, bovine serum albumin (BSA), cAMP, 3-isobutyl-1-methylxanthine (IBMX), theophylline, pentoxifylline, and 4-(2-aminoethyl) benzenesulfonyl fluoride hydrochloride (AEBSF) were purchased from Sigma-Aldrich (St. Louis, MO). Three rat tissues (brain, heart, and liver) were purchased from Rockland (Gilbertsville, PA) and stored at −80 °C until ready to use.
Determination of the Optimal cAMP Concentration
All assays were performed in triplicate in 384-well black, low-volume, nonbinding plates. A serial dilution of cAMP was made in 10 µL of buffer (25 mM Tris [pH 7.4], 100 mM NaCl, 0.1 mg/mL BSA). The CAP–DNA solution was prepared by mixing the CAP protein with the annealed DNA “half-sites” at a 100:5:7 molar ratio. Then, 10 µL of the CAP–DNA mixture was added to each cAMP solution prepared above. After incubation at 24 °C for an indicated time, the fluorescence intensity was measured with a Tecan fluorescence plate reader (Tecan, Männedorf, Switzerland) with excitation at ~480 to 485 nm and emission at ~520 to 535 nm. The extent of fluorescence quenching (in %) was calculated as (F0 – Fn)/F0, where Fn is the fluorescence intensity of the sample and F0 is the fluorescence intensity of the blank (no cAMP) after correction of the background from the buffer.
PDE Titration and Time Course
In total, 10 µL of the enzyme reaction was prepared by mixing purified PDEs from bovine brain with 0.6 µM cAMP in reaction buffer (25 mM Tris [pH 7.4], 100 mM NaCl, 0.03 mM CaCl2, 10 U/mL calmodulin, and 0.1 mg/mL BSA). Then, 10 µL of the reaction mixture without cAMP was used as a negative control. After incubating at 24 °C for an indicated time, the reaction was stopped by adding 0.5 µL of 50 mM IBMX, followed by incubation at 24 °C for 5 min. After all the reactions were stopped, 10 µL of the CAP–DNA mixture was added directly to each reaction mixture and to the negative control, respectively. After mixing, the samples were incubated at 24 °C for 30 min, and the fluorescence intensity was measured. The relative signal change was calculated as (Sn – S0)/(Snc – S0), where Sn is the fluorescence intensity of each sample, S0 is the fluorescence intensity of the reaction with 0.6 µM cAMP but without PDE, and Snc is the fluorescence intensity of the negative control containing neither cAMP nor PDE.
IC50 Determination
Three nonselective PDE inhibitors, including IBMX, theophylline, and pentoxifylline, were used in this study. IBMX was dissolved in DMSO at a stock concentration of 100 mM. Theophylline and pentoxifylline were dissolved in dH2O at concentrations of 25 mM and 100 mM, respectively. Inhibitors were diluted to desired concentrations in dH2O and mixed with 0.8 mU of purified PDE from bovine brain in reaction buffer (25 mM Tris [pH 7.4], 100 mM NaCl, 0.03 mM CaCl2, 10 U/mL calmodulin, and 0.1 mg/mL BSA) to reach a final volume of 9.4 µL. To start the reaction, 0.6 µL of 10 µM cAMP solution was added to each reaction mixture. Then, 0.6 µL of 10 µM cAMP was added to 9.4 µL of reaction buffer as a negative control. After incubation at 24 °C for 30 min, the reaction was stopped by adding 0.5 µL of 50 mM IBMX, followed by incubation at 24 °C for an additional 5 min. To measure cAMP, 10 µL of the CAP–DNA mixture was added to each well containing the PDE enzyme reaction and the negative control. After mixing, each sample was incubated at 24 °C for 30 min, and the fluorescence intensity was measured. The relative activity was calculated as (Sn – Snc)/(S0 – Snc), where Sn is the fluorescence intensity of each sample, S0 is the fluorescence intensity of the sample reaction without inhibitor, and Snc is the fluorescence intensity of the negative control that contained neither PDE nor inhibitor.
Z Factor Determination
Fifty reactions were each prepared with 0.8 mU of purified PDE from bovine brain, with and without 200 µM IBMX. The enzyme reaction mixtures were incubated at 24 °C for 30 min before performing the assays. The assay conditions and procedures were the same as above for the IBMX inhibition assay. The relative signal change was calculated as (Sn – S0)/(Snc – S0), where Sn is the fluorescence intensity of each sample, S0 is the fluorescence intensity of the reaction with 0.6 µM cAMP but without PDE, and Snc is the fluorescence intensity of the negative control containing neither cAMP nor PDE. The Z factor was calculated as 1 – 3(σ s + σ n )/|µ s – µ n |. σ s , σ n , µ s , and µ n were the standard deviations of the samples with and without IBMX and the means of the samples with and without IBMX, respectively.
cAMP-Dependent PDE Activities in Rat Tissues
In total, 200 mg of rat brain, rat heart, and rat liver was each homogenized in 400 µL 50 mM Tris buffer (pH 7.4) containing 0.2 mg/mL AEBSF. Each homogenate was sonicated for 10 s on ice and then centrifuged at 2000 g for 10 min at 4 °C. The liquid phase was removed for the PDE assay. The total protein concentration of each tissue extract was determined using a BCA protein assay kit (Pierce, Rockford, IL), following the instruction. The reaction buffer for PDEs from rat brain was 25 mM Tris (pH 7.4), 100 mM NaCl, 0.03 mM CaCl2, 10 U/mL calmodulin, and 0.1 mg/mL BSA; for PDEs from rat heart, it was 40 mM Tris (pH 7.4), 40 mM imidazole, 100 mM NaCl, 5 mM MgCl2, 0.05 mM CaCl2, 10 U/mL calmodulin, and 0.1 mg/mL BSA; and for PDEs from rat liver, it was 25 mM Tris (pH 7.4), 100 mM NaCl, 3 mM MgCl2, 0.1 mM EDTA, and 0.1 mg/mL BSA. The cAMP-dependent PDE activities were measured by mixing a desired amount of tissue extract with 0.6 µM cAMP in a 10-µL reaction. All the other conditions were the same as described above for the PDE time course experiments.
Results and Discussion
As illustrated in Figure 1 , two DNA fragments, each containing half of the CAP binding site, were prepared with short complementary single-stranded overhangs. Three nucleotide mutations were introduced in the overhangs to lower the hybridization energy, which prevented the self-annealing of the DNA fragments in the absence of the CAP protein or cAMP molecule. The mutations were located in the weakly conserved region of the consensus DNA 13 and were not essential for CAP binding. Activation of CAP by cAMP drives the annealing of the two DNA fragments and brings the probe and quencher into close proximity, resulting in fluorescence quenching. Placing fluorescence probes within the protein-binding site could interfere with the formation of the protein–DNA complex in some cases. 12 In the case of CAP protein, the fluorophores were placed in the minor groove of the double-stranded DNA substrate to minimize the interference. The optimal signal of the cAMP dose–response curve was obtained after incubating the CAP–DNA mixture for 30 min at room temperature. The signal was stable for more than 2 h at room temperature ( Fig. 2A ). The lowest detection limit (LDL) of cAMP using this assay was 3.125 nM. The titration curve of PDE showed a strong correlation between the signal obtained and the concentration of PDEs in the reaction mixture, with a coefficient of variation (CV) less than 3% ( Fig. 2B ).
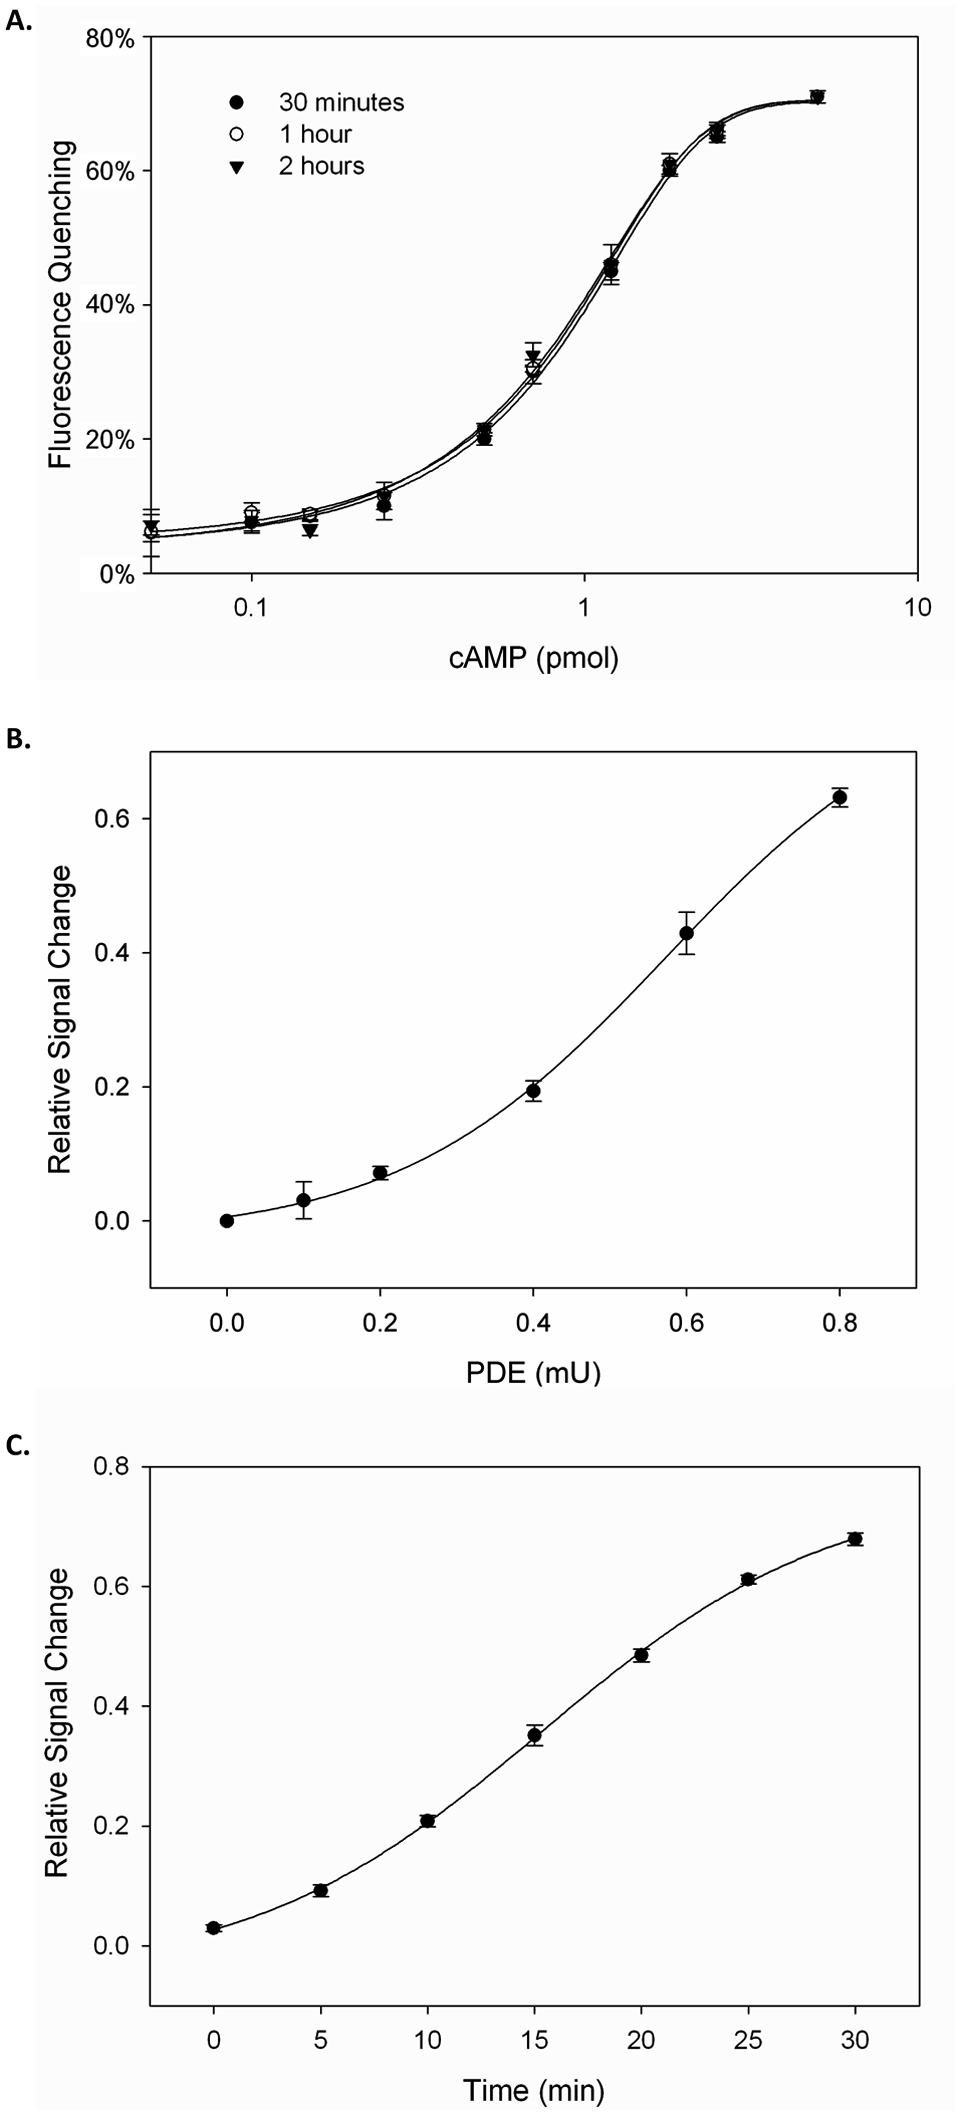
Evaluation of assay performance. (A) The cAMP dose–response curve and the stability of the assay signal. The fluorescence intensity was recorded at 30 min, 1 h, and 2 h after mixing 10 µL of the cAMP-dependent DNA-binding protein (CAP)–DNA mixture with samples containing 0 to 8 pmol cAMP. (B) Titration curve for PDE purified from bovine brains. Reaction time was 30 min, and the substrate cAMP concentration was 0.6 µM in a 10-µL reaction volume. (C) Time course study of the reaction mediated by 0.8 mU of purified PDEs from bovine brain. The substrate cAMP concentration was 0.6 µM in a 10-µL reaction. The reactions were incubated at 24 °C from 0 to 30 min with a 5-min interval. The reactions were stopped by addition of 3-isobutyl-1-methylxanthine (IBMX), and the rest of the procedures were the same as the enzyme titration assay. Data points are presented as the means of triplicate measures.
For screening of PDE inhibitors, an optimal concentration of PDE is needed to produce the maximal signal change in a given time period. Under current experimental conditions, a significant signal change was reached after a 30-min incubation using 0.8 mU of bovine brain PDE ( Fig. 2C ). Three nonselective PDE inhibitors, including IBMX, theophylline, and pentoxifylline, were used as examples to evaluate the applicability of the assay as a convenient tool for PDE inhibitor screening. All three xanthine derivatives were titrated with 0.8 mU PDEs in a 10-µL reaction over a range from 0.1 µM to 10 mM. IC50 value for each inhibitor was calculated based on the individual dose–response curve ( Fig. 3A ), which was 12 µM, 115 µM, and 320 µM for IBMX, theophylline, and pentoxifylline, respectively. IBMX was previously reported to have an IC50 value around 5 to 30 µM and was about 15 times more potent than theophylline as a PDE inhibitor. 14 Another group reported an IC50 value of 118 µM for theophylline and 155 µM for pentoxifylline for inhibition of the activity of PDEs from bovine heart. 15 Our results were within similar ranges of those reported in the literatures. Z factor is an important parameter to evaluate an assay’s suitability for use in HTS. We determined the Z factor using 50 samples each prepared with 0.8 mU of purified PDE from bovine brain, with and without 200 µM IBMX. A value of 0.857 was obtained ( Fig. 3B ), indicating that this homogeneous fluorescence-based assay is suitable for use as an HTS method.
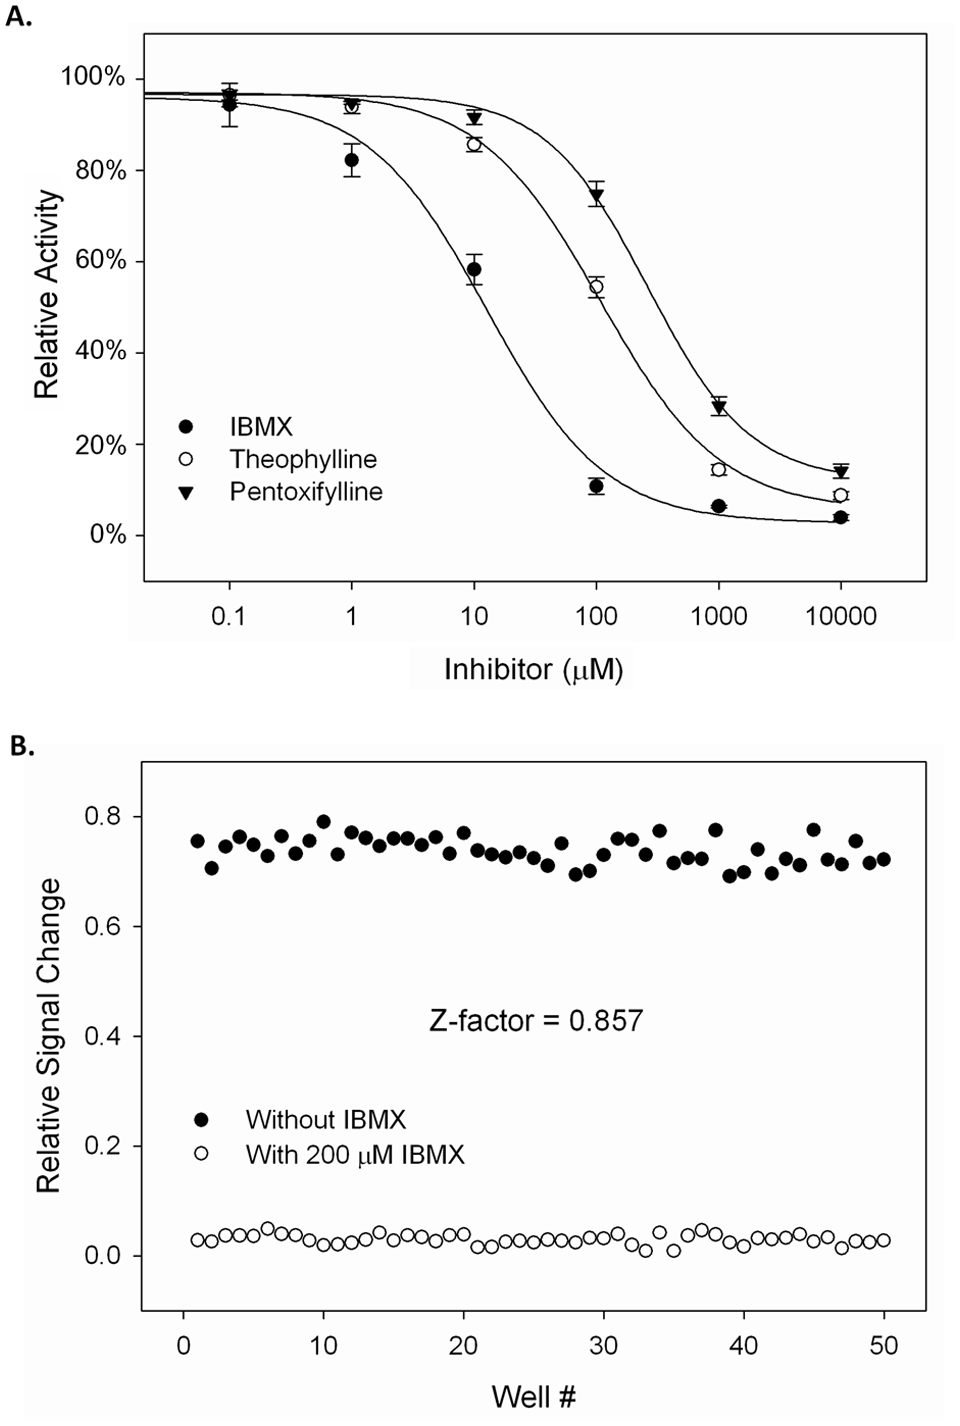
(A) Dose–response curves for 3-isobutyl-1-methylxanthine (IBMX), theophylline, and pentoxifylline. The calculated IC50 values of IBMX, theophylline, and pentoxifylline were 12 µM, 115 µM, and 320 µM, respectively. (B) Determination of Z factor value. Fifty reactions were each prepared with 0.8 mU of purified PDEs from bovine brain, with and without 200 µM IBMX. The enzyme reactions were incubated at 24 °C for 30 min. The rest of the procedures were the same as enzyme titration assay. The Z factor value was 0.857.
Many scientific studies require the monitoring of PDE activity in different tissues. We demonstrate that this homogeneous assay is a sensitive and convenient method for studying the kinetic activity of PDEs extracted from different tissues. Sections of rat brain, heart, and liver were homogenized and PDEs were extracted by sonication and centrifugation. The supernatants were used directly for the kinetic studies. The activity of PDEs from tissue extracts could be monitored either by end point titration of a different amount of tissue extract in the reaction or by kinetic study using a fixed amount of tissue extracts for a 30-min time course. To present a better example of measuring PDEs activity in tissues using this homogeneous assay, we decided to take the latter approach and showed the time course for each tissue. The amount that could hydrolyze 80% of cAMP in the reaction between 20 and 30 min was chosen for each tissue extract. For a 10-µL enzyme reaction with 0.6 µM cAMP substrate, 0.04 µL of rat liver extract (4.46 µg of extracted total protein), 0.05 µL of rat brain extract (2.5 µg of extracted total protein), or 0.1 µL of rat heart extract (8.5 µg of extracted total protein) was used. By incubating tissue extracts with cAMP and measuring the unhydrolyzed cAMP at 5-min intervals, a time-dependent increase in fluorescence intensity was observed ( Fig. 4 ). By normalization of PDE activity with the total weight of each tissue, extract from rat liver showed the highest activity (13.3 pmol/min/mg) for hydroxylation of cAMP, followed by extract from rat brain (8.4 pmol/min/mg) and rat heart (3.5 pmol/min/mg). The different responses of PDEs from each tissue extract to cAMP may reflect the different subtypes and heterogeneous distribution of cAMP-dependent PDEs among different tissues and cell types. For example, PDE1 and PDE7 are primarily found in brain and heart, and PDE4 is found in brain and liver. 16 The cAMP hydrolysis rate also differs among different PDE subtypes. For example, the Km value is 0.2 µmol/L for PDE7 but 4 µmol/L for PDE4. 16
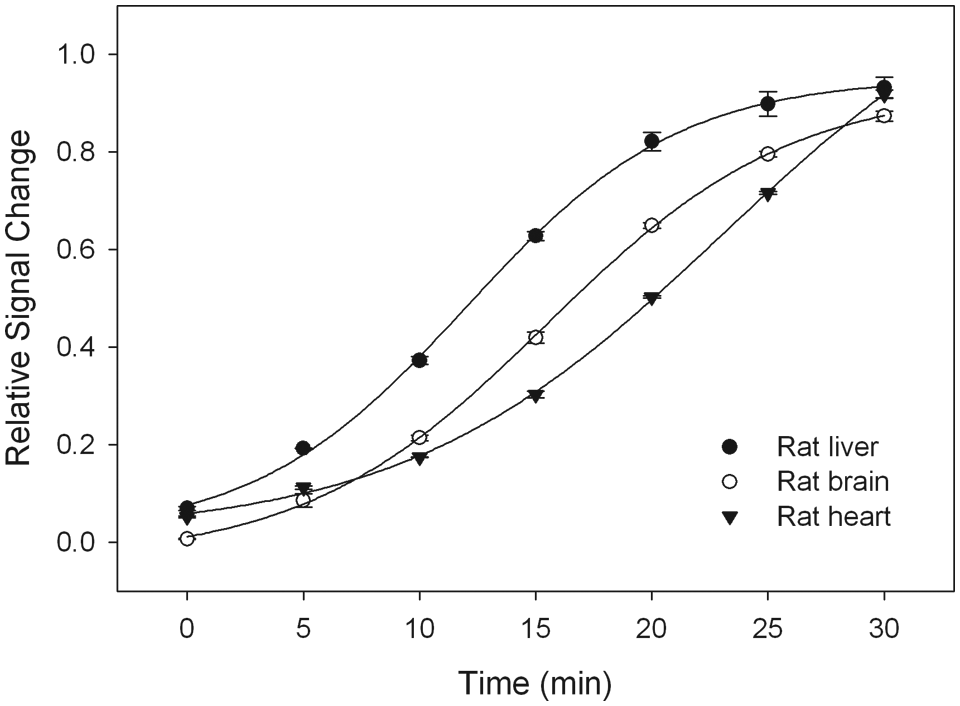
Time course study of the reactions mediated by phosphodiesterases (PDEs) from rat tissues. The PDEs were extracted from rat liver, brain, and heart using procedures described in the Materials and Methods section. To show a good time–response curve, the amount that could hydrolyze 80% of cAMP in the reaction (4.8 pmol) between 20 and 30 min was chosen for each tissue extract.
In summary, we have presented a novel homogeneous assay for measuring PDE activity. Compared to traditional methods, this assay is quick, nonradioactive, and easy to perform. The fluorescent signal produced by the reaction is proportional to the PDEs’ activity and can be obtained within 20 min. The optimal signal is achieved at 30 to 40 min and is stable for up to 2 h. Some fluorescence resonance energy transfer (FRET)–based and fluorescence polarization PDE assays7,8 require using premodified substrate cAMP, such as fluorescein-labeled cAMP. Modification of the substrate, however, may affect the binding of the enzyme to the substrate. Our assay reveals the real kinetic properties of enzymes by directly measuring the amount of intact cAMP left after each reaction. In addition, with the specificity of CAP protein to cAMP, this assay avoids the interference of other cyclic nucleotides present in tested samples. It is also less sensitive to temperature change and chemical interference compared to the bioluminescent assays involving luciferase, such as the PDE-Glo Assay from Promega (Madison, WI) and the PDELight Assay from Lonza Rockland (Rockland, ME). In colorimetric methods such as the malachite green assay for quantification of phosphate, 9 which requires nmol of substrate, a large amount of PDE is required to achieve the optimal signal, and only desalted samples can be used to avoid increasing the background absorbance of the assay with free phosphate. The assay we present above, however, requires only pmol substrate, less than 1 mU of PDE, and minimal sample manipulation. In all aspects, this assay presents a significantly better platform for evaluating cAMP-specific PDE activity and is suitable for HTS of cAMP–PDE inhibitors in the drug discovery industry.
Footnotes
The authors declared no potential conflicts of interest with respect to the research, authorship, and/or publication of this article.
The authors disclosed receipt of the following financial support for the research and/or authorship of this article: This work was partially supported by SBIR grants from the National Science Foundation (DMI-0214985 and DMI-0321520).