
Abstract
A novel assay for the NADPH-dependent bacterial enzyme UDP-N-acetylenolpyruvylglucosamine reductase (MurB) is described that has nanomolar sensitivity for product formation and is suitable for high-throughput applications. MurB catalyzes an essential cytoplasmic step in the synthesis of peptidoglycan for the bacterial cell wall, reduction of UDP-N-acetylenolpyruvylglucosamine to UDP-N-acetylmuramic acid (UNAM). Interruption of this biosynthetic pathway leads to cell death, making MurB an attractive target for antibacterial drug discovery. In the new assay, the UNAM product of the MurB reaction is ligated to L-alanine by the next enzyme in the peptidoglycan biosynthesis pathway, MurC, resulting in hydrolysis of adenosine triphosphate (ATP) to adenosine diphosphate (ADP). The ADP is detected with nanomolar sensitivity by converting it to oligomeric RNA with polynucleotide phosphorylase and detecting the oligomeric RNA with a fluorescent dye. The product sensitivity of the new assay is 1000-fold greater than that of the standard assay that follows the absorbance decrease resulting from the conversion of NADPH to NADP+. This sensitivity allows inhibitor screening to be performed at the low substrate concentrations needed to make the assay sensitive to competitive inhibition of MurB.
Introduction
The enzyme UDP-N-acetylenolpyruvylglucosamine reductase (E.C. 1.1.1.158, referred to hereafter as MurB) catalyzes an essential cytoplasmic step in the biosynthesis of bacterial peptidoglycan. 1 MurB uses NADPH to reduce UDP-N-acetylenolpyruvylglucosamine (UNAGEP) to UDP-N-acetylmuramic acid (UNAM). MurB is a suitable target for discovery of novel antibacterial compounds because peptidoglycan biosynthesis is essential for the survival of most pathogenic bacteria, but the pathway is absent from human cells. Several studies have described MurB inhibitors,2–5 but none appear to have advanced toward clinical testing so far. Further efforts to identify MurB inhibitors are warranted.
High-throughput screening (HTS) of large collections of diverse compounds is commonly employed as a starting point for drug discovery efforts. This approach requires a suitable high-throughput-compatible assay. MurB activity is generally quantified by measuring the decrease in 340-nm UV absorbance of NADPH as it becomes oxidized to NADP+. Although it is compatible with HTS automation, this assay method has two disadvantages. First, the ultraviolet absorbance measurement is prone to interference from the absorbance of the compound samples being tested. Second, the assay is relatively insensitive to product formation because the small difference between the 340-nm extinction coefficients of NADPH and NADP+ (6,200 M−1.cm−1) requires about 100 μM product to generate a usefully large absorbance change of 0.3 units in a multiwell plate format with a 5-mm path length. The decrease in the 460-nm fluorescence of NADPH could be used as an alternative with better sensitivity, but this method of detection suffers from a high rate of interference from test compound autofluorescence, as well as quenching due to absorbance of the 340-nm UV excitation light by test compounds. Better MurB assay methods could improve the likelihood of successful inhibitor lead identification by HTS by making it possible to perform the assay at substrate concentrations similar to their Michaelis constants (Km), which are in the low-micromolar range for Escherichia coli MurB (see the following), thereby making the screen sensitive to competitive inhibition.
In this article, we describe a novel, miniaturizable, homogeneous, high-throughput-compatible assay for MurB activity that is sensitive to nanomolar product formation and uses visible light excitation and fluorescence. The high sensitivity of the MurB assay allows it to be used to screen sensitively for substrate-competitive inhibitors by using substrate concentrations equal to their 1- to 2-μM Kms. The assay ( Fig. 1 ) couples the formation of UNAM by MurB to the adenosine triphosphate (ATP)–dependent formation of UNAM–L-alanine by the next enzyme in the peptidoglycan biosynthesis pathway, UDP-N-acetylmuramyl-L-alanine ligase (E.C. 6.3.2.8, MurC). The adenosine diphosphate (ADP) product of this reaction is then detected with nanomolar sensitivity by a recently described method 6 in which it is converted to polyadenylic acid (polyA) by polynucleotide phosphorylase (E.C. 2.7.7.8, PNP) in the presence of complementary polyuridylic acid (polyU). The resulting double-stranded RNA is detected with the fluorogenic nucleic acid dye RiboGreen. The assay can be used with either continuous or discontinuous measurement. The ability of the assay to detect competitive inhibition is demonstrated with NADP+ and thio-NADP+.
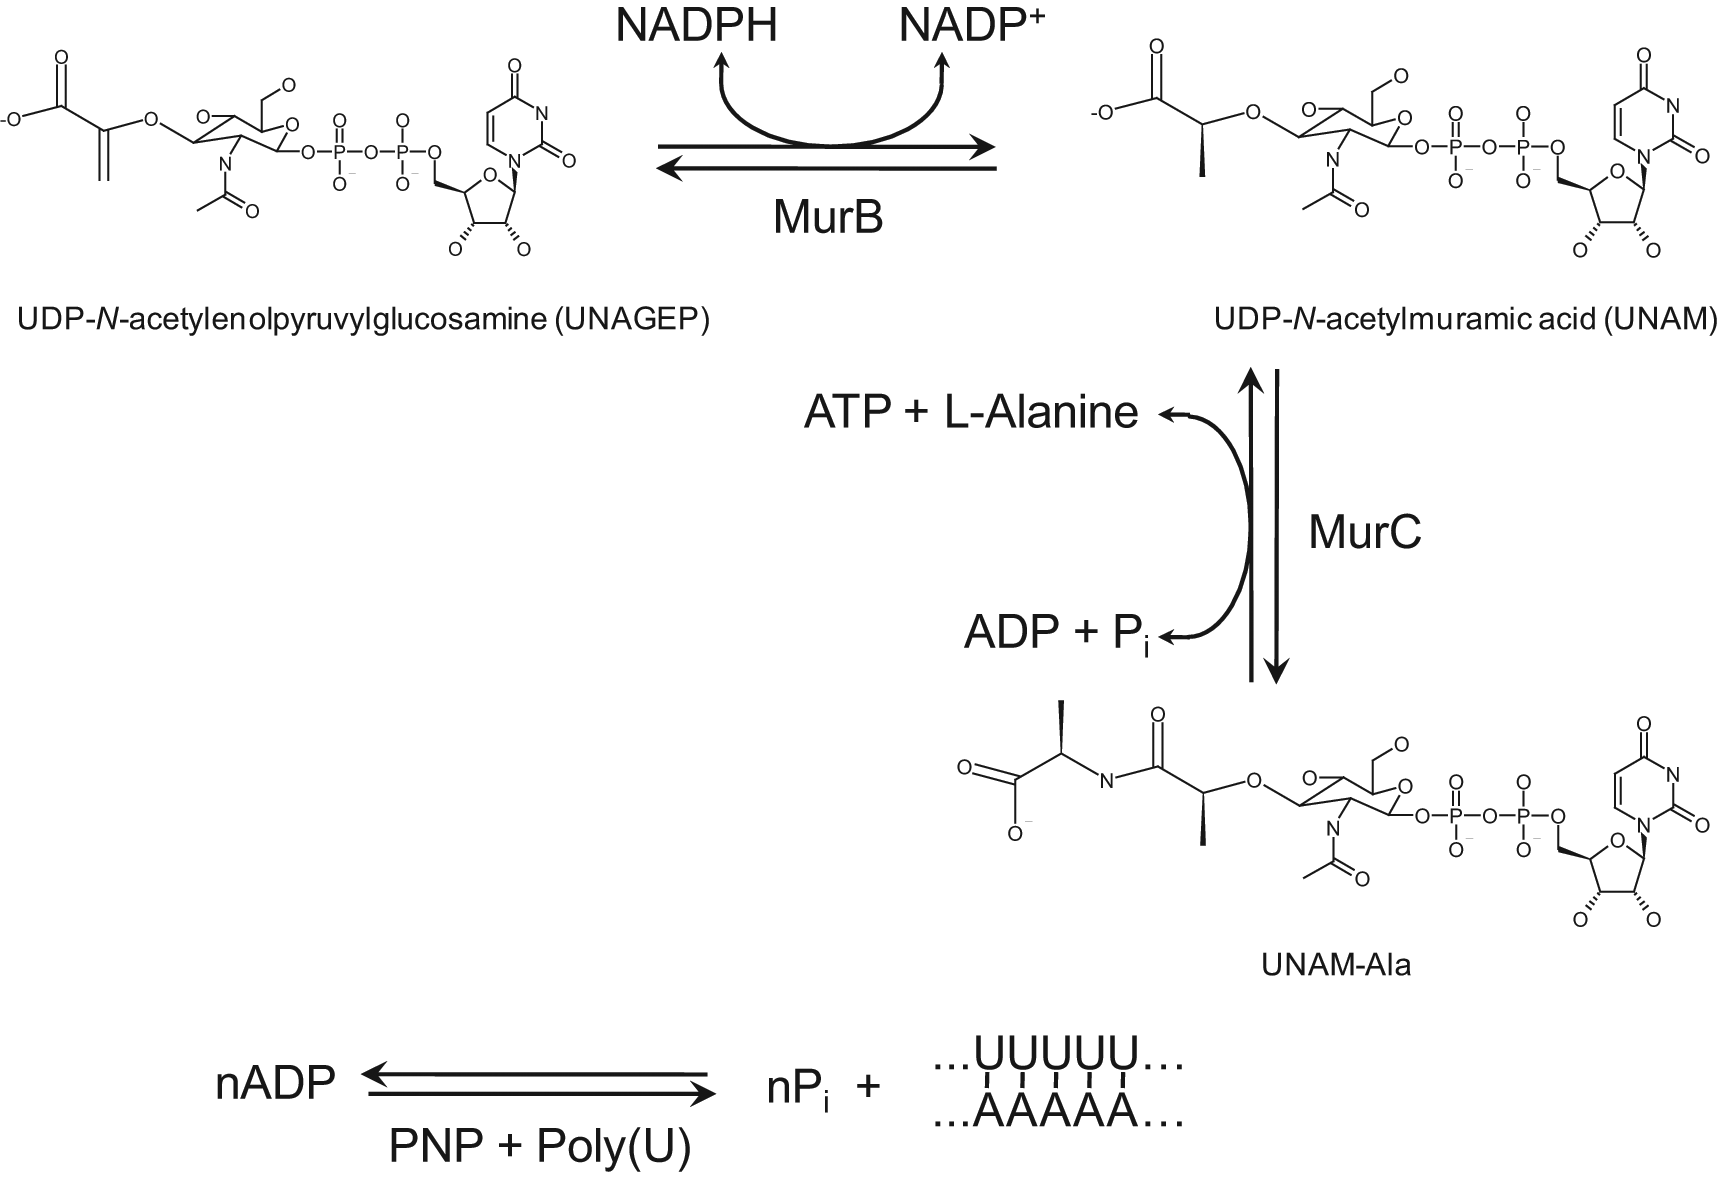
Reaction scheme of the MurB assay. MurB uses NADPH to catalyze the reduction of UDP-N-acetylenolpyruvylglucosamine (UNAGEP) to UDP-N-acetylmuramic acid (UNAM). MurC uses adenosine triphosphate (ATP) to catalyze the ligation of L-alanine to UNAM to form UNAM-Ala, adenosine diphosphate (ADP), and inorganic phosphate (Pi). Polynucleotide phosphorylase (PNP) catalyzes the production of polyadenylic acid (polyA) from ADP. PolyA forms double-stranded RNA with added polyuridylic acid (polyU). The double-stranded RNA is detected by an increase in RiboGreen fluorescence (not shown).
Materials and Methods
MurB Expression and Purification
E. coli strain DH5α was transformed with the plasmid pKen:MurB containing the E. coli murB gene, 7 grown in Luria-Bertani (LB) broth containing 50 μg/mL of ampicillin at 37 °C, and expression of the gene was induced with 1 mM isopropyl-β-D-thiogalactoside (IPTG) at a 600-nm optical density (OD600) = 0.58. Cells were collected at OD600 = 1.8 by centrifugation at 9000 g and frozen at −80 °C.
All operations were performed at 4 °C. Frozen cell paste from 6 L of culture expressing E. coli MurB was resuspended in 75 mL of lysis buffer, consisting of 25 mM Tris-HCl (pH 8.0), 250 mM NaCl, and 5 mM dithiothreitol, disrupted by two passages through a French press at 18 000 psi and centrifuged at 20 000 g for 30 min. The supernatant was brought to 1 M in (NH4)2SO4 and applied to a 16 × 120-mm Phenyl-Sepharose hydrophobic interaction chromatography column (GE Healthcare, Piscataway, NJ) equilibrated with Buffer A, consisting of 25 mM Tris-HCl (pH 8.0) and 5 mM dithiothreitol, plus 1 M (NH4)2SO4 at a 1.5-mL/min flow rate. The column was washed with the same solution until the 280-nm absorbance returned to the baseline, then eluted with a 200-mL linear gradient from 1 M to 0 M (NH4)2SO4 in Buffer A while collecting 10-mL fractions. E. coli MurB eluted at 0.7 M (NH4)2SO4. The fractions containing the MurB peak based on sodium dodecyl sulfate–polyacrylamide gel electrophoresis (SDS-PAGE) were pooled, dialyzed overnight against Buffer A, and applied at a flow rate of 4 mL/min to a 25 × 100-mm Q-Sepharose HP anion exchange column (GE Healthcare) equilibrated with Buffer A. The column was washed with Buffer A until the 280-nm absorbance returned to the baseline, then eluted with a 500-mL linear gradient from 0 M to 0.35 M NaCl in Buffer A while collecting 10-mL fractions. The fractions containing the MurB peak, based on SDS-PAGE, were pooled and concentrated to 10 mL using Amicon Ultra-15 10 000 MWCO (molecular weight cutoff) centrifugal concentrators (Millipore, Billerica, MA). The sample was applied at a flow rate of 2 mL/min to a 320-mL HiLoad 26/60 Superdex 200 gel filtration column (GE Healthcare) equilibrated with storage buffer consisting of 25 mM Tris-HCl (pH 8.0), 150 mM NaCl, 5 mM dithiothreitol, and 10% (v/v) glycerol. Fractions of 5 mL each were collected, and those containing the MurB peak were pooled. The protein was concentrated to 5 mg/mL and stored at −80 °C.
MurC Cloning, Expression, and Purification
The E. coli murC gene was cloned from E. coli MG1655 genomic DNA using polymerase chain reaction (PCR). Amplification was performed using High Fidelity PCR Master (Roche Applied Science, Indianapolis, IN) and the following primers, synthesized with Nde I and Sal I restriction sites (EuroFins MWG Operon, Huntsville, AL):
5′-GATCTGCATATGAATACACAA CAATTGGC-3′
5′-CAGTACGTCGACTCAGTCATGTT GTTCTTC-3′
The PCR product was purified using the QuickStep 2 PR Purification Kit (EDGE Biosystems, Gaithersburg, MD). The resulting fragment was digested with the restriction enzymes Nde I and Sal I (Roche Applied Science) and cloned into the appropriate sites of the expression vector pET-30a (Novagen, Gibbstown, NJ) to create pJT599. DNA sequence of the cloned murC gene was confirmed by sequencing on an ABI PRISM 3100 DNA sequencer (Applied Biosystems, Foster City, CA) using the Big Dye Terminator Cycle Sequencing Kit (Applied Biosystems). Computer analysis of DNA sequences was performed with Sequencher (Gene Codes Corp., Ann Arbor, MI).
The E. coli murC gene-containing plasmid pJT599 was transformed into E. coli BL21 Star (DE3) pLysS cells, plated onto LB agar with 100 μg/mL ampicillin, and grown overnight at 37 °C. A small streak from the plate was used to start an overnight culture at 37 °C in LB with 100 μg/mL ampicillin. This culture was used to start four 1-L overnight cultures in LB containing 100 μg/mL ampicillin in 4-L flasks starting at OD600 = 0.1 at 30 °C. Once the cultures reached OD600 = 0.57, the temperature was lowered to 23 °C, and expression of the murC gene was induced with 0.5 mM IPTG overnight. The cells were harvested at a final OD600 = 4.67 by centrifugation at 10 500 g for 15 min in 1-L bottles. MurC protein was purified as described previously. 8
The Haemophilus influenzae murC gene was cloned from H. influenzae Rd KW20 genomic DNA using PCR. Amplification was performed using High Fidelity PCR Master (Roche Applied Science) and the following primers synthesized with Nde I and Sal I restriction sites (EuroFins MWG Operon):
5′GATCTGCATATGAAACATCAACACCAA CATCAACACCAGCATCAGCACCAACAAC CATTAATGAAACATTCCCACGAAGAA-3′
5′-CATTGCTAGGTCGACTTAATTCTTCCAA GATTC-3′
The PCR product was purified using the QuickStep 2 PR Purification Kit (EDGE Biosystems). The resulting fragment was digested with the restriction enzymes Nde I and Sal I (Roche Applied Science) and cloned into the appropriate sites of a modified version of the expression vector pET-46 EK/LIC (Novagen) to create pJT608. This allowed fusion of an affinity purification tag (MKHQHQHQHQHQHQQPL) directly to the N-terminus of the H. influenza murC gene product. The DNA sequence of the cloned murC gene was confirmed and analyzed as described for E. coli murC.
The H. influenzae murC gene-containing plasmid pJT608 was transformed into E. coli BL21 (DE3) cells, plated onto LB agar plates with 100 μg/mL ampicillin, and grown overnight at 37 °C. A small streak from the plate was used to start an overnight culture at 37 °C in LB with 100 μg/mL ampicillin. This culture was used to inoculate 250 mL of Dual media set expansion broth (ZYMO Research, Irvine, CA) at OD600 = 0.1 with 100 μg/mL ampicillin in a 4-L flask overnight. At OD600 > 5.0, 750 mL of Dual media set overexpression broth (ZYMO Research) with 100 μg/mL ampicillin was added, and the culture was grown for 6.5 h at 30 °C. The cells were harvested at OD600 = 11.0 by centrifugation at 10 500 g for 15 min in 1-L bottles.
All H. influenzae MurC protein purification procedures were performed at 4 °C. MurC-overexpressing cells were resuspended in 200 mL of lysis buffer consisting of 25 mM Tris-HCl (pH 8.0), 0.3 M NaCl, 5% (v/v) glycerol, and four EDTA-free protease inhibitor cocktail tablets (Roche Diagnostics). The cells were lysed by French Press at 18 000 psi twice and then centrifuged at 130 000 g for 30 min. The supernatant was loaded at a flow rate of 2 mL/min onto a 60-mL Ni2+-chelating column (XK 26/20) (GE Healthcare) preequilibrated with Buffer B, consisting of 25 mM Tris-HCl (pH 8.0), 0.3 M NaCl, and 5% (v/v) glycerol. The column was washed with Buffer B and eluted with a 720-mL gradient from 0 to 0.5 M imidazole at a flow rate of 2 mL/min. Fractions containing MurC were identified by SDS-PAGE and pooled. Solid ammonium sulfate was added to a final concentration of 0.8 M, and the 100-mL sample was applied at a flow rate of 2.5 mL/min to a 20-mL Phenyl-Sepharose (HR16/10) hydrophobic interaction column (GE Healthcare) preequilibrated with Buffer C, consisting of 25 mM Tris-HCl (pH 8.0), 1 mM EDTA, 1 mM dithiothreitol, and 5% (v/v) glycerol, supplemented with 0.8 M ammonium sulfate. The column was washed with Buffer C supplemented with 0.8 M ammonium sulfate and eluted with a 160-mL gradient from 0.8 M to 0 M ammonium sulfate in Buffer C. MurC-containing fractions were identified by SDS-PAGE and pooled. Solid ammonium sulfate was added to 0.4 mg/mL, mixed on ice for 30 min, and then centrifuged at 100 000 g for 20 min. The pellets were dissolved in 22 mL of Buffer C. The sample was applied at a flow rate of 2 mL/min to a 320-mL Superdex 200 (HR 26/20) gel filtration column (GE Healthcare) preequilibrated with Buffer C supplemented with 0.15 M NaCl. The column was eluted with the same buffer. Fractions containing MurC were identified by SDS-PAGE and pooled. The sample was diluted at a 1:3 ratio with Buffer C to reduce the conductivity and applied at a flow rate of 2 mL/min to a 60-mL Q-Sepharose (XK 26/20) anion-exchange column (GE Healthcare) equilibrated with Buffer C. The column was washed with the same buffer and eluted with a 600-mL gradient from 0 to 1 M NaCl in Buffer C at a flow rate of 2 mL/min. Fractions containing MurC were identified by SDS-PAGE and pooled. The pooled fraction was concentrated to about 45 mL using Amicon Ultracel-10K centrifugal ultrafiltration units (Millipore) and dialyzed overnight against 2 L of storage buffer consisting of 20 mM Tris-HCl (pH 8.0), 150 mM NaCl, 1 mM dithiothreitol, 1 mM EDTA, and 10% (v/v) glycerol. The protein was flash frozen, then stored at −80 °C. The protein concentration was determined by the method of Bradford. 9
PNP and ADP-depleted ATP were prepared as described previously. 6 PolyU was obtained from Sigma (St. Louis, MO) or Midland Certified Reagent Co., Inc. (Midland, TX). The preparation of rhodamine-labeled phosphate binding protein (Rh-PBP) was described previously. 11 6-Iodoacetamidotetramethylrhodamine was purchased from Toronto Research Chemicals (North York, Ontario, Canada).
UNAGEP Preparation
UNAGEP was synthesized enzymatically. The reaction contained 50 mM Tris-HCl (pH 8.0), 25 mM KCl, 23 mM UDP-N-acetyl-D-glucosamine (Sigma), 112 mM phosphoenolpyruvate (Chem-Impex, Wood Dale, IL), and 40 mM dithiothreitol (Chem-Impex). The pH of the reaction mixture was adjusted to 8.0 with NaOH before adding 10 mg of UDP-N-acetylglucosamine 1-carboxyvinyltransferase (MurA, E.C. 2.5.1.7) from E. coli. See supplementary materials for the preparation of MurA. Another 5 mg of MurA was added after 5 h, and the reaction was allowed to proceed for another 16 h. The reaction was monitored by reverse-phase high-performance liquid chromatography (HPLC) using Agilent 1100 HPLC equipment (Agilent Technologies, Santa Clara, CA). The analytical HPLC separation was isocratic with 50 mM ammonium acetate (pH 3.7) at ambient temperature and a flow rate of 1 mL/min using a 4.6 × 100-mm T3 Atlantis C18 column with a 5-μm particle size (Waters, Milford, MA). UNAGEP eluted at 3.5 min. UNAGEP was then purified using a 19 × 100-mm, 5-μm particle size T3 Atlantis reverse-phase C18 column (Waters) and a preparative HPLC system (Gilson, Inc., Middleton, WI) with a 20-mL/min flow rate. The mobile phase for the isocratic separation was 50 mM ammonium formate (pH 3.7). The column was washed with acetonitrile for 5 min between injections and reequilibrated with mobile phase for another 5 min. To remove ammonium ions from the UNAGEP, the HPLC-purified UNAGEP was diluted fivefold in 20 mM Tris-HCl (pH 8.0) to lower the conductivity of the solution below 7 milliSiemens and subjected to ion-exchange chromatography using a 20-mL Q-Sepharose column (GE Healthcare) equilibrated with 20 mM Tris-HCl (pH 8.0). UNAGEP was eluted from the column with 1 M Tris-HCl (pH 8).
Pi-depleted ATP was prepared by combining 20 mL of 0.1 M ATP-NaOH (pH 7.0) (Sigma) with 1 U/mL of bacterial nucleoside phosphorylase (Sigma) and 1 mM 7-methylguanosine (Sigma), incubating for 1 h at ambient temperature, and then removing the nucleoside phosphorylase with an Amicon Ultra-15 10 000 MWCO centrifugal ultrafiltration unit (Millipore) at 4 °C. The ATP was stored at −80 °C.
Liquid Chromatography/Mass Spectrometry MurB Activity Assay
Liquid chromatography/mass spectrometry (LC/MS) was performed on a Shimadzu (Columbia, MD) HPLC system connected to a ABSciex (Foster City, CA) QTrap 5500 mass spectrometer equipped with a turbo ion-spray ionization source and operated in the negative mode. Each 60-μL reaction of 100 pM E. coli MurB with 1.5 μM NADPH and 1.1 μM UNAGEP in 10 mM PIPES-NaOH (pH 7.0), 3 mM KCl, 2 mM dithiothreitol, 1 mM MgCl2, and 0.005% Triton X-100 was quenched with 4 μL of 50% (v/v) acetic acid. Then, 2 μL of the solution was injected on a 4 × 50-mm YMC (Kyoto, Japan) Pro C18 column with a 3-μm particle size. The mobile phase was 5 mM ammonium acetate (pH 5.6) in water (A) and 5 mM ammonium acetate (pH 5.6) in 1:1 methanol/acetonitrile (B). The separation was performed by a 1.2-min linear gradient from 3% to 95% B at a flow rate of 0.6 mL/min. The MurB reaction was monitored by quantifying the multiple-reaction monitoring (MRM) peak area of UNAM. The ion transition of UNAM was 678.0/79.0 amu. Mass spectrometer source conditions of curtain gas, gas 1, and gas 2 were set at 30, 50, and 40 psi, respectively. The ion spray voltage was 4500, and the temperature was 550 °C. The optimum voltage settings for the declustering potential, the collision energy, and the collision exit potential were 90, 150, and 9, respectively.
Results
The standard high-throughput assay method for MurB measures the oxidation of NADPH as it is used by MurB to reduce UNAGEP to UNAM by a decrease in 340-nm absorbance. An example of this continuous measurement is shown in
MurB is activated by monovalent cations, particularly K+ or NH4+. The K+ concentration dependence of E. coli MurB activation was measured with the NADPH absorbance assay ( Fig. 2 ) to be 3 mM, consistent with previous findings. 12 The mechanism by which K+ and similarly sized monovalent cations activate MurB is unknown, as is the location of the K+ binding site. Competition by MurB inhibitors with K+ binding in the active site is therefore a potential mode of inhibition. It is also possible, on the other hand, that inhibitors may interact most strongly with the K+-MurB complex. To allow for an equal likelihood of identifying both types of inhibitors, a K+ concentration equal to the Ka of 3 mM was used for all subsequent investigations.
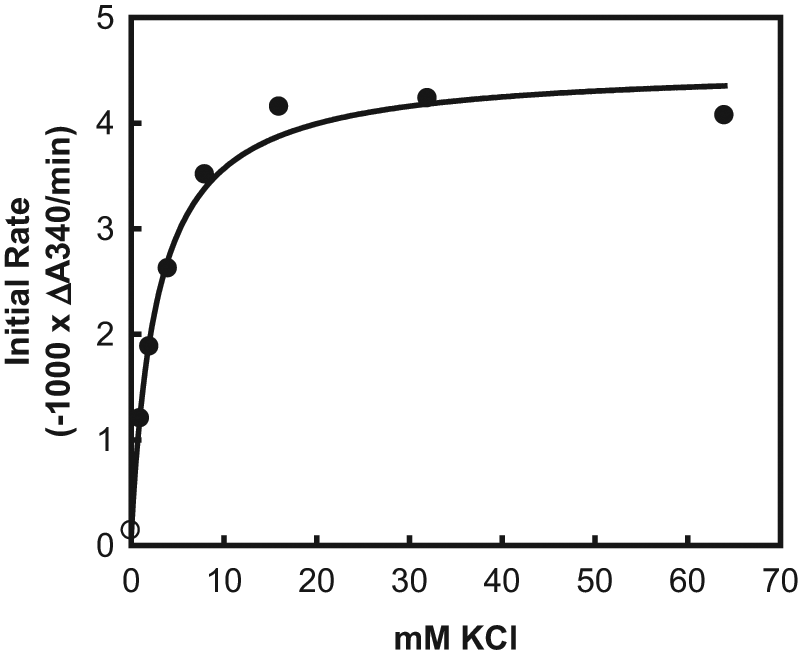
Activation of Escherichia coli MurB by K+ ion. The 75-μL assays were performed in clear polystyrene 384-well plates (Thermo Fisher Scientific, Hudson, NH) at ambient temperature. The reactions contained 20 mM Tris-HCl (pH 8.0), 1 mM MgCl2, 2 mM dithiothreitol, 0.005% Tween-20, 50 μM NADPH, 50 μM UDP-N-acetylenolpyruvylglucosamine (UNAGEP), 0.64 nM E. coli MurB, and various concentrations of KCl. Absorbance was measured at 10-s intervals for 200 s in a Spectramax plate reader (Molecular Devices, Sunnyvale, CA), and the initial rates were calculated from the slopes of the absorbance versus time plots. Data points represent single measurements. The data were fit by nonlinear least squares regression using the program SigmaPlot (SYSTAT Software, Chicago, IL) to the following equation: v = vo + a[K+]/(Ka+[K+]), where v is the rate at each K+ concentration, [K+] is the K+ concentration, vo is the rate without any K+, vo + a is the rate at saturating K+, and Ka is the activation constant for K+, the concentration at which activation is half-maximal. Ka was 3 mM.
To measure the kinetic constants for E. coli MurB, rhodamine-labeled phosphate binding protein (Rh-PBP) 11 was used in combination with MurC to detect inorganic phosphate (Pi) produced stoichiometrically with the reduction of UNAGEP ( Fig. 1 ). The advantages of Rh-PBP for this purpose are (1) it is sensitive to nanomolar concentrations of Pi, allowing it to be used to measure low-μM Kms, and (2) it provides a continuous measurement of Pi production with a linear response, allowing rates to be measured precisely from individual reactions.
A concentration of 250 nM MurC coupler was selected to convert fully the UNAM produced by 500 pM E. coli MurB to UNAM-Ala in the presence of 10 μM each of NADPH and UNAGEP ( Fig. 3A ), using 100 μM ATP and 1 mM L-alanine as the other MurC substrates. This selection was based on the observation that the rate of the Rh-PBP fluorescence increase, which is due to Pi produced by the MurC coupler reaction, increased as the MurC concentration increased, but there was little additional increase above 150 nM, indicating that the rate of the MurC coupling reaction was not rate limiting. Both E. coli and H. influenzae MurC isozymes had similar coupling activity and were used interchangeably and at the same concentration during this work. His-tagged H. influenzae MurC was introduced to allow the use of Ni2+-affinity chromatography during purification of the protein.
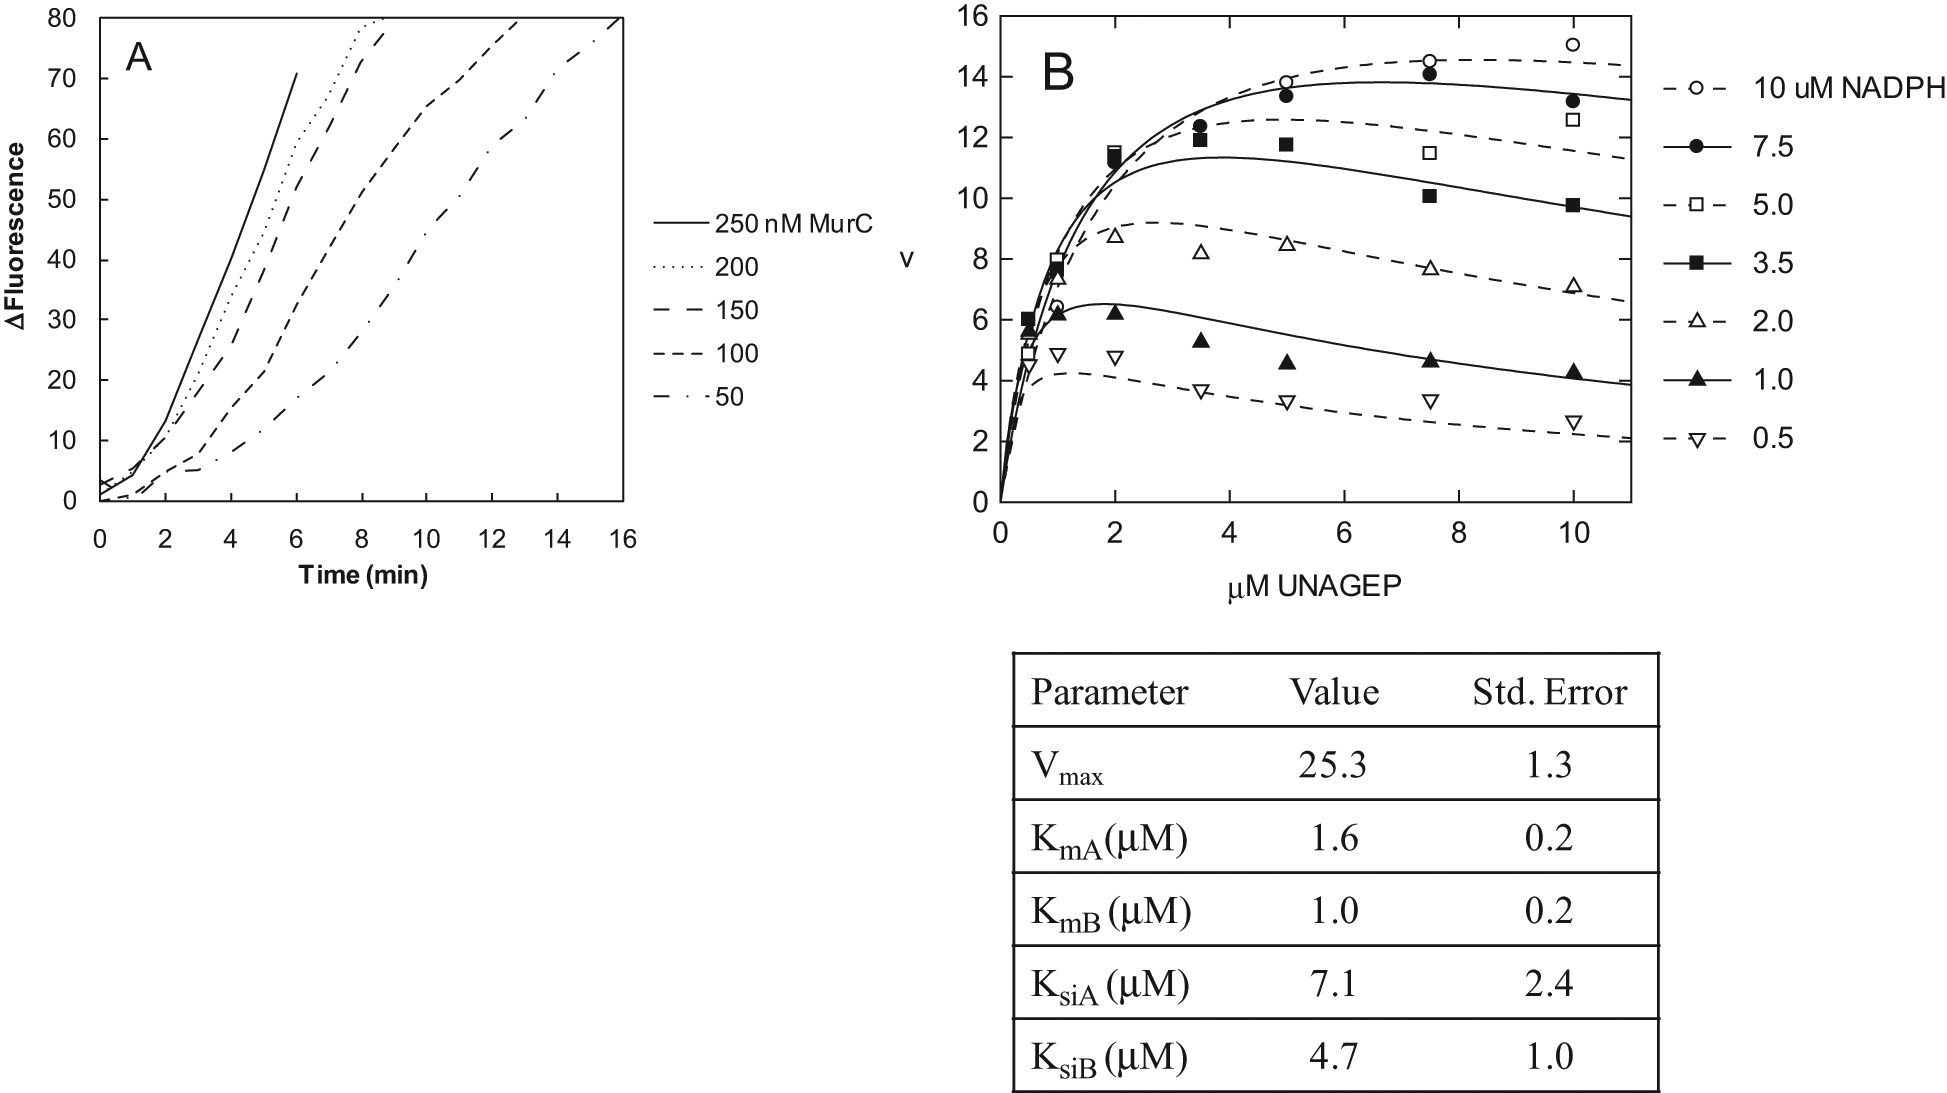
Continuous measurement of Escherichia coli MurB activity by coupling to MurC and detection of Pi with rhodamine-labeled phosphate binding protein (Rh-PBP). (A) Titration of MurC coupler concentration. The 10-μL assays were performed in black polystyrene 384-well low-volume plates (Thermo Fisher Scientific, Hudson, NH) at ambient temperature. The reactions contained 10 mM PIPES-NaOH (pH 7.0), 3 mM KCl, 1 mM MgCl2, 1 mM L-alanine, 2 mM dithiothreitol, 0.005% Tween-20, 0 to 250 nM E. coli MurC, 1 μM Rh-PBP, 500 pM E. coli MurB, 100 μM Pi-depleted adenosine triphosphate (ATP), 10 μM NADPH, and 10 μM UDP-N-acetylenolpyruvylglucosamine (UNAGEP). Fluorescence was measured at 1-min intervals with a Spectramax Gemini EM plate reader (Molecular Devices, Sunnyvale, CA) with three flashes/measurement. The excitation, emission, and cutoff wavelengths were 530, 590, and 550 nm, respectively. Traces are the averages of triplicate measurements. The background fluorescence at each time point measured in triplicate in the absence of MurB was subtracted. (B) Steady-state kinetic analysis of the E. coli MurB reaction, using the MurC/Rh-PBP detection system. The conditions were the same as in A, except that the NADPH and UNAGEP concentrations were both varied between 0 and 10 μM. The initial rates were measured from the fluorescence traces after calculating the averages of three replicate traces and subtracting the averages of three replicate background traces at each condition measured in the absence of MurB. Neither NADPH nor UNAGEP affected Rh-PBP fluorescence within the range of concentrations used. The resulting data were fit to the equation for the ping-pong bisubstrate kinetic mechanism with substrate inhibition by both substrates (below), using the program Grafit (Erithacus Software, Horley, Surrey, UK): v = Vmax[A][B]/{KmA[B](1 + [B]/Ksib) + KmB[A](1 + [A]/Ksia) + [A][B]}, where v is the measured reaction rate; Vmax is the theoretical maximal reaction rate; [A] and [B] are the concentrations of NADPH and UNAGEP, respectively; KmA and KmB are the Michaelis constants for NADPH and UNAGEP, respectively; and Ksia and Ksib are the substrate inhibition constants for NADPH and UNAGEP, respectively. The values of the kinetic constants are in μM units, except for Vmax, which is in units of ΔRFU/min, where RFU stands for relative fluorescence units.
The steady-state kinetic study of E. coli MurB to measure the substrate Kms used the same conditions as in
The substrate Kms were 1.6 ± 0.2 μM for NADPH and 1.0 ± 0.2 μM for UNAGEP, and the substrate inhibition constants were 7.1 ± 2.4 μM for NADPH and 4.7 ± 1.0 μM for UNAGEP. For comparison, similarly low Kms for NADPH and UNAGEP of <1 μM and ~3.5 μM, respectively, were measured at pH 8 and 20 mM K+ at 25 °C. 13 On the other hand, higher Kms of 17 μM for NADPH and 19 μM for UNAGEP were measured at pH 7 and 50 mM K+ at 37 °C. 12 Substrate inhibition constants for NADPH and UNAGEP of 250 μM and 8 μM, respectively, were reported. 12 It seems likely that the differences between measurements of kinetic constants by different researchers are largely attributable to differences in the assay conditions. Consistent with this idea, we observed that increasing the pH to 8.0 (with 50 mM Tris-HCl) and the Mg2+ concentration to 10 mM resulted in a different set of kinetic constants, as follows: Km(NADPH) = 4.6 ± 0.6 μM, Km(UNAGEP) = 3.9 ± 0.4 μM, Ksi(NADPH) = 280 ± 170 μM, and Ksi(UNAGEP) = 10 ± 2 μM.
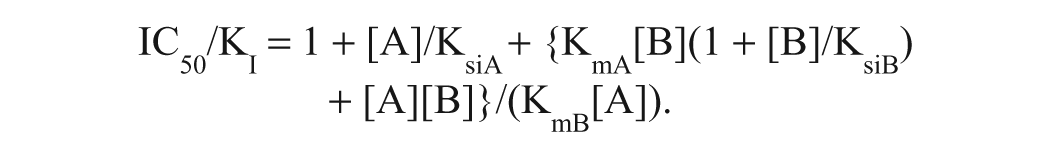
A high-throughput enzyme assay for MurB, if it is to be equally sensitive to detection of inhibitors competitive with both substrates, typically should be conducted at substrate concentrations similar to their Kms. 14 The low-μM substrate Kms of E. coli MurB dictate that such an assay must be sensitive to the formation of nanomolar product concentrations. Although Rh-PBP was a useful reagent for monitoring the nanomolar product formation by the MurB reaction when coupled with MurC, it has two disadvantages for HTS. (1) It is difficult to make in the quantity required for testing large compound libraries containing ~10 6 samples. (2) It is challenging to eliminate all sources of phosphate contamination from the reagents and automated equipment to maintain a low enough background for Rh-PBP detection. We therefore developed a high-throughput-compatible E. coli MurB assay using MurC as a coupler to produce ADP and the PNP + RiboGreen detection system to detect the ADP with nanomolar sensitivity. 6 The assay was developed using the conditions described in the legend to Figure 3 , including 1 mM Mg2+, because the low Mg2+ concentration is desirable for high sensitivity in the PNP + RiboGreen assay. The assay contained 1.5 μM NADPH and 1.1 μM UNAGEP. Using the method of Cheng and Prusoff, 15 we calculate that the ratio between a MurB inhibitor’s IC50 (the concentration producing 50% inhibition) and its inhibition constant (KI) under these conditions would be 3.2 for an inhibitor competitive with NADPH and 3.8 for an inhibitor competitive with UNAGEP. The equations used for these calculations, derived from a ping-pong bisubstrate kinetic mechanism with substrate inhibition by both substrates (see Fig. 3 legend), are shown below.
For inhibitor competitive with NADPH:

For inhibitor competitive with UNAGEP:
Development of the MurB assay using MurC and PNP as couplers and RiboGreen and polyU for detection was begun by determining a suitable concentration of PNP. The E. coli MurB and PNP concentrations were varied, and the slope of the RiboGreen fluorescence increase was measured continuously. Figure 4A shows that the MurB concentration response of the reaction rate was maximal with 100 nM PNP, and the rate of fluorescence increase was proportional to the MurB concentration from 0 to 200 pM. Figure 4B confirms by LC/MS that the production of UNAM was directly proportional to the reaction time.
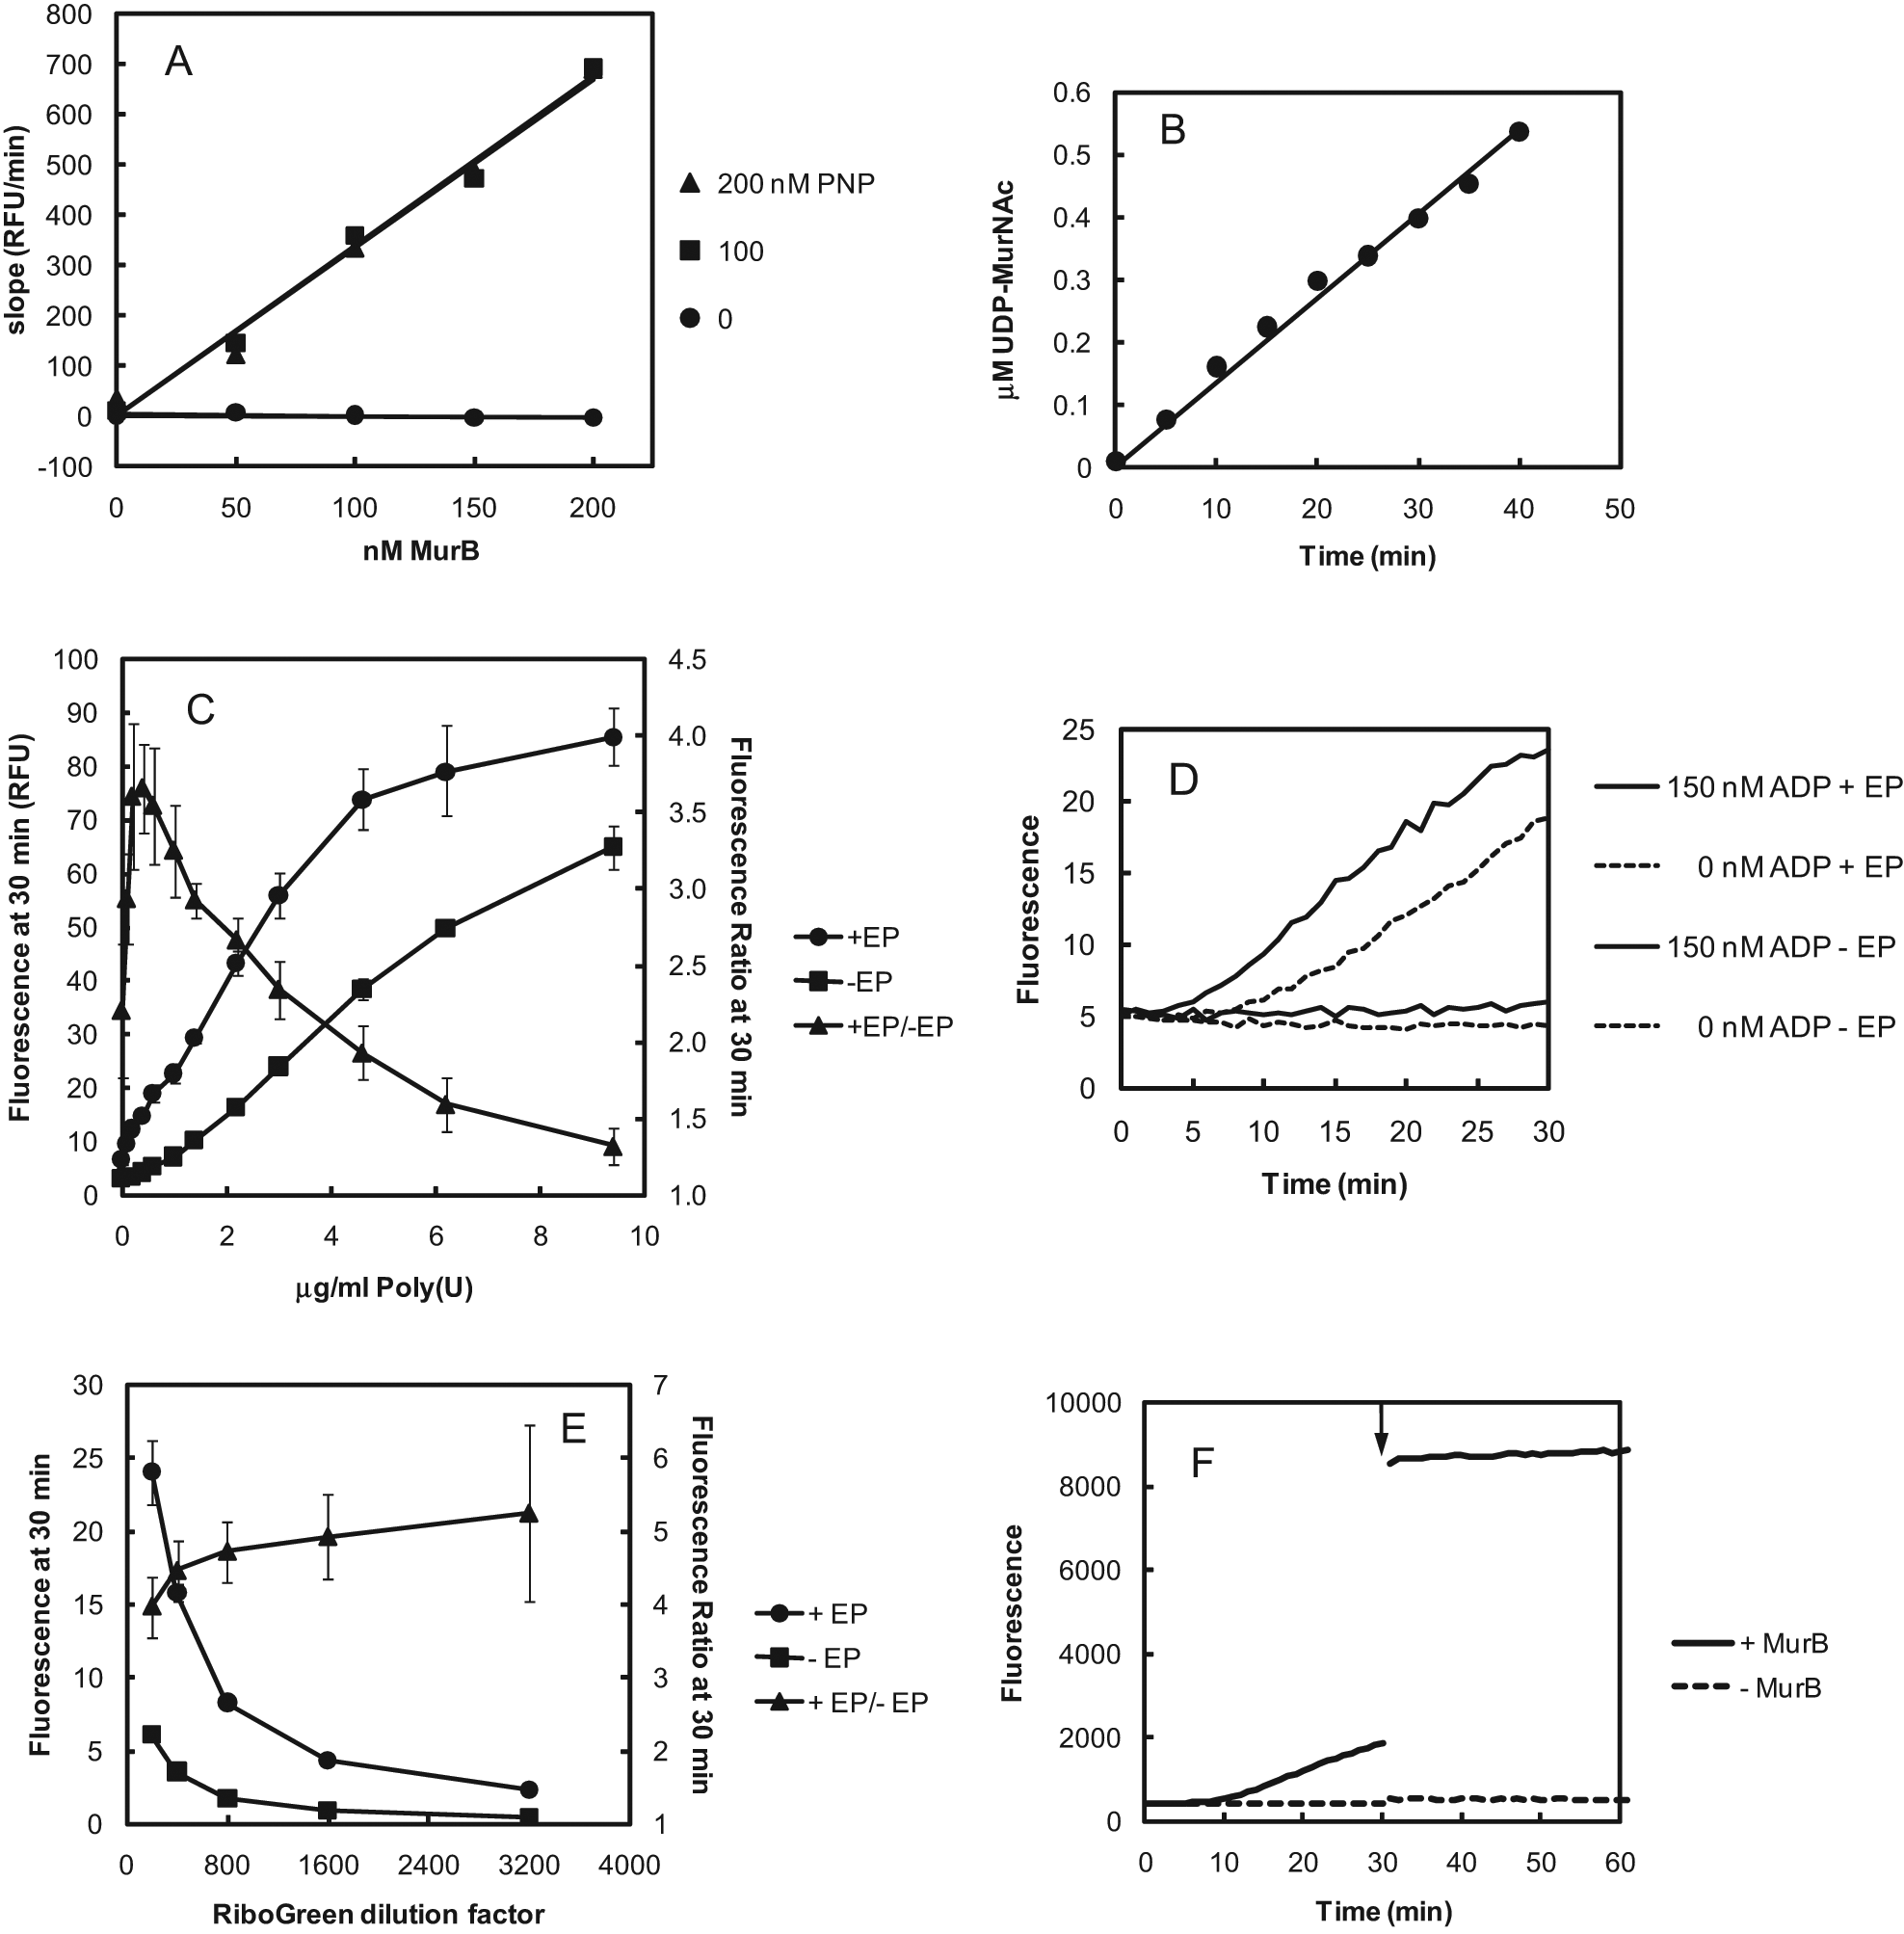
Optimization of conditions for MurB assay with MurC and polynucleotide phosphorylase (PNP) couplers and polyuridylic acid (polyU) + RiboGreen detection. (A) Dependence of the rate of fluorescence increase in the MurC- and PNP-coupled MurB assay with RiboGreen + poly(U) detection on the MurB and PNP concentrations. The 30-μL reactions contained 0 to 200 pM Escherichia coli MurB, 0 to 200 nM PNP, 250 nM Haemophilus influenzae MurC, 1.5 μM NADPH, 0 or 1.1 μM UDP-N-acetylenolpyruvylglucosamine (UNAGEP), 200 μM adenosine diphosphate (ADP)–depleted adenosine triphosphate (ATP), 0.6 μg/mL polyU, 1:200 dilution of the RiboGreen stock solution provided by the manufacturer (Invitrogen, Carlsbad, CA), and 1 mM L-alanine in buffer consisting of 10 mM PIPES (pH 7.0), 3 mM KCl, 1 mM MgCl2, 2 mM dithiothreitol, and 0.005% Tween-20. Reactions were carried out in black polystyrene 384-well plates (Thermo Fisher Scientific, Hudson, NH). Fluorescence was measured at 1-min intervals with a Spectramax Gemini EM plate reader (Molecular Devices, Sunnyvale, CA) with excitation, emission, and cutoff wavelengths of 485, 535, and 515 nm, respectively, with three flashes/measurement. Slopes were calculated based on data measured between 6 and 30 min. Each data point represents a single well. The background for reactions without UNAGEP was subtracted for each data point. RFU, relative fluorescence units. Best-fit regression lines passing through the origin are shown. (B) Linear time course of UDP-N-acetylmuramic acid (UNAM) production by E. coli MurB measured by liquid chromatography/mass spectrometry (LC/MS; see Materials and Methods section). Data points represent single measurements without background subtraction. The best-fit line from linear regression passing through the origin is shown. (C) Dependence of the fluorescence signal-to-baseline ratio after a 30-min reaction on the polyU concentration. Reaction conditions were as described in the panel A legend. The MurB concentration was 200 pM, the PNP concentration was 300 nM, the UNAGEP (EP) concentration was either 0 or 1.1 μM, and the polyU concentration was varied as shown. The time courses for triplicate wells were averaged, and the ratios of fluorescence intensities at 30 min with (signal) and without (baseline) UNAGEP were calculated. For fluorescence intensities (left axis), the data points and error bars represent the means and standard deviations of triplicate measurements. For fluorescence ratios (right axis), the data points and error bars represent the means and standard deviations, respectively, of the ratios of the means of triplicate measurements of the fluorescence intensities on the left axis. (D) Continuous detection of MurB activity using MurC + PNP couplers and polyU + RiboGreen detection, and the effect of added ADP on the length of the detection lag phase. The assay was performed as described in the panel A legend, except that the polyU concentration was 0.4 μg/mL, and ADP was added at concentrations ranging from 0 to 330 nM. The traces are in the same order from top to bottom as the legend. EP, UNAGEP. (E) Effect of RiboGreen dilution on MurB assay performance. The assay was performed as described in the panel C legend, except that the initial ADP concentration was 150 nM and the RiboGreen dilution factor was varied from 1:200 to 1:3200. The time courses for five replicate wells were averaged, and the ratios of fluorescence intensities at 30 min with (+ EP) and without (– EP) UNAGEP were calculated. The data points and error bars on the left axis represent the means and standard deviations, respectively, of the fluorescence intensities. In many cases, error bars are smaller than data points. The data points and error bars on the right axis represent the means and standard deviations, respectively, of the ratios of fluorescence intensities. (F) Enhancement of signal-to-baseline ratio in MurB assay with EDTA. Prior to the addition of EDTA at 30 min (arrow), the 30-μL reactions contained 0 or 200 pM E. coli MurB, 1.5 μM NADPH, 1.1 μM UNAGEP, 250 nM H. influenzae MurC, 200 μM ADP-depleted ATP, 1 mM L-alanine, 300 nM PNP, 0.4 μg/mL polyU, and 1:1600 dilution of RiboGreen in buffer consisting of 10 mM PIPES (pH 7.0), 3 mM KCl, 1 mM MgCl2, 2 mM dithiothreitol, and 0.005% Tween-20. At 30 min, 10 μL of 32 mM EDTA in the same buffer was added for a final concentration of 8 mM. The pre-EDTA traces are the averages of 30 replicates. The post-EDTA traces are the averages of 3 replicates. Fluorescence was measured as in
The effect of the polyU concentration on the signal-to-baseline ratio is shown in Figure 4C . The fluorescence intensity after a 30-min reaction was compared with and without UNAGEP. Above the optimal polyU concentration of 0.2 to 0.6 μg/mL, increasing baseline fluorescence during the reaction reduced the signal-to-baseline ratio. This effect is thought to be due to an increasing proportion of the RiboGreen being bound to single-stranded polyU, which generates a lower fluorescence intensity than polyU bound to polyA:polyU duplex RNA. 6
When the RiboGreen fluorescence during the MurB reaction was monitored continuously, a lag phase was observed at the beginning of the reaction lasting about 8 min, after which the fluorescence increased in direct proportion to the reaction time ( Fig. 4D ). If UNAGEP was omitted, the fluorescence did not increase during the 30-min reaction. The origin of the lag is thought to be due, at least in part, to the necessity of generating sufficiently long strands of polyA to form stable duplexes with polyU at ambient temperature. In support of this idea, the lag phase could be reduced in duration by including ADP at the start of the reaction. In Figure 4D , the addition of 150 nM ADP reduced the lag phase to about 4 min without appreciably affecting the background. Further increases in the initial ADP concentration further decreased the length of the lag but led to a significant time-dependent increase in background fluorescence.
The effect of the RiboGreen concentration on the signal-to-baseline ratio in the MurB assay is shown in Figure 4E . The signal-to-baseline ratio increased as the RiboGreen dilution factor increased. This effect is attributed to the decrease in unbound RiboGreen background fluorescence as the dilution factor increased. The scatter in the measurements increased with increasing dilution factor, however, beginning with 1600-fold, due to the reduced fluorescence signal intensity.
DMSO is usually used as the solvent for compounds to be tested as inhibitors. The MurB assay was tested for its sensitivity to DMSO (
The final conditions for the high-throughput MurB assay were as follows: 200 pM E. coli MurB, 1.5 μM NADPH, 1.1 μM UNAGEP, 3 mM KCl, 250 nM MurC, 200 μM ADP-depleted ATP, 1 mM L-alanine, 300 nM PNP, 0.4 μg/mL polyU, 150 nM ADP, and 1:1600 dilution of RiboGreen. After 30 min, the signal-to-baseline ratio was typically about 4. The fluorescence can be measured as a stable end point by quenching the reaction with EDTA, which binds the Mg2+ required for both the MurC and PNP reactions. Chelation of the free Mg2+ enhances the signal-to-baseline ratio because Mg2+ decreases the sensitivity of polyA:polyU detection by RiboGreen. 6 As shown in Figure 4F , the addition of 8 mM EDTA prevented any further change in the fluorescence for at least 30 min and increased the signal-to-baseline ratio 4-fold from 4.2 at 30 min just before EDTA addition to 17-fold 30 min after EDTA addition.
With the proteins combined as one reagent and the other components combined as the second reagent, the signal and baseline (with and without UNAGEP, respectively) generated was essentially the same with freshly prepared reagents as with reagents that had been stored at ambient temperature for 4 h (data not shown). Such long-term stability is useful when screening large numbers of compound plates in a single day.
To conserve reagents, the MurB assay can be miniaturized. The assay was performed in black, low-volume 384-well plates (Thermo Fisher Scientific, Hudson, NH) in a volume of 6 μL. Half of the plate (192 wells) received the full reaction (signal), and half received the reaction without UNAGEP (baseline). The signal-to-baseline ratio without EDTA quenching was 4.0, and the Z′ was 0.78. 16
The ability of the MurB assay to detect inhibition of MurB was demonstrated using the product NADP+ and analog thio-NADP+, both of which have been reported previously to inhibit E. coli MurB. 12 The two compounds had similar inhibitory potency, with 50% inhibition at 15 and 11 μM, respectively ( Fig. 5A ). These values are lower than the reported Kis 12 of 510 and 130 μM, respectively. In contrast, a Kd of NADP+ for oxidized E. coli MurB (i.e., MurB containing flavin adenine dinucleotide [FAD] cofactor, rather than FADH2) of only 0.7 μM was obtained by spectroscopic measurements of binding. 17 It is probable that the affinities of NADP+ and thio-NADP+ are strongly affected by the conditions, such as the pH and the K+ and Mg2+ concentrations, as demonstrated by the substantial effect of the conditions on the substrate inhibition constant of NADPH (see above). To measure the affinities of NADP+ and thio-NADP+ for MurB with oxidized FAD cofactor under our assay conditions, we measured the quenching by the ligands of the fluorescence of the MurB-bound FAD cofactor.5,18 NADP+ and thio-NADP+ caused maximum quenching of about 14% and 30%, respectively, with half-maximal quenching (Kd) at approximately 5 μM and 2.5 μM, respectively ( Fig. 5B ). These values are in agreement with expectations based on the IC50s and the calculation of a value of 3.2 for the IC50/Ki ratio for compounds competitive with NADPH given above. The difference in the extent of maximal quenching between the two ligands may be due to a difference in the electronic interactions between the ligands and FAD or to a difference in the effects of the ligands on the environment of the FAD within MurB.
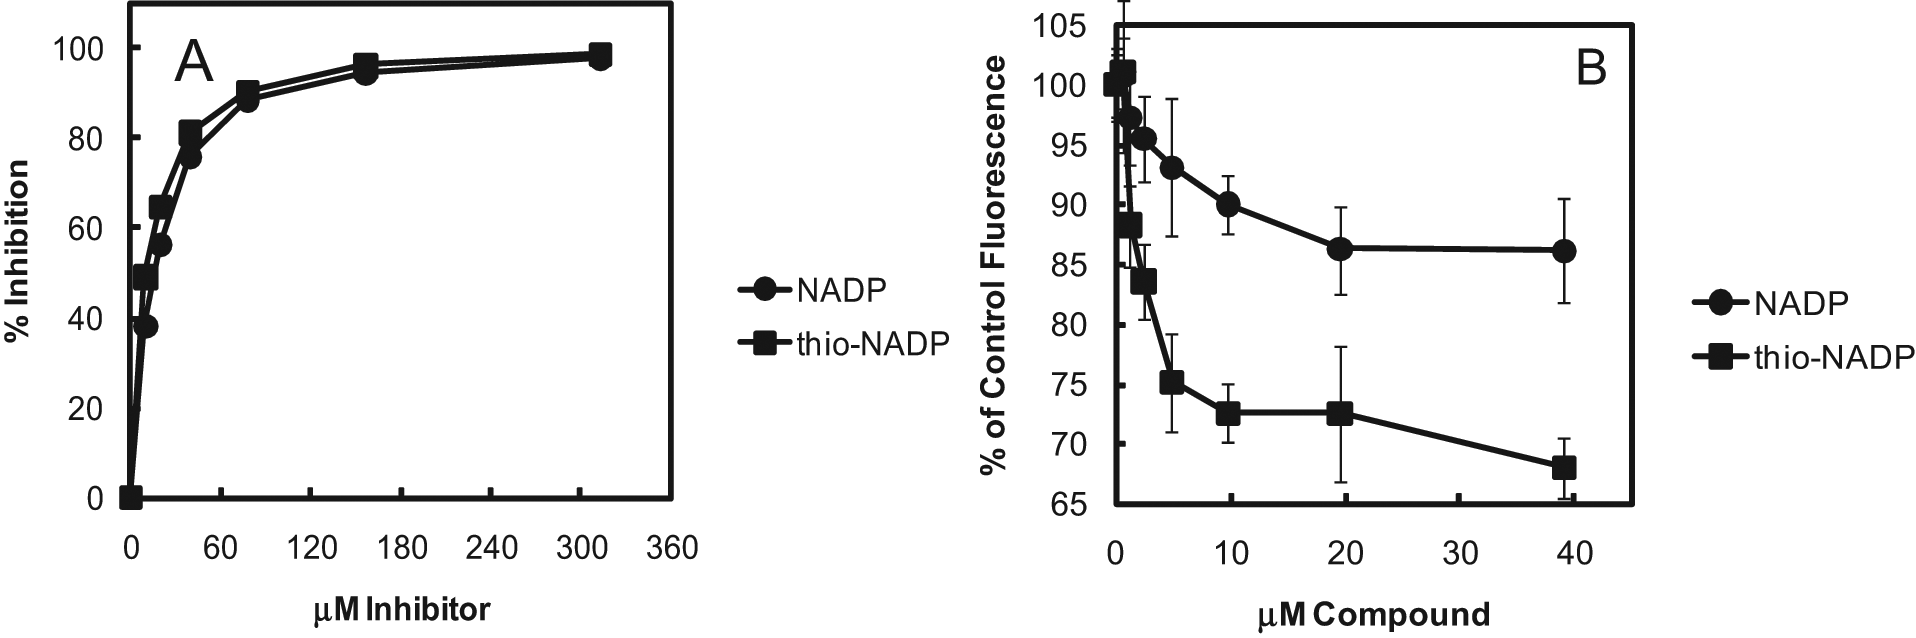
(A) Inhibition of Escherichia coli MurB by NADP+ and thio-NADP+ measured with the MurC/PNP/RiboGreen assay. The assay was performed as in the Figure 4F legend, except for the inclusion of twofold serial dilutions of pH-neutralized NADP+ or thio-NADP+ (Sigma, St. Louis, MO) and 150 nM adenosine diphosphate (ADP). The reactions were quenched after 30 min with 8 mM EDTA before the fluorescence was measured. Averages were calculated for triplicate measurements. The fluorescence from the control without MurB was subtracted for each inhibitor concentration. A correction was made for signal suppression by each concentration of the inhibitors using samples in which MurB was omitted and an additional 500 nM ADP was included to generate the signal (see Discussion section). Signal suppression was approximately 20% at 313 μM of both inhibitors. Percent inhibition was calculated based on the suppression-corrected fluorescence intensities. (B) Binding of NADP+ and thio-NADP+ to E. coli MurB measured by flavin adenine dinucleotide (FAD) cofactor fluorescence quenching. Twofold serial dilutions of NADP+ and thio-NADP+ and E. coli MurB at a 1-μM final concentration were combined in buffer consisting of 10 mM PIPES (pH 7.0), 3 mM KCl, 1 mM MgCl2, 2 mM dithiothreitol, 0.005% Tween-20 and 1 mM L-alanine. The FAD fluorescence was measured with a Spectramax M5 plate reader (Molecular Devices, Sunnyvale, CA) with excitation, emission, and cutoff wavelengths of 460, 520, and 515 nm, respectively. Data points and error bars represent the averages and standard deviations of duplicate measurements. NADP+ and thio-NADP+ had no detectable fluorescence. FAD fluorescence was approximately 100-fold greater than the background, which was therefore not subtracted.
A summary of typical conditions used for the MurC-coupled E. coli MurB assay with either Rh-PBP or PNP + RiboGreen detection is given in Table 1 .
Typical Conditions for MurC-Coupled Escherichia coli MurB Assay with Detection by Rh-PBP or PNP + RiboGreen
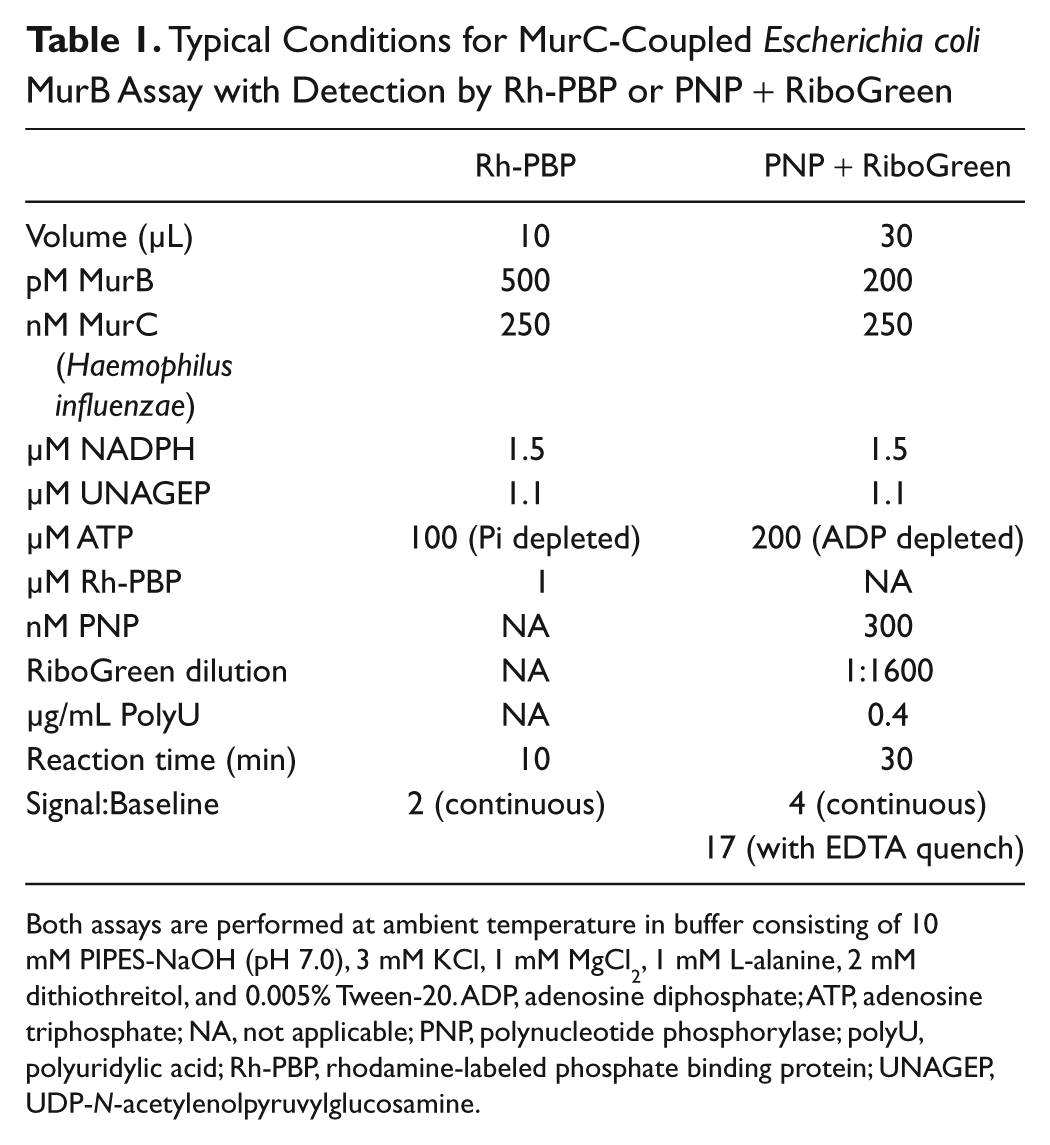
Both assays are performed at ambient temperature in buffer consisting of 10 mM PIPES-NaOH (pH 7.0), 3 mM KCl, 1 mM MgCl2, 1 mM L-alanine, 2 mM dithiothreitol, and 0.005% Tween-20. ADP, adenosine diphosphate; ATP, adenosine triphosphate; NA, not applicable; PNP, polynucleotide phosphorylase; polyU, polyuridylic acid; Rh-PBP, rhodamine-labeled phosphate binding protein; UNAGEP, UDP-N-acetylenolpyruvylglucosamine.
Discussion
The novel high-throughput MurB assay described in this article has several aspects that make it well suited for HTS for MurB inhibitors. (1) The assay provides the means to screen compound collections at substrate concentrations consistent with sensitive detection of competitive inhibitors. Despite the low-micromolar substrate Kms of E. coli MurB (1.6 μM for NADPH and 1.0 μM for UNAGEP), the assay has sufficient sensitivity to allow a screen to be performed at substrate concentrations equal to their Kms. Under these conditions, the assay is approximately equally sensitive to inhibitors competitive with either of the substrates, with IC50 only three- to fourfold the KI. (2) The assay can be miniaturized, conserving on reagents such as UNAGEP, MurC, and PNP that are not commercially available, as well as the commercially available detection reagents polyU and RiboGreen. We demonstrated satisfactory results for a 6-μL assay in a 384-well format. Thus, a large library can be screened at a relatively low cost for reagents. (3) The visible (fluorescein-like) wavelength excitation and emission of RiboGreen reduce optical interference from test compounds compared with the MurB assay based on the oxidation of NADPH and concomitant reduction in 340-nm UV absorbance or 460-nm fluorescence.
No high-throughput assay is free from interference by compounds, of course. We previously described a simple method to observe and correct for detection artifacts caused by test compounds. 19 This method involves the use of an “artifact assay” plate replicating each plate of compounds tested. In the case of the MurB assay, the artifact assay plate omits the MurB enzyme and adds a specific amount of ADP at the start of the reaction to provide approximately the same fluorescence signal that is obtained from the MurB reaction. Any excess fluorescence intensity observed in a well containing a compound sample, as compared with a control well with no compound, is assumed to be due to test compound fluorescence, and the excess intensity is subtracted from the fluorescence intensity of the corresponding well of the MurB reaction plate. On the other hand, any deficit in fluorescence intensity observed in a well containing a compound sample, as compared with a control well with no compound, is assumed to be due to fluorescence quenching or inner filter effect and is corrected by multiplying the fluorescence in the corresponding well of the MurB reaction plate by the ratio of the expected fluorescence to the measured fluorescence in the well of the artifact assay plate. In the MurB assay, another possible cause for a fluorescence deficit is interference by a test compound with RiboGreen binding to duplex RNA, which can also be corrected by the same method. Interference by compounds that act as nonspecific inhibitors of the MurC and PNP couplers may also be corrected by this method, although this form of interference may also be reduced by including substantial excess coupling capacity in the assay.
High-throughput assays for several other cytoplasmic steps in peptidoglycan biosynthesis could make use of the PNP + RiboGreen detection system to achieve nanomolar sensitivity of product detection, including the five ligases MurC, D, E, and F and D-ala-D-ala ligase, all of which produce ADP and therefore require no coupling enzyme other than PNP. Furthermore, assays for other enzymes in the pathway that do not produce ADP themselves could be set up by using the appropriate ligase as a coupler. Alanine racemase and glutamate racemase assays could use D-ala-D-ala ligase and MurD, respectively, as couplers. One advantage of using the highly sensitive PNP + RiboGreen detection system with these enzymes is the ability to screen for inhibitors at substrate concentrations low enough to be consistent with sensitivity to detect competitive inhibition despite Kms in many cases in the low- to mid-micromolar range. A second advantage is the ability to miniaturize the assay volume, thereby greatly reducing the amount of peptidoglycan precursor substrate required. This is particularly valuable for enzymes later in the pathway such as MurE and F because of the difficulty of preparing their substrates in large quantities. By facilitating the design of competitive inhibitor-sensitive high-throughput assays of the cytoplasmic steps of peptidoglycan biosynthesis, the PNP + RiboGreen detection system may improve the limited degree of success in finding inhibitors of these enzymes that are useful as leads for antibacterial drug discovery. 20
Several other methods have been described, in addition to the PNP + RiboGreen method, 6 for detecting sub-micromolar concentrations of ADP, as well as other ribonucleoside diphosphates in some cases, produced by enzymatic reactions in a high-throughput screening-compatible format. The advantages and disadvantages of commercial reagents, including Transcreener (Bellbrook Labs, Madison, WI), ADP Hunter (DiscoveRx, Fremont, CA), and Kinase-Glo (Promega, Madison, WI), have been reviewed. 21 Other methods have been described that may be suitable but are not currently commercially available.22–24 A key advantage of the PNP + RiboGreen method is its low cost relative to commercial reagents. Commercially supplied polyU and RiboGreen are inexpensive considering the low concentrations required. PNP can readily be prepared cheaply and in large quantity by routine methods of molecular biology and protein purification. Thus, the PNP + RiboGreen assay is well suited for economical screening of large compound libraries (e.g., 10 6 samples) for inhibitors of MurB and other enzymes.
Footnotes
Acknowledgements
Plasmids used for preparation of E. coli MurA and MurB proteins were obtained from Prof. Christopher T. Walsh of Harvard Medical School. Kathy MacCormack performed DNA sequencing. Richard Alm prepared MurA-containing cell paste.
The authors declared no potential conflicts of interest with respect to the research, authorship, and/or publication of this article.
The authors received no financial support for the research, authorship, and/or publication of this article.
References
Supplementary Material
Please find the following supplemental material available below.
For Open Access articles published under a Creative Commons License, all supplemental material carries the same license as the article it is associated with.
For non-Open Access articles published, all supplemental material carries a non-exclusive license, and permission requests for re-use of supplemental material or any part of supplemental material shall be sent directly to the copyright owner as specified in the copyright notice associated with the article.