
Abstract
Flow cytometry (FC) provides high-content data for a variety of applications, including phenotypic analysis of cell surface and intracellular markers, characterization of cell supernatant or lysates, and gene expression analysis. Historically, sample preparation, acquisition, and analysis have presented as a bottleneck for running such types of assays at scale. This article will outline the solutions that have been implemented at Novartis which have allowed high-throughput FC to be successfully conducted and analyzed for a variety of cell-based assays. While these experiments were generally conducted to measure phenotypic responses from a well-characterized and information-rich small molecular probe library known as the Mechanism-of-Action (MoA) Box, they are broadly applicable to any type of test sample. The article focuses on application of automated methods for FC sample preparation in 384-well assay plates. It also highlights a pipeline for analyzing large volumes of FC data, covering a visualization approach that facilitates review of screen-level data by dynamically embedding FlowJo (FJ) workspace images for each sample into a Spotfire file, directly linking them to the metric being observed. Finally, an application of these methods to a screen for MHC-I expression upregulators is discussed.
Introduction
To more accurately model physiological processes, cell-based phenotypic assays are used alongside target-centric biochemical assays for screening large chemical, genomic, and biological libraries to search for mechanisms and modulators of disease. In phenotypic assays, the response is the result of a complex summation of activities against one or potentially multiple cellular pathways, 1 and the phenotypic drug discovery approach can be agnostic to the underlying target(s) utilized to bring about this modulation. In biochemical assays, the desired activity is the result of a direct target–ligand interaction, where the target has been preselected. These approaches can be complementary and, taken together, help guide the drug discovery process.2–4
Phenotypic screening has the potential to cover multiple pathways present in the cell, which contains many potential targets for the compounds tested. As such, polypharmacology, where one compound modulates multiple pathways at a time, can influence the observed phenotype and selection of hits. This complexity makes it beneficial to use readouts that measure many markers across a wide range of biological processes to facilitate hit identification and prioritization. Assays capable of monitoring multiple parameters simultaneously, generally referred to as high-content readouts, are ideally suited for this application.5,6 In high-throughput screening (HTS), the use of high-content microscopy in assay formats employing adherent cells has been successfully applied. 7 Presently, cellular imaging platforms have become firmly established in the repertoire of detection technologies that are successfully applied to HTS campaigns to drive discovery in the industry. 8 This success is in part due to the availability of reliable automated microscopes, a variety of commercial plate washers, and proprietary and open-source platforms for cellular image analysis. While microscopy platforms are ideally suited for adherent cells, phenotypic models that use nonadherent cells cannot be easily interrogated to the same extent by these platforms. Also, while progress is being made to perform single-cell analysis of image-based datasets, the number of cells that can be seeded, resolved, and analyzed in miniaturized adherent cell assays often limits the detection of rare events.
Flow cytometry (FC), which measures objects in suspension, is especially applicable but not limited to the characterization of nonadherent cell assays. With the capability to detect more than 20 optical parameters per cell and a high collection rate (seconds) of tens of thousands of cells, FC provides sensitivity, dynamic range, and information content for phenotypic assay detection.9,10 Applications include cell surface and intracellular staining, detection of secreted proteins, 11 and analysis of gene expression, which can be measured individually or simultaneously.12,13 Coupling these capabilities with multiplexed formats, including fluorescent cell barcoding and bead- or particle-based antibody and probe capture assays, FC is an ideal choice for collecting high-content data. Examples of such technology include the QBead platform from Intellicyt (Albuquerque, NM)11,14,15 and the FirePlex and Firefly assays from Abcam (Cambridge, MA). 16 Traditional FC sample collection has limited this technology to low rates of throughput and has constrained its use to secondary or follow-up assays, which are performed downstream of larger screening campaigns. The slow speed of acquisition is primarily due to the mix, aspirate, purge, and clean steps employed by traditional microplate samplers. Typically, these apparatuses are incorporated as add-ons to mimic the manual tube-based sample collection. Here, additional time is also required for saving individual data files for each well sampled. 10 To increase the acquisition rate, alternative techniques have been developed. To enable high-throughput processing with FC, the HyperCyt system was introduced in 2001.17,18 This system employs a peristaltic pump to deliver samples from a microtiter source plate and separates each sample with an air bubble. The advent of this technology led to the iQue platform offered by Intellicyt. Additional examples include a system developed and in use at the Genomics Institute of the Novartis Research Foundation (GNF, La Jolla, CA). 19 Both platforms utilize an acquisition process similar to the one described above, coupled to a high-speed automated sample collection probe. Samples are delivered to the flow cytometer as a continuous segmented sample stream. This acquisition method forgoes the traditional steps of purging and cleaning the collection probe and sip in between samples. Additionally, the time needed to save each sample as a separate file is not needed as all data from one plate are saved to a single read file. Automated software then makes use of the alternately aspirated air gaps to segment data from each well into a discrete segment, which can then be analyzed in place by onboard software or exported as individual files that can be analyzed by other established methods. A variation of this sample collection method aspirates fluorescently labeled well separation beads along with air gaps to further enhance well separation and automated segmentation of samples postacquisition. Capable of being coupled with various levels of automation for plate feeding, these platforms offer attractive options for increasing the throughput of sample acquisition of FC and have enabled scale-up into multiplate 384- and 1536-well formats. Taken together, these advances have successfully brought FC into HTS labs.
While these advances have allowed many labs to incorporate high-throughput FC (HTFC) to their assay technology repertoire, 14 we found that the strategies for upstream automated plate processing needed to be devised. Likewise, the downstream process of multiplate data analysis for FC needed to be established. For laboratories at Novartis, this includes incorporation into the established data processing workflows, data visualization, and data formatting to facilitate uploading data to a centralized database. Here, we describe the strategy and processes our group implemented to automate sample preparation in a 384-well plate format and also detail the data processing and analysis strategies used to effectively implement a scalable HTFC pipeline.
Methods
Cell-Based Assay Setup
HTFC assays were set up in 384-well, flat-bottom plates (Greiner Bio-One, Monroe, NC, cat. 781091) by first seeding cells in appropriate assay media at concentrations ranging from 3000 to 10,000 cells in 30 µL per well. All dispenses of cells and necessary reagent additions were performed in a HEPA air-filtered cell culture hood with an EL406 peristaltic dispense manifold (BioTek, Winooski, VT). All plates were incubated at 37 °C, 5% CO2 in a Cytomat incubator (Thermo Fisher Scientific, Waltham, MA). When testing small-molecule libraries, test compounds and controls were arrayed in 384-well, Echo-qualified, low-volume plates (Labcyte, San Jose, CA, cat. LP-0200) in 90% DMSO, 10% deionized water. 20 Compounds were transferred to assay plates by an Echo 555 (Labcyte) acoustic liquid handler.
Cell Preparation for HTFC
For adherent cell lines, plates were washed as follows. An EL406 192 pin washer manifold was used to aspirate all but 10 µL from wells. A total of 60 µL of phosphate-buffered saline (PBS; Thermo Fisher Scientific, cat. 14190) was then added to wells with the EL406 peristaltic manifold. Wells were then aspirated as before. TrypLE cell dissociation reagent (Thermo Fisher Scientific, cat. 12605) was then added with the EL406 syringe pump, and plates were incubated at 37 °C, 5% CO2. All necessary staining antibodies were diluted to working concentrations in PBS + 5% fetal bovine serum (FBS; Hyclone, South Logan, UT) and dispensed as described above to each well in a 60 µL volume.
For suspension cell lines, cell preparation was performed by either a semiautomated method or a fully automated method. In the semiautomated method, all plates were centrifuged at 300g for 1 min in a Thermo SL40 laboratory benchtop centrifuge. Plates were then washed with an EL406 with integrated BioStack (BioTek), and each well was aspirated to leave all but 30 µL per well. Necessary reagents, including PBS, 20% paraformaldehyde (PFA; Electron Microscopy Sciences, Hatfield, PA), 0.1% Triton (Sigma, St. Louis, MO) in PBS, and blocking buffer PBS + 5% FBS, were then added into each well by sequential dispense, centrifugation, and aspiration steps. This cycle was repeated one to three times as required for each buffer exchange. All antibodies were diluted to the appropriate working concentration in PBS + 1% FBS and added to each well in 10 µL dispenses essentially as described above. Unbound antibody was then removed with a 2× wash with PBS + 1% FBS, leaving 90 µL per well. Plates were then sealed with a laboratory microplate sealer (Agilent, Santa Clara, CA) and analyzed as described. In the fully automated method, plates were processed on a robotic system that consists of an Orbitor (Thermo Fisher Scientific) plate mover formatted with an EL406 washer/dispenser and Agilent automated centrifuge using the Thermo Momentum version 3.2.2 scheduling and control software.
MHC-I Assay Conditions
Murine B16F10 cells (ATCC, Manassas, VA, cat. CRL-6475) were seeded at 9000 cells per well in 30 µL, treated, and processed essentially as described above, incubating the cells overnight after seeding and again incubating overnight after compound addition. Cells were made ready for FC using a procedure for adherent live cells, as described above. Cells were not fixed but kept at 4° C while awaiting analysis. As a positive control, mIFNγ (eBioscience-Thermo Fisher Scientific) was added at a concentration of 10 ng/mL. As a negative control, DMSO was added as described. To label the MHC-I receptor, anti-mMHC-I monoclonal antibody (H-2Kb) (eBioscience) was used to stain cells at a 1:2000 final dilution. After a 30 min incubation with antibody, plates were sealed and vortexed at 3000 rpm and then analyzed as described.
FC Sample Acquisition
All FC sample acquisition was performed on a first-generation iQue-HD flow cytometer with a blue and red laser configuration (IntelliCyt). This reader is coupled to an Orbitor plate mover (Thermo Fisher Scientific) configured with Momentum version 3.2 automation software. Each plate entered the system sealed, and wells were pierced with the sample probe during collection. The iQue dedicated software, ForeCyte version 4.1, was configured to collect samples from each plate as follows. With the collection probe pump set to 15 rpm and cytometer set to the medium speed, the probe and cytometer were first primed from the Q-Buffer (IntelliCyt) station for 60 s. This was followed by a 30 s preread plate vortex at 3000 rpm. Wells were then collected in a serpentine fashion with a 5–10 s sip, depending on event collection requirements, generally achieving 5000 events per well. FL4/RL-1 between well marker beads (IntelliCyt) was acquired with a 0.5 s sip between each well. Cells were kept in suspension by vortexing the plate at 3000 rpm for 10 s after every eight wells collected. A postread probe and cytometer rinse was conducted after each plate read by sipping from the decontamination buffer station for 120 s, then from the clean buffer station for 120 s, and finally from the water station for 240 s. After each full-plate acquisition, well segmentation was automatically performed in the ForeCyte software before moving on to the next plate.
FCS File Preparation
Automated well segmentation performed by ForeCyte software was visually checked to ensure proper gating between wells. Incorrect segmentation was manually corrected with tools included in the software. When necessary, channel compensation was performed in ForeCyte software after initial well segmentation and applied to the other plates in the same batch processed. Individual Flow Cytometry Standard (FCS) files were then exported from the iQue data drive to a location accessible for downstream processing.
Sample Analysis
All sample analysis was performed with FlowJo (FJ) software version 10.0.7 (Ashland, OR) and utilized the command line feature available with this software. To use this option, a series of command lines need to be generated for each set of samples grouped together based on plate barcodes. Detailed instructions for operating FJ in this fashion can be found in the software documentation located here (http://docs.flowjo.com/vx/advanced-features/fj-commandline/). For each analysis, a FJ template file was produced with a small subset of control well and sample well data.
To adapt FJ for high-throughput operation with the iQue data, we implemented a custom Jenkins-LSCI 21 job (FACS_FLOWJO_BATCH, https://github.com/Novartis/Jenkins-LSCI-Jobs). FACS_FLOWJO_BATCH guides users to select the appropriate FJ command line parameters for the iQue runs to be processed. This job generates a correctly formatted FJ batch file (BAT) that can execute the software in “headless” mode (without a graphical user interface). The unattended execution of this batch file generates the cellular parameter measurements and associated cell population distribution plots as specified in the FJ template file used for processing.
Data Analysis
Data processing was performed in HELIOS (Novartis internal client software capable of performing plate-based pattern corrections, normalizations, and curve-fitting routines).22,23 Processed data were then visualized in Spotfire (Tibco, Palo Alto, CA) software version 6.5, where data for each experiment were compiled. Spotfire interactive visualization features were used to display FJ cellular parameter measurements and the associated per-well population distribution plots as PNG thumbnails.
The PNG thumbnail visualizations were incorporated by linking to a unique file URL and rendered accordingly in Spotfire. The required URL list for each PNG file in a screen set is difficult to obtain manually. Instead, a list is generated by processing the PNG file location with a custom Jenkins-LSCI 21 job (Advanced_DIR_Merge, https://github.com/Novartis/Jenkins-LSCI-Jobs), producing a fully annotated PNG URL list that can be used in Spotfire.
The Z′ factor 24 was calculated using eq 1 as a measure of assay robustness of each plate screen.
Mathematical Equations
The Z′ factor or the MHC-I assay was calculated as
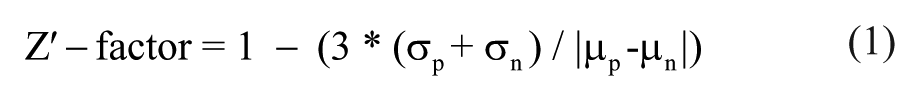
where σ is the standard deviation, µ is the mean, and the subscript p and n are the positive and negative controls, mIFNγ and DMSO-treated wells, respectively.
In the screening assays conducted, active compounds were designated by the z score, which was calculated as

where x is a data point value, µ is the sample mean, and σ is the sample standard deviation.
Results
Establishing a Workflow for HTFC Plate Preparation and Sample Acquisition
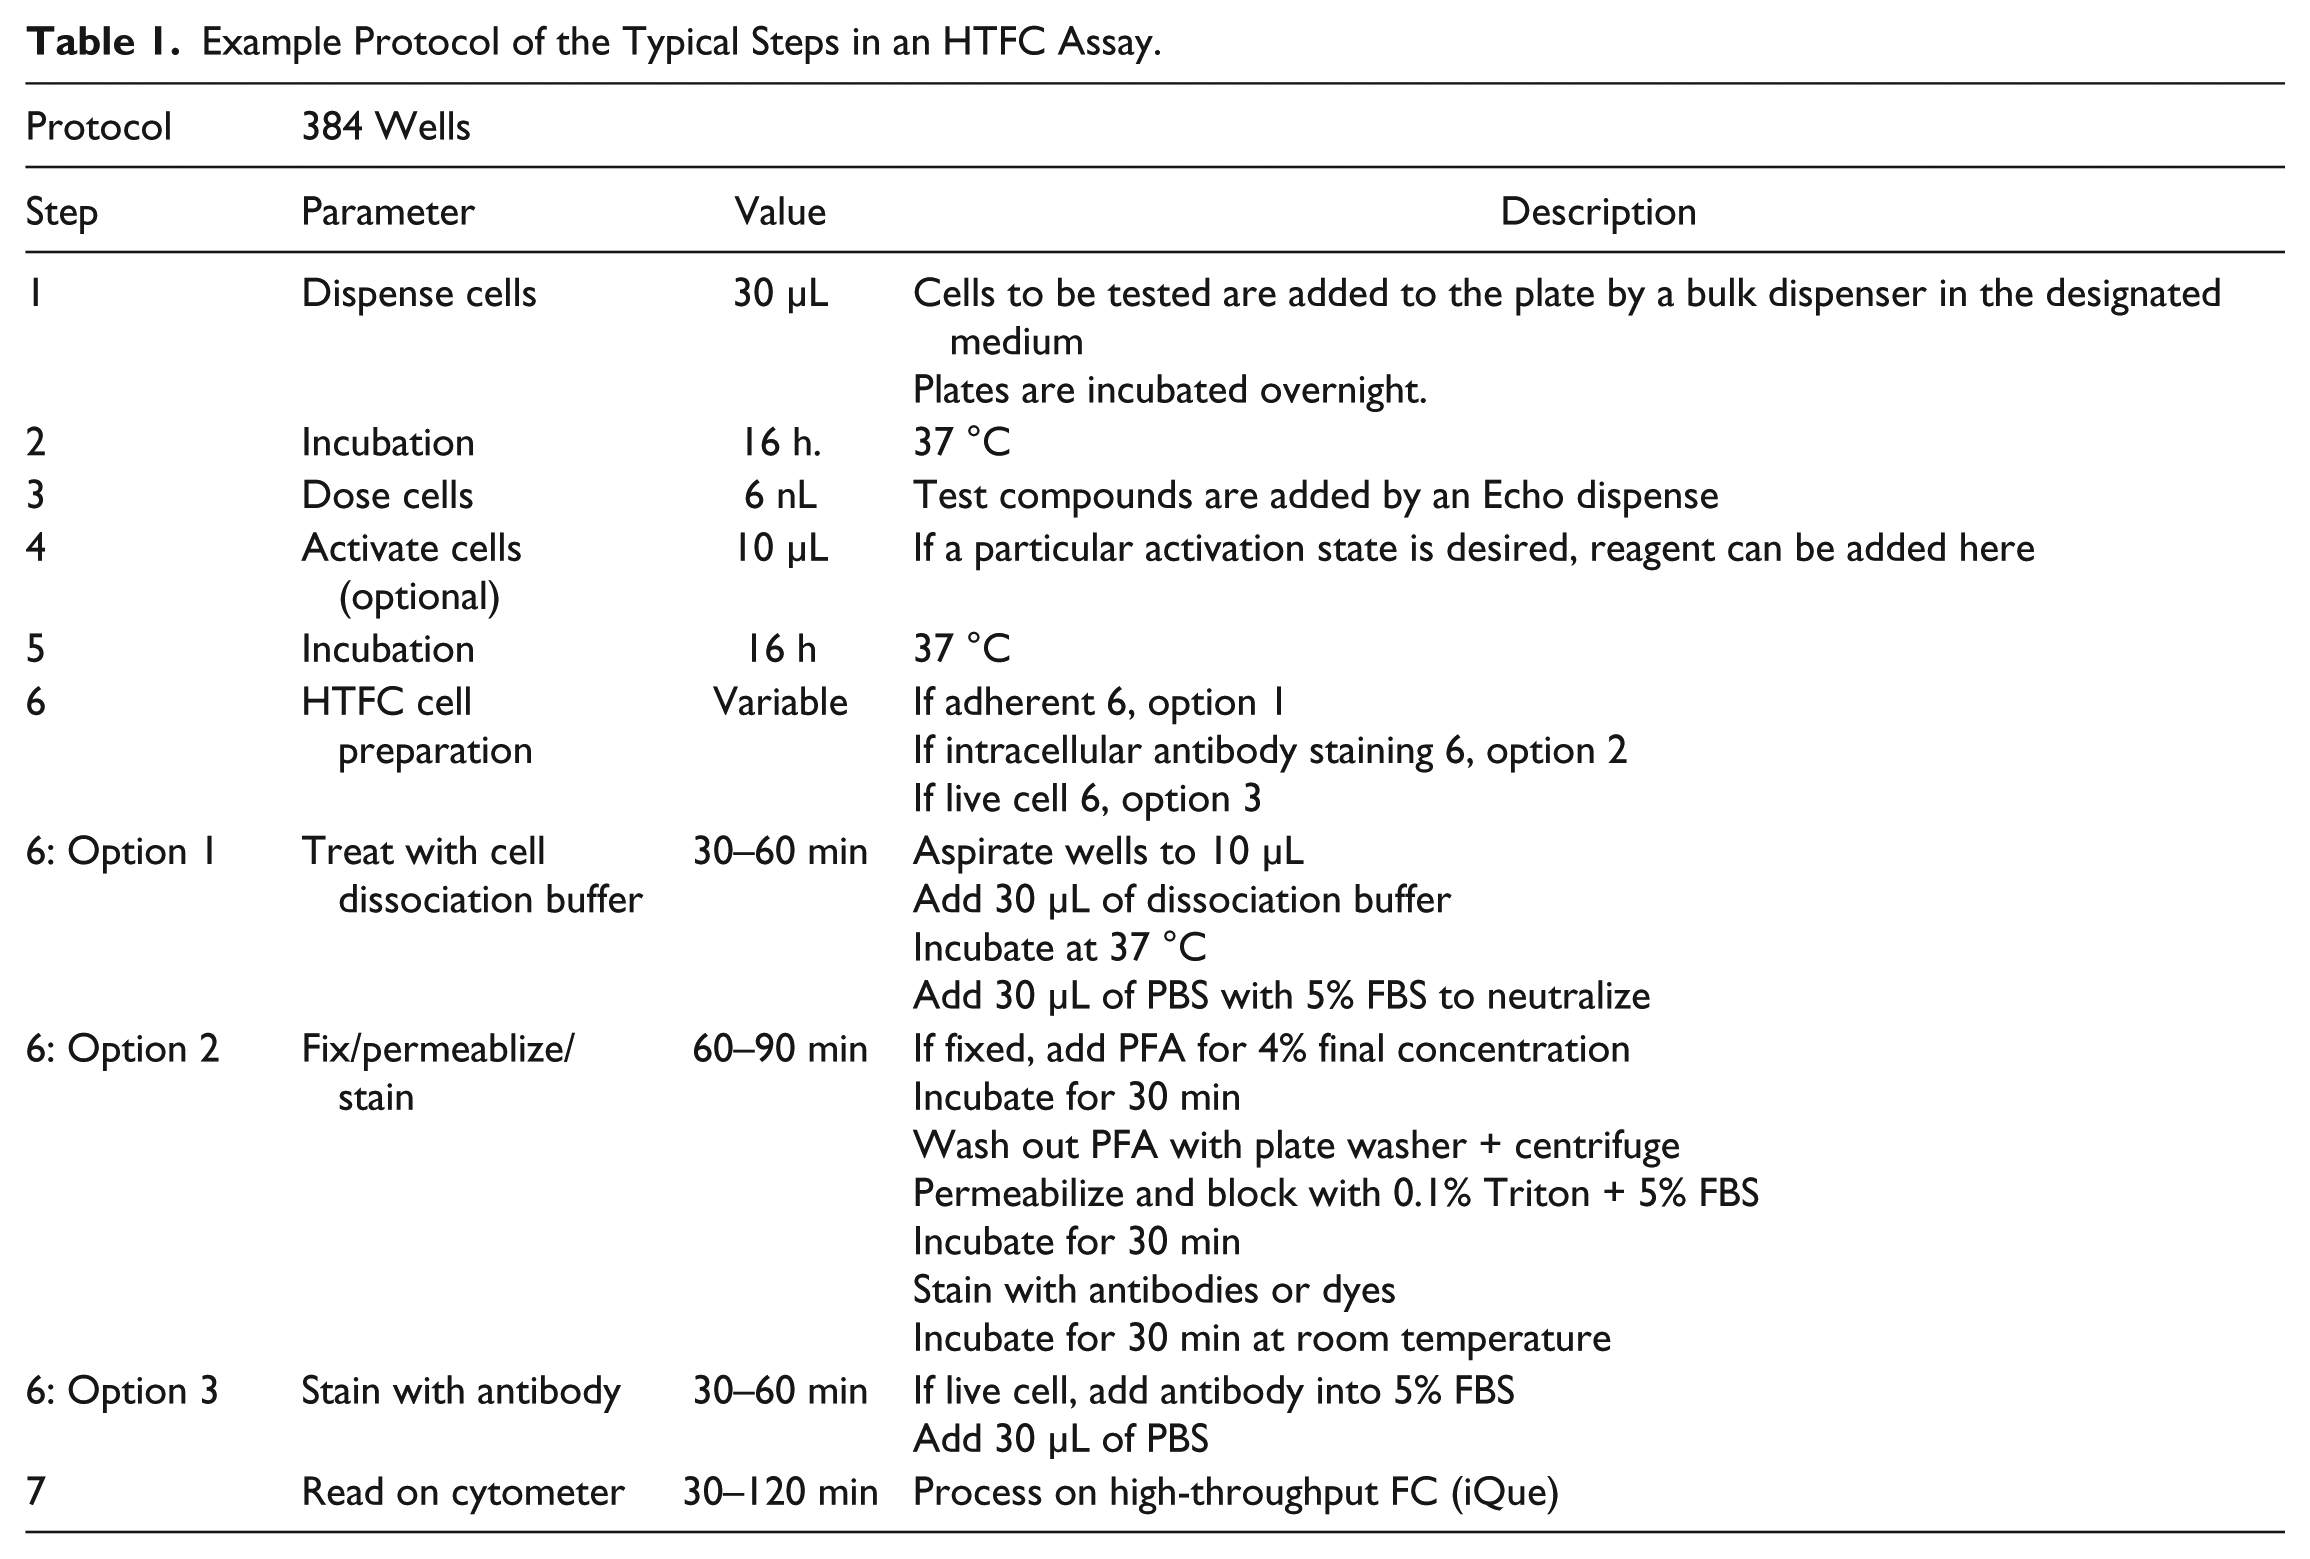
To establish a robust process for HTFC, it was necessary to merge general screening workflows with the common methods employed in FC sample preparation, the latter of which had not been standardized for high-throughput processing. As displayed in Figure 1A , under the assay setup header, a standard process for 384-well plates is conducted utilizing bulk dispensers for cell seeding and noncontact Echo transfer for compound addition. To standardize FC sample preparation for HTFC, the workflows displayed in Figure 1A under the HTFC preparation header were established. These options can be used individually or in combination and were optimized for fully automated plate processing. Option 1 would be used if an adherent cell line were being assayed. Option 2 would be used with protocols requiring cell fixation and surface and intracellular antibody staining. Option 3, when used alone, is the most straightforward workflow and would be used for live, nonadherent cell assays. Once HTFC preparation is complete, the samples can then be acquired. In our workflow, only one option under the acquisition header is available, which utilizes the iQue cytometer. The stepwise protocol is shown in Table 1 .
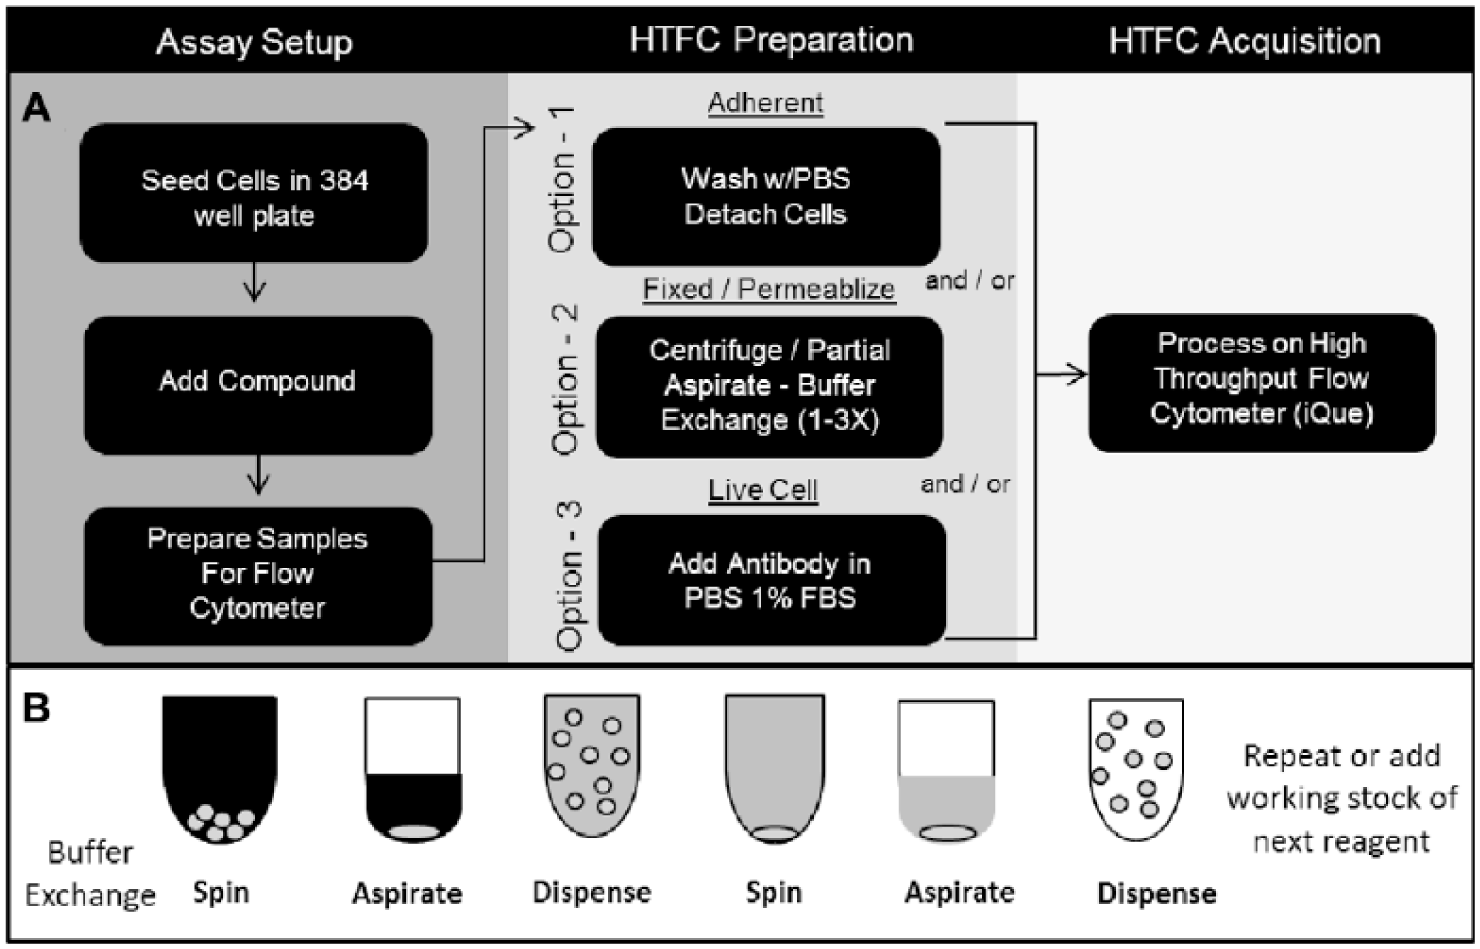
Summary of HTFC workflow. (
Example Protocol of the Typical Steps in an HTFC Assay.
In Figure 1A under the HTFC preparation header option 2, the steps highlighted—cell fixation, permeabilization, and staining—require detection reagents and buffers to be exchanged without inadvertent loss of cells. To accomplish this, we developed the method outlined in Figure 1B . Here, plates are first centrifuged at 300g and then partially aspirated down to 30 µL per well. This ensures that the cells are moved to the bottom of the well and not lost during aspiration. The new reagent is then gradually added to the well by dispensing 60 µL and then repeating the centrifugation and dispense steps. In practice, this cycle was performed up to three times for each exchange but was later reduced when experimental data showed that this did not negatively impact the readout. In an attempt to expedite the cell wash process, plate centrifugation was tested at higher centrifugal forces for less time, with undesirable results observed due to cell loss (data not shown).
This process was conducted first with a semiautomated method without the use of robotics to shuttle plates between an EL406 washer/dispenser and centrifuge. Later, a fully automated method was deployed on a robotic platform, shown in Figure 2 . Here, a bottleneck at the automated centrifuge step was observed and stemmed from a limitation of the system configuration. To remedy this, the design of automated systems for processing suspension cells should include multiple automated centrifuges when possible.
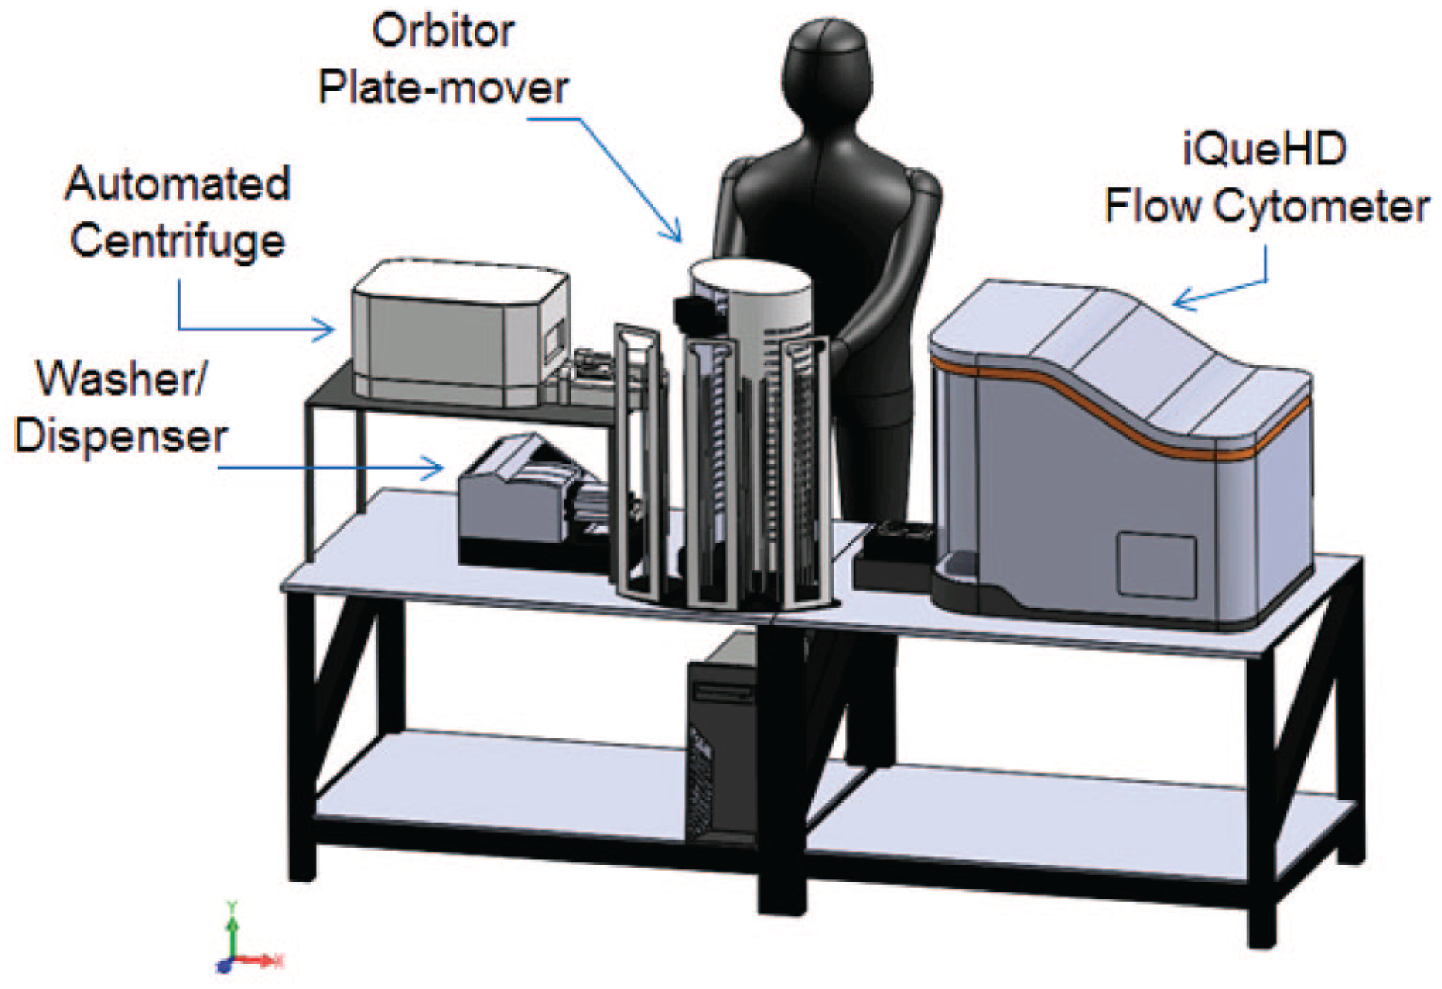
Schematic of iQue screening platform. Current configuration of HTFC system. Components include an Intellicyt iQueHD reader, Thermo Orbitor plate mover, EL406 washer/dispenser, and Agilent centrifuge. Components are controlled and scheduled with Thermo Momentum software.
All samples were collected on an iQue instrument as described in the Methods section. This instrument is capable of rapid sample collection, with top speeds reported by the manufacturer as less than 20 min per 384-well plate. To reach this collection speed, a volume of approximately 1 µL of each sample is acquired with a 0.5–1 s sip time per well. In our experience with the cell-based assays that were processed, a target event count of 2500–5000 events per well was required in a final well volume of 90 µL. These conditions fulfilled the requirements for the positive cell populations sought, 25 which were based on 8–16 positive and negative control wells present on each plate sampled, where the resulting calculated Z′ factor values were 0.5 or above. Additionally, the sample volume chosen was found to rarely, if ever, clog the sample collection probe or flow cell. This resulted in per-plate read times of approximately 1–1.25 h. Under these sampling requirements, the HTFC system, shown in Figure 2 , has been tested to reliably process 16 plates at a time without operator intervention. This capability generally allowed samples to be prepared during the day and then acquired in a fully automated acquisition on the iQue.
Establishing a Workflow for HTFC Data Analysis
The iQue reader is unique in its plate-centric approach to sampling. This system collects and deposits all data from a plate into a single file. A snapshot of samples acquired in this way is shown in Figure 3A . After each plate read, a rapid and automated process in the ForeCyte software will automatically segment each well collected based on an air gap placed between wells. A variation of this process utilizes fluorescently labeled in-between well marker beads, along with the air gaps, to separate samples. The iQue incorporates a built-in marker bead trough station and software options to automatically gate the beads based on their fluorescent label. These options greatly facilitate use of this method, which in practice has been helpful when finalizing well segmentation for compound treated samples, where potential toxicity may diminish cell counts. When this occurs, the level of event counts resulting from affected wells is not sufficient for reliable automated well segmentation based solely on an air gap.
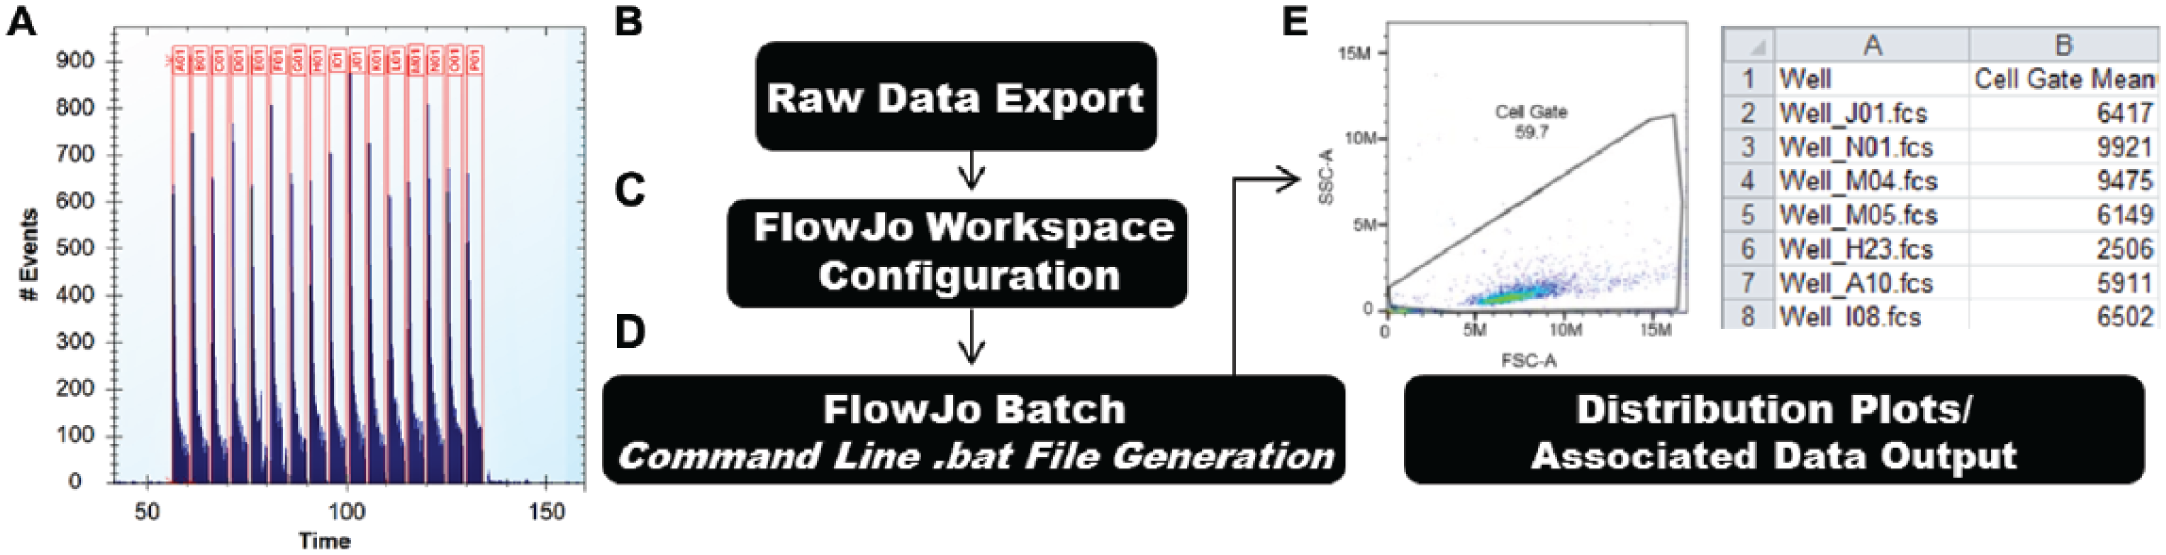
Data processing workflow. (
In-house requirements specify that data be uploaded to an internal database on a plate-by-plate basis. The steps we implemented to accomplish this are highlighted in the flowchart shown in Figure 3A – D . We perform all HTFC data analysis on well-by-well FCS data exported from the iQue ForeCyte software. For reasons discussed later in this section, sample analysis is conducted in FJ software. Because of the large volume of data produced in each screen, manual analysis in this software becomes untenable. We therefore make use of the capability of FJ to process data by command line. This method runs in an automated batch fashion without using the standard FJ graphical user interface. To utilize this capability, the user will first build a FJ workspace template file (WSPT) with a small representative subset of the screen control and test samples. Then using the FCS file location and a data output file location, the user builds a command line to execute the desired analysis. The result is a customized output of FC data, including both the cellular parameter measurements as a CSV file and the associated cell population distribution plots as an individual PNG image file for each sample processed. Cellular parameters are specified in the FJ table editor, and population distribution plots are specified in the FJ layout editor. By using this approach, large sets of data can be processed by a currently equipped nondedicated PC with a standard copy of FJ software. Batch analysis of a group of plates is triggered to run by saving the command line text to a batch executable file (BAT) on the PC being used and simply opening that file to execute the commands contained within. Batch analysis times will increase with advanced gating strategies, such as magnetic gating and increased metric generation as dictated by the FJ workspace file. Average batch times generally fall within 3–6 min per plate.
Key benefits of this approach include application of a single analysis strategy across an entire screen, as well as sample-by-sample export of PNG files containing visualizations of the FJ workspace-specified cell population distribution plots and summary metric tables for each well processed. This file output enabled by FJ lays the groundwork for building a dynamic and interactive screen analysis file, described in detail in the next section.
To support the generation of executable BAT files containing the command lines to trigger customizable FJ batch analysis, we built and implemented a custom software application called FACS_FLOWJO_BATCH, described in detail in the Methods section. This application strings together the necessary software, file, and FJ options to generate a functioning command line. A screenshot of the user interface is shown in Supplemental Figure S1 .
During the review of screening data, calling up and referencing back to the raw data used in the screen analysis is often necessary. In the case of high-content imaging, this would be the raw image captured by fluorescent or, in some cases, light microscopy. In the case of FC, this is represented by the population distribution plots, generally dot plots or histograms that are used to generate cellular parameter measurements. Spotfire functionality allows incorporation of image PNG file viewing, which allows the user to call up visualization features in either a dedicated table, tool tip, or label feature, in an on-the-fly process. In practice, the main advantage of this functionality is a dynamic analysis file that quickly renders the raw source data as needed. An example of this is shown in Figure 4 and is described in detail in the next section. The Spotfire label feature was enabled to display FJ workspace PNG images while selecting one or more data points. To support this visualization option, we built a custom software application called Advanced_DIR_Merge, described in detail in the Methods section. A screenshot of the user interface is shown in Supplemental Figure S2 . This application facilitates the generation of a URL list of relevant PNG files, linking with the respective well and plate annotation that allows for quick incorporation of this valuable analysis capability.
Representative data. (
An Example Dataset: MHC-I Upregulation
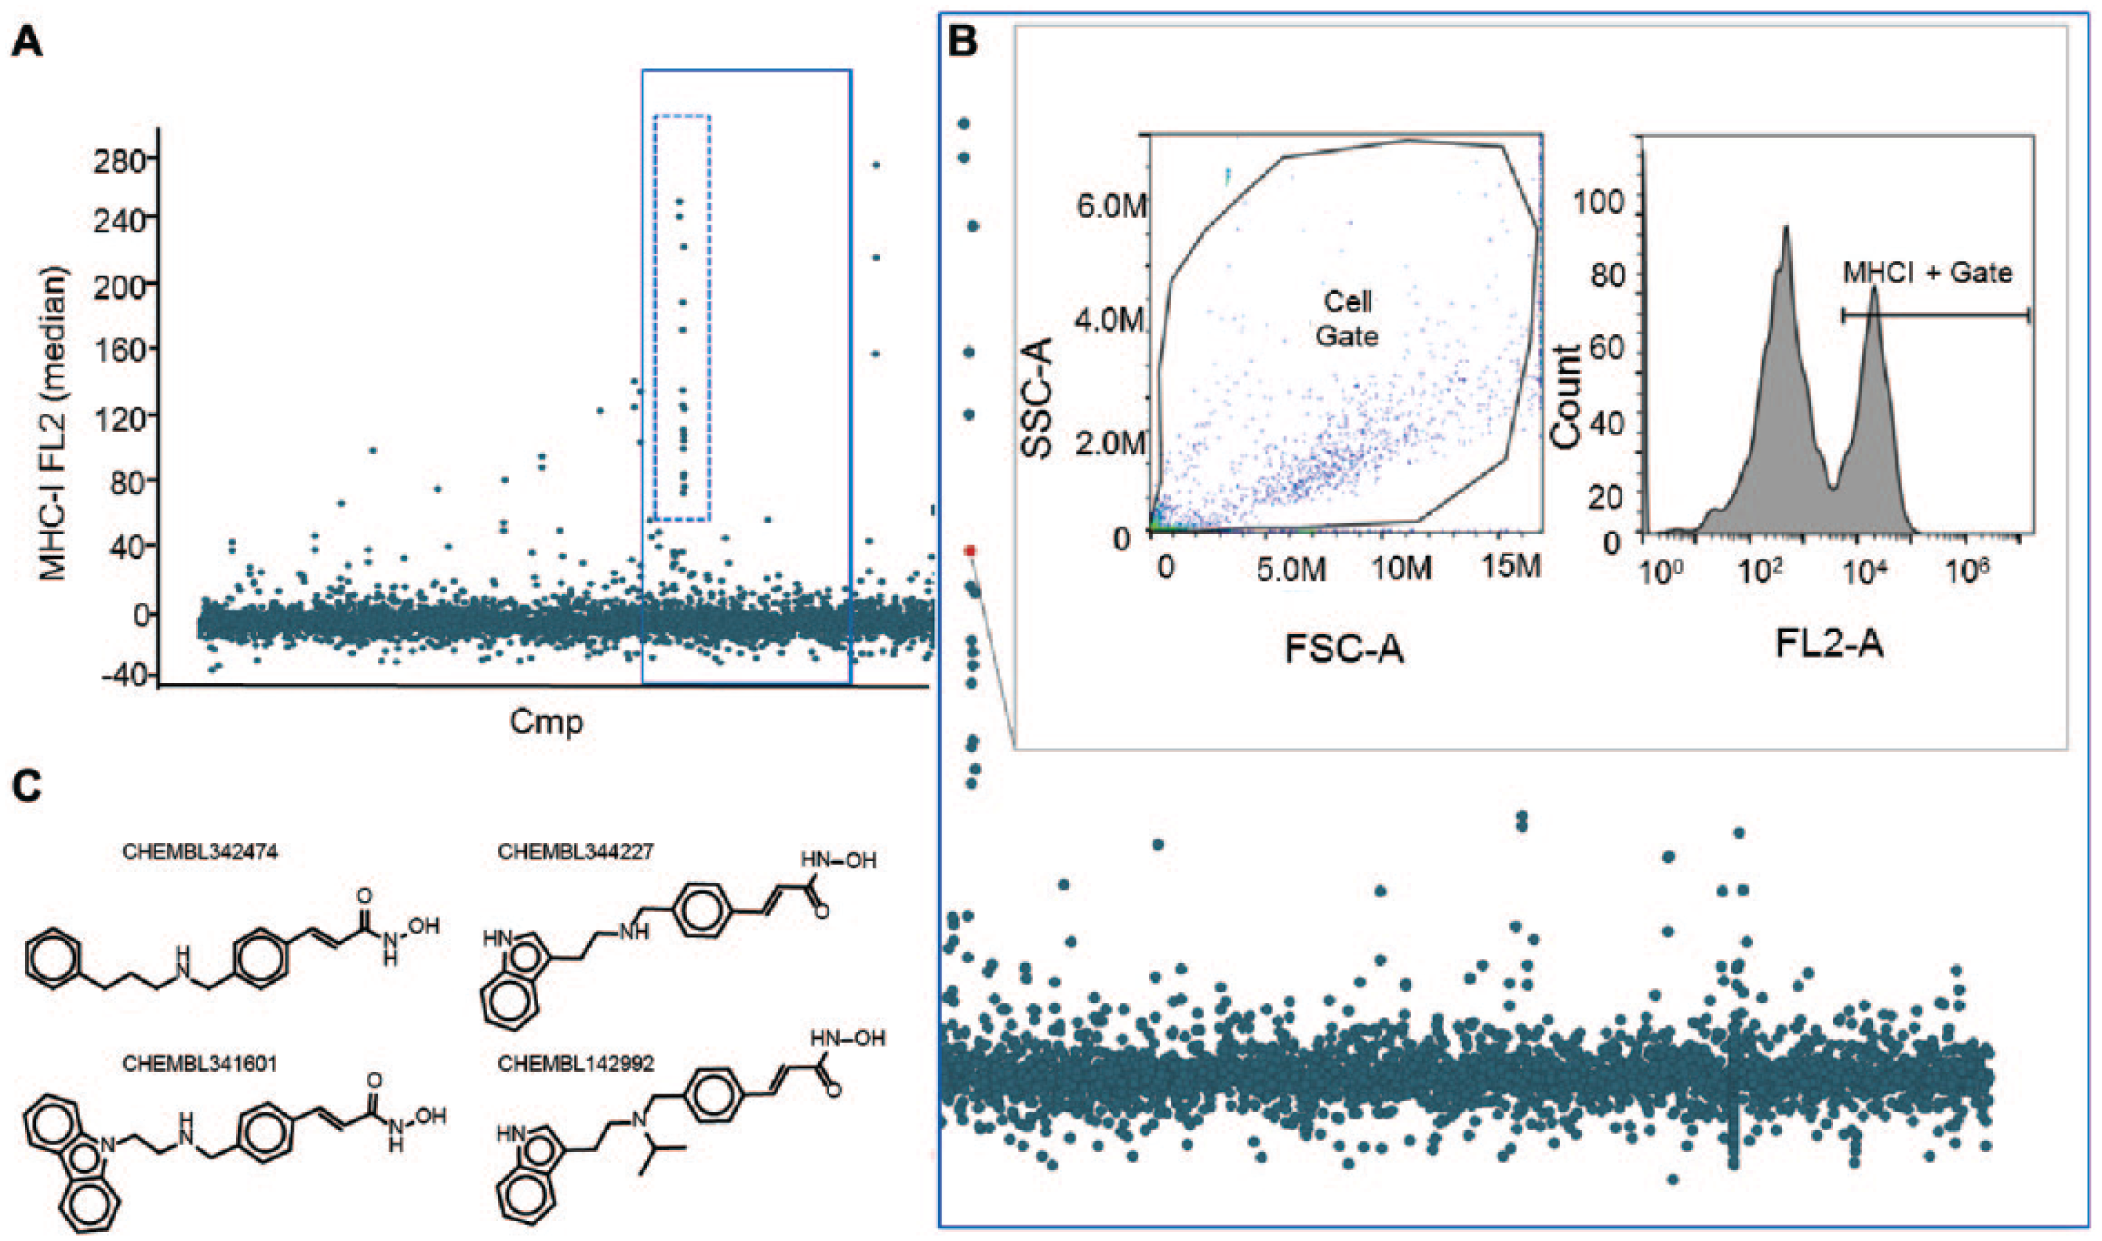
A screen against a well-characterized and information-rich chemical probe library known as the Mechanism-of-Action (MoA) Box 26 for compounds capable of increasing the expression of the MHC-I receptor was conducted in the mouse melanoma cell line B16-F10. The results of this screen of approximately 3000 compounds performed in duplicate are shown in Figure 4A and serve as an example of the output of the HTFC pipeline described in this paper. The assay window as established by murine IFN-γ dosed at 10 ng/mL, compared with no treatment, and tested in each plate screened produced an average Z′ factor of 0.58, indicating that an appropriate signal window was established under the assay conditions tested. Approximately 3% of the library was identified as hits based on a z score of ≥1. The MoA library contains compounds with at least one known validated target and covers many prominent drug targets, with approximately 30% covering G-protein-coupled receptors (GPCRs) and protein kinases, 30% enzyme modulators, 10% ion channel modulators, and 10% protease inhibitors. We found that the hit class making up the largest proportion of molecules that enhanced MHC-I expression, comprising 23% of all hits, was known histone deacetylase (HDAC) inhibitors. The data points associated with HDAC inhibitors are highlighted in Figure 4A (dotted line) and also magnified in Figure 4B . Highlighted here is the dynamic visualization feature in Spotfire to call up the FJ dot plot and histogram of an interesting sample. The example in Figure 4 shows the supporting data demonstrating that the increase of MHC-I does in fact link back to a true increase in MHC-I expression by FC. Structures shown in Figure 4C are four examples of hydroxamic acid-containing HDAC inhibitors found to be active in the MHC-I assay.
Discussion
Establishing an HTFC screening pipeline enables the immediate expansion of standard FC assays, which are a gold standard for cellular analysis. This is especially true for areas of immunology. 27 Scale-up of miniaturized assays allows researchers to utilize disease-relevant cell models at increased scale and depth of coverage. Directly utilizing standard FC assays saves time that is normally spent adapting assays to homogeneous plate-based formats commonly used for HTS. By expediting data collection with HTFC, researchers can more efficiently reach conclusions on the underlying mechanism of the cellular activity being probed.
Since the installation of the iQue screening system outlined in this paper, we have embarked on a number of cell-based, phenotypic screening campaigns. These screens used distinct cellular assays to query a small-molecule library known as the MoA Box. 26 Each campaign consisted of multiple iterations of the assays involved, including primary screens, confirmation assays, and concentration response testing of potential hits. Generally, compounds were first tested at 1 and 10 µM, with each concentration repeated in duplicate. Active compounds, usually defined as those with a z score of >2, were then tested in 8-point concentration response in duplicate with a high concentration of 10 µM. The types of cells screened include human primary donor peripheral blood mononuclear cells (PBMCs), mouse splenocytes, and established cell lines. Assay robustness as determined by the Z′ factor was calculated for each plate and was generally between 0.5 and 0.9. Values in this range indicate an appropriate assay window for active compounds to be confidently identified.
The multistep nature of suspension cell preparation for FC has in the past acted as a barrier, preventing such screens from being implemented in HTS. The automated and semiautomated methods described in this paper are one path forward for scaling up cell preparation. As depicted in Figure 1a , the workflows developed to prepare cells for FC range in complexity based on the assay requirements. The key step is a gradual exchange of buffers and reagents in the well by the process shown in Figure 1b , which retains cells and consistency across the assay plate. This process is amenable to automation, effectively replacing the standard “spin and flick” method used in low-throughput applications. Other groups have likely utilized a similar approach to automate parts of an assay or entire screening campaigns. One example of a fully automated approach by Joslin et al. 19 describes a platform capable of achieving a throughput of 50,000 wells per day. This approach and the one described in this article indicate that HTFC can scale effectively to suit the needs of HTS.
Having applied our cell preparation approach to various cellular assays, the protocol with the most steps involved intracellular staining of FoxP3 and surface staining of CD4, requiring a total of 15 wash steps to quantify T regulatory cells. Even with multiple washes, the number of cells per well remained high and consistent across the plate. Withstanding the capability to achieve good results for a multistep cell preparation process, care should still be taken to experimentally test the amount of wash steps needed and limit those steps appropriately.
While the automated and semiautomated methods described in this paper are one path forward for scaling up cell preparation, there are other approaches validated elsewhere that could be considered. One example is adaptation to no-wash protocols, like those described by Edwards et al. 28 Here, it is essential to optimize each reagent addition, as an overabundance of fixative can result in autofluorescence or damage to the target moieties. Likewise, the overabundance of a detection reagent can result in signal saturation. Another option is to use commercially available kits that have been preoptimized to perform in a no-wash protocol, for example, the MultiCyte kits from Intellicyt.
In the MHC-I screen highlighted in this article, we were able to adapt a standard low-throughput cell preparation approach to a high-throughput workflow. Wash and spin steps could be omitted in this assay as the cells being tested grow as an adherent monolayer. This allowed media to be washed away with a standard plate washer method. Cell detachment was then performed and followed by addition of a PBS–5% FBS mixture containing the MHC-I detection antibody. In this one step, detachment reagent was neutralized and antibody staining was performed, making the samples immediately ready for FC. It should be noted that detection antibody concentration was optimized during assay development to minimize background and nonspecific signal in the untreated population. These modifications from a standard FC cell preparation protocol effectively reduced the cell preparation barrier for HTFC, allowing the project team to quickly identify a number of modulators of MHC-I expression. These included multiple compounds shown to be HDAC inhibitors, as shown in Figure 4 . This observation agrees with previous studies, which suggest that epigenetic agents enhance tumor immunogenicity by upregulating MHC molecules, 29 and validates the approach of the assay.
Counterscreening strategies were also implemented to reduce the occurrence of assay artifacts. For example, small molecules can be fluorescent, 30 and cells that absorb or are coated by these compounds will appear as false positives in FC assays. By performing an appropriate counterscreen, these molecules can be tagged for closer analysis to resolve a potentially true signal from that produced by compound autofluorescence. The process for counterscreening in the assays tested in this paper used a dataset from cells treated with test compounds but not stained with detection antibodies (data not shown). Compound treatment resulting in active signals in the fluorescent channels was identified and served to inform analysis of the data. Additional characterization can also include orthogonal readouts, for example, testing an antibody with an alternate fluorescent dye to determine if the activity is independent of spectral region. 31
Sample acquisition on the iQue was conducted essentially as recommended by the manufacturer. The ability of the sample probe to pierce the plate seal proved to be a valuable asset. This feature enabled optimization of dilution volumes in the 384-well plates and reduced cell densities to prevent clogging of the instrument. This also allows plates to be vortexed at high speed during sample collection without fear of sample spillover. The well separation beads, available for the iQue, proved to be very useful. Their use enabled expedited well segmentation and quality control postread, generally ruling out any uncertainty of well assignment to the events collected. When not using well separation beads, well locations were sometimes assigned incorrectly, especially in samples where the total cell counts were diminished due to treatment conditions.
The software included with the iQue reader, ForeCyte, handles instrument operation as well as sample analysis. The ForeCyte software allows simultaneous analysis of the many samples and multiple plates of data collected by the instrument, allowing uniform analysis across an entire screen. However, due to in-house requirements for data storage and sharing, we found it necessary to use FJ software for data analysis. This software’s ability to run in a headless format executing command line batch analysis was essential. The main advantage of FJ is the ability to export PNG image files of cell distribution plots, as well as raw data metrics on a well-by-well and plate-by-plate basis. As described in the Methods and Results sections, this feature allows the sample-level source data to be quickly and dynamically called up in a Spotfire analysis to ensure robustness of data processing and hit calling. To enable the batch analysis and PNG image integration required, our team established two helpful software tools, which are described and made available in this article. While both tools are necessary components of postacquisition processing in the pipeline described, it would be of potential benefit to more fully integrate these features or aspects of them into future versions of established software packages dedicated to HTFC.
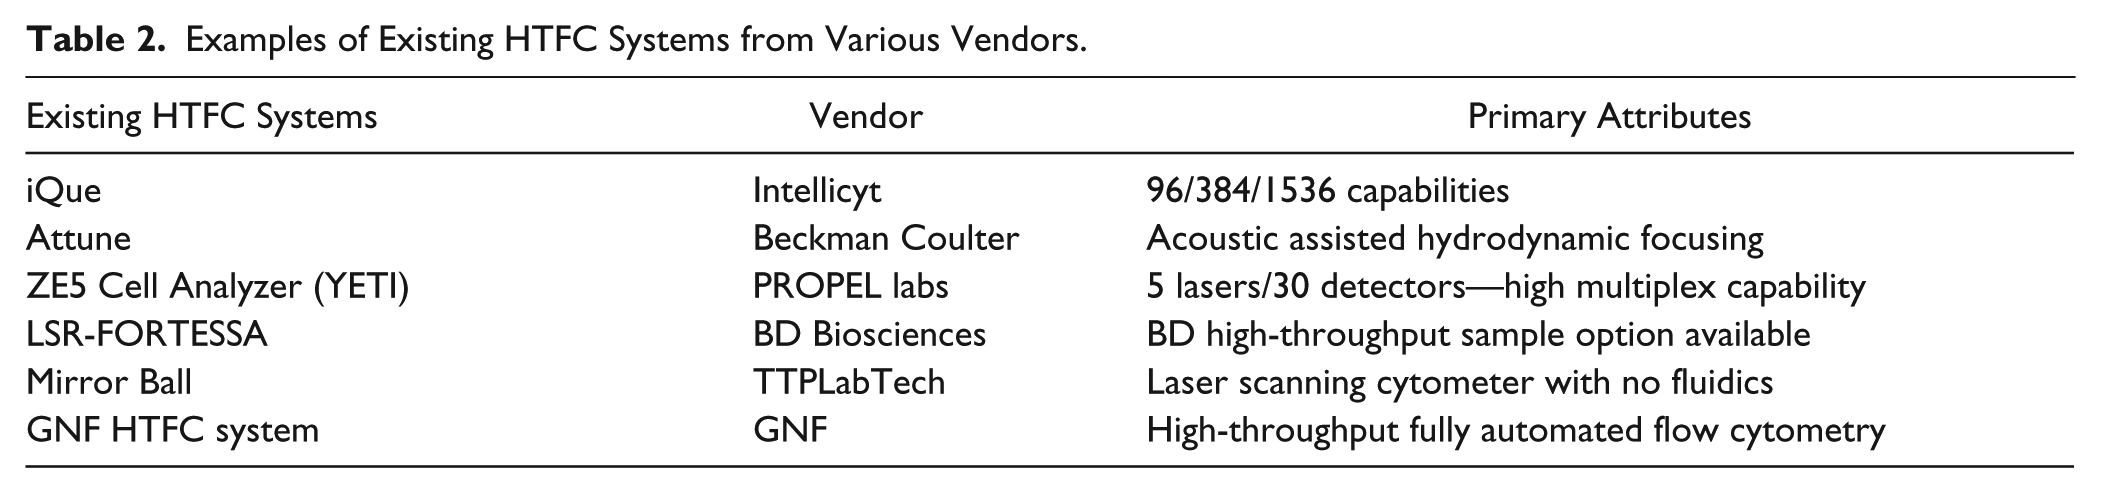
As outlined in Table 2 , a growing number of high-throughput or high-content cytometry screening systems are available. These systems, coupled with the upstream sample preparation methods and the downstream data analysis methods described in this paper, can be used to merge standard FC readouts with high-throughput systems to generate FC data on an appreciably large scale. Additionally, new FC methods continue to be established that are increasing the information content obtained from a single sample, for example, the ability to measure both protein and mRNA levels from the same sample. As described by Frei et al., 12 a method called PLAYR incorporates proximity probe pairs to target mRNAs. A method with similar capabilities, PrimeFlow, 32 is offered by Thermo Fisher Scientific. This method uses hybridization of a branched DNA reagent to amplify the signal from target mRNAs. Furthering the capability of multiplex target detection is the application of single-cell sequencing technology by RNA-seq. In a paper by Peterson et al., 33 DNA barcoded antibodies are employed to enable the detection of protein targets at the same time as mRNA expression, both of which are simultaneously detected by RNA-Seq.
Examples of Existing HTFC Systems from Various Vendors.
HTFC methods and the continuing development of increasingly higher-content readouts will have a great impact on the characterization of different phenotypes. These tools give researchers more complete insight into mechanisms of disease-target modulation.
Supplementary Material
Supplemental Material, Supplemental_Info_for_Scalable_Pipeline_for_HTFC_by_Wilson_et_al – A Scalable Pipeline for High-Throughput Flow Cytometry
Supplemental Material, Supplemental_Info_for_Scalable_Pipeline_for_HTFC_by_Wilson_et_al for A Scalable Pipeline for High-Throughput Flow Cytometry by Aaron C. Wilson, Ioannis K. Moutsatsos, Gary Yu, Javier J. Pineda, Yan Feng, and Douglas S. Auld in SLAS Discovery
Footnotes
Acknowledgements
John Joslin, personal communication
Christian Parker, critical review
Nicholas Flannery, technical drawing
Supplemental material is available online with this article.
Declaration of Conflicting Interests
The authors declared no potential conflicts of interest with respect to the research, authorship, and/or publication of this article.
Funding
The authors received no financial support for the research, authorship, and/or publication of this article.
References
Supplementary Material
Please find the following supplemental material available below.
For Open Access articles published under a Creative Commons License, all supplemental material carries the same license as the article it is associated with.
For non-Open Access articles published, all supplemental material carries a non-exclusive license, and permission requests for re-use of supplemental material or any part of supplemental material shall be sent directly to the copyright owner as specified in the copyright notice associated with the article.