
Abstract
Posttranslational modifications such as phosphorylation, acetylation, and methylation play important roles in regulating the structures and functions of histones, which in turn regulate gene expression and DNA repair and replication. Histone-modifying enzymes, such as deacetylases, methyltransferases and demethylases, have been pursued as therapeutic targets for various diseases. However, detection of the activities of these enzymes in high-throughput cell-based formats has remained challenging. The authors have developed high-throughput LanthaScreen cellular assays for Histone H3 site-specific modifications. These assays use cells expressing green fluorescence protein–tagged Histone H3 transiently delivered via BacMam and terbium-labeled anti–Histone H3 modification-specific antibodies. Robust time-resolved Förster resonance energy transfer signals were detected for H3 lysine-9 acetylation and dimethylation (H3K9me2), serine-10 phosphorylation, K4 di- and trimethylation, and K27 trimethylation. Consistent with previous reports, hypoxic stress increased K4 methylation levels, and methyltransferase G9a inhibitor UNC-0638 decreased K9me2 levels significantly, with little effects on other modifications. To demonstrate the utility of this assay platform in screening, the K9 acetylation assay was used to profile the Enzo Epigenetics Library. Twelve known HDAC inhibitors were identified as hits and followed up in a dose–response format. In conclusion, this assay platform enables high-throughput cell-based analysis of diverse types of posttranslational modifications of Histone H3.
Introduction
T
The modifications of the Histone H3 N-terminal tail have been extensively investigated and characterized. Methylation has been observed on several Histone H3 lysine residues, including K4, K9, K27, K36, and K79. These residues can be unmethylated or mono-, di-, or trimethylated. Each of these four states is associated with distinct genome distribution pattern. For instance, K9 dimethylation (K9me2) and K27 trimethylation (K27me3) are mostly present in transcriptionally inactive heterochromatin and associated with transcription repression/gene silencing, whereas K4 di- and trimethylation (K4me2 and K4me3) are present in the transcriptionally active euchromatin and associated with transcription activation. 1 These methylation levels (methyl marks) are regulated by the interplay between histone methyltransferases and demethylases. Changes in these methylation levels, such as increased K9me2 level in the euchromatin region, can result in dysregulation of gene expression (e.g., repression of tumor suppressor gene expression). Overexpression of methyltransferases such as EZH2 (for K27me3) and G9a (for K9me2) has been shown in various cancer cells, and consequently, these methyltransferases have been pursued as prominent drug targets. 5 Despite extensive screening efforts, selective inhibitors for these methyltransferases are still lacking. So far, the only selective inhibitors reported are those for G9a.6,7 Histones are also reversibly acetylated, neutralizing the positive charge of the ϵ group of the target lysine residue and leading to a transcriptionally “active” chromatin structure. The acetylation of Histone H3 occurs in equilibrium between the activities of histone acetyltransferases (HATs) and deacetylases (HDACs). Therefore, inhibition of intracellular HDAC activity can result in a shift in this equilibrium toward an increase in acetylated histones and relaxed chromatin as a consequence. It has been suggested that transformed cells are capable of epigenetically silencing tumor suppressor genes through deacetylation of Histone H3. 8 HDAC inhibitors have been shown to reverse these silencing mechanisms present in transformed cells, resulting in restored transcription and suppressed tumor cell proliferation. A third type of Histone H3 modification is phosphorylation. Phosphorylation of Histone H3 at serine 10 (S10) is highly correlated with and required for mitosis. This modification is the known target of cell cycle–dependent Aurora kinase B. 9 Dysregulation of phosphorylation of H3 at S10 during mitosis has been implicated in cancer and is therefore the subject of therapeutic intervention. Because of the key roles of these histone marks in regulating gene expression and cell cycle progression, technologies capable of measuring Histone H3 modifications would be valuable for screening small-molecule modulators of histone-modifying enzymes.
Several biochemical assay technologies have been described and applied for the discovery of small-molecule modulators of Histone H3–modifying enzymes such as HDACs and methyltransferases. 10 Most of these assays use purified enzymes and/or peptide substrates that do not represent physiological conditions. Nuclear extraction and then Western blot analysis and/or enzyme-linked immunosorbent assay (ELISA) using modification- specific antibodies have been commonly used for the analysis of global levels of specific histone modifications. In solution, nucleosomes remain tightly associated with negatively charged DNA, making core histones resistant to standard protein solubilization methods. This association poses a challenge for using these standard techniques for the analysis of histone posttranslational modifications. High-throughput compatible time-resolved Förster resonance energy transfer (TR-FRET) LanthaScreen® cellular assays have been described and applied previously for the interrogation of posttranslational modifications of nonhistone proteins 11 such as the acetylation of p53 at K382. 12 This report describes the development and application of a homogeneous cell-based assay for the measurement of cellular Histone H3 modifications without the need to fractionate histones from chromatin, offering a sizable advantage over existing immunoassays in terms of processing steps and workflow. A green fluorescent protein (GFP)–Histone H3 fusion protein was transiently expressed in cells via BacMam. 13 The global levels of Histone H3 modifications such as constitutive K4me2 or K27me3 or trichostatin A–induced K9 acetylation were detected using a terbium-labeled modification-specific antibody in a single-step assay format. Robust assays were developed for H3K9ac, H3S10p, H3K4me2, H3K4me3, H3K9me2, and H3K27me3. The advantage of BacMam is that it allows the assays to be performed in a variety of cell backgrounds without the need for stable cell line generation. To demonstrate the utility of these assays for screening, the 43-compound Enzo Epigenetics Library (Enzo Life Sciences International, Plymouth Meeting, PA) was screened using the K9 acetylation assay. In this screen, 12 known HDAC is were identified as hits and further analyzed in dose–response experiments.
Materials and Methods
Cell culture reagents
All cell culture media and supplements, BacMam GFP–Histone H3 reagent, PrestoBlue™ reagent for cell viability, Tb-anti-GFP, and primary human mammary epithelial cells were obtained from Life Technologies (Carlsbad, CA). All other cell lines were purchased from American Type Culture Collection (ATCC; Manassas, VA). The cell lines were maintained under conditions recommended by the manufacturer.
Terbium labeling of Histone H3 modification-specific antibodies
Tb-anti–Histone H3 [AcLys9] and Tb-anti–Histone H3 [pSer10] antibodies were obtained from Life Technologies. Histone H3 methylation-specific antibodies were labeled with amine-reactive terbium (Tb)–chelate (Life Technologies) according to the manufacturer’s protocol. Briefly, around 0.3 mg of the antibodies in HEPES-buffered saline (HBS, pH 7.5) was reacted with 1:10 volume equivalents of 30 µg Tb–chelate in 1 M Na bicarbonate buffer (pH 9.5). Reactions were allowed to proceed at room temperature for 4 h in the dark. Unreacted Tb–chelate was removed from the solution via dialysis in HBS (pH 7.5). The antibody labeling yield was 5 to 10 terbium/antibody monomer as determined by absorbance measurements.
BacMam-enabled TR-FRET assays for detecting Histone H3 methylation
U-2 OS cells in growth medium (McCoy’s 5A supplemented with 10% dialyzed fetal bovine serum [FBS], 10 mM HEPES, 0.1 mM nonessential amino acids [NEAA], 1 mM sodium pyruvate, and 100 U/mL penicillin/100 µg/mL streptomycin) were plated in a 384-well white assay plate (Corning, Lowell, MA; 20 µL/well, ~7500 cells/well). A serial dilution of BacMam Histone H3 reagent was prepared in growth medium and added to the cells (10 µL/well). For the UNC-0638 titration experiments, cells were first mixed with BacMam reagent at 10% (v/v) final concentration in the assay or as indicated in the figure legends. The cell/virus mixtures were plated onto a 384-well assay plate (20 µL/well, ~7500 cells/well). UNC-0638 (Sigma-Aldrich, St. Louis, MO) was prepared as a 20-mM stock in DMSO, followed by 10-point half-log serial dilutions with DMSO and then 3 × UNC-0638 solution preparation in growth medium. The 3 × UNC-0638 solution was added to the cells (10 µL/well). Cells/virus and/or UNC-0638 were incubated in the 37 °C/5% CO2 incubator for ~20 h. The 6 × LanthaScreen lysis buffer (Life Technologies) supplemented with protease inhibitor cocktail (Sigma-Aldrich, P8340) containing 30 nM Tb-anti-H3K9me2, 12 nM Tb-anti-H3K27me3, 12 nM Tb-anti-H3K4me2, 6 nM Tb-anti-H3K4me3, or 6 nM Tb-anti-GFP was added (6 µL/well). The plate was incubated at room temperature for 2 to 3 h prior to plate reading on a BMG PHERAstar Plus (BMG LABTECH, Offenburg, Germany) plate reader (Ex 340 nm, Em 520 nm and 490 nm) or EnVision® (PerkinElmer, Waltham, MA) with excitation at 340 nm, emission 520 nm and 495 nm. The emission ratios of 520 nm versus 490 nm or 495 nm were calculated. Assay window was calculated as the averaged emission ratio of BacMam-transduced sample/averaged emission ratio of the nontransduced sample. Normalized emission ratio was calculated as 100 × (averaged emission ratio of UNC-0638-treated sample/averaged emission ratio of untreated sample). Sigmoidal dose–response equation with varying slope was used to fit the data and generate EC50 or IC50 values. Z′ factor values were calculated as follows: Z′ factor = 1 – [(3 × SDno virus + 3 × SDmaxvirus)/(avgmaxvirus – avgno virus)]. 14 For BacMam transduction of HeLa, T47D, MCF7, SKBr3, and MDA-MB-231 cells, cells were first mixed with the indicated amount of BacMam Histone H3 in the presence of 0.5 × BacMam Enhancer solution (Life Technologies) and plated into a 6-well cell culture plate (at 1 million cells/well). After incubation in a 37 °C/5% CO2 incubator for 24 h, cells were harvested and plated into a white 384-well assay plate at 7500 cells/well in 20 µL growth medium (Dulbecco’s modified Eagle’s medium [DMEM] supplemented with 10% dialyzed FBS, 10 mM HEPES, 0.1 mM NEAA, and 100 U/mL penicillin/100 µg/mL streptomycin). The rest of the assays follow the steps described above for U-2 OS cells.
BacMam-enabled TR-FRET assay for detecting Histone H3 acetylation at lysine 9
To measure Histone H3 acetylation, U-2 OS were first mixed with BacMam GFP–Histone H3 reagent (final concentrations of 10% or 15%). The cell/virus mixture was plated onto a 384-well assay plate (20 µL/well, ~7500 cells/well). After incubation at 37 °C/5% CO2 for ~20 h, cells were treated with different HDAC inhibitors (10 point, half-log serial dilution) for 3 h at 37 °C/5% CO2. Trichostatin A (TSA), sodium butyrate, SAHA, and (2E,4E)-6-(4-chlorophenylsulfanyl)-2,4-hexadienoic acid hydroxyamide (CHAHA) were purchased from Sigma-Aldrich. 4-Dimethylamino-N-(6-hydroxycarbamoylhexyl)-benzamide (M344) was purchased from EMD Chemicals (San Diego, CA). Cells were then lysed as described above, with the exception of the detection antibody, for which Tb-anti–Histone H3 [AcLys9] antibody (Life Technologies) at a final concentration of 5 nM was used. TR-FRET signals were measured as described above. BacMam transduction and TSA treatment for primary human mammary epithelial cells were the same as described above for U-2 OS cells. BacMam transduction in HCT-116, HeLa, A549, and 786-O cells was performed as following: Cells were first mixed with 20% or an indicated amount of BacMam Histone H3 reagent and plated onto a 6-well cell culture plate (at 1 million cells/well). After incubation in a 37 °C/5% CO2 incubator for 24 h, cells were harvested and plated onto a white 384-well assay plate at 7500 cells/well and 20 µL cells/well in growth medium. The rest of the assays follow the steps described above for U-2 OS cells.
For Enzo Epigenetics Library profiling, U-2 OS cells were transduced with 10% BacMam Histone H3 in growth medium for 20 h in 384-well assay plates as described above. Then, 10-mM DMSO stocks of the Enzo library compounds were further diluted with growth medium and then added to the cells in assay plates at a final concentration of 20 µM. Cells were incubated with compounds for 3 to 4 h in a 37 °C/5% CO2 incubator prior to cell lysis in the presence of the Tb-anti–Histone H3 [AcLys9] antibody. The plate was incubated at room temperature for 2.5 h prior to plate reading on the BMG PHERAstar Plus.
DNA staining and fluorescence microscopy
U-2 OS cells were transduced with BacMam GFP–Histone H3 as described above. The cells were then plated on chambered coverslips (LabTek II/Nunc, Rochester, NY) at 50% confluency and incubated for 16 h. The growth medium was replaced with phenol red–free OPTI-MEM (Life Technologies) containing the DNA dye Hoechst 33342 at a final concentration of 5 µg/mL. The cells were incubated for 30 min at 37 °C followed by two wash steps to remove excess Hoechst 33342 dye. Microscopic analysis of the sample was performed on a Deltavision Image Restoration System (Applied Precision, Issaquah, WA) equipped with an environmental chamber to allow cell handling and manipulation at 37 °C for extended periods of time. The images were acquired with a CoolSnap HQ camera (Photometrics, Tucson, AZ) using a PlanApo 60 × 1.4 objective. All images were processed using Applied Precision’s image processing software softWorx. Image processing was limited to linear adjustments (gain/black level) and deconvolution using the Agard Iterative Constrained algorithm
Nuclear extraction and Western blot analysis
BacMam GFP–Histone H3–transduced U-2 OS cells (107 cells) were used in a high-salt extraction of histones. High-salt extraction was performed according to a previously reported method. 15 Briefly, cells were lysed with 1 mL extraction buffer containing 0.2% NP-40, and nuclei were separated from the cytoplasmic fraction by centrifugation. Nuclei were lysed with 1 mL no-salt buffer (3 mM EDTA and 0.2 mM EGTA) for 30 min, and chromatin was then pelleted by centrifugation. Supernatant containing nucleoplasm was saved for the analysis of unincorporated histones. The chromatin pellet was resuspended in high-salt solution (50 mM Tris-HCl [pH 8.0], 2.5 M NaCl, 0.05% NP-40) for 30 min to solubilize the histones. Salt was then removed by dialysis using a 3500 MWCO membrane.
For Western blot analysis, an equal amount of total protein was loaded onto each lane for sodium dodecyl sulfate polyacrylamide gel electrophoresis (SDS-PAGE; 4%–20% Tris glycine). The proteins were transferred onto nitrocellulose membrane using the iBLOT dry blotting system (Life Technologies) according to the manufacturer’s protocol. The membranes were blocked and incubated with a primary antibody against Histone H3 (Life Technologies), followed by incubation with alkaline phosphatase-conjugated secondary antibody (WesternBreeze chromogenic Kit, Life Technologies). The blot was developed by using the chromogenic BCIP/NBT substrate (WesternBreeze® Chromogenic Kit, Life Technologies).
Results
GFP–Histone H3 expression in U-2 OS cells via BacMam delivery
The first step for developing a LanthaScreen TR-FRET cellular assay is to generate cells expressing the substrate of interest fused to GFP as the fluorescence acceptor for terbium that is used to label modification-specific antibodies. Here, GFP is fused to the N-terminus of the Histone H3 N-terminal tail, which is known to extend outside of the nucleosome core.
16
To determine whether GFP–Histone H3 proteins when expressed in cells behave and function like the endogenous Histone H3, U-2 OS cells were transduced with BacMam GFP–Histone H3. Imaging-based analysis showed that GFP–Histone H3 is expressed in the nucleus and colocalizes with chromatin (
Fig. 1A
) throughout every stage of the cell cycle (see
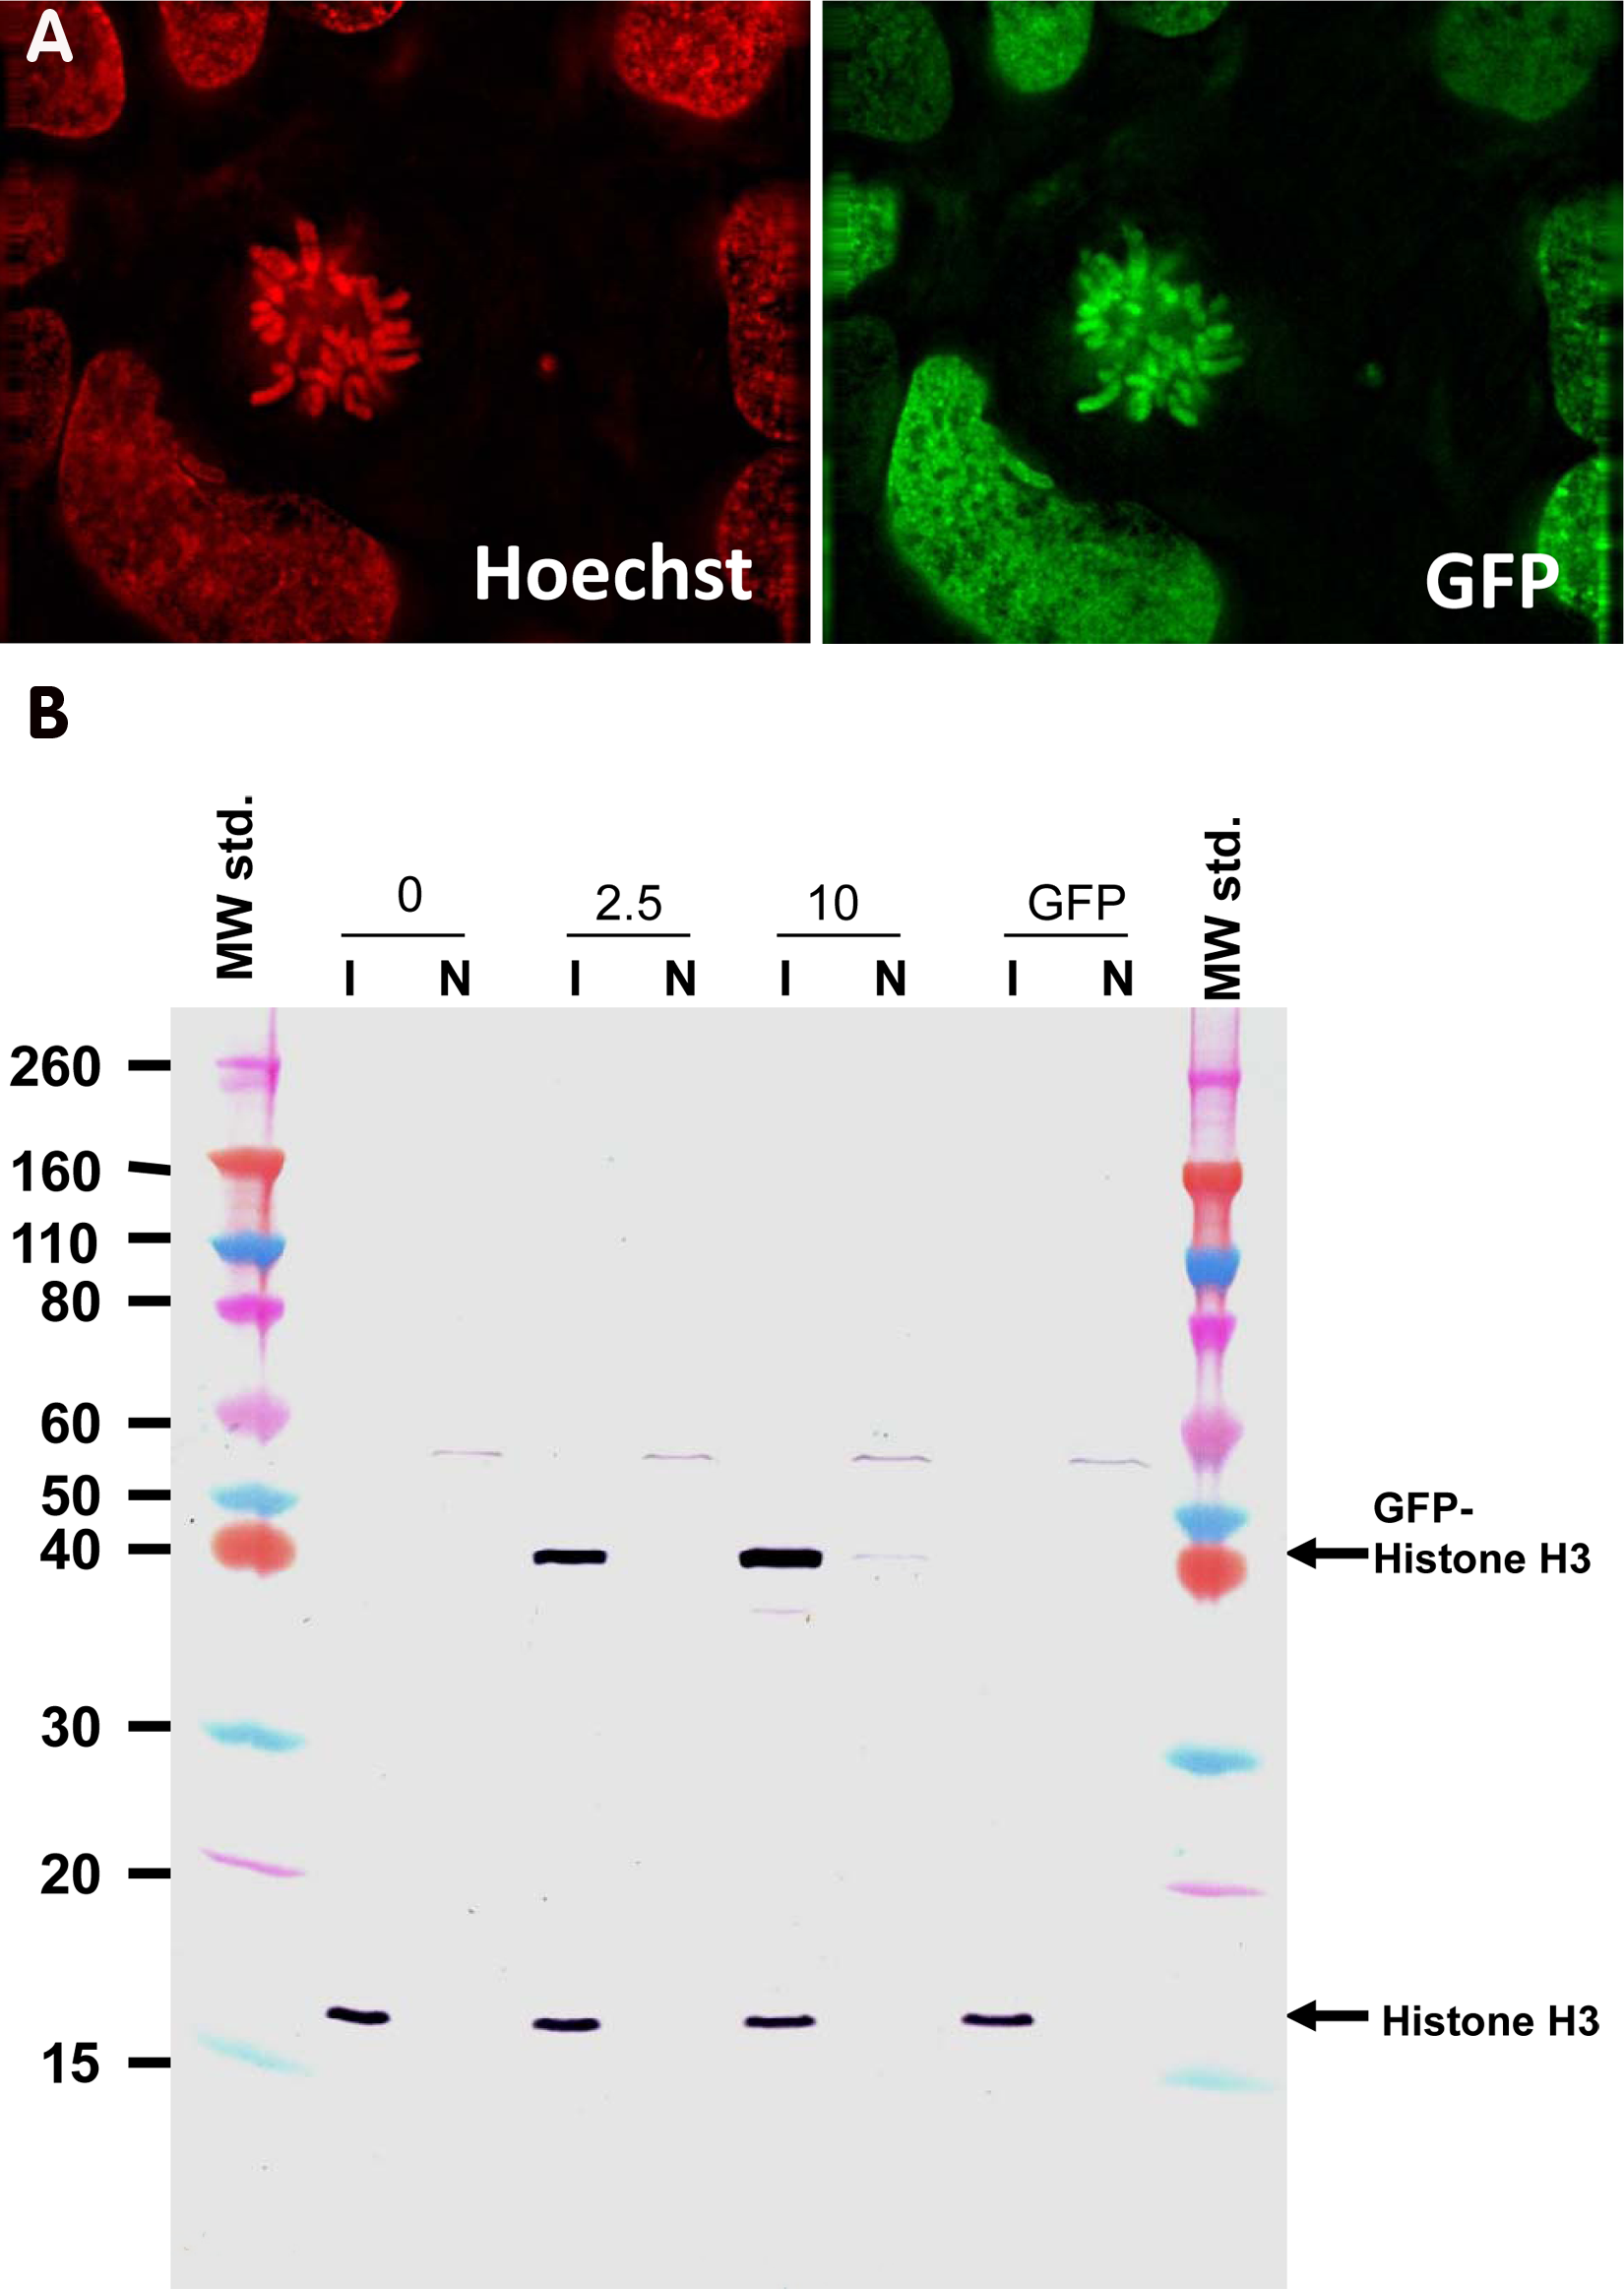
Association of green fluorescent protein (GFP)–Histone H3 with chromatin. (
Measurement of global levels of histone H3K4me2, H3K4me3, H3K9me2, and H3K27me3 using TR-FRET technology
To develop LanthaScreen cellular assays for monitoring Histone H3 methylations, H3K4me2, H3K4me3, H3K9me2, and H3K27me3 antibodies were labeled with amine reactive Tb–chelate as described in Materials and Methods. U-2 OS cells were plated and transduced with various amounts of BacMam GFP–Histone H3 reagent in a 384-well assay plate for 20 h. Cells were then lysed in the presence of Tb-labeled antibodies. After 2 to 3 h of equilibration, the emission ratios of GFP and Tb (TR-FRET signal) were obtained (
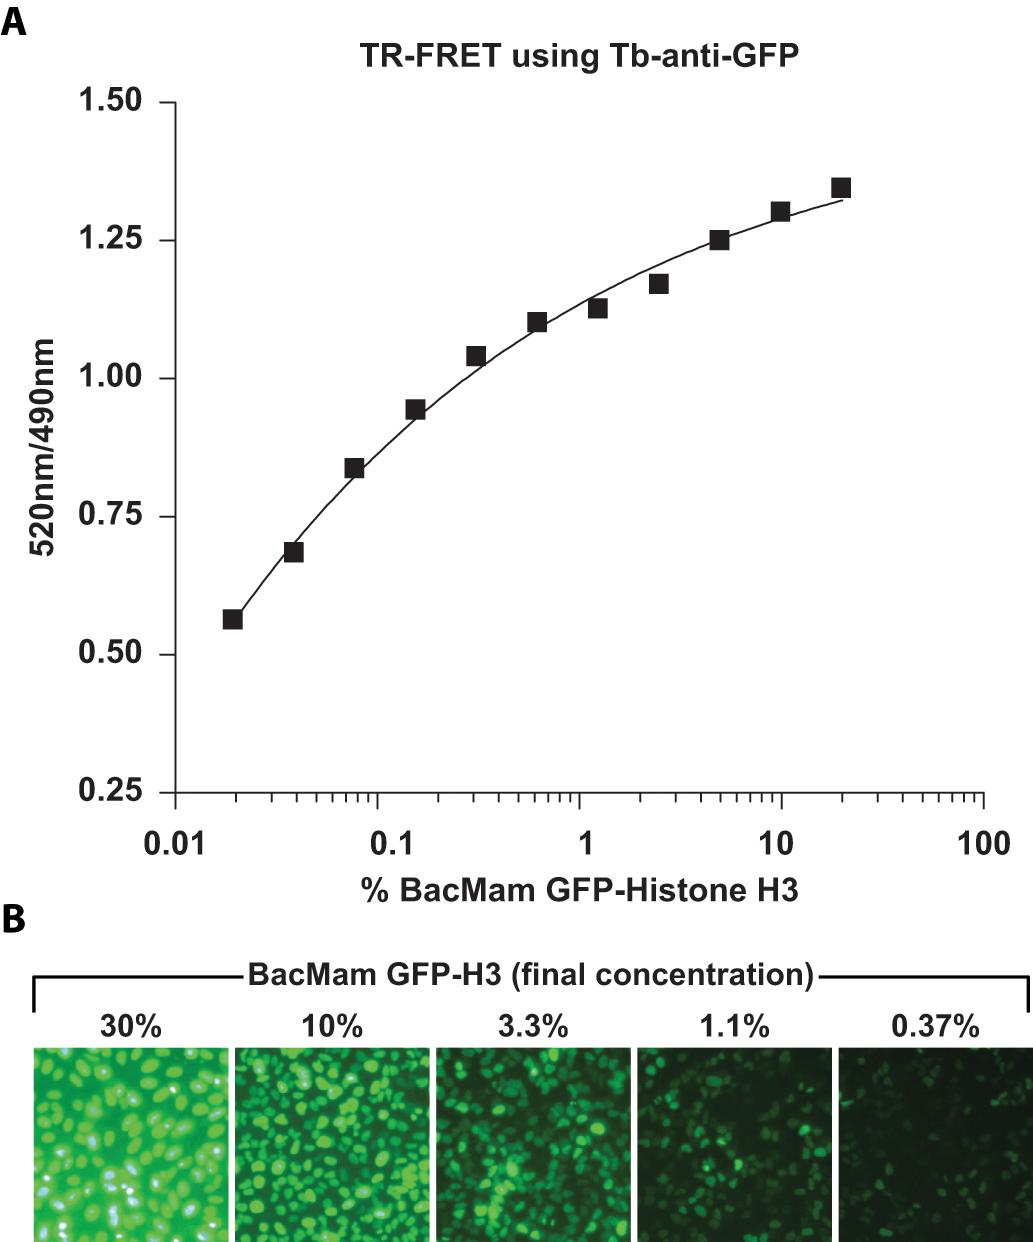
Titratable expression of green fluorescent protein (GFP)–Histone H3 in U-2 OS cells via the BacMam delivery system. (
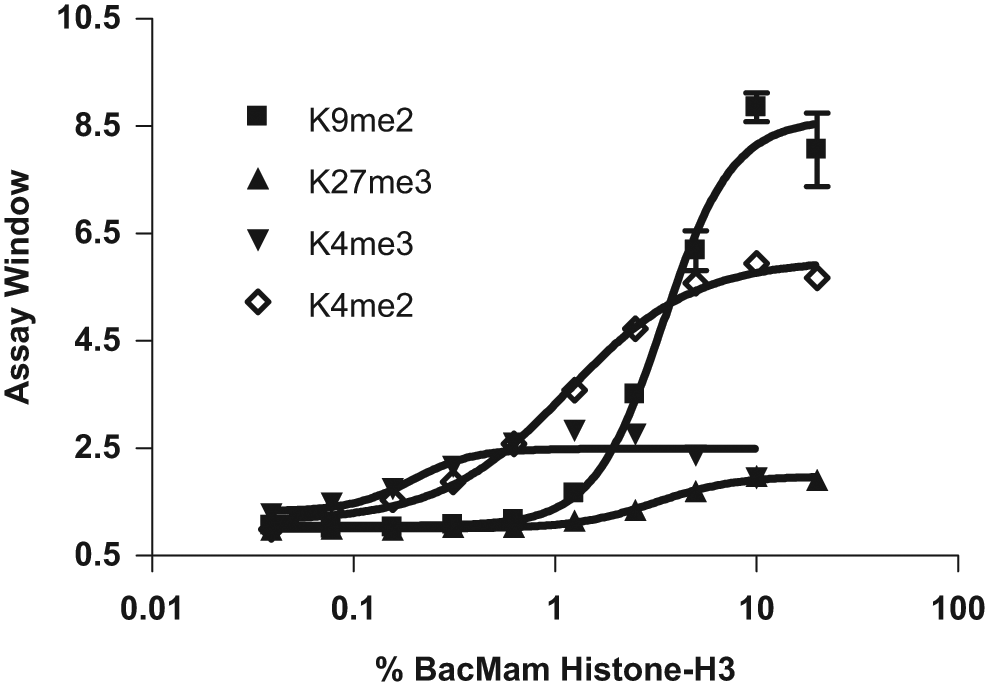
Measurement of Histone H3 methylation using time-resolved Förster resonance energy transfer (TR-FRET) technology. U-2 OS cells were transduced with different amounts of BacMam GFP–Histone H3 (indicated as % concentration of BacMam) and incubated for 20 h. Cells were lysed in the presence of terbium (Tb)–labeled anti–Histone H3 methylation antibody (■ H3K9me2, ◊ H3K4me2, ▲ H3K27me3, and ▼ H3K4me3) and incubated for 2 to 3 h. TR-FRET emission ratios at 520 nm and 495 nm were then obtained, and the assay windows (as described in Materials and Methods) were plotted against the amount of BacMam used for transduction. All data points represent the average value (± SD) of six replicates.
To investigate whether the use of a different cell background could result in improved detection of H3K27me3 and H3K4me3, HeLa, T47D, MCF7, MDA-MB-231, SKBr3, and primary human mammary epithelial cells (HMEC) were transduced with various concentrations of BacMam GFP–Histone H3 before the assays were performed. A strong BacMam concentration-dependent increase in TR-FRET signal was observed for H3K27me3 in HeLa, T47D, and MCF7 cells and to a lesser extent in other cell types examined here ( Fig. 4A ). Thirty percent BacMam GFP–Histone H3 resulted in an eightfold and a sevenfold increase in TR-FRET signal with a Z′ value of 0.8 in HeLa and T47D cells, respectively. For H3K4me3, a 3.5-fold increase in TR-FRET signal was observed in T47D cells at 20% BacMam Histone H3 and an over three-fold increase observed in MCF7 cells at 5% virus concentration ( Fig. 4B ). These results suggest that the level of histone methylation at a specific site can be different in different cell backgrounds and that the BacMam delivery system provides an efficient solution to examine these differences using the TR-FRET assays.
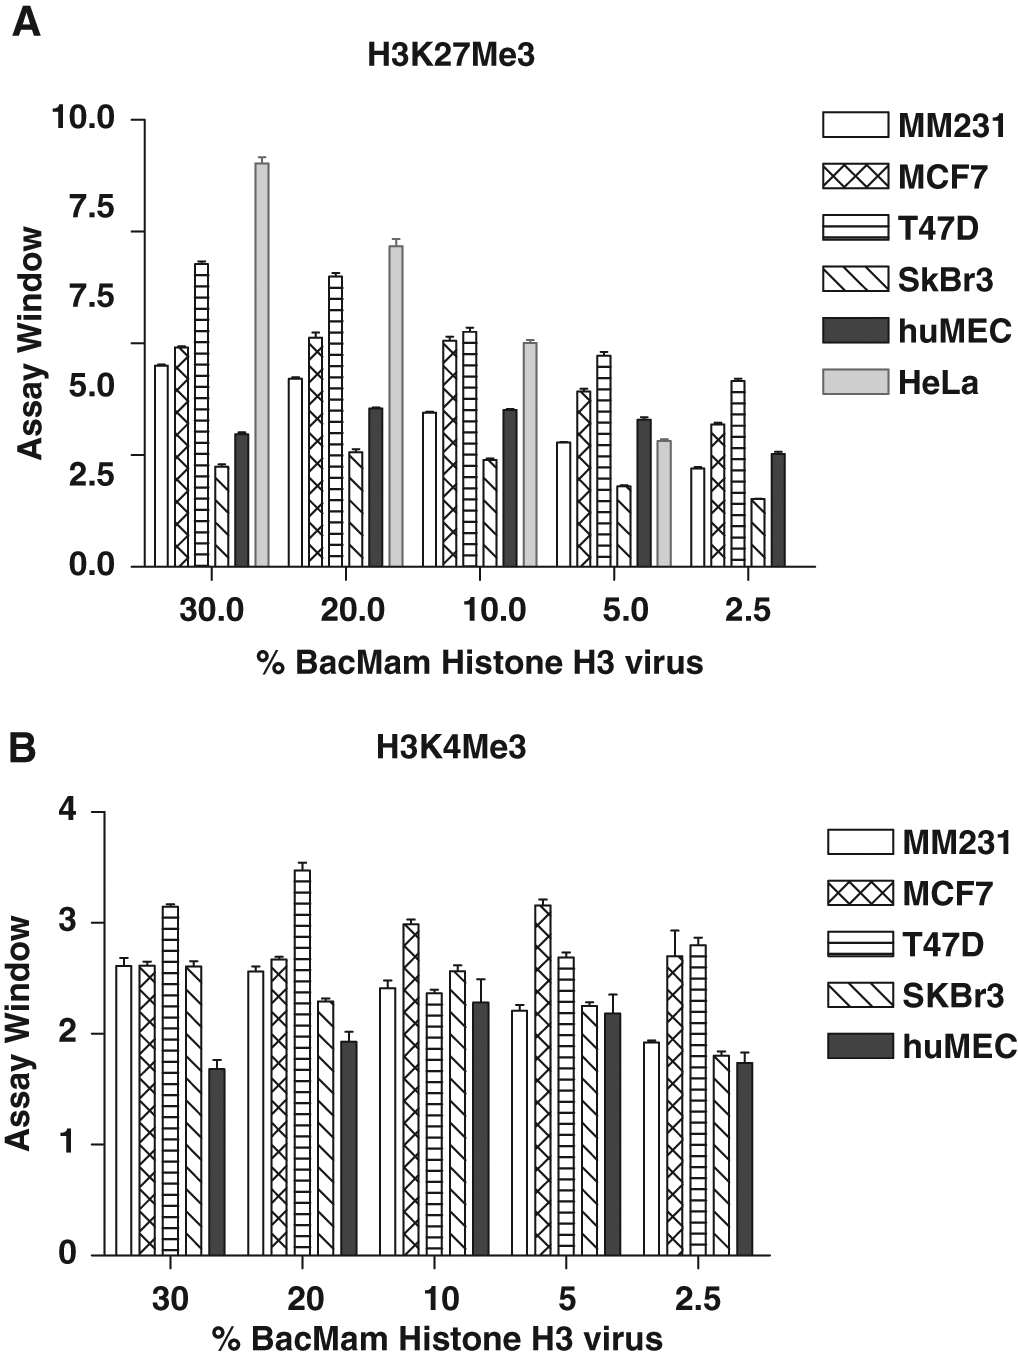
Measurement of H3K27me3 and H3K4me3 levels in HeLa and various breast cancer cells using time-resolved Förster resonance energy transfer (TR-FRET) technology. Cells were transduced with different amounts of BacMam GFP–Histone H3 (indicated as % concentration of BacMam) and incubated for 48 h (24 h for human mammary epithelial cells [HMEC]). Cells were lysed in the presence of terbium (Tb)–labeled anti–histone H3K27me3 (
To determine whether the above-described assays can be used to detect methyltransferase/demethylase inhibitor-induced changes in site-specific methylation levels, UNC-0638, a small-molecule inhibitor selective for G9a methyltransferase, was selected to validate the assays. G9a methyltransferase has been previously identified to be responsible for H3K9me2. 17 Incubation of BacMam GFP–Histone H3–transduced U-2 OS cells with UNC-0638 for 20 h resulted in a significant reduction of H3K9me2 levels with an IC50 value around 1.8 µM ( Fig. 5 ). Using identical treatment conditions, UNC-0638 had little effect on the expression level of GFP–Histone H3 protein ( Fig. 5 , Tb-anti-GFP) and H3K4me2 level below 20 µM. At a concentration of 20 µM UNC-0638, a small drop of GFP–Histone H3 expression was observed, presumably due to compound-induced cytotoxicity, shown as the drop of signal for PrestoBlue staining as an indicator of cellular metabolic activity and cell viability. UNC-0638 had a small effect on the H3K4me3 and H2K27me3 levels at 10 µM or higher ( Fig. 5 ) (IC50 > 20 µM). In addition, the effect of UNC-0638 on K27me3 levels was tested in HeLa cells, which exhibit substantially higher levels of K27me3 compared with U-2 OS cells. Similar to the results seen in U-2 OS cells, K27me3 levels were reduced about 30% in HeLa cells treated with 10 µM UNC-0638. No significant effect was observed with concentrations of UNC-0638 lower than 10 µM (data not shown). Together, these results indicate that the H3K9me2 assay is suitable for the identification of G9a methyltransferase inhibitors.
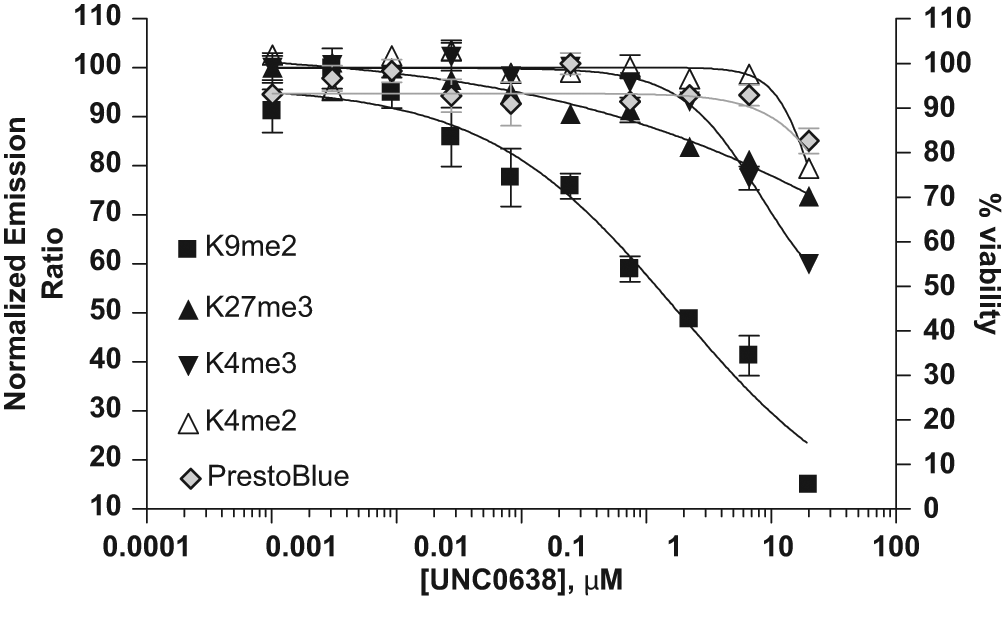
Specific reduction of H3K9me2 level by UNC-0638. U-2 OS cells were transduced with 10% (for H3K9me2, H3K4me2, and H3K27me3) or 2.5% BacMam green fluorescent protein (GFP)–Histone H3 (for H3K4me3) and incubated with indicated doses of UNC-0638 for 20 h. Cells were lysed in the presence of terbium (Tb)–labeled anti–Histone H3 methylation antibody (■ H3K9me2, Δ H3K4me2, ▲ H3K27me3, and ▼ H3K4me3) and incubated for 2 to 3 h. Time-resolved Förster resonance energy transfer (TR-FRET) emission at 520 nm and 495 nm was then obtained, and the normalized emission ratios (as described in Materials and Methods) were plotted against the concentrations of UNC-0638. For cell viability determination using PrestoBlue staining (◊), cells were transduced and treated with UNC-0638 as above in a separate 384-well plate. At the end of compound treatment, cells were incubated with a 1:10 dilution of the PrestoBlue solution for 20 min prior to reading the plate on a Tecan Safire2 (Tecan, Männedorf, Switzerland) using 560-nm excitation and 590-nm emission settings. The emission values were used to calculate % cell viability (right Y-axis) using the following formula: 100 × (Valuesample/Valueuntreated control). All data points represent the average value (± SD) of six replicates.
Hypoxic stress has been reported to increase global levels of H3K4 and H3K9 methylations.18,19 To test if the TR-FRET assay format can detect hypoxia-induced changes in histone methylation levels, BacMam GFP–Histone H3–transduced HeLa cells were treated for 16 h with the iron chelator deferoxamine (DFO), a well-known hypoxic mimetic. As shown in Figure 6 , DFO treatment led to an increased level of H3K4me3 in a dose-dependent manner with EC50 values of 24 µM. These results suggest that these TR-FRET assays can detect regulated changes of global levels of histone methylation.
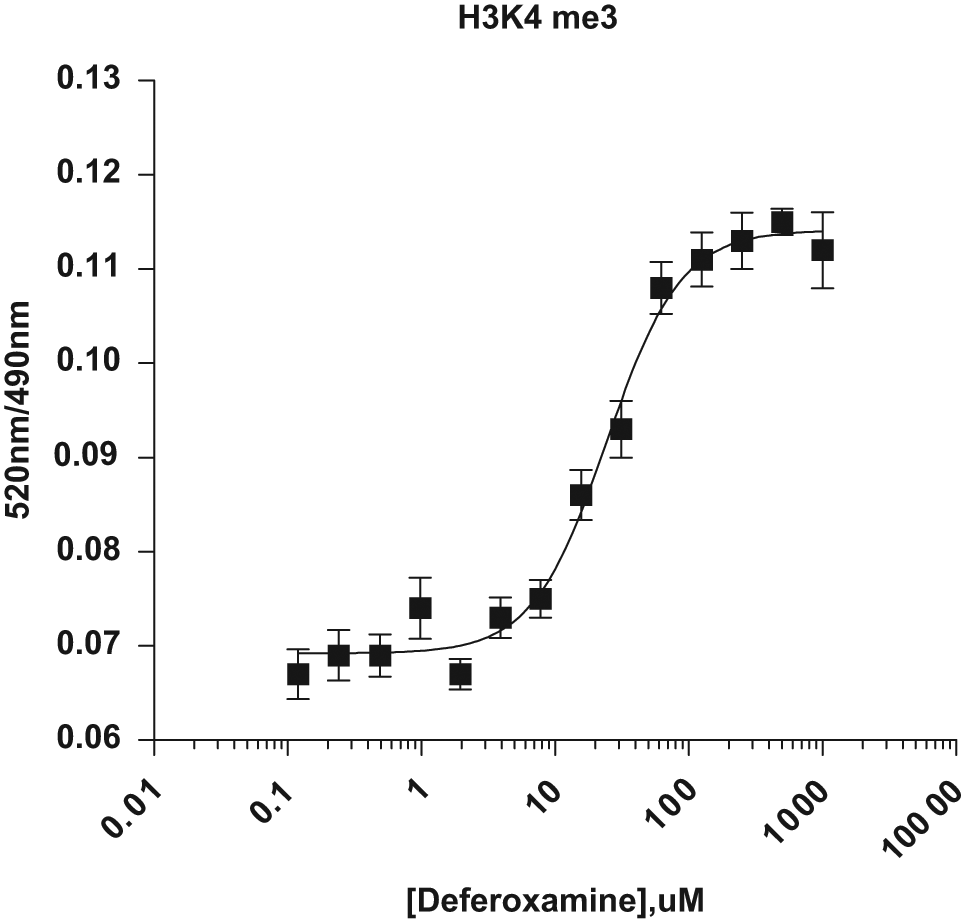
Measurement of hypoxic stress–induced H3K4 methylation. HeLa cells were transduced with 2.5% BacMam green fluorescent (GFP)–Histone H3 for 24 h and incubated with an indicated amount of deferoxamine for an additional 20 h. Cells were lysed in the presence of terbium (Tb)–labeled anti–Histone H3K4me3 antibody and incubated for 120 min. TR-FRET emission ratios at 520 nm and 490 nm were then obtained and plotted against the concentrations of deferoxamine. All data points represent the average value (± SD) of six replicates.
Measurement of Histone H3 lysine 9 acetylation using TR-FRET technology
Cells transduced with BacMam GFP–Histone H3 were also used to develop a TR-FRET-based assay for the measurement of global Histone H3 acetylation at Lys9 (AcK9) using a terbium-labeled anti–Histone H3 AcK9-specific antibody. The AcK9 modification was selected because of the previously identified role of type I/II HDACs in the deacetylation of this residue. 20 Treatment of cells with HDAC inhibitors is known to induce histone hyperacetylation by inhibiting constitutive activity of HDACs. 21 A panel of five known inhibitors of type I/II HDACs was tested in the GFP–Histone H3 AcK9 assay. As shown in Figure 7A , 3-h incubation with TSA, SAHA, CHAHA, sodium butyrate, or M-344 was sufficient to promote a robust, dose-dependent increase in TR-FRET signal in U-2 OS Cells ( Fig. 7A ). SIRT1 inhibitor EX527 was also tested in this assay, and it did not generate an observable effect (data not shown), suggesting that this assay can be used for screening inhibitors for type I/II HDACs but not SIRT1. The IC50 values of these compounds varied substantially, with TSA being the most potent HDAC inhibitor in this group (IC50 = 10 nM), followed by M-344 (70 nM), SAHA (220 nM), CHAHA (374 nM), and sodium butyrate (400 µM). Rank order potency and EC50 values of the tested HDAC inhibitors agree well with previously reported cell growth inhibition data. 22
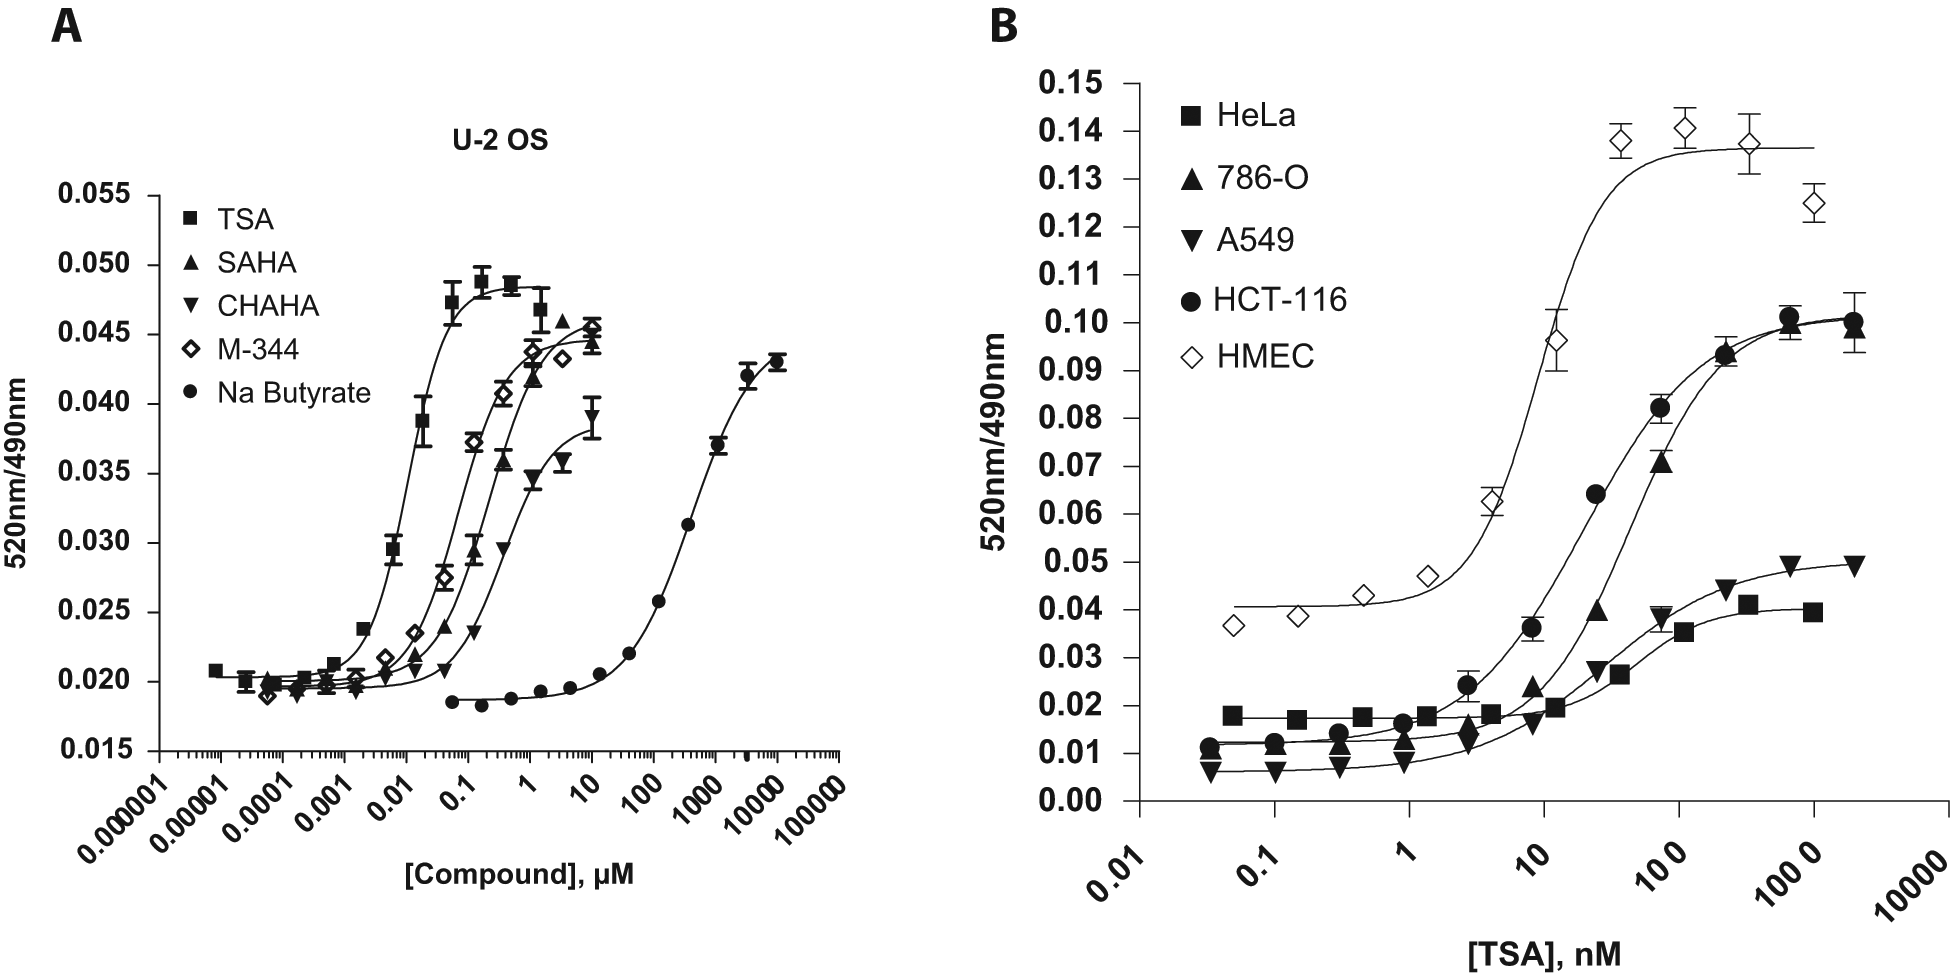
Measurement of green fluorescent protein (GFP)–Histone H3K9 acetylation in various cell backgrounds using time-resolved Förster resonance energy transfer (TR-FRET) technology. (
One of the advantages of the BacMam delivery system is that it allows for efficient transient protein expression in a variety of cell backgrounds, including hard-to-transfect primary cells. To demonstrate the assay portability using BacMam GFP–Histone H3, the effect of TSA on the acetylation status of GFP–Histone H3 was tested in a diverse panel of cell backgrounds. Transformed cell lines, including HeLa, A549, 786-O, and HCT-116, as well as primary human mammary epithelial cells (
Phosphorylation of Histone H3 at S10 (H3S10) by Aurora kinase B represents another histone modification and has been well established as a mitosis-specific marker. It is known that during mitosis, the phosphorylation of H3S10 alters H3K9 methylation and acetylation.9,23 A robust LanthaScreen cellular assay for detecting H3S10 phosphorylation was developed using Tb-anti–Histone H3 pS10 antibody (
To demonstrate the utility of this assay platform in screening, the K9 acetylation assay was used to profile the Enzo Epigenetics Library of 43 compounds containing known inhibitors for HDACs, HATs, and SIRTs as well as activators for SIRT1. The first round of screening was performed as a single-dose experiment. BacMam GFP–Histone H3–transduced U-2 OS cells were incubated with the 43 compounds at 20 µM for 4 h prior to the TR-FRET assay using Tb-anti–Histone H3 [AcLys9] antibody to measure changes in global levels of Histone H3 K9 acetylation. This initial experiment identified 13 compounds as potential hits based on a TR-FRET signal greater than baseline average (negative control) plus its three standard deviations. Twelve of 13 hit compounds are known HDAC inhibitors, including HDAC6-specific inhibitor BML-281. Interestingly, none of the SIRT inhibitors or activators was identified as hits, consistent with the previous EX527 results using this assay and again confirming that this H3K9 acetylation assay can be used for screening modulators for type I/II HDACs but not SIRTs. This initial screen identified all type I/II HDAC inhibitors in this library with the exception of valproic acid, NSC-3852, and butyric acid, which require concentrations well above 20 µM to exhibit any HDAC inhibitory activity. These initial hits were followed up by dose–response experiments to determine the IC50 for each compound. The tested compounds exhibited substantial differences in potencies. Table 1 summarizes the IC50 values of each compound from three independent experiments. Overall, this assay generated consistent and reproducible IC50 values, especially for potent compounds such as TSA, Scriptaid, SAHA, Oxamflatin, and many others. Consistent with previous results ( Fig. 7A ), TSA, M-344, and SAHA induced H3K9 acetylation with an IC50 of 15 nM, 60 nM, and 150 nM, respectively. Even though the initial screen identified Scriptaid negative control compound as a hit, the dose–response follow-up study showed that Scriptaid is 300-fold more potent than Scriptaid negative control ( Table 1 ).
IC50 Values of Hit Compounds in the H3K9 Acetylation Assay
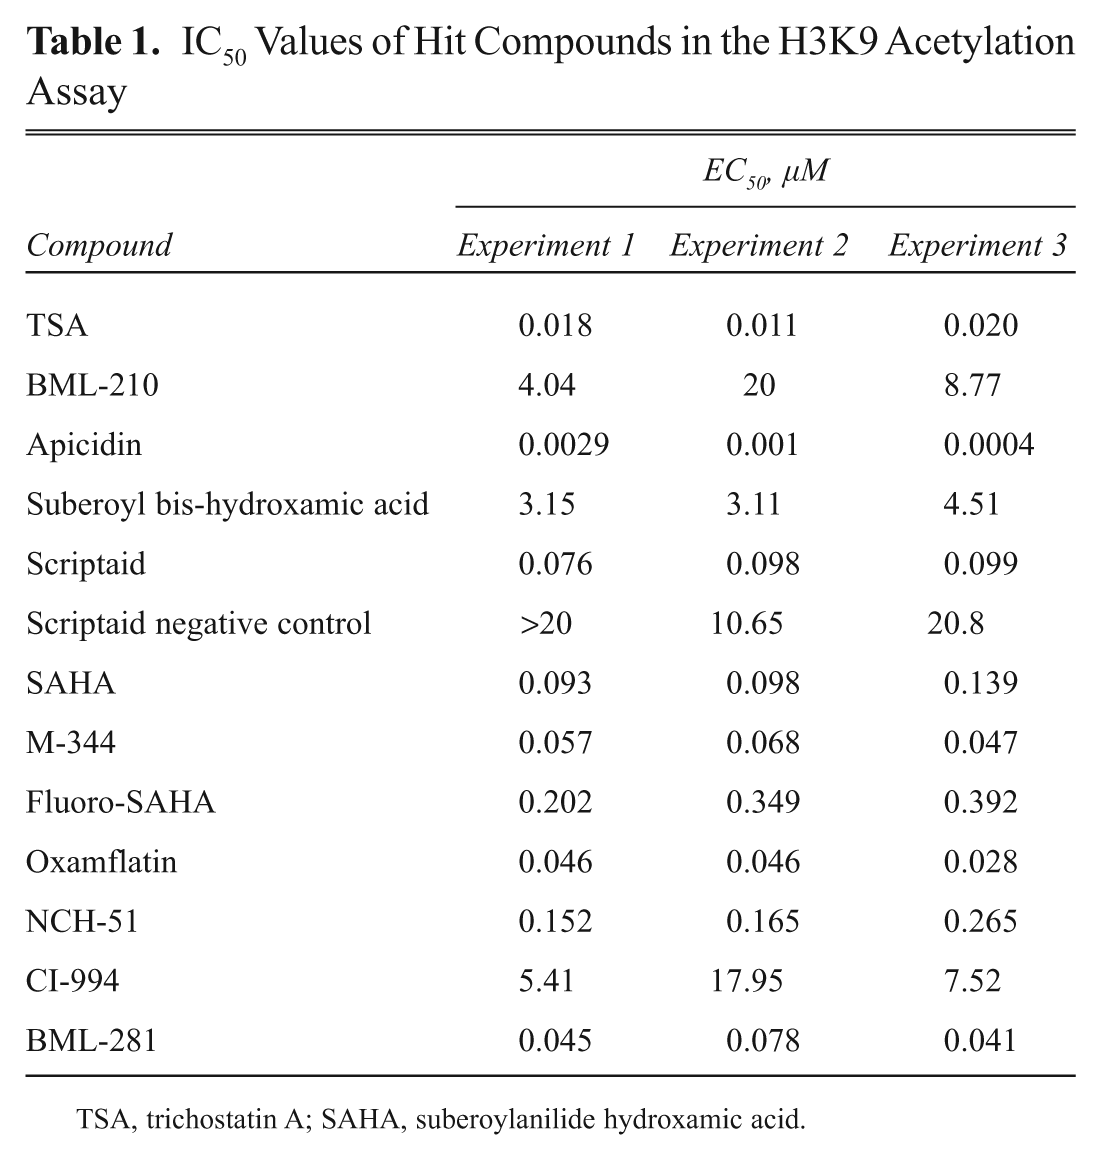
TSA, trichostatin A; SAHA, suberoylanilide hydroxamic acid.
Discussion
Histones are subject to a wide variety of transient posttranslational modifications. These highly dynamic modification patterns, referred to as the “histone code,” are instrumental for the regulation of chromatin function and intimately involved in the control of fundamental cellular functions including gene expression and cell cycle control. Specific changes of individual posttranslational histone modifications (histone code) have been identified as potential biomarkers for progression and prognosis of numerous human diseases, particularly cancer. 2 Histone-modifying enzymes have been pursued as potential drug targets, which led to the successful clinical development and Food and Drug Administration approval of two HDAC inhibitors, SAHA (vorinostat) and FK-228 (romidepsin). However, few assay platforms meet the demands of compound screening while preserving the complex biology associated with epigenetic regulation of gene expression and cell cycle control. To address this need, we have developed a fully homogeneous cell-based immunoassay for the analysis of histone modifications using a TR-FRET-based assay format. This technology has been previously applied to the cellular detection of nonhistone protein phosphorylation11,24 and acetylation 12 and represents a novel high-throughput alternative to commonly used Western blot analysis and ELISA-type assays.
As mentioned before, one of the key challenges for the analysis of histone modifications is the tight association of histones with genomic DNA. Standard methods employed for isolation of histone proteins from cellular lysates require an acid or high-salt extraction step to separate histone proteins from genomic DNA. The complexities of these methods make them highly impractical for the processing and analysis of large sample numbers typically associated with screening experiments. The TR-FRET cellular assays reported here are in a fully homogeneous format without any washing, lysate transfer, or separation procedures. Cells can be transduced with BacMam GFP–Histone H3 directly in a 384-well assay plate, treated as desired, and then incubated with 6 × lysis buffer containing Tb-labeled detection antibody added directly to the wells. The utility of this TR-FRET assay platform in screening for modulators of Histone H3–modifying enzymes was demonstrated here using the H3K9 acetylation assay for profiling the 43-compound Enzo Epigenetics Library. Most cellular IC50 values of known HDAC inhibitors reported in the literature were generated in different cell types using cell proliferation or transcriptional reporter genes assays. For the first time, the cellular IC50 values of 12 known HDAC inhibitors for inhibiting the deacetylation of H3K9 in U-2 OS cells are reported here.
As demonstrated for H3K9 acetylation, H3K27me3, and H3K4me3 TR-FRET assays, the use of the BacMam gene delivery system enables the measurement of histone modifications in a variety of cell backgrounds, including primary cells, which is important since expression and activities of histone-modifying enzymes vary considerably in different cell backgrounds. For instance, H3K27me3 methyltransferase EZH2 is overexpressed in a variety of cancer cells, resulting in higher levels of H3K27me3 in those cells. 4 The portability of this TR-FRET cellular assay format allows the interrogation of specific histone modification in a disease-relevant cell background.
Another advantage of this assay platform is that it is highly expandable. Here we report the measurement of H3K4me2, H3K4me3, H3K9me2, H3K9 acetylation, H3S10 phosphorylation, and H3K27me3 using this assay platform. However, Histone H3 is known to have numerous other modifications, including methylation of K36, K79, R2, and R17, as well as acetylation of K27 and K45. 1 As long as a good modification-specific antibody is available in combination with the appropriate cell type, TR-FRET cellular assays for those modifications can be easily developed and applied for high-throughput analysis.
The use of a Tb-labeled modification-specific antibody in the TR-FRET assay often raises the concern of assay specificity, which is highly dependent on the specificity of the antibody used. The specificity of the Tb-anti-methylation detection antibodies described in this study was determined using a biochemical TR-FRET binding assay, where the Tb-labeled antibody was mixed with biotinylated-Histone H3 peptide (unmethylated or mono-, di-, or trimethylated at different sites) and Alexa Fluor(R) 488–streptavidin. The H3K27me3, H3K4me2, and H3K9me2 antibodies strongly bind to their specific peptides, respectively, without any detectable binding to other peptides (data not shown). H3K4me3 antibody strongly binds to H3K4me3, lesser to H3K4me2, and not at all to other peptides (data not shown). These data indicate that the TR-FRET assay format reported here can be used to specifically monitor any Histone H3 modification of interest if well-characterized antibodies are available.
The use of the GFP-tag also raises the question of whether the TR-FRET assay described here faithfully reproduces the biology of endogenous Histone H3. The results from imaging experiments (
Fig. 1A
and
The TR-FRET assays for Histone H3 modifications described here can be used for a broad range of applications. Besides their utility for the interrogation of endogenous histone-modifying enzymes, they also can be combined with an ectopically expressed modifying enzyme of interest, for instance, a specific demethylase. This approach has been recently demonstrated for p53 acetylation at K382 by HAT p300 or deacetylation by SIRT1. 12 In combination with RNAi-mediated gene knockdown, these assays can also be used to investigate the functions of other components in protein complexes that contain histone-modifying enzymes. Furthermore, this assay format can be applied to the analysis of crosstalk and interference between different histone modifications. For instance, using this assay format, a dose-dependent reduction of H3K9me2 levels in response to treatment with the HDAC inhibitor TSA was detected. In contrast, TSA induced an increase in the H3K4me2 level (data not shown), which is consistent with previous reports. 25
In summary, this report describes the development of a high-throughput screening compatible TR-FRET-based cellular assay platform for monitoring Histone H3 modifications, which can be applied for drug discovery of modulators of Histone H3–modifying enzymes.
Footnotes
References
Supplementary Material
Please find the following supplemental material available below.
For Open Access articles published under a Creative Commons License, all supplemental material carries the same license as the article it is associated with.
For non-Open Access articles published, all supplemental material carries a non-exclusive license, and permission requests for re-use of supplemental material or any part of supplemental material shall be sent directly to the copyright owner as specified in the copyright notice associated with the article.