
Abstract
The cancer stem cell (CSC) hypothesis proposes that a subpopulation of CSCs is frequently responsible for chemotherapy resistance and metastasis and is now a point of attack for research into the next generation of therapeutics. Although many of these agents are directed at inducing CSC apoptosis (as well as the bulk tumor), some agents may also decrease cell “stemness” possibly through induction of differentiation. Ubiquitin ligases, critical to virtually all cellular signaling systems, alter the degradation or trafficking of most proteins in the cell, and indeed broad perturbation of this system, through inhibition of the proteosome, is a successful cancer treatment. The authors examined several glioblastoma stem cell isolates pre- and postdifferentiation to elucidate the phenotypic effects following shRNA knockdown of ubiquitin ligases. The results were analyzed using high-content imaging (HCI) and identified ubiquitin ligases capable of inducing both CSC differentiation and apoptosis. Quite often these effects were specific to CSCs, as ubiquitin ligase knockdown in terminally differentiated progeny yielded markedly different results. The resolution of HCI at the subpopulation level makes it an excellent tool for the analysis of CSC phenotypic changes induced by shRNA knockdown and may suggest additional methods to target these cells for death or differentiation.
Introduction
The ubiquitin proteosome pathway is an essential component of many critical cellular pathways. Ubiquitin, a highly abundant and eukaryotically conserved 76–amino acid molecule, is linked to specific substrate proteins, thereby targeting them for degradation via the 26s proteosome or altering their subcellular localization.1,2 The well-characterized process by which a single ubiquitin molecule is added to a specific substrate occurs first through activation of an E1-activating enzyme, transfer to an E2-conjugating enzyme, and then through interaction between the E2 and E3 ubiquitin ligases.3,4 The nature of this pathway, with its few E1 enzymes, many E2 enzymes, and abundance of substrate-specific E3 enzymes, means that the inhibition of any one particular E3 should lead to the accumulation of only the small number of substrates targeted by that specific E3 subunit. In contrast, the inhibition of either the E1 or E2 portions of the pathway could have a variety of unintended consequences on completely unrelated pathways, possibly resulting in profound negative consequences.
Due to the deregulation of this system in a variety of diseases, including many cancers, this pathway has been targeted by a number of therapies. The majority of these therapies focused on either well-characterized cell cycle and tumor suppressor pathways, such as MDM2/p53 and p27, or broad inhibitors of ubiquitin-mediated degradation through modification of the 26S proteosome pathway.5,6 The best example of a molecule successfully targeting the ubiquitin ligase and proteosome degradation pathway is bortezomib, marketed as Velcade, which inhibits protein degradation by the 26S proteosome and is now approved in the United States for the treatment of relapsed multiple myeloma and mantle cell lymphoma.7,8
Screening of the knockdown effects of E3 ubiquitin ligases in both standard transformed cancer cell lines and tumor stem cells may identify new methods to interact with a variety of known pathways, potentially resulting in previously undisclosed phenotypic outcomes. Furthermore, this approach may identify novel pathways that affect the growth and resistance to treatment of cancer stem cells (CSCs). We chose to model these knockdowns in one of the most devastating cancers, one in which CSCs play a crucial role in tumor recurrence—glioblastoma multiforme.9,10 The median survival time for a patient diagnosed with this disease is approximately 1 year, and treatment is complicated due to both the location of the tumor as well as its aggressive and infiltrative growth. 11 In addition to these complications, this form of tumor is highly resistant to radiation as well as many common chemotherapeutic agents, and CSCs are thought to be central to many of these events. 12
Cancer therapeutics attempt to kill cancer cells outright through inhibition of cell cycle targets, deregulation of angiogenic pathways, or targeted attacks on cellular targets critical to tumor cell survival. 13 However, these therapies have traditionally failed at modulation of the CSCs, suggesting that in addition to standard treatments effective against the bulk of the tumor, adjuvant therapies may be devised to specifically target the CSC subpopulations. Besides targeting these cells for outright death, we have attempted to also differentiate glioblastoma CSCs to drive their eventual senescence or increase their susceptibility to traditional therapeutic treatments. The combination of both differentiation and apoptotic therapies may lead to a new way to treat CSC subpopulations in the tumor and ultimately could have far-reaching effects on patient survival.
Materials and Methods
Cell culture and treatment
U-87 MG cells were grown according to American Type Culture Collection (ATCC, Manassas, VA) guidelines. Glioblastoma stem cells were isolated from primary tumors, mechanically dissociated, and grown as semi-adherent neurospheres in the absence of fetal bovine serum (FBS) and presence of epidermal growth factor (EGF) and basic fibroblast growth factor (FGF) as previously described.12,14,15 These cells were grown for up to 15 passages without significant changes in phenotype or neural stem cell marker expression. Glioblastoma stem cells were grown using Neural Progenitor Maintenance Media Bullet Kit (#CC-3210; Lonza, Basel, Switzerland) supplemented with #CC-4241 and #CC-4242. Differentiated glioblastoma stem cells were grown in Dulbecco’s modified Eagle’s medium (DMEM; #12430-104; Invitrogen, Carlsbad, CA) supplemented with 10% FBS for 1 month prior to short-hairpin RNA (shRNA) knockdown. All cells were grown in uncoated tissue culture–treated flasks prior to plating for high-content imaging (HCI) and cultured in a humidified atmosphere at 37 °C and 5% CO2. For the assays described below, cells were plated onto poly-D-lysine-coated 96-well dishes (#356640; BD Biosciences, Franklin Lakes, NJ) at a density of either 3000 (U-87 MG) or 10 000 (for all stem cell clones) cells in 100 µL of growth media as determined by a Beckman Coulter (Brea, CA) Vi-Cell viability analyzer. Cells were transduced with Mission lentiviral particles (Sigma-Aldrich, St. Louis, MO) ( Table 1 ). Then, 10 µL of prepared virus was added to cells at 3 to 5 infectious units per cell in a final concentration of 8 µg/mL of protamine sulfate and a volume of 50 µL of growth media for 18 h. Additional growth media were then added to a final volume of 100 µL, and the cells were grown for a total period of 6 days post-transduction. For quantitative real-time rtPCR, RNA was extracted at 6 days post-transduction using an ABI nucleic acid prep station and RNA Purification Tray (#4305673; ABI Carlsbad, CA), amplified using an ABI GeneAmp 9700 in conjunction with a high-capacity cDNA kit (#4368813; ABI), detected at three dilutions in duplicate using an ABI 7900HT Sequence Detection System, and analyzed using SDS 2.2. All samples were compared to both actin and GAPDH controls.
Short-Hairpin RNA Constructs Used to Knock Down Ubiquitin Ligase Expression in Cancer Cells
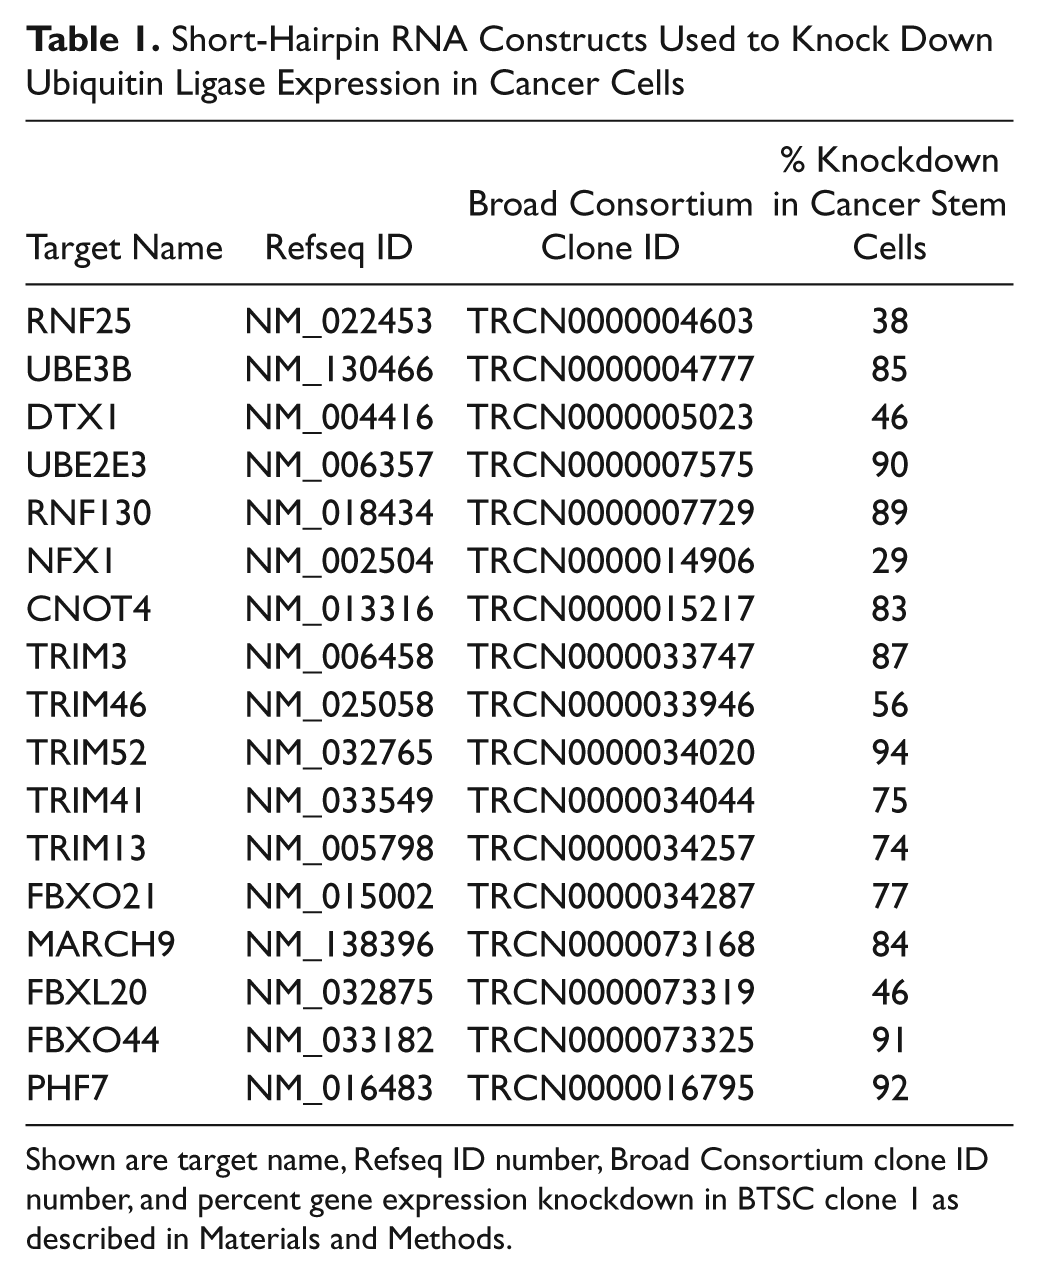
Shown are target name, Refseq ID number, Broad Consortium clone ID number, and percent gene expression knockdown in BTSC clone 1 as described in Materials and Methods.
Immunofluorescence
Cells were fixed with 3.7% formaldehyde for 20 min at 37 °C and permeabilized with 0.1% Triton-X 100 for 10 min at 25 °C. All following dilutions were performed in phosphate-buffered saline (PBS) at 25 °C. Fixative was removed and each well washed with PBS. Cells were blocked using 1% bovine serum albumin (BSA; #15260-037; Invitrogen) for 1 h at 25 °C. Primary antibodies to Sox2 (#MAB4343; Millipore, Billerica, MA), Nestin (#Ab5968-100; Abcam, Cambridge, UK), and Ki67 (#RM-9106-S; Neomarkers, Fremont, CA) were diluted in 1% BSA, and this mixture added to each well overnight at 4 °C. Each well was then washed three times with 200 µL of PBS and incubated for 1 h at 25 °C with a solution containing 5 µg/mL goat α-mouse-Alexa-555 (#A-21422; Molecular Probes, Eugene, OR), 5 µg/mL goat α-rabbit-Alexa-647 (#A-21244; Molecular Probes), and 200 ng/mL Hoechst 33342 to detect nuclear material (#21492; Molecular Probes). Terminal deoxynucleotidyl transferase biotin-dUTP nick end labeling (TUNEL) analysis was then performed using the Roche in situ cell death detection kit with fluorescein (#1 684 795; Roche, Basel, Switzerland) and stored at 4 °C until analysis.
Fluorescent imaging and statistical analysis
Cell images were captured using a Cellomics Arrayscan VTI and analyzed with the Target Activation BioApplication (Thermo Fisher, Waltham, MA). Depending on the experiment, three or four channels were read at a magnification of 10×. A minimum of 1000 individual cellular images or 20 fields were captured for each condition. For each cell, along with the fluorescence intensity from each channel, nuclear area was measured. For heat map analysis, Arrayscan VTI data were transformed to a log2 format and further analyzed using unsupervised K-means clustering to group subpopulations with similar profiles as previously reported. 16 All populations were compared to control populations treated with an shRNA to green fluorescent protein (GFP) and clustered across all plates within the same cell type. Subpopulation clusters were derived from the entire population of each cell type screened and intensities based on the standard deviation away from the mean of the control (short-hairpin GFP [shGFP] treated) population. All images are shown at an image stretch of four using the Cellomics View software.
Results and Discussion
The 28 shRNA constructs capable of inhibiting cell growth were identified from a screen of a total of 312 ubiquitin ligases individually knocked down in HCT-116 cells following a 6-day incubation. Ubiquitin ligases were chosen as a target class not only for their ability to affect nearly any pathway in normal, tumor, and CSCs but also for their relatively poor characterization and low level of development in the pharmaceutical industry. The HCT-116 colorectal cancer model, our lab’s workhorse model, is a frequently used cancer screening cell line that retains p53 function and generates a useful baseline phenotype for each construct. From the screen, 17 ubiquitin ligases were further characterized based on their apoptotic phenotypes generated by multiple shRNA constructs per target, novelty, and poor characterization in the literature ( Table 1 ).
As the ubiquitin ligase machinery is likely conserved across cell lines/histologies, the 17 shRNA were characterized in multiple glioblastoma models. First, the effects of shRNA knockdown of these targets were characterized in U-87 MG cells, which are derived from cells resected from a patient with glioblastoma multiforme.17,18 This line was chosen for its similarity (in terms of lineage) to the brain tumor stem cell clones used in later experiments, although it does not retain any stem cell–like attributes (data not shown). To determine both the apoptotic and cell cycle effects after knockdown of these ubiquitin ligases, U-87 MG cells were fixed and stained for the presence of activated caspase-3, a marker for apoptosis, and cyclin B1, a marker for arrest in the G2/mitotic compartments of the cell cycle that is also upregulated in apoptosis.19–21 DNA was visualized using Hoescht 33342 dye and was used to identify each cell using the ArrayScan VTI software. The relative levels of staining were then captured using the Target Activation bioapplication of the ArrayScan VTI and compared to a control population of U-87 MG cells transduced with an shGFP construct (which serves as our nontargeting control shRNA). The Target Activation bioapplication, although relatively simple, detects the most important phenotypic changes occurring upon treatment and is flexible enough to be used in a wide variety of experimental settings.
To visualize the phenotypic changes found in each subpopulation, the HCI data were extracted from individual cells and clustered into cellular subpopulations through unsupervised K-means clustering as previously described.
16
Heat maps that group like U-87 MG cells together were generated with a user-defined number of clusters based on similarity of cells to each other across all six imaging parameters. The colors displayed in the heat map indicate shifts in standard deviations, as shown by the bar at the right of each heat map, away from the average of the control population. Shifts to red denote a signal increase and shifts to blue denote a signal decrease. Each row of the heat map contains data from one cell, and those cells are sorted in each cluster based on their total DNA intensity, from high to low. The numbers on the left side of each cluster refer to the fraction of the total number of cells in that cluster. A decrease in Hoescht-stained cells per field generated additional data indicating that certain treatments led to either cell cycle arrest or cell death depending on the presence or absence of activated caspase-3 (
Fig. 1
). The heat maps generated by all remaining shRNA constructs in these cells can be found in
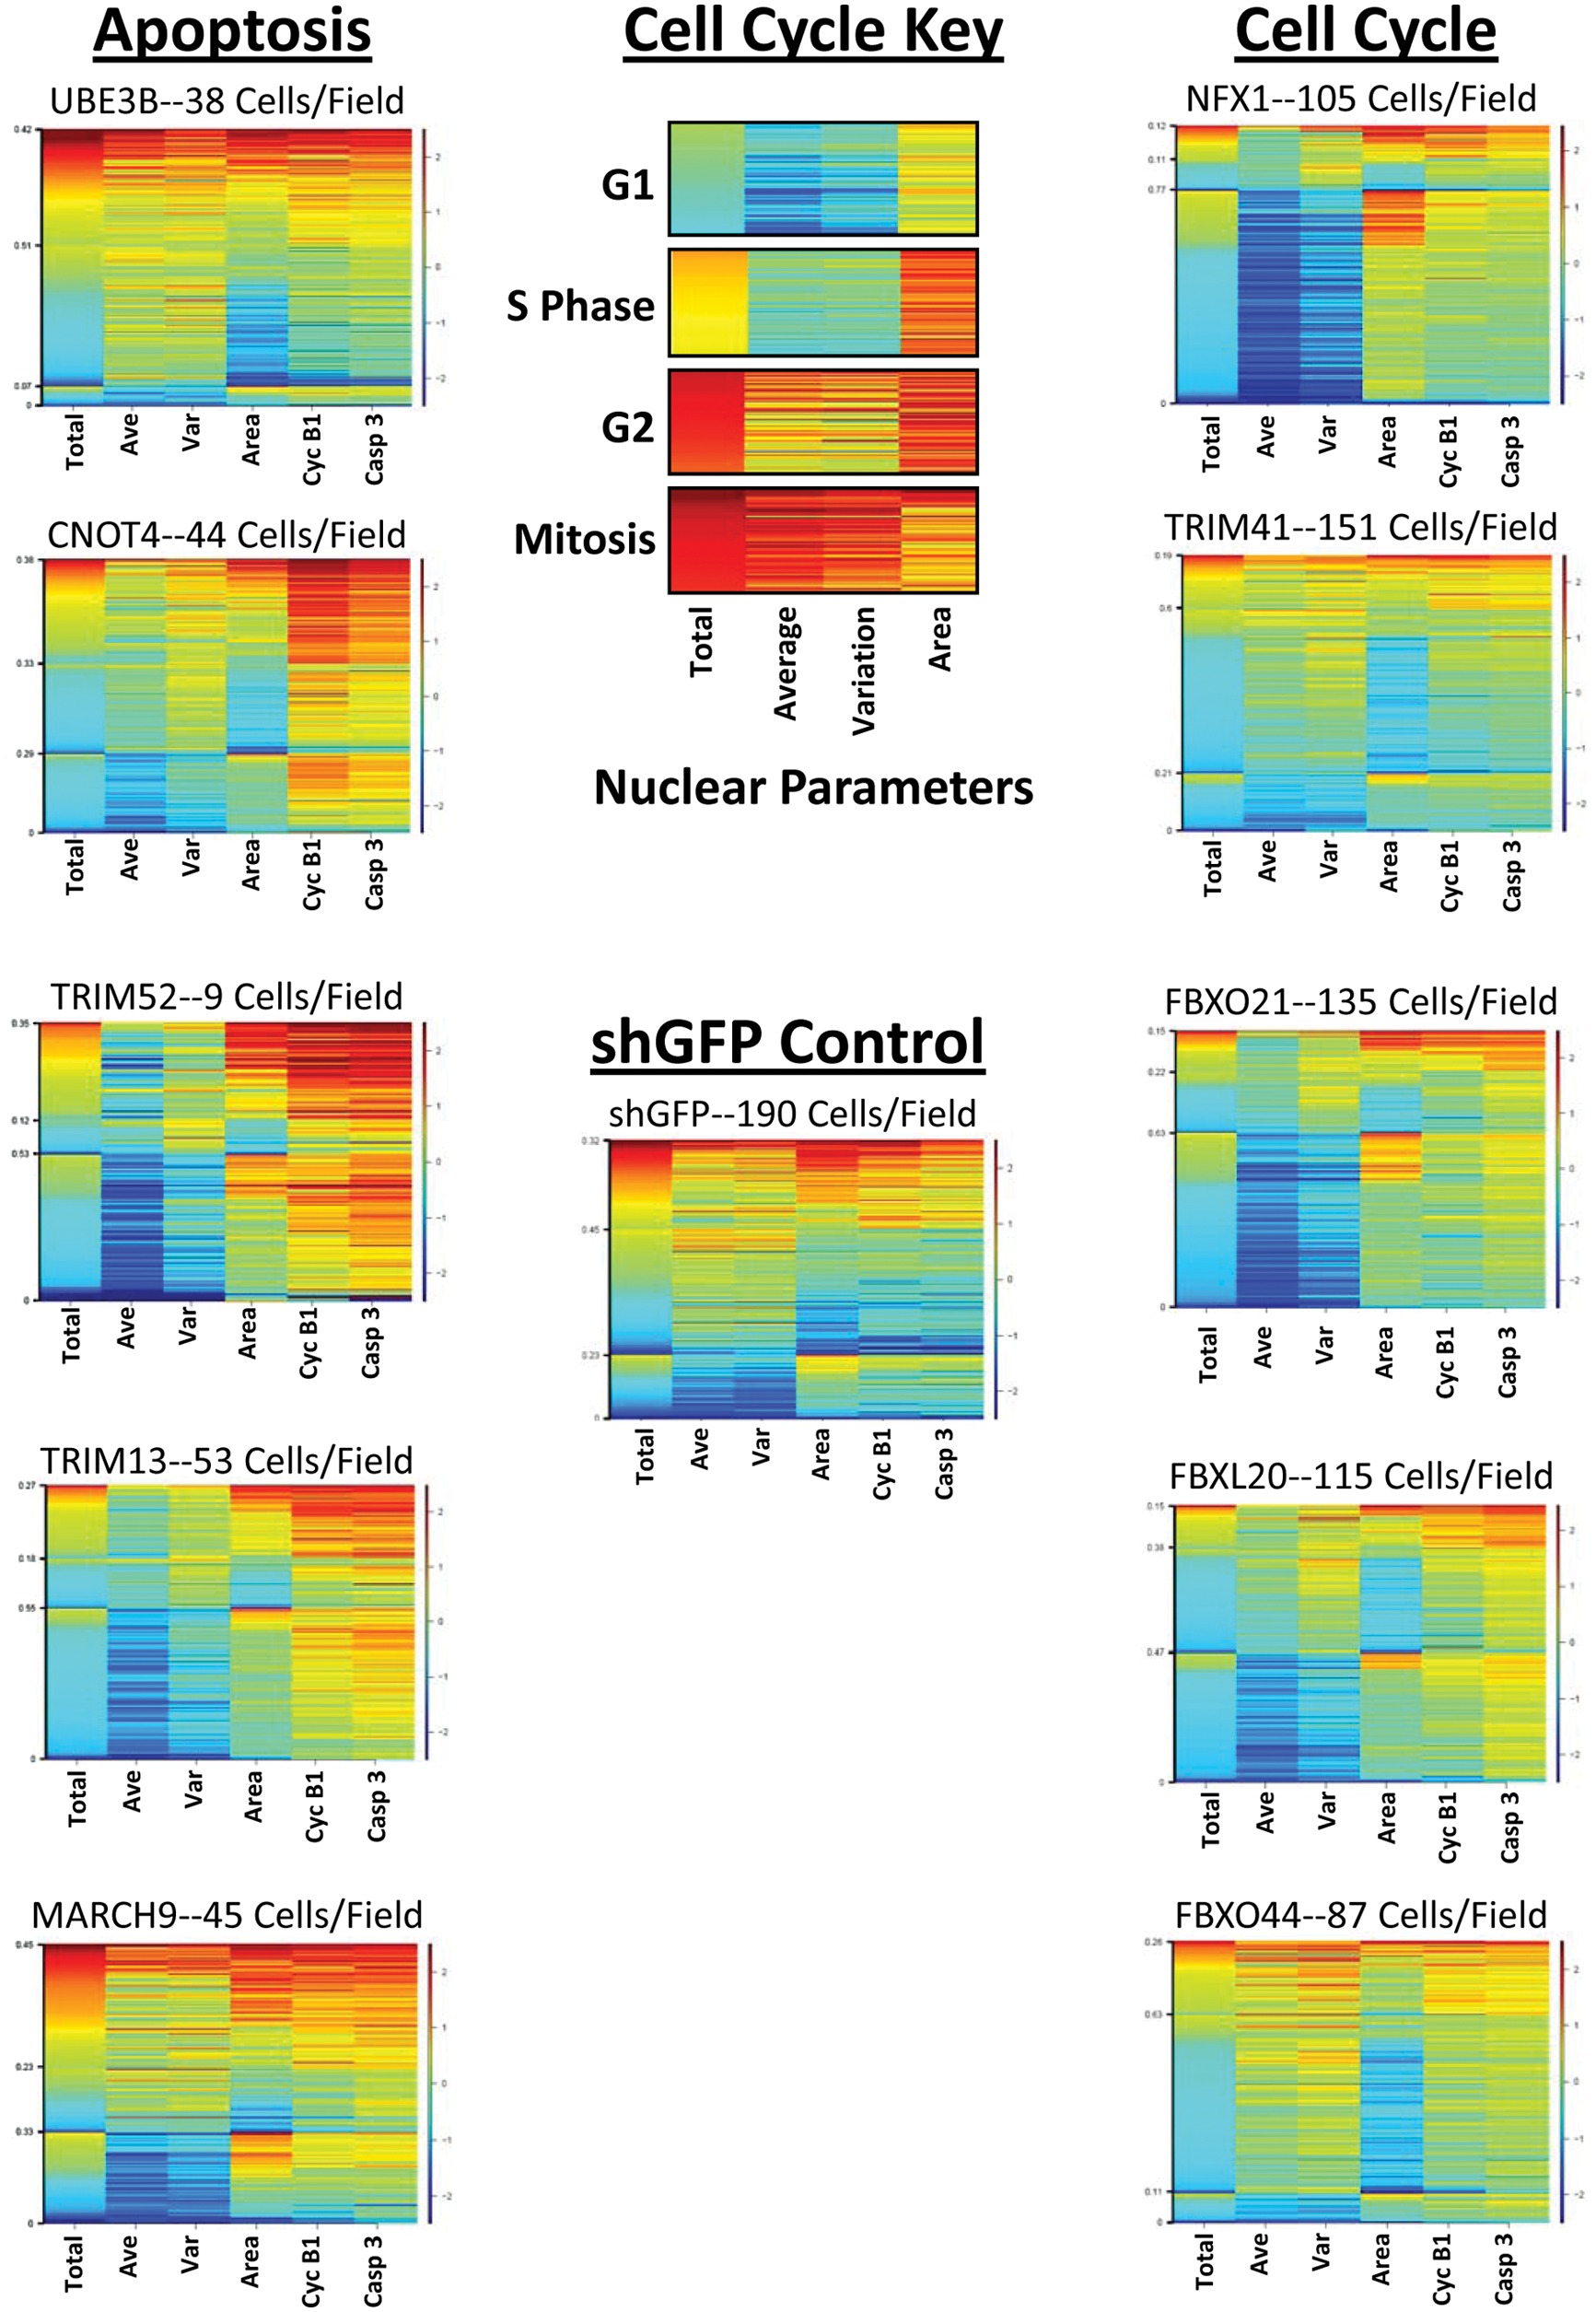
Knockdown of ubiquitin ligases in U-87 MG cells leads to apoptosis or cell cycle arrest. U-87 MG cells were treated for 6 days with lentiviral constructs against specific ubiquitin ligases and then stained to detect DNA, cyclin B1 expression, and activated caspase-3 expression. The heat maps above were created by clustering the data from individual cells and sorting each cluster based on the total DNA intensity of the nucleus. The numbers on the left side of each heat map denote the fraction of cells in each cluster. The six parameters measured from every cell are listed below each column: total DNA intensity (Total), average DNA intensity (Ave), variation of DNA intensity (Var), nuclear area (Area), cyclin B1 (Cyc B1), and activated caspase-3 (Casp 3). A heat map key demonstrates the nuclear phenotype of cells in each stage of the cell cycle. The staining intensities are compared back to a population transduced with a short-hairpin green fluorescent protein (shGFP) control to determine relative levels of expression across the assay.
The five constructs—UBE3B, CNOT4, TRIM52, TRIM13, and MARCH9—shown under “Apoptosis” in Figure 1 generated apoptotic phenotypes when knocked down in U-87 MG cells. These constructs induced large increases in activated caspase-3 staining while markedly decreasing the number of cells per field. The best example of this phenotype is TRIM52, where only 176 cells were recorded over a total of 20 fields for an average of only 9 cells/field (as compared to control shGFP-treated cells with 190 cells/field). Increases in cyclin B1 also revealed a potential cell cycle effect on these cells or may be a result of apoptosis. 19 In contrast are the constructs—NFX1, TRIM41, FBXO21, FBXL20, and FBXO44—listed under “Cell Cycle,” which led to an apparent cell cycle arrest or senescence upon knockdown. These constructs, best typified by NFX1, maintain nuclear phenotypes of cells in G1 and demonstrate cells per field counts lower than those of the shGFP control. Although these treatments contain fewer cells per field, the lack of large amounts of activated caspase-3 indicates that the decreased cell number is not due to apoptosis but likely from a slowed or arrested cell cycle.
As CSCs become more commonly considered and targeted in chemotherapy, it becomes necessary to understand how a given treatment or cellular perturbation may affect these cells as well as the bulk tumor population. CSCs isolated from patients with glioblastoma multiforme are frequently highly resistant to the majority of common therapeutic agents.12,14 Although these cells have been previously shown to be resistant to a number of agents, to confirm maintenance of chemoresistance, we tested a number of targeted and cytotoxic agents against these cells. The majority of the compounds had little effect at concentrations 10-fold greater than is typically required for apoptosis induction in non–stem cell culture models. In this experiment, CSCs derived from the brain (BTSC1) were treated with compound, fixed, and stained for the presence of neural stem cell markers Nestin (an intermediate filament protein) and Sox2 (a transcription factor). In addition, these cells were subjected to a stain for TUNEL activity, a common measure of terminal apoptosis. We chose BTSC#1 because of its experimental reproducibility and reliability both in vitro and in vivo. In vivo, these cells always give rise to a tumor when injected subcutaneously in a rodent xenograft model or upon orthotopic injection into the brain, and the subsequent tumor recapitulates the original patient tumor. This clone is therefore an ideal experimental CSC model in which to evaluate a variety of cellular perturbations. Figure 2 demonstrates that the 500-nM nocodazole treatment for a period of 72 h had little effect on overall phenotype when compared to a DMSO control and increased TUNEL staining only slightly. In nearly all of our cancer cell models, this concentration of nocodazole is sufficient at inducing apoptosis after one to two cell doublings (data not shown). Additional compounds tested with minimal or no phenotypic effect on these cells included doxorubicin, staurosporine, and puromycin, as well as a number of proprietary protein kinase targeted agents (data not shown). In contrast, the proteosome inhibitor bortezomib had a profound apoptotic effect at 16 nM, a concentration that commonly elicits a phenotypic response in non–stem cancer cell lines. 22 These results suggested that although these cells were resistant to many agents, the inhibition of ubiquitin ligase activity may lead to altered phenotypes in CSCs isolated from glioblastoma multiforme. Thus, the specific knockdown of some ubiquitin ligases may affect gene expression patterns in glioblastoma CSCs and allow them to be targeted in a manner not possible with most therapeutic agents.
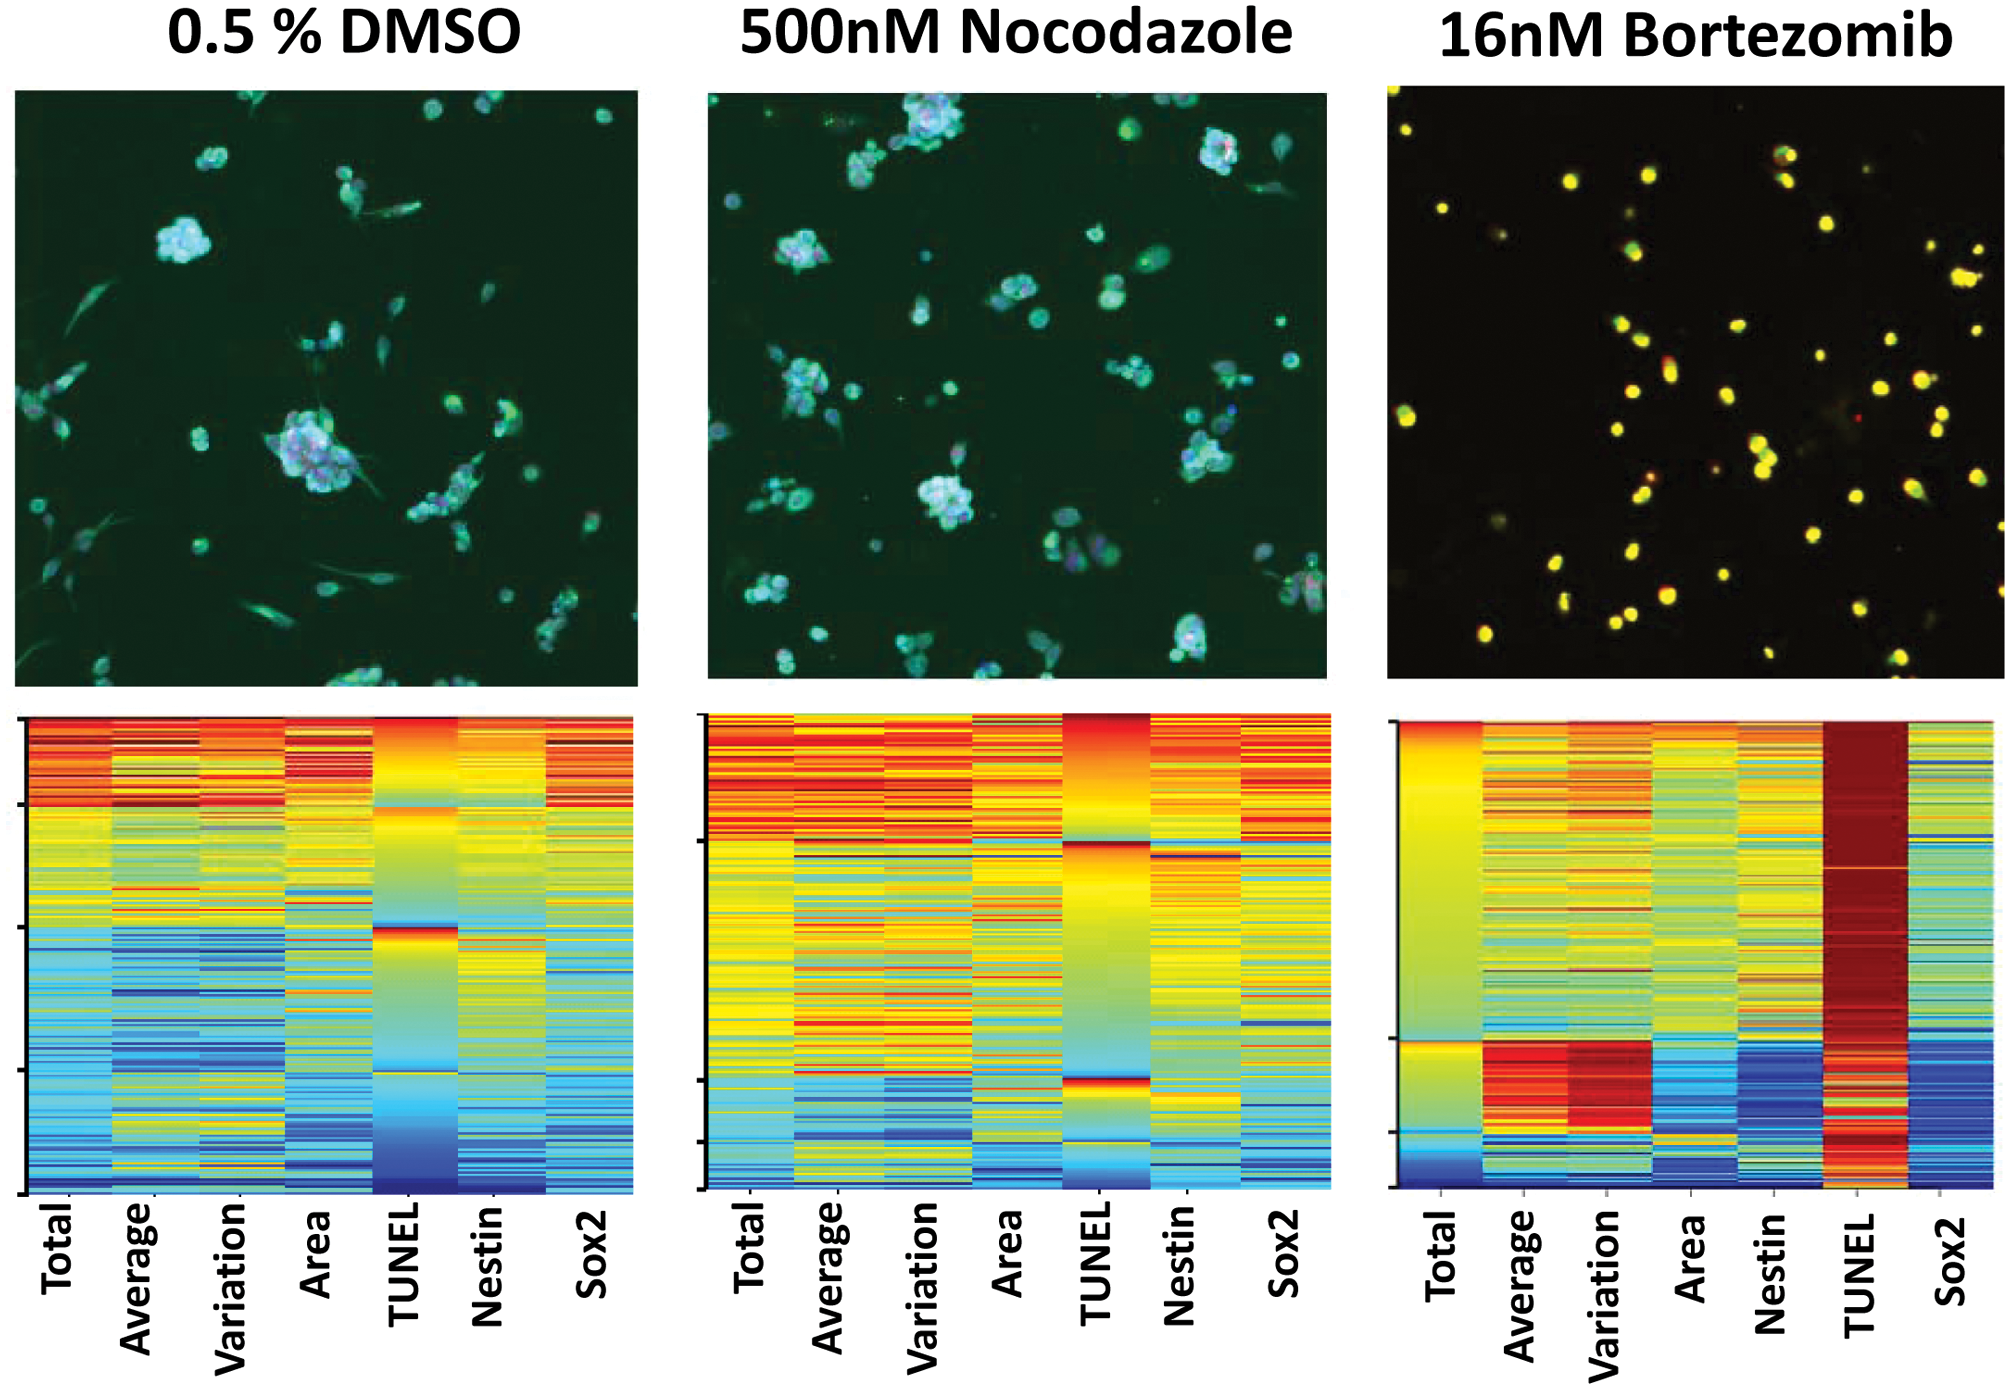
BTSC clone 1 is resistant to some therapeutic agents but susceptible to proteosome inhibition. BTSC1 cells were treated for 72 h with either 500 nm nocodazole or 16 nM bortezomib. The seven parameters measured from every cell are listed below each column: total DNA intensity (Total), average DNA intensity (Ave), variation of DNA intensity (Var), nuclear area (Area), total TUNEL (TUNEL), total Nestin (Nestin), and total Sox2 (Sox2). To determine relative levels of expression across the assay, the staining intensities are compared back to a control treatment of 0.5% DMSO. TUNEL, terminal deoxynucleotidyl transferase biotin-dUTP nick end labeling.
The ubiquitin ligase gene knockdowns shown in Figure 1 were then performed in the glioblastoma-derived CSCs, which were then stained for the presence of the neural stem cell transcription factor Sox2, the filament protein Nestin, and apoptotic TUNEL staining. The glioblastoma CSC used in these experiments was chosen for its expression of p53 as well as stem cell markers, including CD133, Nestin, and Sox2; a relatively fast doubling time of 72 h; and lack of senescence upon differentiation. 23 Gene knockdowns in these cells were performed for 6 days prior to fixation and staining. The immunostained cells were then imaged using an ArrayScan VTI as indicated above and heat maps of their phenotypic fingerprints generated. 24
Surprisingly, many of the gene knockdowns did not lead to apoptotic cell death as observed in the U-87 MG model but rather led to marked changes in overall cellular phenotype as well as changes in the expression of neural stem cell markers. Interestingly, the constructs generating apoptotic and reduced stem cell marker expression (which we term differentiation based on extreme morphological changes and the appearance of differentiation markers; see below) were not always the same constructs that had caused similar phenotypes in the U-87 MG cells. In Figure 3 , the phenotypes are grouped into two major categories—apoptosis and differentiation. All staining intensities after shRNA knockdown were compared back to a control population of cells treated with an shRNA against GFP ( Fig. 3 , center heat map).
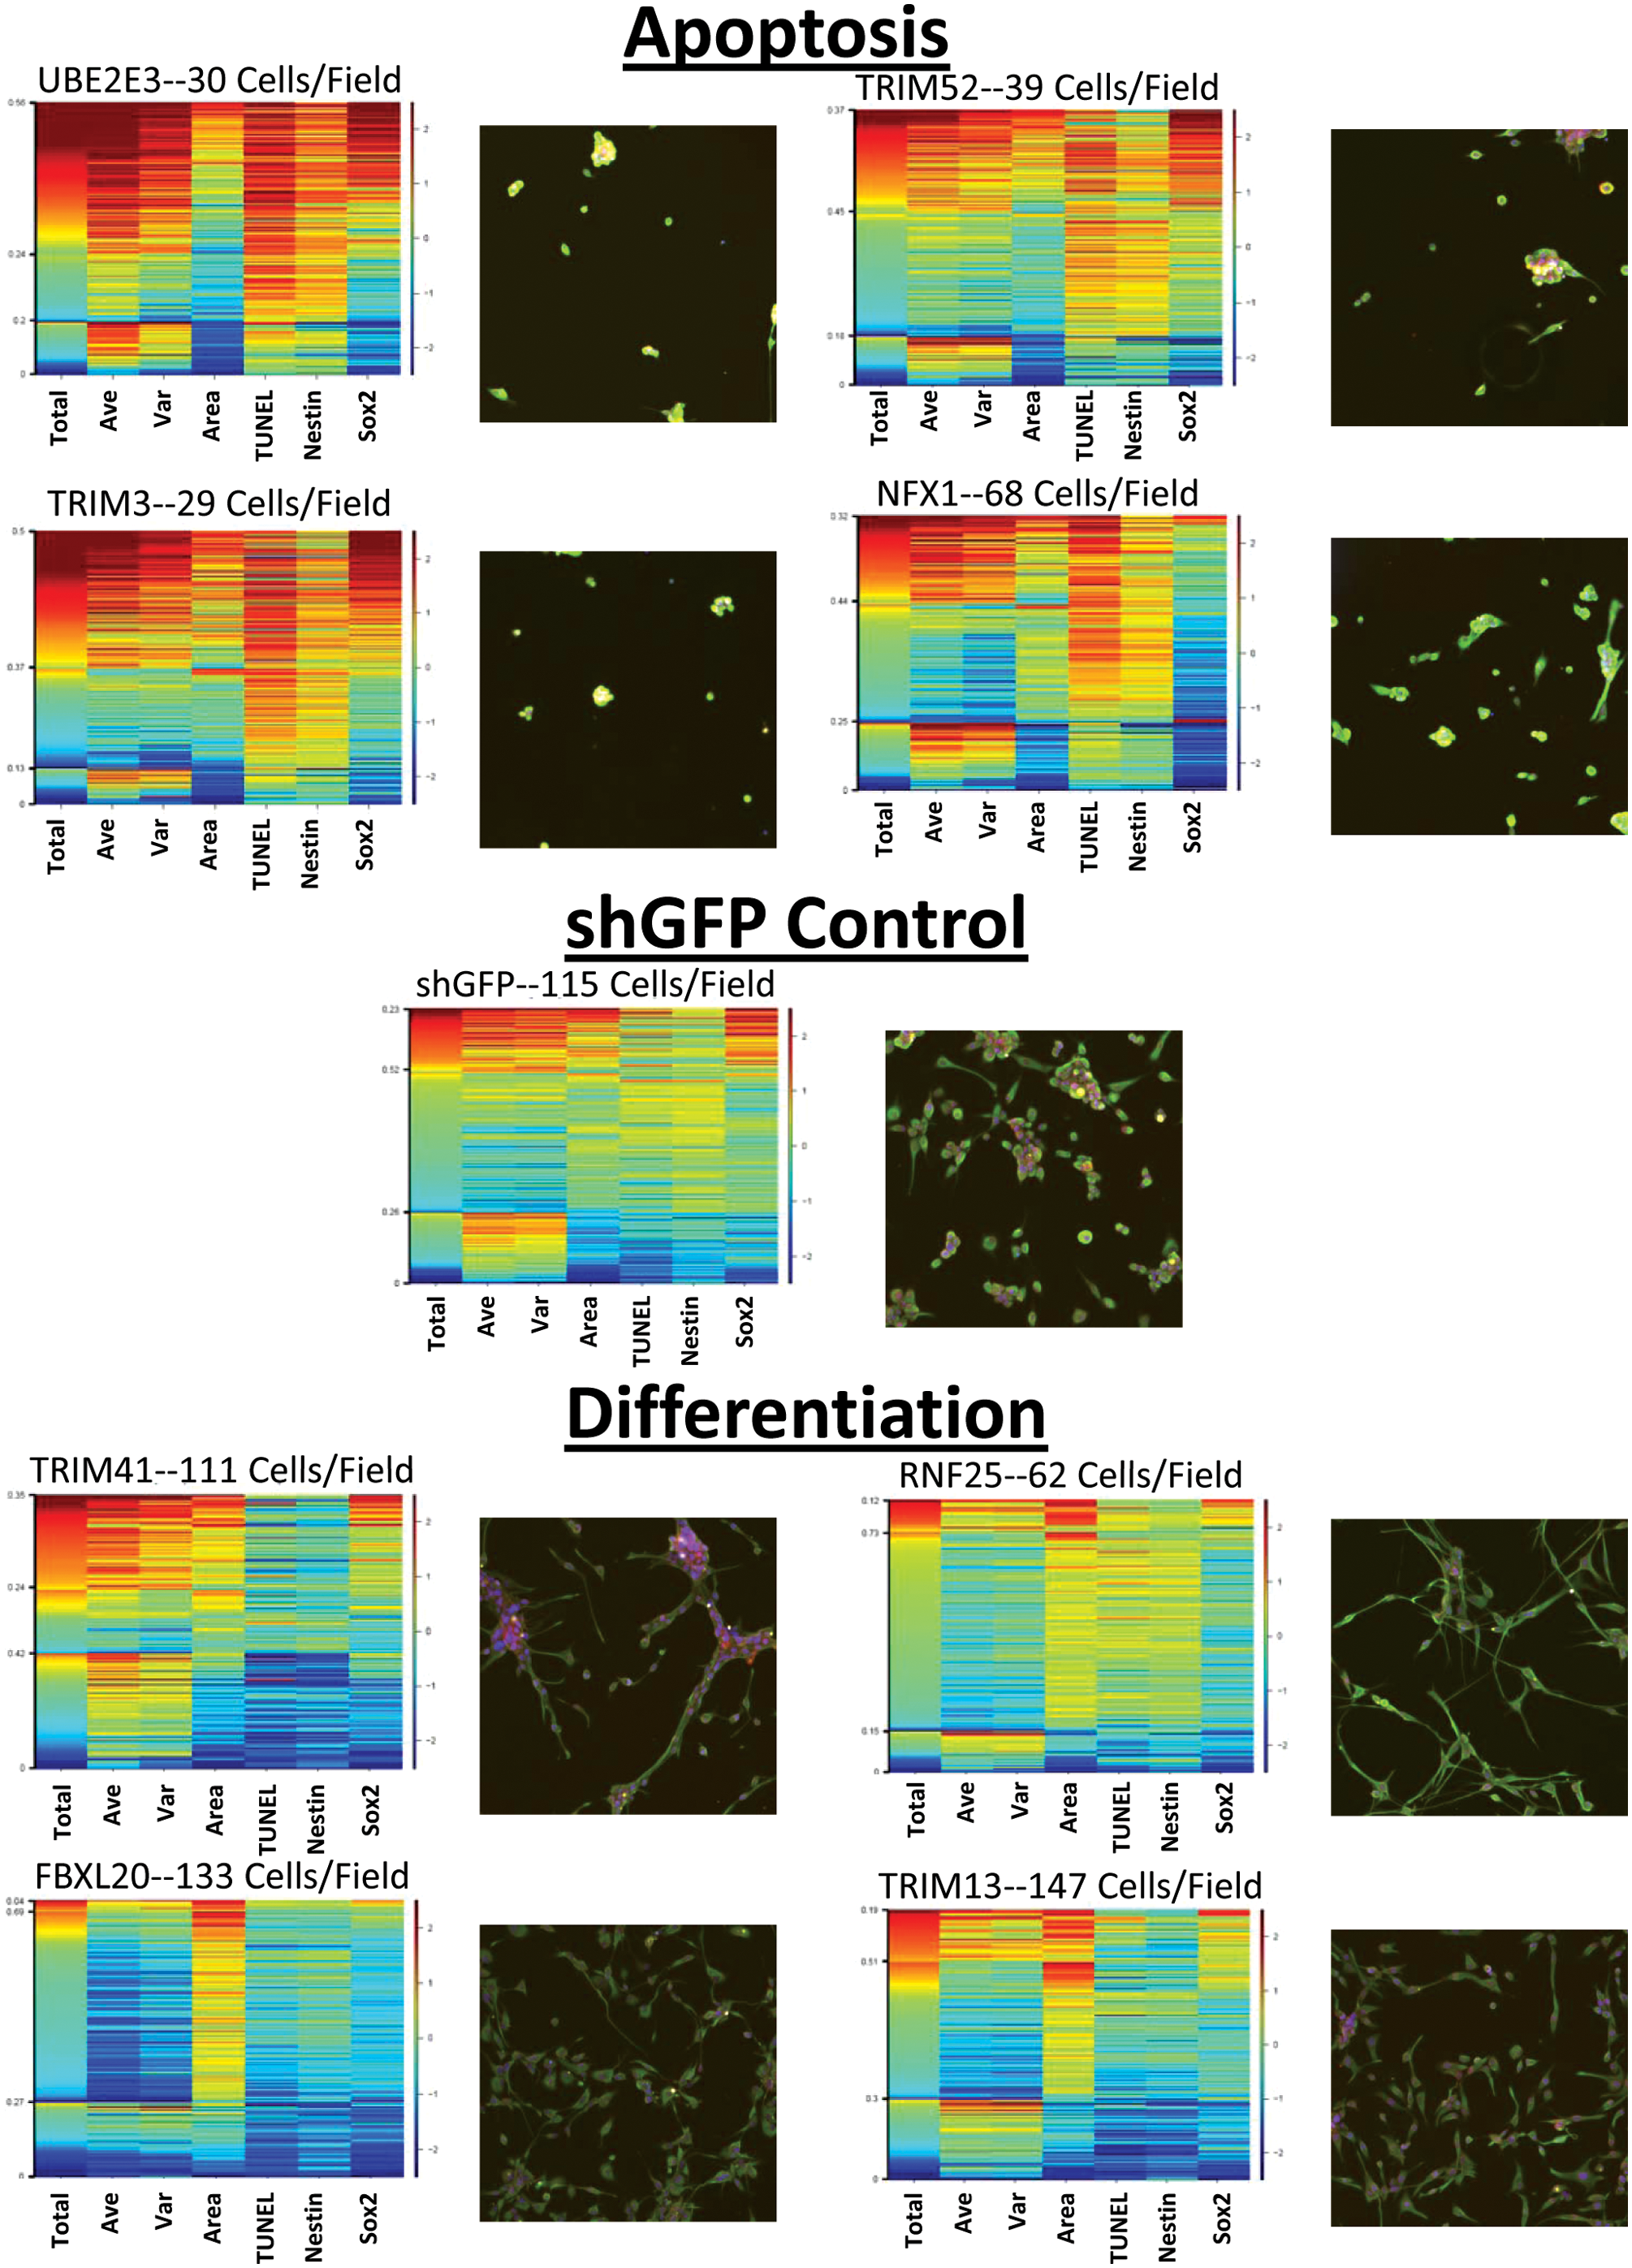
Knockdown of ubiquitin ligases in BTSC1 leads to cell death or differentiation. Undifferentiated glioblastoma stem cells were treated for 6 days with lentiviral constructs knocking down ubiquitin ligase expression and stained for the presence of DNA (blue), TUNEL (yellow), Nestin (green), or Sox2 (red). Four representative examples of images and heat maps are shown for constructs inducing either apoptosis or differentiation. The heat maps above were created by clustering the data from individual cells and sorting each cluster based on total nuclear DNA intensity. The numbers on the left side of each heat map denote the fraction of cells in each cluster. The seven parameters measured from every cell are listed below each column: total DNA intensity (Total), average DNA intensity (Ave), variation of DNA intensity (Var), nuclear area (Area), total TUNEL (TUNEL), total Nestin (Nestin), and total Sox2 (Sox2). To determine relative levels of expression across the assay, the staining intensities are compared back to a short-hairpin green fluorescent protein (shGFP) control. TUNEL, terminal deoxynucleotidyl transferase biotin-dUTP nick end labeling.
The constructs targeting ubiquitin ligases UBE3E3, TRIM3, TRIM52, and NFX1 typify the CSC apoptotic phenotype found in these cells with large increases in TUNEL staining along with decreased cell number as compared to the shGFP control. Some of these constructs (such as NFX1) altered neural stem cell marker expression by decreasing the amount of Sox2 present in each cell. In contrast to the constructs that induced apoptosis are those that caused marked changes in the CSC phenotype as they led to what appeared to be different forms of neural differentiation. The constructs targeting ubiquitin ligases TRIM41, FBXL20, RNF25, and TRIM13 all appeared to differentiate BTSC1 but into a variety of phenotypes. TRIM41 knockdown led to nearly no Nestin expression, but as the cells grew together into strand-like bundles, they retained expression of Sox2. Cells in which TRIM13 was knocked down also expressed little Nestin and retained some Sox2 expression but have a morphology quite distinct from those in which TRIM41 was knocked down. In contrast to both of those phenotypes are cells in which RNF25 was knocked down, with retention of Nestin expression as they began extending protrusions but no longer expressing high levels of Sox2. Finally, knockdown of FBXL20 generated what appears to be a G1 arrest in BTSC1 while stopping the expression of both Nestin and Sox2 in the treated cells. Additional ubiquitin ligase knockdowns can be found in
Due to the prevalence of off-target effects in phenotypic shRNA screens, the knockdown phenotype generated against each of these targets was confirmed using multiple shRNA. Each of the shRNA knockdowns was confirmed by a minimum of two distinct shRNA constructs generating similar phenotypes across six nuclear, apoptotic, and cell cycle parameters. Knockdown of these genes at the transcript level was then confirmed using real-time rtPCR ( Table 1 ).
To confirm that these results were CSC line specific, this experiment was reproduced with an additional clone, BTSC61, with marker expression and growth patterns similar to BTSC1. BTSC61 also expresses CD133, Nestin, Sox2, and p53 and has a doubling time of 72 h. The same ubiquitin ligase targets listed above were knocked down as described for BTSC1 and stained for Nestin, TUNEL, and Sox2 to determine changes in apoptosis or differentiation. Ubiquitin ligase gene knockdown effects in BTSC61 were similar to those observed in BTSC1, indicating that these constructs may have a similar effect in additional forms of neural CSCs (data not shown).
The changes in phenotype indicate that cellular differentiation may be occurring upon knockdown of specific ubiquitin ligases, and although in the past, glioblastoma CSCs have been characterized after differentiation events, it is rare that biological events can be measured pre- and postdifferentiation in the same cell line. To test the effects of ubiquitin ligase knockdown on differentiated glioblastoma stem cells, BTSC1 was treated with 10% FBS for 30 days. Under these conditions, the CSCs grew well and, although altering their overall morphology and gene expression patterns, did not senesce.
23
The cells of this differentiated form of BTSC1 (“BTSCD1,” which poorly express Nestin and Sox2) were then treated as before with the ubiquitin ligase shRNA constructs followed by analysis of apoptotic and neural stem cell markers at 6 days post-transduction. Interestingly, some of the shRNA constructs generated widely divergent phenotypic responses when compared to BTSC1 (
Fig. 4
). In some cases, the phenotypic differences between the differentiated and undifferentiated clones were similar, such as the knockdown of TRIM3—although Sox2 staining appears to have increased upon gene knockdown in this clone, this is potentially due to the overall low level of Sox2 expression in the differentiated clone and as a result of apoptosis. Knockdown of TRIM3 led to apoptosis in both BTSC1 and BTSC1D with increased TUNEL and Nestin staining along with a decreased cell number. Knockdown of FBXL20 also led to similar phenotypes in both BTSC1 and BTSCD1, although the knockdown had a far less drastic effect on the cell cycle in BTSC1D than in BTSC1. In contrast, FBXO44 caused far more apoptosis in BTSC1D than it did in the undifferentiated form of the CSC. Finally, TRIM13, whose knockdown led to loss of Nestin expression in BTSC1, caused strong cell cycle changes and what appears to be early apoptosis in BTSC1D. These differential results between the undifferentiated and differentiated cancer stem cells suggest that there may be ways to target the ubiquitin ligase system in tumors to kill or differentiate specific cellular subpopulations by affecting the expression/activity of proteins found only in a subset of the tumor’s cells. Effects for the remaining shRNA on BTSC1D are shown (
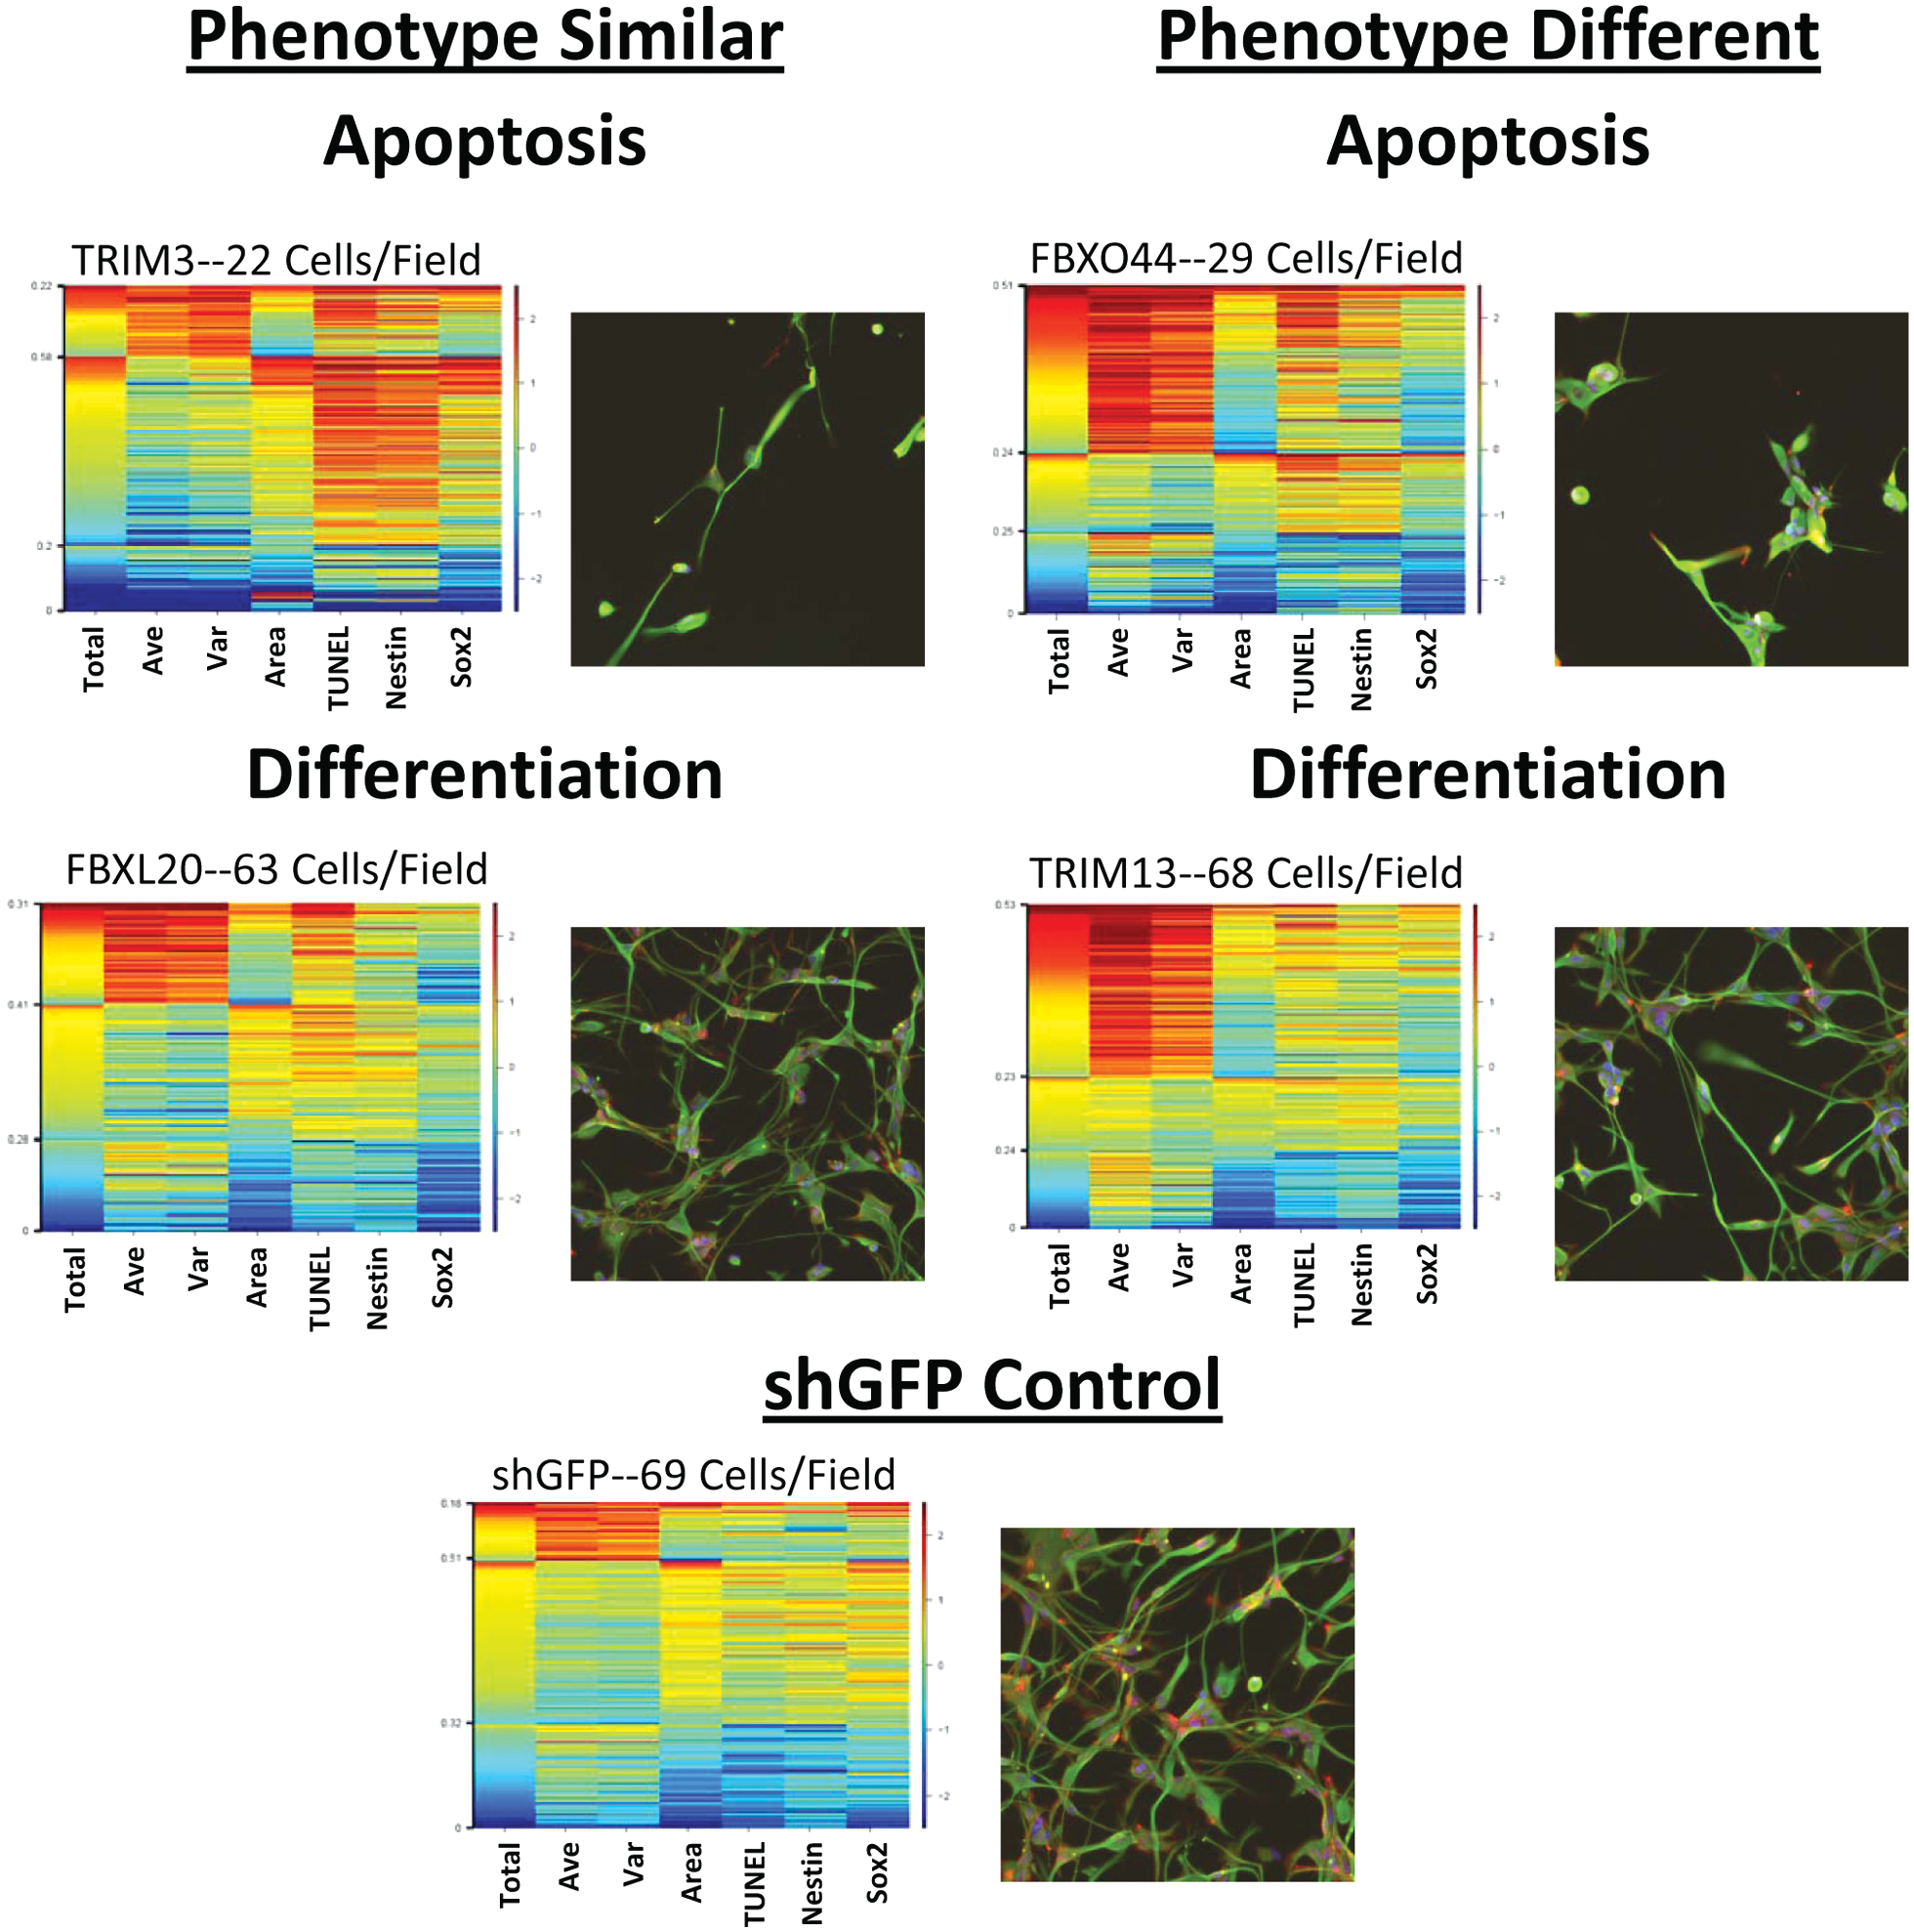
Knockdown of ubiquitin ligases in differentiated BTSC clone 1 leads to differential phenotypes from undifferentiated BTSC clone 1. Differentiated glioblastoma stem cells were treated for 6 days with lentiviral constructs knocking down ubiquitin ligase expression and stained for the presence of DNA (blue), TUNEL, (yellow), Nestin (green), and Sox2 (red). Representative examples of images and heat maps are shown for constructs inducing either apoptosis or differentiation in a manner similar or distinct from that observed in undifferentiated BTSC clone 1. The seven parameters measured from every cell are listed below each column: total DNA intensity (Total), average DNA intensity (Ave), variation of DNA intensity (Var), nuclear area (Area), total TUNEL (TUNEL), total Nestin (Nestin), and total Sox2 (Sox2). To determine relative levels of expression across the assay, the staining intensities are compared back to a short-hairpin green fluorescent protein (shGFP) control. TUNEL, terminal deoxynucleotidyl transferase biotin-dUTP nick end labeling.
To demonstrate that BTSC1 cells treated with many of these shRNA had ceased to progress through the cell cycle, BTSC1 was stained for the presence of both Ki67, a nuclear proliferation antigen expressed only in cycling cells, as well as Sox2 following lentiviral knockdown of the ubiquitin ligases listed above. As before, immunostaining was compared to a control population treated with shGFP ( Fig. 5 ). Numerous ubiquitin ligase knockdowns in BTSC1 caused reduced Ki67 expression as the cells ceased to cycle and senesced—illustrated by FBXL20 and RNF25 (although the latter construct weakly increased Sox2 expression). Interestingly, not all of the constructs that induced differentiation abrogated expression of Ki67. Knockdown of TRIM13, which led to a near complete loss of Nestin expression in BTSC1 ( Fig. 3 ), actually increased the number of cells expressing Ki67. This suggests that any form of differentiation therapy must be carefully considered so as not to increase the growth potential of the tumor, although susceptibility of these cells to conventional chemotherapy needs to be examined.
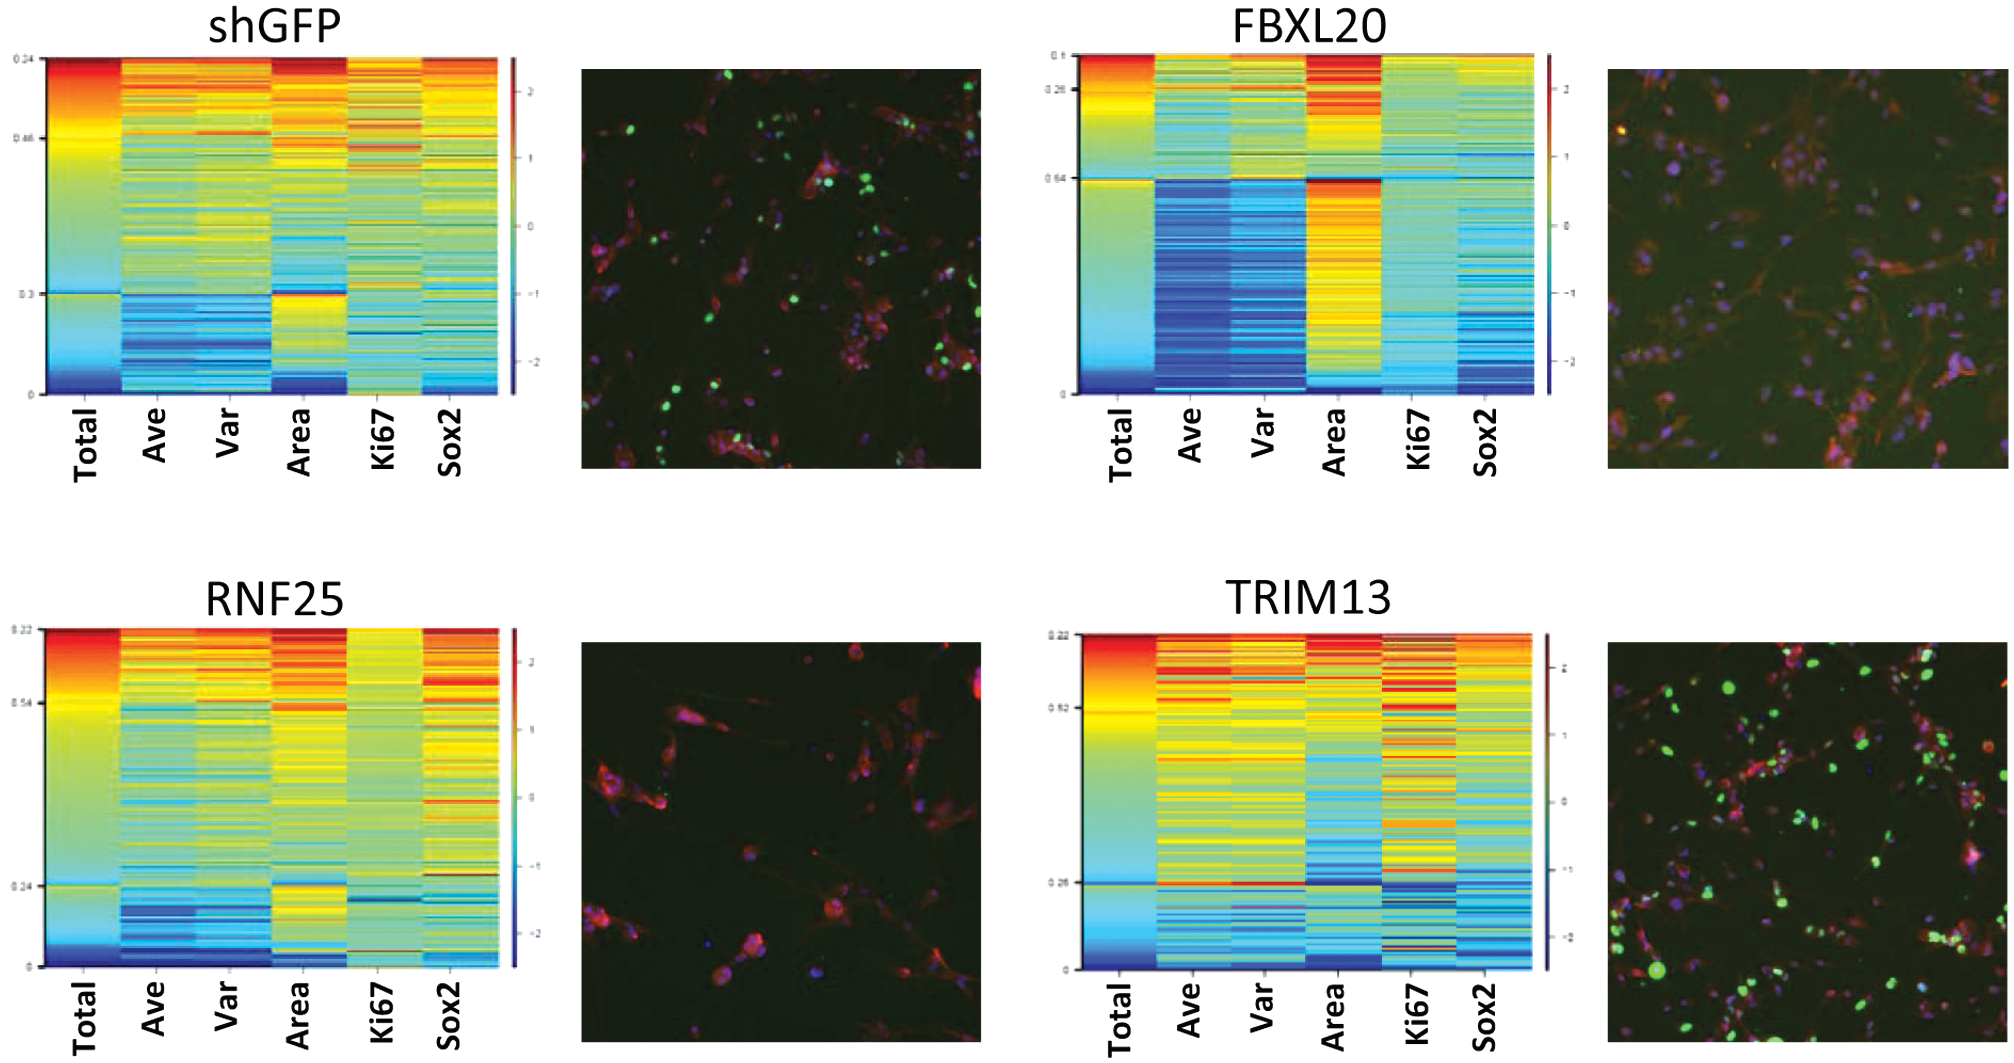
Knockdown of some ubiquitin ligases in BTSC clone 1 leads to senescence. Undifferentiated glioblastoma stem cells were treated for 6 days with lentiviral constructs knocking down ubiquitin ligase expression and stained for the presence of DNA (blue), Ki67 (green), and Sox2 (red).
The identification and characterization of CSCs has become a principal focus of oncology research for the past decade. Although not the most prevalent cells in a tumor, CSCs are likely a very important tumor cell subpopulation with respect to tumor growth and metastasis and are clearly distinct from the bulk tumor population. These poorly differentiated cells, identified in a large number of human tumors, may be responsible for a tumor’s resistance to radiation and chemotherapy as well as for tumor recurrence. Our data suggest, however, that there may be additional methods to deal with the difficulties caused by the presence of these cells in human tumors.
Although ubiquitin ligases have been studied broadly as targets for inhibition in a number of cancer therapies, these studies have focused on the modulation of the p53 pathway. Quite a few of the ubiquitin ligase family members remain poorly characterized for both their ligase and other functions, likely as a result of the large number of proteins within the family. The modulation of these target proteins represents an open area of cancer research, which may lead to a number of agents to target human tumors. 25 For example, the inhibition of specific E3 ubiquitin ligases may be an ideal method to alter the expression patterns and tumorigenic potential of CSCs, rendering them susceptible to treatment. Although bortezomib is the only currently approved compound known to affect this system, there have been a number of additional attempts to modulate this biology, such as interactions between MDM2 and p53, suggesting that perturbations of this system as a whole may be feasible.26,27
Our data indicate that the knockdown of ubiquitin ligases in CSCs isolated from multiple patients can lead to either apoptosis or cellular differentiation, as well as a potentially new approach to mitigating the effects of the CSCs on tumor progression. In some cases, the differentiation caused by these gene knockdowns led to a loss of Ki67 expression, suggesting that the targeted cells had ceased dividing. This type of phenotypic response to treatment would likely stop these cells from causing the recurrence of the primary tumor after therapy. In addition, these differentiation strategies have the potential to sensitize the CSC population to more common therapeutic treatments, possibly killing them outright. The use of differentiation therapies in conjunction with cytotoxic and targeted agents may be the key to either stopping the growth or destroying the subpopulation of cells most frequently associated with tumor recurrence. This form of therapy could increase the life span of a patient to the point at which cancer becomes a chronically managed disease even if the tumor cells are not completely eradicated.
References
Supplementary Material
Please find the following supplemental material available below.
For Open Access articles published under a Creative Commons License, all supplemental material carries the same license as the article it is associated with.
For non-Open Access articles published, all supplemental material carries a non-exclusive license, and permission requests for re-use of supplemental material or any part of supplemental material shall be sent directly to the copyright owner as specified in the copyright notice associated with the article.