
Abstract
Recombinant erythropoietin (EPO) is a growth factor used in the treatment of chemotherapy-induced anemia, but recent studies suggest that EPO may accelerate cancer growth. Although several cancers express EPO receptors (EPORs), the mechanism by which EPOR promotes tumor growth remains poorly understood. Glioblastomas display a cellular hierarchy of self-renewal and tumor propagation restricted to glioma stem cells (GSCs). The authors find that GSCs express higher levels of EPOR than matched nonstem glioma cells. Prospective enrichment for EPOR on GSCs increased neurosphere formation, suggesting that EPOR can select for a subset of GSCs with increased self-renewal capacity. Targeting EPOR expression with lentiviral-mediated short-hairpin RNA (shRNA) reduced GSC growth, survival, and neurosphere formation capacity, defining a crucial role for EPOR in GSC maintenance. The authors further find that STAT3 is an important mediator of EPOR signals in GSCs. EPOR knockdown attenuated the basal activation of STAT3 present in GSCs, and a small-molecule inhibitor of STAT3 reduced GSC growth and survival. EPOR signaling was critical for survival in vivo, as targeting EPOR expression decreased GSC tumorigenic potential. Elevated EPOR expression is also associated with poor patient outcome. Thus, EPOR on GSCs promotes tumor growth and may explain the poor survival of cancer patients treated with EPO.
Introduction
Glioblastoma (GBM; World Health Organization [WHO] grade IV astrocytoma) is the most common and aggressive type of primary brain tumor. 1 Current treatments combining chemotherapy, radiotherapy, and surgery have increased the survival of patients with GBM. 1,2 However, the median survival of GBM patients after initial diagnosis still remains only 12 to 15 months with the best available therapies. 2 The poor survival of patients with GBM reflects the ability of tumors to resist chemo- and radiotherapies (preventing cancer cell death) and invade normal brain (preventing surgical removal). 1,2 Determining the cellular and molecular mechanisms specific to tumor growth is a priority for developing new therapeutic strategies.
An increasing body of evidence identifies the therapeutically resistant and invasive subpopulation of cancer cells within heterogeneous solid tumors as tumor-initiating cells or cancer stem cells. 3-15 In GBM, glioma stem cells (GSCs) have phenotypic similarities to normal neural stem cells, including self-renewal capacity, stem cell marker expression, and multilineage differentiation capacity. 3-9 Although GSCs can be enriched with antibodies against cell surface markers such as CD133 (Prominin-1), GSCs are ultimately functionally defined by their abilities to self-renew and propagate tumors in immunocompromised mice. 3-10 GSCs resist radiation- and chemotherapy-induced cell death, promote angiogenesis, and can initiate tumors in animal models with only a few hundred cells, implicating important roles for GSCs in glioma maintenance and tumor recurrence. 3-15 Elucidating the signaling pathways that promote GSC-driven biologies will expand our understanding of tumor biology and enable the identification of novel cancer stem cell–directed therapies that hold great promise for more efficacious therapeutic regimens.
One signaling pathway implicated in normal neural stem cell biology and cancer involves the pleiotropic cytokine erythropoietin (EPO) and its transmembrane receptor (EPOR). EPO stimulation of EPORs was originally identified as a regulator of erythroid progenitor cellular survival and proliferation to control red blood cell production. 16,17 More recent studies reveal that EPOR is also expressed in neural stem cells, endothelial cells, and cancer cells. 18-30 In the brain, EPO regulates the growth and differentiation of normal neural progenitors and can protect brain tumor cells from apoptosis. 18-30 As EPO also enhances angiogenesis, 31-34 EPOR may regulate the growth of both tumor and endothelial cells to contribute to cancer progression. Indeed, clinical studies suggest that EPO and EPOR may promote tumor malignancy as coexpression or upregulation of EPO/EPOR signaling is associated with poor survival. 35-40 Recombinant EPO treatment also correlates with higher mortality in patients with breast and head-and-neck cancer. 36,40 Treatment with recombinant EPO caused decreased survival in patients with EPOR+ tumors in comparison to patients with EPOR− tumors, 36 suggesting a therapeutically relevant effect of EPO directly on tumor cells.
On the basis of this background, we investigated EPO signaling in GSCs and examined EPO receptor as a therapeutic target for brain tumor therapy.
Results and Discussion
EPOR expression is elevated in GSCs
To evaluate the expression of EPOR in the heterogeneous tumor cell subpopulations, we used our previously defined methods to isolate matched GSCs and nonstem glioma cells. Enrichment or depletion of GSCs was validated using functional assays, including propagation of tumors with characteristics of the parental sample and stem cell marker expression (Figure 1A and data not shown). Short-term cultures of GSCs isolated from three different human glioma samples had higher EPOR expression than nonstem glioma cells (Figure 1A). EPOR present in GSCs is activated as EPOR phosphorylation measured by immunoblotting and flow cytometry (simultaneously stained with phosphorylated EPOR and CD133) was elevated in GSCs (data not shown). EPO ligand expression was also elevated in GSCs (Supplementary Figure 1A), supporting the existence of an autocrine loop. Immunofluorescent staining of isolated tumor cells further confirmed coexpression of EPOR and the stem cell marker CD133 on GSCs but not matched nonstem glioma cells (Figure 1B). Immunofluorescent staining of sections of patient specimens, including HP3359 from which the T3359 GSCs were derived, demonstrated strong overlap between CD133 and EPOR (Figure 1C, Supplementary Figure 1B, white arrows), although expression was not always mutually inclusive (Figure 1C, pink arrow). Similar results were also obtained with EPO ligand immunofluorescence (Supplementary Figure 1B). When EPOR and CD133 expression patterns were directly determined in bulk (unsorted) tumor cells using fluorescent-activated cell sorting (FACS), the percentage of EPOR+ cells was significantly higher in the CD133+ subpopulation (Figure 1D; Supplementary Figure 1C). Approximately 70% of all CD133+ cells were also EPOR+, whereas only 15% of CD133− cells were EPOR+ (Figure 1D). Of cells that were EPOR+, the average intensity of the staining was also higher in the CD133+ subpopulation in comparison to matched CD133− cells (Supplementary Figure 1D). In a tumor sample where CD133 was not informative for tumorigenic potential but SSEA1+ is a cancer stem cell marker, 15 EPOR was expressed and the percentage of EPOR+ cells was higher in the SSEA1+ fraction (Supplementary Figure 1E). Together, these data indicate that there is an elevation of EPOR expression on GSCs and that autocrine EPO signaling is preferentially enriched in GSCs.
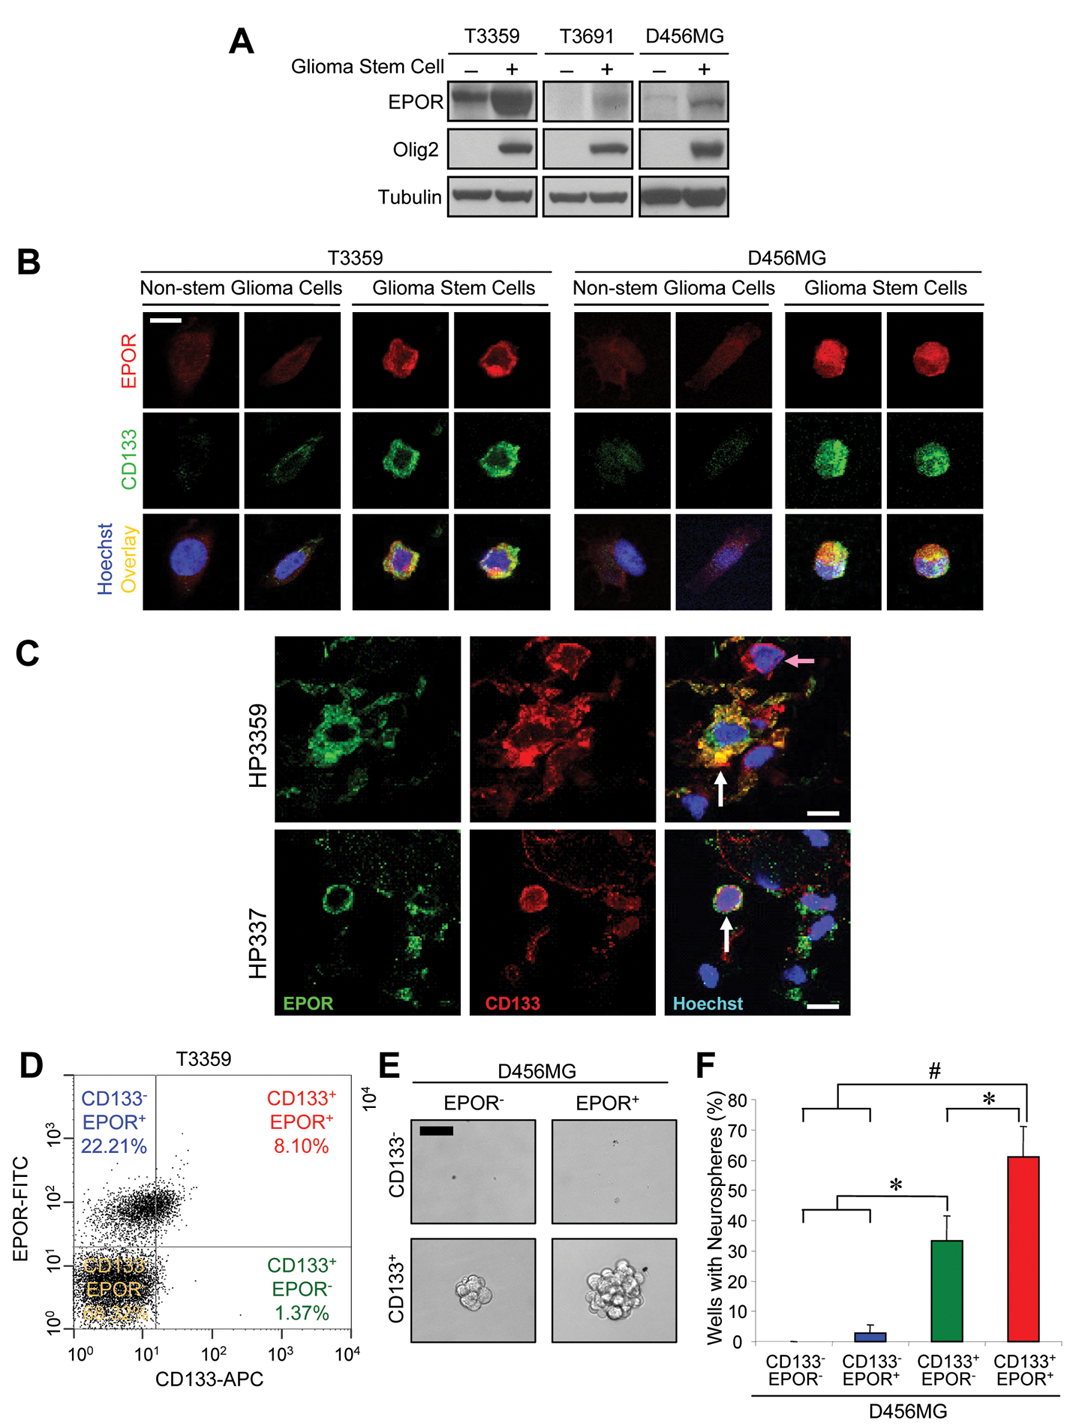
Elevated erythropoietin receptor (EPOR) expression in glioma stem cells (GSCs).
Elevated neurosphere formation capacity in GSCs coexpressing CD133 and EPOR
One of the functional characterizations of GSCs is their ability to form neurospheres in vitro, and data from our laboratory and others have previously determined that selection for CD133 enriched for cells with neurosphere formation capacity. To assess the impact of EPOR expression on this behavior, we determined the ability of cells present in each of the 4 quadrants after FACS analysis with EPOR and CD133 antibodies (as in Figure 1D) to form neurospheres. Consistent with prior reports, 3-9 we found that CD133 segregated for neurosphere formation capacity. CD133+ cells readily formed neurospheres, whereas CD133− cells had minimal neurosphere formation capacity, regardless of EPOR expression (Figure 1E,F). However, among the CD133+ cells, further enrichment for the EPOR+ subpopulation significantly enhanced neurosphere formation capacity (Figure 1E,F), supporting a heterogeneity in the CD133+ fraction. The percentage of wells with neurospheres was elevated when seeded with CD133+/EPOR+ cells as compared to CD133+/EPOR− cells and the size of the resulting spheres (considered by some as a marker of proliferative potential) was increased (Figure 1F). These data suggest that there is a subgroup of GSCs that express EPOR to promote their self-renewal.
Targeting EPORs impairs GSC growth and survival
To determine whether autocrine EPO signaling through EPORs contributes to GSC growth, we targeted EPOR using a lentiviral-based short-hairpin RNA (shRNA) expression system (Mission shRNA; Sigma-Aldrich, St. Louis, MO). To minimize potential off-target effects, we used two different shRNA sequences directed against EPOR (EPOR shRNA1 and EPOR shRNA2) or a nontargeting scrambled control sequence (NT shRNA). We successfully achieved knockdown of EPOR in GSCs as measured by mRNA (data not shown) and protein levels (Figure 2A; Supplementary Figure 2A). Infection with lentivirus expressing either EPOR shRNA significantly decreased the growth of GSCs compared to the nontargeting control (Figure 2B; Supplementary Figure 2B,C). The decrease in GSC cell number upon EPOR knockdown was associated with reduced proliferation (DNA synthesis) as determined by decreased thymidine incorporation (Figure 2C; Supplementary Figure 2D). In addition, apoptosis increased with EPOR targeting as caspase 3/7 activity was also elevated (Figure 2D; Supplementary Figure 2E). In reciprocal experiments consistent with these data, we found that addition of exogenous EPO ligand promotes the growth of GSCs (Supplementary Figure 3). Together, these data suggest that autocrine EPO signaling is critical for GSC growth and survival.
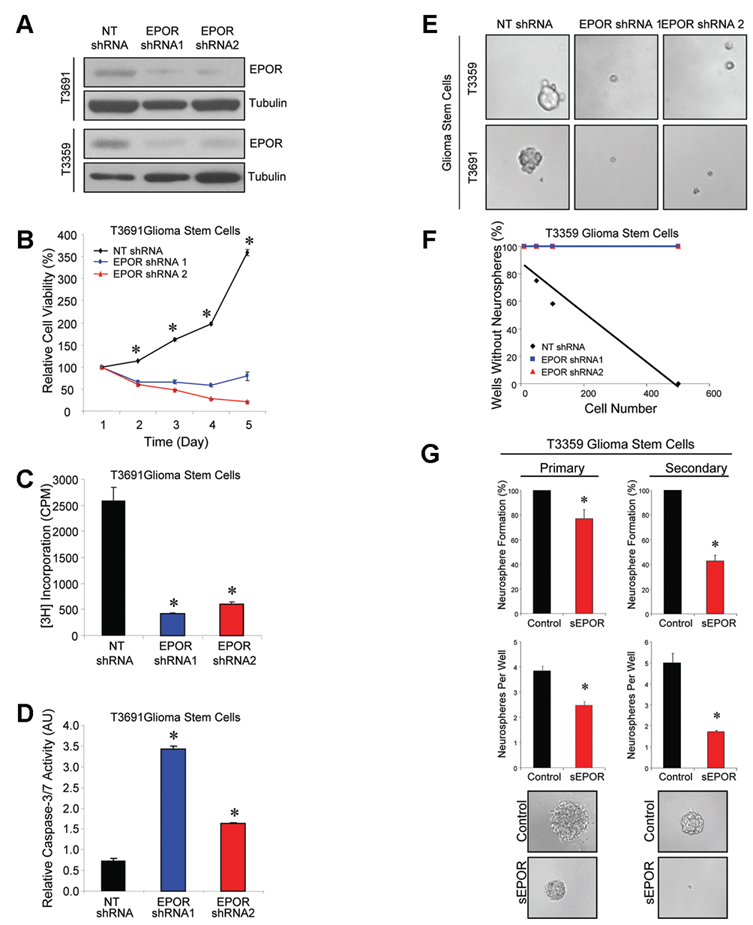
Targeting erythropoietin receptor (EPOR) expression in glioma stem cells (GSCs) reduces cell growth associated with decreased survival and neurosphere formation capacity.
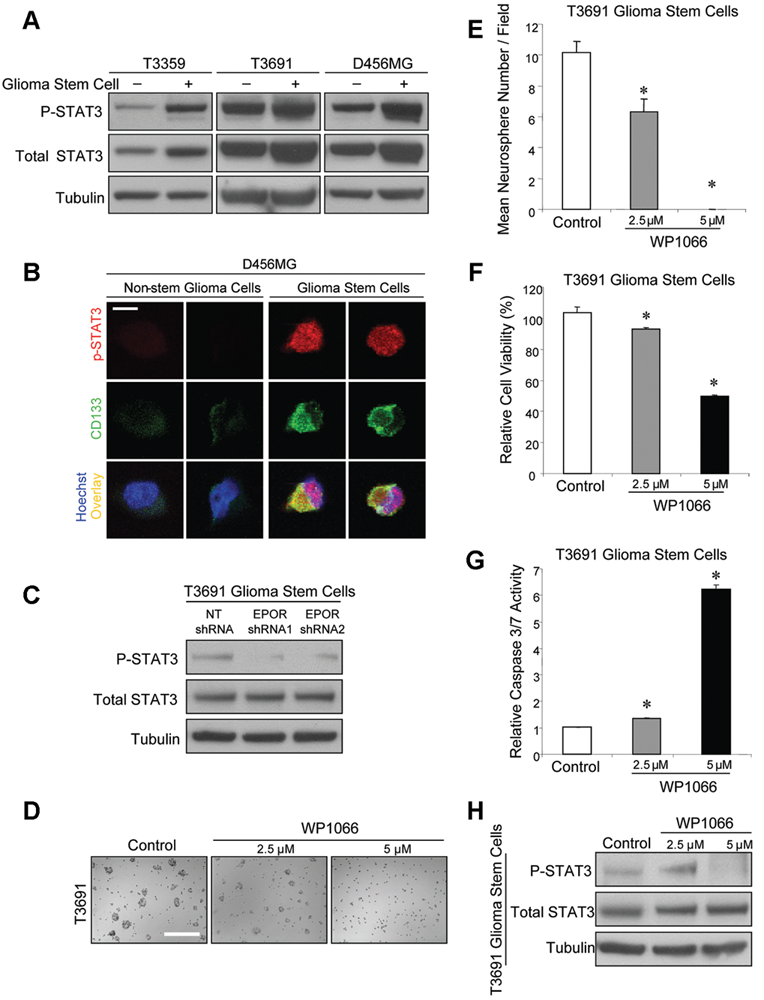
Basal activation of STAT3 in glioma stem cells (GSCs) is decreased by targeting erythropoietin receptor (EPOR), and targeting STAT3 decreases GSC growth.
EPOR signaling is required for neurosphere formation
As we noted decreased numbers of neurospheres in bulk GSC cultures infected with EPOR shRNAs (Supplementary Figure 2B), we systematically evaluated the ability of EPOR knockdown cells to form neurospheres. When increasing numbers of GSCs infected with a nontargeting control were plated per well, the percentage of wells without neurospheres decreased linearly (Figure 2E,F; Supplementary Figure 4A). The nontargeting control-infected GSCs formed small neurospheres as early as 4 days after plating, but none of the cells infected with either EPOR shRNA formed neurospheres after 10 days (Figure 2E,F; Supplementary Figure 4A; and data not shown). As EPOR knockdown prevented neurosphere formation, we sought another method to further investigate the role of EPOR signaling in self-renewal as defined in sequential passage experiments. Addition of a soluble EPOR to inhibit EPO binding to the cell surface EPORs to GSC cultures significantly reduced the percentage of wells with neurospheres as well as the number of neurospheres per well in primary and secondary passages (Figure 2G; Supplementary Figure 4B). Neurospheres that did form with soluble EPOR treatment were smaller than vehicle control-treated cells (Figure 2G; Supplementary Figure 4B). We further observed that addition of exogenous EPO ligand promoted the size and numbers of neurospheres formed (Supplementary Figure 3B,C). The results of these functional assays suggest that EPO signaling promotes GSC self-renewal and demonstrates that EPOR is critical for maintaining GSCs.
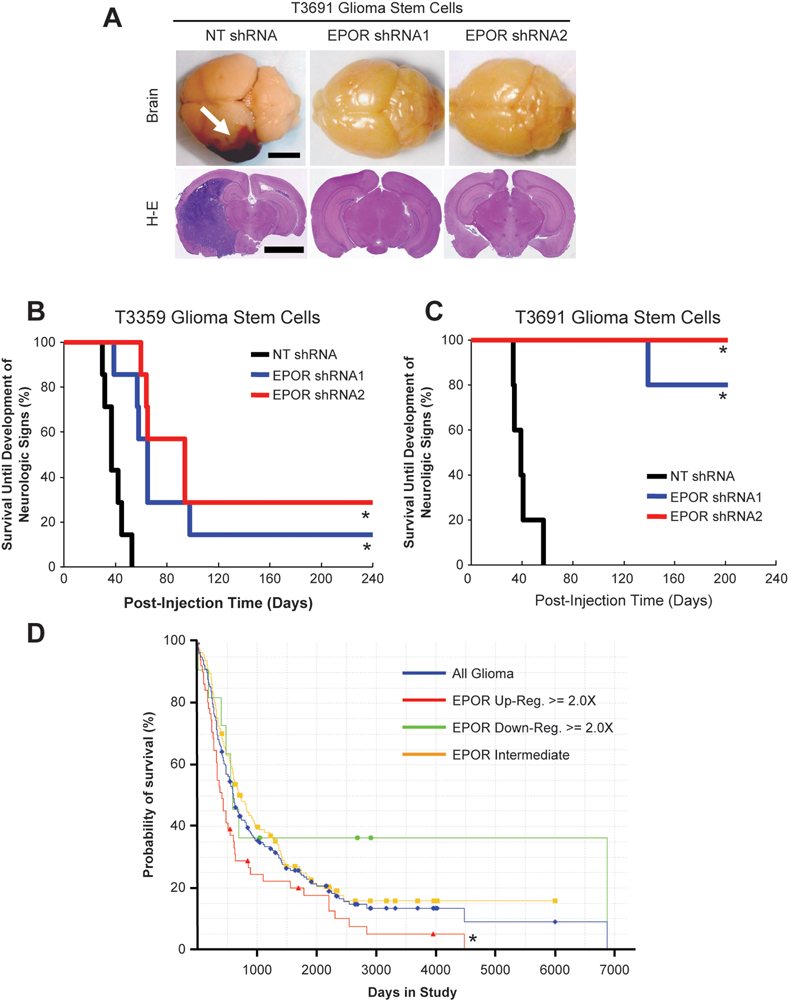
Reduced erythropoietin receptor (EPOR) expression increased survival of mice bearing human glioma xenografts and correlates with increased survival of human glioma patients.
STAT3 activation is elevated in GSCs and downstream of EPORs
Activation of the EPOR results in phosphorylation of Janus family tyrosine kinase 2 (JAK2) molecules, which in turn leads to activation of signal transducers and activators of transcription (STATs). 41 STAT3 is a known EPOR signaling mediator 42 that has been previously linked to glioma cell survival. 43-46 To define the mechanisms through which EPOR signaling mediated GSC growth and apoptosis, we therefore first assessed STAT3 activation. Levels of total STAT3 and activated STAT3 as determined by increased phosphorylation at Tyrosine 705 were higher in lysates from GSCs isolated from 3 different tumors in comparison to matched nonstem glioma cells (Figure 3A). Immunofluorescent staining further confirmed that cells expressing the GSC marker CD133 also expressed high levels of phosphorylated STAT3 (Figure 3B). When EPOR was targeted in GSCs, phosphorylation of STAT3 (Figure 3C) and its upstream regulator JAK2 (Supplementary Figure 5A) were inhibited. Reduced EPOR did not decrease total STAT3 levels, indicating EPOR signaling regulated STAT3 activity but not expression. Together, these data demonstrate that STAT3 is highly phosphorylated in GSCs and that autocrine EPOR signals contribute, at least in part, to STAT3 activation.
STAT3 activity is required for GSC growth and survival
To determine whether the reduced levels of phosphorylated STAT3 after EPOR knockdown contributed to decreased GSC growth, we used a small-molecule inhibitor of STAT3, WP1066. 43,44 Treatment of short-term cultures of GSCs with increasing concentrations of WP1066 led to a visible decrease in the numbers of neurospheres (Figure 3D; Supplementary Figure 5B). Quantification of the number of neurospheres per field confirmed that WP1066 significantly reduced neurosphere formation (Figure 3E; Supplementary Figure 5C). This reduction in neurosphere formation correlated with a decrease in cell numbers (Figure 3F; Supplementary Figure 5D) and an increase in apoptosis (Figure 3G; Supplementary Figure 5E). The strong effects of WP1066 on GSC growth and survival at a concentration of 5 µM were consistent with reduced phosphorylation of STAT3 (Figure 3H) and JAK2 (Supplementary Figure 5F), demonstrating that Jak/Stat signaling through STAT3 is required for GSC growth and survival.
Targeting EPOR in GSCs improves survival of tumor bearing animals
The potent requirements for EPOR and its signaling mediator STAT3 for GSC maintenance suggested that targeting EPOR in GSCs may provide an in vivo survival benefit. To test this possibility, we implanted GSCs transduced with nontargeting control shRNAs or two different EPOR shRNAs into the right frontal lobes of the brains of immunocompromised mice. All animals injected with nontargeted GSCs developed brain tumors within 8 weeks that were confirmed by both gross and pathological analysis (Figure 4A-C). However, when EPOR was targeted in GSCs, there was a significant delay in tumor initiation or tumors failed to form in implanted animals up to 6 months after injection (Figure 4B,C). EPOR signaling is therefore critical for GSC-driven tumor formation.
EPOR expression correlates with poor glioma patient survival
To determine if variations in EPOR expression correlated with differences in patient outcome, we used the National Cancer Institute’s Repository for Molecular Brain Neoplasia Data (REMBRANDT) database. We found that upregulation of EPOR mRNA levels greater than 2-fold correlated with a significant decrease in survival compared to other groups (Figure 4D). In contrast, there was no significant difference in survival when EPO mRNA was differentially expressed (data not shown). These data demonstrate that EPOR signaling on tumor cells contributes to survival but that EPO mRNA expression by tumor cells alone does not inform patient survival (recent studies have demonstrated that glia in hypoxic brain regions are a major source of EPO, supporting potentially more sources of EPO ligand acting in a paracrine fashion 47 ). Together, these data suggest that paracrine and autocrine EPO contributes to patient outcome by stimulating EPOR present on GSCs.
Concluding remarks
A curative therapeutic strategy for GBM will require effectively targeting key regulatory molecules that permit escape from current treatments. By studying bulk tumor alone, most efforts to identify cancer targets have failed to appreciate tumor heterogeneity. The recent identification of the highly tumorigenic and therapeutically resistant GSC subgroup in GBM provides new opportunities to discover novel therapeutic targets. 3-15 Previous findings suggested that EPOR is important in neural stem cells and may stimulate tumor growth. 18-40 We therefore evaluated EPOR signaling in the context of the glioma subpopulations. EPOR expression, phosphorylation, and activation of its downstream mediator STAT3 were elevated in GSCs in comparison to nonstem glioma cells. Exogenous EPO treatment enhanced GSC viability during growth factor starvation, whereas targeting EPOR decreased GSC growth in vitro and GSC-mediated tumor growth in vivo. These data demonstrate that EPOR signaling is important for GSC maintenance and suggest that targeting EPOR may be an effective anti-GSC-directed therapy.
The validity of any cancer stem cell–directed therapy will ultimately be determined by its efficacy and specificity: for GBM, inadvertent targeting of normal neural stem cells by GSC-directed therapies is a concern. EPO and EPOR are expressed in many brain cells, including neural stem cells, where they regulate proliferation and differentiation. 18-30 EPOR-null mice have fewer neural progenitors due to elevated apoptosis, 26 demonstrating an additional role for EPOR signaling in neural stem cell survival. Although these studies suggest that targeting EPOR in brain tumors could perturb normal stem cell growth and differentiation, the importance of EPO and EPOR in normal adult brain remains unclear. Mice with conditional neural-specific EPOR knockdown have reduced proliferation of cells in the subventricular zone, but brain structure and cellular migration appear normal. 18 EPOR expression is downregulated in postnatal mice compared to embryos, 48 suggesting a decrease in EPOR signaling may occur after development. Importantly, neuropathologically normal adult brain sections have minimal EPO and EPOR protein expression. 49 Anti-EPOR therapies may therefore have potential when applied to adult brain tumors.
Similar to other signaling pathways with secreted ligands, there are three potential therapeutic strategies to target tumor EPO/EPOR signaling: (1) neutralize circulating EPO with antibodies to prevent EPOR activation on tumor cells, (2) target EPOR directly to prevent its activation, or (3) target downstream mediators of EPOR signals, such as STAT3. Small-molecule STAT3 inhibitors have demonstrated benefit against cancer growth in vitro, and increasing interest in their potential utility for patient therapy has led to new compound development. Soluble EPOR or anti-EPO antibody efficiently inhibited breast cancer angiogenesis and tumor growth in immunocompromised mouse models. 30 Although currently most promising, these protein-based strategies may face additional challenges in the treatment of GBMs due to the presence of the blood-brain barrier (BBB). The BBB consists of tight junctions between endothelial cells that preclude passage of many large proteins, which would include EPO-neutralizing antibody or soluble EPOR. In addition, the safety of sustained anti-EPO treatments in cancer patients would need to be carefully monitored if administered systemically due to potential complications from anemia. 50 Thus, it may be most beneficial to target EPOR signaling in GBM cells by implanting therapeutics directly after surgery similar to current methods with Gliadel wafers. 51
In contrast to our proposed benefit for anti-EPOR-directed therapies, recombinant EPO has been administered to cancer patients in an effort to reverse anemia by promoting red blood cell production. 16,17 Anemia is a common complication of cancer, which can be exacerbated by radio- and chemotherapies to significantly reduce the quality of life of cancer patients. 52-56 However, randomized clinical studies on breast, lung, and head and neck cancers 35,36,57 demonstrated that EPO treatment adversely affected overall survival and local tumor control. Two large clinical trials (DAHANCA 10 and Anemia of Cancer by Amgen) were terminated early because of the unexpected higher mortalities in EPO-treated patients. Although EPO tumor-promoting effects were not observed on established breast cancer cell lines, 58 EPO treatment stimulated orthotopic breast cancer growth and angiogenesis. 30 This apparent discrepancy can be explained by the recognition that cell lines are cultured in serum-containing conditions that promote differentiation (and other irreversible genetic changes 59 ). Thus, cell culture studies underestimate the consequence of EPO treatments on tumor growth by failing to measure effects on the cancer stem cell subpopulation. When we evaluated cancer stem cells in glioma, our data strongly suggest that EPO treatment is likely to promote GSC survival and proliferation, which would be detrimental for patients. The biological effects of EPO treatment should therefore be investigated on a broader spectrum of cancer stem cells. It will be important to determine if this GSC EPOR paradigm extends to other tumor types and could be responsible for the unexpected poor survival of patients receiving EPO treatment.
Materials and Methods
Ethics statement
Primary human brain tumor patient specimens were obtained from patients providing informed consent under protocols approved by the Duke University or Cleveland Clinic Institutional Review Boards. All animal experiments were performed in accordance with approved Duke University or Cleveland Clinic Institutional Animal Care and Use Committee protocols.
Isolation and culture of GSCs and nonstem glioma cells
Similar to our prior descriptions, 7-9 matched cultures enriched or depleted for GSCs were isolated from the human glioblastoma xenograft D456MG or primary human brain tumor patient specimens passaged short term in immunocompromised mice. Tumor cells were sorted by FACS or magnetic sorting using fluorescently labeled or microbead-conjugated CD133 antibodies, respectively (Miltenyi Biotec, Bergisch Gladbach, Germany). CD133+ cells were designated as GSCs, whereas CD133− cells were designated as nonstem glioma cells. The cancer stem cell nature of the CD133+ cells was confirmed by serial neurosphere assays and tumor formation assays, but cultures depleted of cancer stem cells did not self-renew and/or initiate tumors (data not shown). GSCs were cultured in Neurobasal media supplemented with B27 without vitamin A, L-glutamine, sodium pyruvate (Invitrogen, Carlsbad, CA), 10 ng/mL basic fibroblast growth factor, and 10 ng/mL epidermal growth factor (R&D Systems, Minneapolis, MN). Nonstem tumor cells were cultured for at least 12 h in Dulbecco’s modified Eagle’s medium (DMEM) containing 10% serum to allow cell attachment and survival. After recovery, DMEM was removed and the nonstem glioma cells cultured in supplemented Neurobasal medium for at least 12 h prior to experiments in order for experiments to be performed in identical media. Indicated amounts of EPO (Procrit, Ortho Biotech, Bridgewater, NJ), WP1066 (573097, CalBiochem, San Diego, CA) or the vehicle control, dimethyl sulfoxide (DMSO), were added when noted.
Western blotting
First, 2 × 10⁶ GSCs and nonstem glioma cells were cultured with 10 mL Neurobasal medium in 10-cm dishes for 48 h and harvested to detect the expressions of EPO, EPOR, and Olig2. In EPOR knockdown studies, 5 × 10⁶ lentivirus-infected GSCs were harvested 48 h postinfection. In WP1066 studies, 5 × 10⁶ GSCs were treated with the indicated amounts of WP1066 and DMSO as a vehicle control for 24 h prior to harvest. Protein concentrations of total cell lysates were quantified with Protein Assay Reagent (Bio-Rad, Hercules, CA). Equal amounts of protein were resolved by sodium dodecyl sulfate (SDS) polyacrylamide gels (Invitrogen), transferred to polyvinyldifluoride (PVDF) membranes (Millipore, Billerica, MA), and probed with polyclonal rabbit anti-EPOR (Abcam, Cambridge, UK), polyclonal rabbit anti-phospho-EPOR (Tyr 456; Santa Cruz Biotechnology, Lake Placid, NY), polyclonal goat anti-Olig2 (R&D Systems), polyclonal rabbit anti-phosph-STAT3 Tyr705, polyclonal rabbit anti-total STAT3, polyclonal rabbit anti-phospho-JAK2 Tyr221, polyclonal rabbit antitotal JAK2 (Cell Signaling Technology, Danvers, MA), and monoclonal mouse antitubulin antibodies (Sigma-Aldrich).
Immunofluorescent staining
For freshly isolated cells, 2 × 10³ GSCs and nonstem glioma cells were plated into each well of an 8-well chamber slide with 200 µL Neurobasal medium. After 12 h, cells were fixed with 2% paraformaldehyde for 15 min at room temperature and stained with monoclonal mouse anti-CD133 (Miltenyi Biotech) and polyclonal rabbit anti-EPOR (Abcam) or rabbit anti-phosph-STAT3 Tyr705 antibodies (Cell Signaling Technology) overnight at 4°C. After staining with Alexa 568 goat antirabbit or Alexa 488 goat antimouse (Invitrogen) secondary antibody, cell nuclei were stained with Hoechst 33342 (Invitrogen). For patient specimen frozen sections, 10-micron sections were fixed in 4% paraformaldehyde at room temperature for 10 min, boiled in 10 mM sodium citrate solution (pH6.0) for 10 min, and blocked in 10% normal goat serum (Sigma-Aldrich) and 0.1% Triton X-100 for 30 min at room temperature. Sections were incubated with primary antibodies (rabbit anti-CD133 [Ab19898, Abcam]; mouse anti-EPOR [Ab56310, Abcam]) at 4°C overnight and secondary antibodies (goat antimouse IgG1 Alexa 488 [Invitrogen]; goat antirabbit IgG Alexa 568 [Invitrogen]) at room temperature for 45 min, and then they were counterstained with Hoechst 33342 (Invitrogen). For fluorescence imaging, confocal z-stacks were taken by a 63× water immersion objective lens on a Leica SP-5 microscope using sequential scans (blue-red, green).
FACS analysis for simultaneous EPOR and CD133 expression
After overnight recovery, freshly isolated bulk glioma cells were incubated with APC-conjugated mouse anti-CD133 (Miltenyi Biotec) and FITC-conjugated mouse anti-EPOR antibodies (R&D Systems) according to the manufacturer’s instructions. For assessment of phospho-EPOR, cells were fixed in 4% paraformaldehyde and subsequently stained with APC-conjugated mouse anti-CD133 (Miltenyi Biotec) and anti-phospho-EPOR antibody (Y368 [Abcam] or Y485 [Epitomics, San Francisco, CA]) in the presence of antirabbit FITC secondary antibody. Antibody-labeled single cells were analyzed and sorted by flow cytometer as previously described. 7-9
Recombinant constructs and lentiviral stocks
Knockdown of EPOR was achieved through the use of lentiviral vector-mediated shRNA interference using Mission RNAi system clones (Sigma-Aldrich). EPOR-targeting lentivirus (EPOR shRNA1 and EPOR shRNA2) and the nontargeting control shRNA construct (NT shRNA) were produced in HEK293FT cells with the ViraPower Lentiviral Expression System (Invitrogen). Two days after transfection, viral supernatants were collected, filtered, and concentrated by ultracentrifugation (100,000 g for 3 h at 4°C). To ensure that the same amount of EPOR targeting and the control lentiviruses was used in the each experiment, produced lentiviral stock was titered and stored according to the manufacturer’s instruction (Invitrogen). The oligonucleotides of EPOR shRNA1 and shRNA2 were 5′-CCGGCGTGTCATCCACATCAATGAACTCGAGTTCATTGATGTGGATG ACACGTTTTTG and 5′-CCGGCCGAGCCCAGAGAGCGAGTTTCTCGAGAAACTCGCTC TCTGGGCTCGGTTTTTG, respectively.
Neurosphere formation assay
For analysis of EPOR- and CD133-expressing subpopulations, cells from each quadrant identified by FACS were plated into 24-well plates (10 cells/well). For experiments with shRNA, 10, 50, 100, and 500 GSCs were plated into each well of 24-well plates 48 h after infection with the indicated shRNA-expressing lentivirus. For WP1066 and EPO studies, 5 × 10³ GSCs were plated into each well of 96-well plates with the indicated amounts of EPO, WP1066, or DMSO as a vehicle control. The percentage of wells with neurospheres was determined after 4 days and cell cultures imaged. For the serial neurosphere formation assay with soluble EPOR treatment, 10 T3359 or D456MG glioma stem cells were plated into each well of 96-well plates with 200 µL completed neurobasal medium with either 1 µg/mL recombinant human soluble EPO receptor (sEPOR, R&D Systems) or equal amount of bovine serum albumin (BSA; GIBCO, Carlsbad, CA) as the control. The number of primary neurospheres in each well and the percentage of the wells with neurosphere formation in each group were counted after 7 days. Subsequently, neurospheres formed in the primary passage from each group were harvested and dissociated to single-cell suspensions, and the experiment was repeated to determine effects in the secondary passage.
Cell viability assay
Lentivirus-infected GSCs were plated into 96-well plates at a density of 5 × 10³ cells/well. Cell viability was quantified using the Cell Titer-Glo luminescent cell viability assay (Promega, Madison, WI) daily for 5 days. Where indicated EPO, WP1066, or DMSO control was added at the time of plating and viability measured after 24 h. Cell viability at each time point was normalized to the cell viability at time zero.
[3H]thymidine incorporation assay
Forty-eight hours after infection with the indicated shRNA, T3691 and D456MG GSCs were plated into 12-well plates at a density of 5 × 10³ cells/well or 1.5 × 10⁴ cells/well, respectively. After overnight recovery, cells were labeled for 4 h with 4 µCi of [3H]thymidine, fixed in 10% trichloroacetic acid, and lysed in 0.2 N NaOH. [3H]thymidine incorporation into DNA was measured with a scintillation counter.
Caspase assay
GSCs were plated into 96-well plates at a density of 1 × 10⁴ cells/well 48 h after lentiviral infection. WP1066 or DMSO was added to 5 × 10³ GSCs plated into 96-well plates. Caspase 3/7 activity was detected by Caspase-Glo 3/7 luminescent assay (Promega) after 24 h and normalized to the viability of each group as detected in the Cell Titer-Glo assay (Promega).
Animal studies
Intracranial transplantation of GSCs into nude mice was performed as previously described. 7-9 Briefly, lentivirus-infected GSCs were selected by puromycin (1 µg/mL) for 24 h and allowed to recover for another 24 h with fresh Neurobasal medium. Then, 1 × 10³ viable cells were implanted into the right frontal cerebrum lobe of each BalbC/nu mouse. Animals were monitored daily for the development of neurologic signs. Entire mouse brains were fixed in 4% paraformaldehyde, and hematoxylin and eosin staining was performed on 5-µM paraffin sections.
Survival analysis of glioma patient clinical data
Kaplan-Meier plots of the survival probabilities of clinical glioma patients with differential tumor EPOR expression levels were calculated with data from NCI’s REMBRANDT bioinformatics database (https://caintegrator.nci.nih.gov/rembrandt/). Patient numbers of the groups with upregulated, intermediate, or downregulated tumor EPOR expression level were 51, 117, and 11, respectively.
Statistical analysis
All figures are mean ± standard error. For in vitro assays, Graph Pad InStat 3.0 software was used to perform Student’s t test or one-way analysis of variance (ANOVA). Differences were considered significant when P < 0.05. For in vivo assays, MedCalc software was used to generate Kaplan-Meier curves and compare survival using log-rank analysis where P < 0.05 was considered significant.
Footnotes
Acknowledgements
We thank Dr. Mike Cook, Dr. Beth Harvat, Cathy Shemo, and Sage O’Bryant for assistance with flow cytometry and the members of the Rich laboratory for technical assistance and critical review of the manuscript. We thank Z. Su, Y. H. Sun, S. Keir, D. Satterfield, L. Ehinger, J. Funkhouser, and J. Faison for other technical assistance. We would also like to thank the Dr. Judy Drazba and Eric Diskin from LRI imaging core and Kevin Ryan from W. Nuhsbaum, Inc. for critical assistance with time lapse microscope and Linda Vargo for histology assistance. We are also grateful to Drs. Shideng Bao and Jeongwu Lee for valuable insights and comments on the manuscript.
The authors declared no potential conflicts of interest with respect to the authorship and/or publication of this article.
Work in the Rich laboratory is supported by the Pediatric Brain Tumor Foundation of the United States, Accelerate Brain Cancer Cure, Alexander and Margaret Stewart Trust, Brain Tumor Society, Goldhirsh Foundation, Duke Comprehensive Cancer Center Stem Cell Initiative Grant, and NIH grants NS047409, NS054276, CA112958, and CA116659. Y.C. is supported by a grant from the Southeastern Brain Tumor Foundation (SBTF). C.E.E. is supported by a National Research Service Award from the National Institutes of Neurological Disorders and Stroke (NINDS F30 NS063496). J.D.L. is supported by an American Brain Tumor Association Basic Research Fellowship (sponsored by the Joelle Syverson Fund) and a National Research Service Award from the National Cancer Institute (NCI F32 CA142159). J.N.R. is a Damon Runyon-Lilly Clinical Investigator supported by the Damon Runyon Cancer Research Foundation and a Sidney Kimmel Foundation for Cancer Research Scholar. A.H. is supported by a grant from the National Brain Tumor Society. The Duke University Brain Tumor Tissue Bank is supported by the Duke University Brain Cancer SPORE. The funders had no role in study design, data collection and analysis, decision to publish, or preparation of the manuscript.
References
Supplementary Material
Please find the following supplemental material available below.
For Open Access articles published under a Creative Commons License, all supplemental material carries the same license as the article it is associated with.
For non-Open Access articles published, all supplemental material carries a non-exclusive license, and permission requests for re-use of supplemental material or any part of supplemental material shall be sent directly to the copyright owner as specified in the copyright notice associated with the article.