
Abstract
The histone methyltransferase (HMT) family of proteins consists of enzymes that methylate lysine or arginine residues on histone tails as well as other proteins. Such modifications affect chromatin structure and play a significant regulatory role in gene expression. Many HMTs have been implicated in tumorigenesis and progression of multiple malignancies and play essential roles in embryonic development and stem cell renewal. Overexpression of some HMTs has been observed and is correlated positively with various types of cancer. Here the authors report development of a continuous fluorescence-based methyltransferase assay in a 384-well format and its application in determining kinetic parameters for EHMT1, G9a, PRMT3, SETD7, and SUV39H2 as well as for screening against libraries of small molecules to identify enzyme inhibitors. They also report the development of a peptide displacement assay using fluorescence polarization in a 384-well format to assay and screen protein peptide interactions such as those of WDR5 and EED, components of MLL and EZH2 methyltransferase complexes. Using these high-throughput screening methods, the authors have identified potent inhibitors and ligands for some of these proteins.
Introduction
Posttranslational modification of histones such as methylation, acetylation, phosphorylation, ubiquitination, sumoylation, and adenosine diphosphate (ADP)–ribosylation affect chromatin condensation and provide signals to regulate transcription, DNA replication, and repair.
1
Among these modifications, histone methylation has been widely studied. Since SUV39H1 was identified as a SET domain–containing histone methyltransferase (HMT),2,3 many other proteins have been annotated as HMTs, which catalyze the transfer of a methyl group from S-adenosyl-L-methionine (SAM) to lysine or arginine residues on histone tails. However, many of these proteins are also involved in methylation of nonhistone proteins.4–8 The HMT family can be clustered into smaller groups based on amino acid sequence homology
9
(
Protein arginine methyltransferases (PRMTs) may transfer two methyl groups to a single nitrogen atom of the guanidine moiety of arginine (type I) or transfer two methyl groups to two different nitrogen atoms of the guanidine (type II). 10 PRMT3 is a type I PRMT that methylates arginine 3 of histone H4. 11 It also methylates ribosomal protein S2 (rpS2), stabilizes it, and plays a role in proper maturation of 80S ribosome by binding to and catalyzing the methylation of rpS2. 12 Its function has been reported to be essential for dendritic spine maturation in rat. 13 Interestingly, DAL-1/4.1B tumor suppressor interacts with PRMT3 and inhibits its HMTase activity, suggesting that the tumor suppressor may affect tumor growth through regulating protein arginine methylation. 8 Identifying JMJD6 as a histone arginine demethylase suggests that histone arginine methylation is a dynamic process.14,15
Lysine methyltransferases catalyze mono-, di-, and trimethylation of various histone tail lysine residues with specificity for both the degree of methylation on lysine and the surrounding amino acid sequence. SETD8 (PR-SET7) catalyzes the monomethylation of lysine 20 of histone H4 (H4K20), which is required to recruit 53BP1 to sites of DNA damage. 16 ES cells lacking SETD8 display atypical chromosome condensation and massive DNA damage. 17 H4K20 is not the only SETD8 substrate, as lysine 382 of tumor suppressor protein p53 is also methylated by this protein. 18 SETD7 (SET7/9) is another lysine methyltransferase that methylates lysine H3K4. H3K4 methylation has been reported to impair SUV39H1-mediated methylation at lysine 9 of H3 (H3K9). 19 SETD7 also monomethylates lysine 142 of DNMT1. 20 DNMT1 methylation has been suggested to regulate its proteasome-mediated degradation. 20 Methylation of TAF-10 at lysine 189 21 and p53 at lysine 372 22 by SETD7 is required for their structural and functional stabilization. Other proteins have also been reported as substrates for SETD7, including retinoblastoma tumor suppressor protein, 23 estrogen receptor α, 24 p65, 25 and Tat protein of HIV-1. 7 SETD7 has been suggested to act as a coactivator of HIV transcription.
G9a and EHMT1 mono- and dimethylate H3K9, whereas SUV39H2 also trimethylates this residue. G9a and EHMT1 also methylate nonhistone proteins, including p53 (K372), Wiz (K305), CDYL1 (K135), ACINUS (K654),26,27 and Reptin (K67), 28 as well as undergoing auto-methylation. 29 Methylated H3K9 is commonly associated with gene repression.30,31 In a G9a knockout mouse, 167 genes were significantly upregulated, but no gene was downregulated, granting G9a a gatekeeper function. 32 Tumor suppressor genes are among such silenced genes. 33 It has recently been reported that G9a promotes lung cancer invasion and metastasis by silencing the cell adhesion molecule Ep-CAM. 34 SUV39H2 polymorphisms have been shown to be associated with risk of lung cancer. 35
Some HMTs are only active when in complex with other proteins. Histone methyltransferase enhancer of Zeste homolog 2 (EZH2) is the catalytic subunit of polycomb repressive complex 2 (PRC2). EED and SUZ12 are essential for HMT activity of EZH2. 36 RbAp48 and AEBP2 may function by promoting the enzymatic activity of this complex. EZH2 catalyzes the addition of three methyl groups to histone H3K27. Trimethylation of H3K27 is responsible for the transcriptional repression of key developmental genes. EED-specific binding to trimethylated lysine residues is associated with repressive chromatin marks. 37 Histone methyltransferase mixed-lineage leukemia protein (MLL) is only active in complex with WDR5 and RbBP5. 38 WDR5, which forms a WD40 repeat β-propeller, is a key protein in the assembly of the MLL core complex. 39 It binds to trimethylated H3K4 as well as WDR5 interaction motif (Win) of MLL 40 and is essential for trimethylation of H3K4 by the MLL complex.41,42
The critical roles of HMTs in a variety of diseases suggest that many of these enzymes may be targets for a new generation of therapeutics,43,44 but the degree to which potent, selective, and nontoxic agents can be developed is still unknown. Furthermore, little is known about substrate specificity and kinetic behavior for many of the annotated HMTs. Thus, the field would benefit from the availability of a broadly applicable HMT assay to better characterize HMTs and their inhibition. In addition to inhibition of HMTase activity by compounds that bind to their active sites, HMT complexes such as PRC2 and MLL complexes can potentially be inactivated by targeting their complex formation. Compounds disrupting interaction of WDR5 with MLL and EED with EZH2 could potentially inactivate these enzymes without directly binding to their SET domains. To screen for such compounds, displacement of synthetic peptides that are similar in sequence to the interacting motifs can be used and monitored by fluorescence polarization.45–48
Various enzyme assays have been developed during the past few years that have significantly improved our knowledge of the specificity of HMTs. A coupled fluorescent assay for histone methyltransferases was first developed as an end point assay that is applicable to most HMTs with high enough catalytic turnover. 49 In this assay, SAHH (S-adenosylhomocysteine hydrolase) and adenosine deaminase convert the methyltransferase reaction product (S-adenosyl homocysteine) to homocysteine and inosine. Homocysteine can be quantified using ThioGlo. This assay was later optimized and used as a continuous assay for screening G9a, which led to the discovery of UNC0638, a potent and selective chemical probe for G9a and EHMT1.50–52 This continuous assay was also used to characterize nonhistone plant caffeic acid O-methyltransferases. 53 End point assays rely on one single readout and are prone to higher experimental error and yield higher false-positive and false-negative rates in high-throughput screening (HTS). In the continuous mode, the activity of the enzyme is calculated from the slope of signal over time plot. This way, the linearity of the initial velocity and the presence of any starting lag or leveling off within the timeframe of the assay can easily be detected. This is crucial for accurately determining the kinetic parameters for HMTs. In addition, possible effect of compounds on fluorescence readout can also be detected. Other coupled assays have also been developed using other coupling enzymes.54,55 These methods also rely on hydrolyzing SAH to other components and monitoring such conversions. In a colorimetric assay, S-adenosylhomocysteine (SAH) is first hydrolyzed by recombinant SAH nucleosidase into adenine and S-ribosylhomocysteine. In turn, S-ribosylhomocysteine is cleaved to form homocysteine using S-ribosylhomocysteinase. Homocysteine is quantified using Ellman’s reagent, and the accompanying absorption change at 412 nm is monitored. 55 In another method, a spectrophotometric assay monitors a deamination reaction that is associated with a decrease in absorbance at 265 nm. In this assay, SAH is hydrolyzed to S-ribosylhomocysteine and adenine by recombinant S-adenosylhomocysteine/5′-methylthioadenosine nucleosidase, adenine product is further hydrolyzed to hypoxanthine and ammonia by recombinant adenine deaminase, and deamination is monitored in a continuous mode. 54
In an alternative strategy, antibodies against specific methyl-lysine histone marks have been employed in developing medium- and high-throughput assays. A dissociation-enhanced lanthanide fluoroimmunoassay (DELFIA) assay was used to screen G9a against a library of 125 000 compounds, which resulted in discovery of BIX-01294, a potent G9a inhibitor. In this assay, the biotinylated peptide containing H3K9me2 reaction product was captured by neutravidin-coated 384-well microtiter plates, and methylated peptides were detected with an H3K9me2 antibody and a europium-labeled goat α-rabbit secondary antibody. 56 Other antibody-based assays developed for HMTs include a chemiluminescence-based method 57 and an enzyme-linked immunosorbent assay (ELISA). 58 One drawback of the antibody-based detection methods is the batch-to-batch variability in quality and specificity of available antibodies. Another method uses endoproteinase-LysC to cleave the unused substrate peptide (unmethylated) followed by separation and quantification of the methylated peptide through microfluidic capillary electrophoresis using Caliper instruments. This instrument separates small biomolecules such as peptides, based on their charge-to-mass ratio. Although methylation does not alter the charge of peptide substrates, in this case, the difference in size of the cut and uncut peptides is significant enough for separation. This assay was successfully employed to assay histone methyltransferases. 59 However, it is also an end point assay. An HMTase assay monitored by the transfer of a radioactive methyl group from SAM to lysine or arginine has also been widely employed. These types of assays are very sensitive and amenable to HTS.60,61 However, safety concerns and regulatory burdens associated with radioactivity-based assays may pose a limitation to some laboratories.
Developing high-throughput activity-based assays customized for each HMT would provide opportunities to screen each of these proteins against chemical libraries for developing potent, selective, and cell-penetrant inhibitors (chemical probes). 50 Here we report further optimization and validation of an SAHH-coupled assay in a continuous mode to determine kinetic parameters and identify screening conditions for G9a, EHMT1, SUV39H2, SETD7, and PRMT3, as well as an end point assay for SETD8 in a 384-well format. We also report the optimization and validation of a peptide displacement assay for screening WDR5 and EED.
Material and Methods
Adenosine deaminase (ADA) was purchased from Sigma (cat. 096K7003; Sigma, St. Louis, MO), ThioGlo from Calbiochem (cat. 595501; Calbiochem, Gibbstown, NJ), and SAH from Sigma (cat. A9384). 384-well plates were purchased from Axygen (cat. PCR-384-BK; Axygen, Union City, CA), and Greiner (cat. 784209; Greiner Bio-One, Monroe, NC). The 96-well plates were obtained from Nalgene (cat. 249944; Nalgene, Rochester, NY).
Human HMTs used in this study were cloned, expressed, and purified as described before. 62 The SsSAHH clone was provided by Dr. Raymond Trievel (University of Michigan). The ApSAHH clone was provided by Dr. Alexei Savchenko (University of Toronto).
SAHH Assay
In this assay, SAHH and ADA convert SAH to homocysteine and inosine. The abundance of homocysteine was quantified using ThioGlo, which reacts with thiol groups and fluoresces strongly. To obtain the Km and kcat values for SAH, a SAH concentration ranging from 10 nM to 50 µM in a series of experiments was mixed with ADA (final 0.5 U/mg) in 25 mM potassium phosphate (pH 8), 1 mM EDTA, 2 mM MgCl2, 0.01% Triton X-100, ThioGlo at a final concentration of 15 µM, and SAHH at a final concentration of 1 µM in a 20-µL reaction mix. Then, 9 µL of reaction mix, in duplicate, was transferred into each well of a 384-well plate (Axygen). The conversion of SAH to homocysteine was followed by monitoring the increase in fluorescence using a ViewLux (PerkinElmer, Waltham, MA) plate reader with 340 DUG 11 filter for excitation and 540/25 filter for emission for 20 min in a 384-well plate format. Homocysteine generated in the assay was quantified using standard curves. Activity values were corrected by subtracting background caused by SAH. Km values were calculated using a hyperbolic function (Sigma Plot software, Systat Software, Chicago, IL). Standard deviations were calculated from two or more independent experiments.
HMT Assay
The methyltransferase activities of HMTs were measured using a coupled assay.
49
In this assay, SAHH and ADA convert the methyltransferase reaction product SAH to homocysteine and inosine. The abundance of homocysteine was quantified using ThioGlo. For the Km and kcat determination, each protein concentration was selected to be within the linear range. For G9a, EHMT1, SETD7, SETD8, SUV39H2, and PRMT3, the concentrations used were 50 nM, 100 nM, 500 nM, 200 nM, 100 nM, and 500 nM, respectively. The rate of product formation for these HMTs was constant, and the plot of signal versus time was linear over the assay period (
Z Factor Determination
Z factors were determined to evaluate the suitability of each screen in a 384-well format. 63 To calculate the Z factor of the assay, the HMT reactions (for each enzyme separately; see above for details) were run in eight complete rows (half-plate) of 16 × 24 of a 384-well plate; the other eight rows were used for background controls (the reaction mix containing protein but not SAM). The reaction volume for G9a, EHMT1, SUV39H2, and PRMT3 was 10 µL. For SETD7 and SETD8, the reaction volume was increased to 20 µL to obtain a better signal-to-noise ratio. To obtain a Z′ factor value for the assay, a known inhibitor (UNC-0638 in case of G9a) was added at 1 µM to the reaction mix. The Z factor for each protein was calculated as described by Zhang et al. 63
Fluorescence Polarization
H3K27me3 (QLATKAARK(me3)SAPATG) peptide for EED and MLL_Win (GSARAEVHLRKS) peptide for WDR5 were synthesized, N-terminal-labeled with isothiocyanate–fluorescein, and purified by Tufts University Core Services (Boston, MA). Compound binding assays were performed in a 10-µL volume at a constant labeled peptide concentration of 40 nM and protein concentrations of 80 µM for EED and 5 µM for WDR5. For EED, the buffer contained 20 mM Tris (pH 8.0), 50 mM NaCl, 2 mM dithiothreitol (DTT), and 0.01% Triton X-100. For WDR5, the buffer was 100 mM potassium phosphate (pH 8.0), 150 mM NaCl, and 0.01% Triton X-100. Fluorescence polarization assays were performed in 384-well Axygen plates using a Synergy 2 microplate reader (BioTek). The excitation wavelength of 485 nm and the emission wavelength of 528 nm were used. To determine Kd values, the data were fit to a hyperbolic function using Sigma Plot software (Systat Software). The Kd values represent the average and standard deviation of three measurements.
Results and Discussion
Assay and Screening Writers of Histone Methyl Markers
The SAHH-coupled assay developed by Collazo et al. 49 is a convenient method to assay a wide range of HMTs. In this assay, the HMTase activity is coupled with SAHH activity. This coupled assay relies on SAHH using SAH, the product of the HMTase reaction as a substrate and producing L-homocysteine and adenosine. The free SH group of homocysteine then reacts with ThioGlo, and the fluorescence signal will increase ( Fig. 1 ). Such an increase in fluorescence signal reflects HMTase activity, and the amount of produced SAH can be quantified. In this study, we have optimized this assay in a 384-well format as a continuous assay and determined the kinetic parameters for G9a, EHMT1, SUV39H2, SETD7, and PRMT3. SETD8, however, was not amenable to the continuous assay and was characterized using the end point assay.
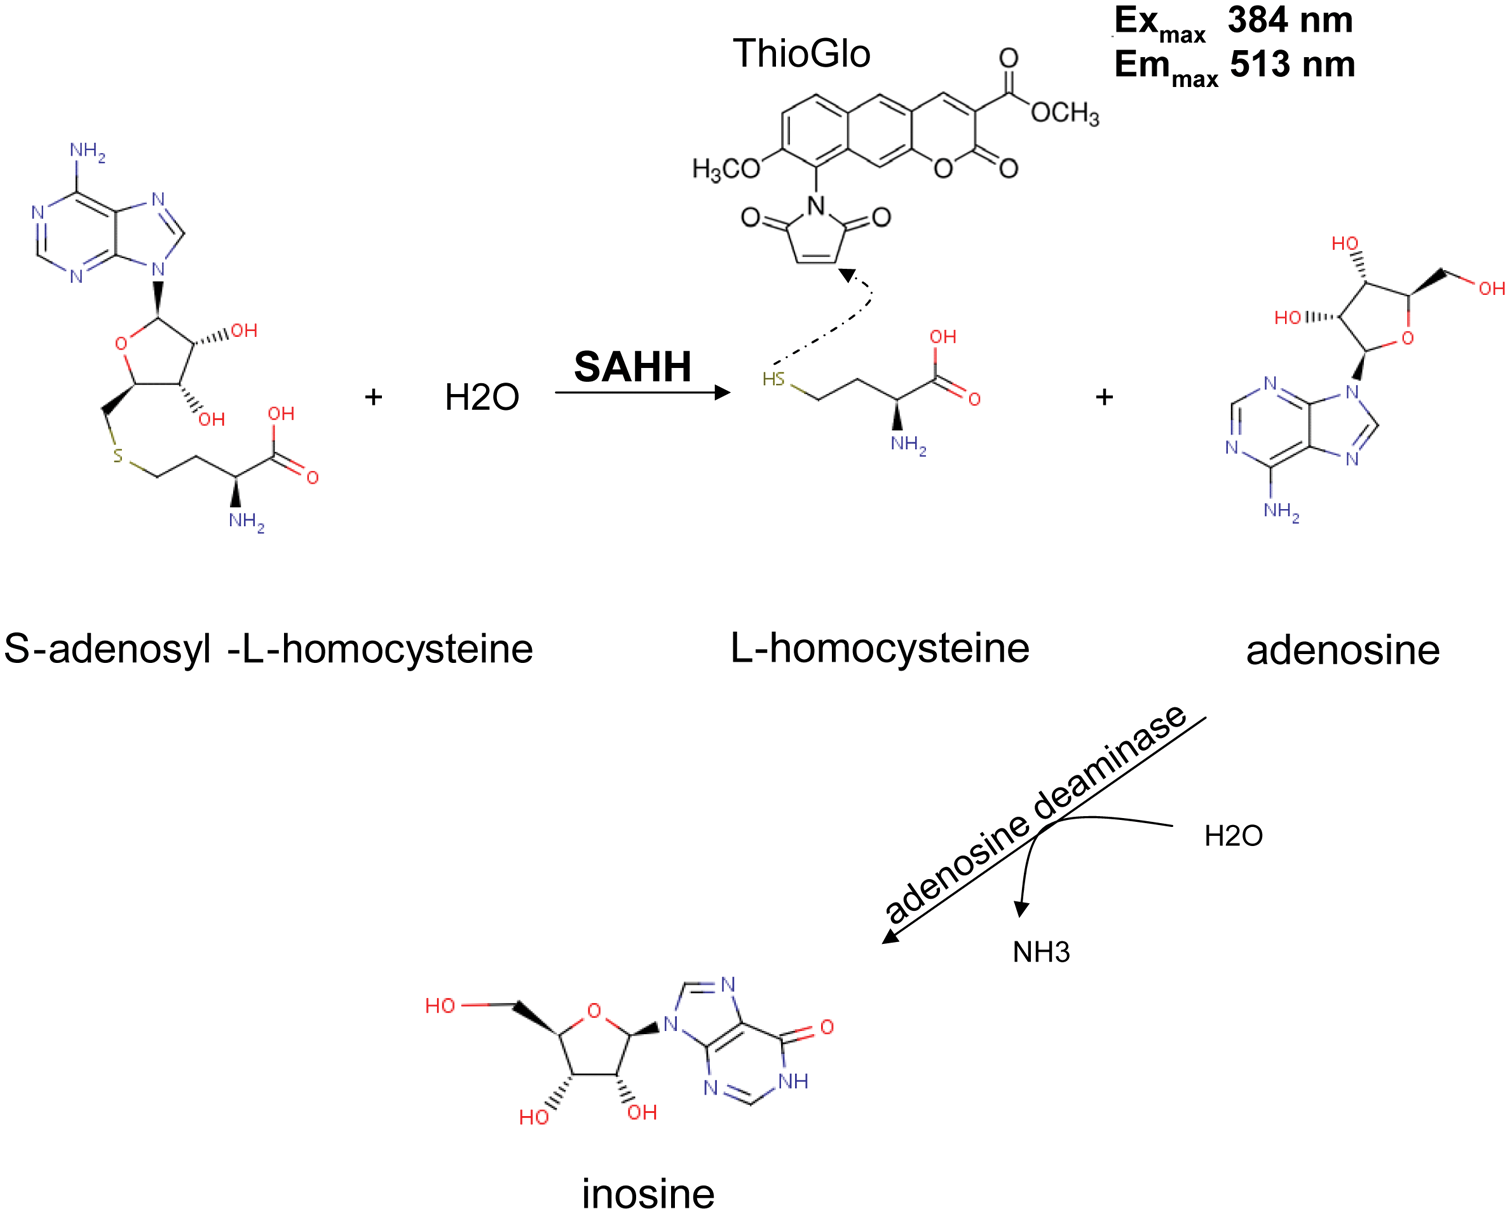
S-adenosylhomocysteine hydrolase (SAHH) assay using fluorescence detection. L-homocysteine, the product of SAHH function, reacts with ThioGlo, and emission at 513 nm (excitation of 384 nm) can be monitored to detect S-adenosylhomocysteine (SAH) production and therefore SAHH activity. Presence of adenosine deaminase takes away adenosine, the by-product of the SAHH reaction, by converting it to inosine to prevent possible reverse reaction
Assay Optimization
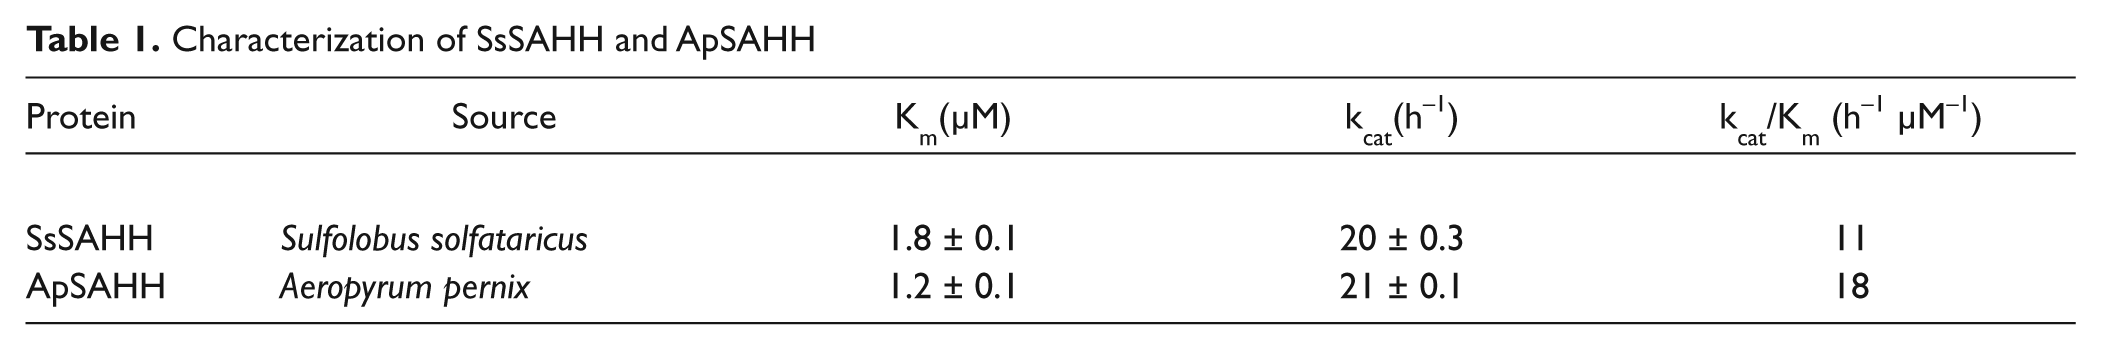
Characterization of SAHH at 28 °C from Sulfolobus solfataricus (SsSAHH) 49 with a Km of 1.8 ± 0.1 (µM) for SAH and kcat of 20 ± 0.3 h−1 and Aeropyrum pernix (ApSAHH) with a Km of 1.2 ± 0.1 (µM) and kcat of 21 ± 0.1 h−1 ( Table 1 ) indicated that these two proteins have more or less similar kinetic parameters, with ApSAHH having slightly higher specific activity (18 h−1 µM−1) compared to that for SsSAHH (11 h−1 µM−1). However, we selected SsSAHH for assay optimization because all preliminary experiments were previously performed using this SAHH.
Characterization of SsSAHH and ApSAHH
Collazo et al. 49 used an end point assay to determine kinetic parameters of HMTs by initiating the reaction with addition of a saturating concentration of SAM in a large volume and aliquoting the reaction mix and stopping the reaction at evenly spaced time intervals starting at time zero by cold isopropanol. After the reaction was completed, a solution of ThioGlo in DMSO was added to each well and allowed to react for 10 min at room temperature, and fluorescence was then measured. To determine the quantity of homocysteine generated in the assay, reduced CoA was used to generate standard curves.
Here we modified the reaction so that we can monitor the production of SAH (through detecting homocysteine) continuously. A reaction mix was prepared with all components of the assay, including protein and SAM but not peptide. Freshly prepared ThioGlo was added to this reaction mix along with SAHH and ADA. The reaction was started by adding the respective peptide substrate for each protein, and the increase in SAH production was monitored by recording the emission at 528 nm (excitation at 360 nm) using Synergy2, Synergy4, or ViewLux plate readers. It was crucial to prepare the ThioGlo solution freshly each time to obtain reproducible data. The ThioGlo should be stored in 100% DMSO and then added to buffer assays, which are slightly alkaline (pH 8). To ensure that the SAHH reaction is not a rate-limiting step and SAH conversion to homocysteine is properly monitored, we performed the assay for G9a, the most active HMT in our set, at saturating concentrations of SAM and H3 (1–25) peptide and varying the SsSAHH concentration (
Fig. 2A
). The fluorescence signal increased by increasing the SAHH up to 4 µM and plateaued completely at a 5-µM concentration. To ensure that conversion by SAHH is not a rate-limiting step, we also tested the activity of the HMTs using 5 and 10 µM SAHH. Doubling the concentration of SAHH made no significant difference (
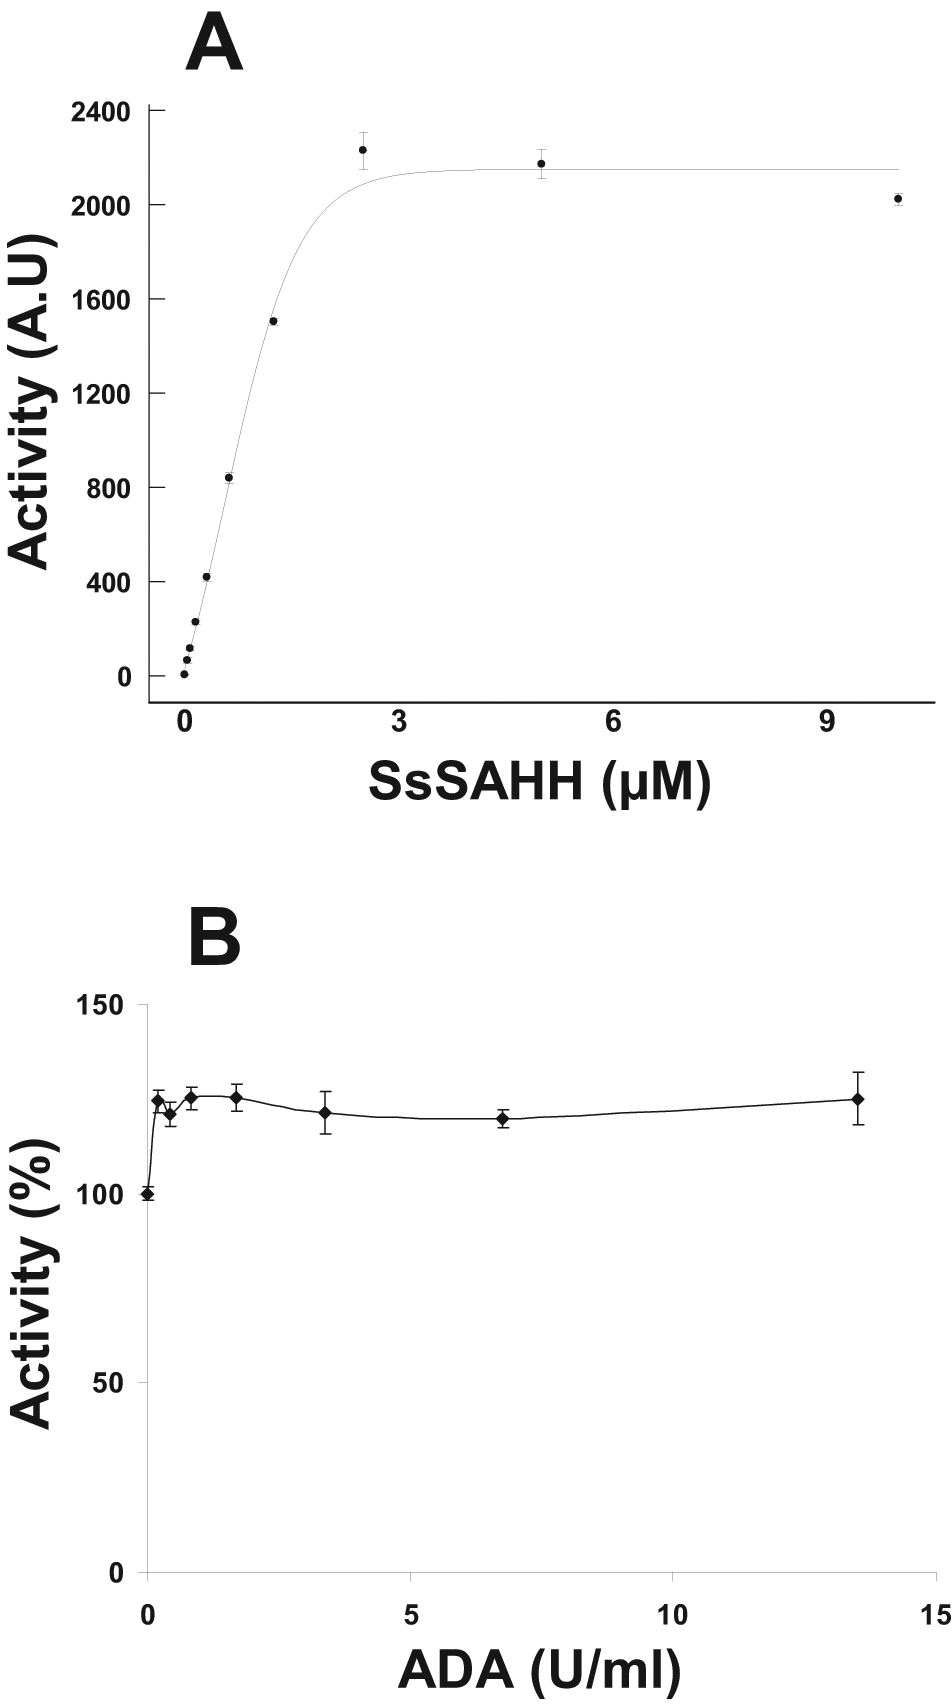
Effect of S-adenosylhomocysteine hydrolase (SAHH) and adenosine deaminase (ADA) on histone methyltransferase (HMT) assay readout. G9a activity was assayed at 0.5 U/mL ADA and different concentrations of SAHH (A) and at 5 µM SAHH and different concentrations of ADA (B). The buffer was 25 mM potassium phosphate (pH 8), 1 mM EDTA, 2 mM MgCl2, and 0.01% Triton X-100. Reaction mix contained saturating concentrations of S-adenosyl-L-methionine (SAM; 10 µM) and peptide (10 µM) substrate (H3 [1–25]). Experiments were performed at 28 °C
Determining the Kinetic Parameters for HMTs
We employed this continuous assay to characterize G9a, EMHT1, SUV39H2, SETD7, PRMT3, and SETD8. However, due to interaction of ThioGlo with a free cysteine thiol in SETD8 and a clearly related inhibitory effect, we excluded SETD8 from this set and determined its kinetic parameters using the end point assay. 49 Kinetic parameters for all these HMTs are summarized in Table 2 . G9a, EHMT1, and SUV39H2 methylate lysine 9 (H3K9), and SETD7 methylates lysine 4 (H3K4) of histone H3. We performed all kinetic assays for these four HMTs using a 25-mer peptide corresponding to the first 25 residues of histone H3 (H3 1–25) as the substrate. SETD8, on the other hand, methylates lysine 20 of histone H4, and PRMT3, being an arginine methyltransferase, methylates arginine 3 of histone H4 (H4R3). A peptide corresponding to the first 24 residues of histone H4 was used as a substrate for these two proteins. To facilitate purification of all these HMTs, we used shorter active constructs of these proteins ( Table 2 ). For the three H3K9 HMTs, the Km values for the peptide substrate (H3 1–25) are more or less in the same range (1.7–3.4 µM). However, the size of the peptide substrate significantly can affect the Km of the protein for the peptide. For example, with G9a, the Km for H3 (1–11) was determined to be 50 ± 7 µM, almost 30 times higher than that for H3 (1–25). Among these HMTs, G9a showed the highest specific activity (450 h−1 µM−1). Reproducibility of determining the kinetic parameters for these proteins confirmed the suitability of this assay for characterizing most HMTs.
Kinetic Parameters of HMTs
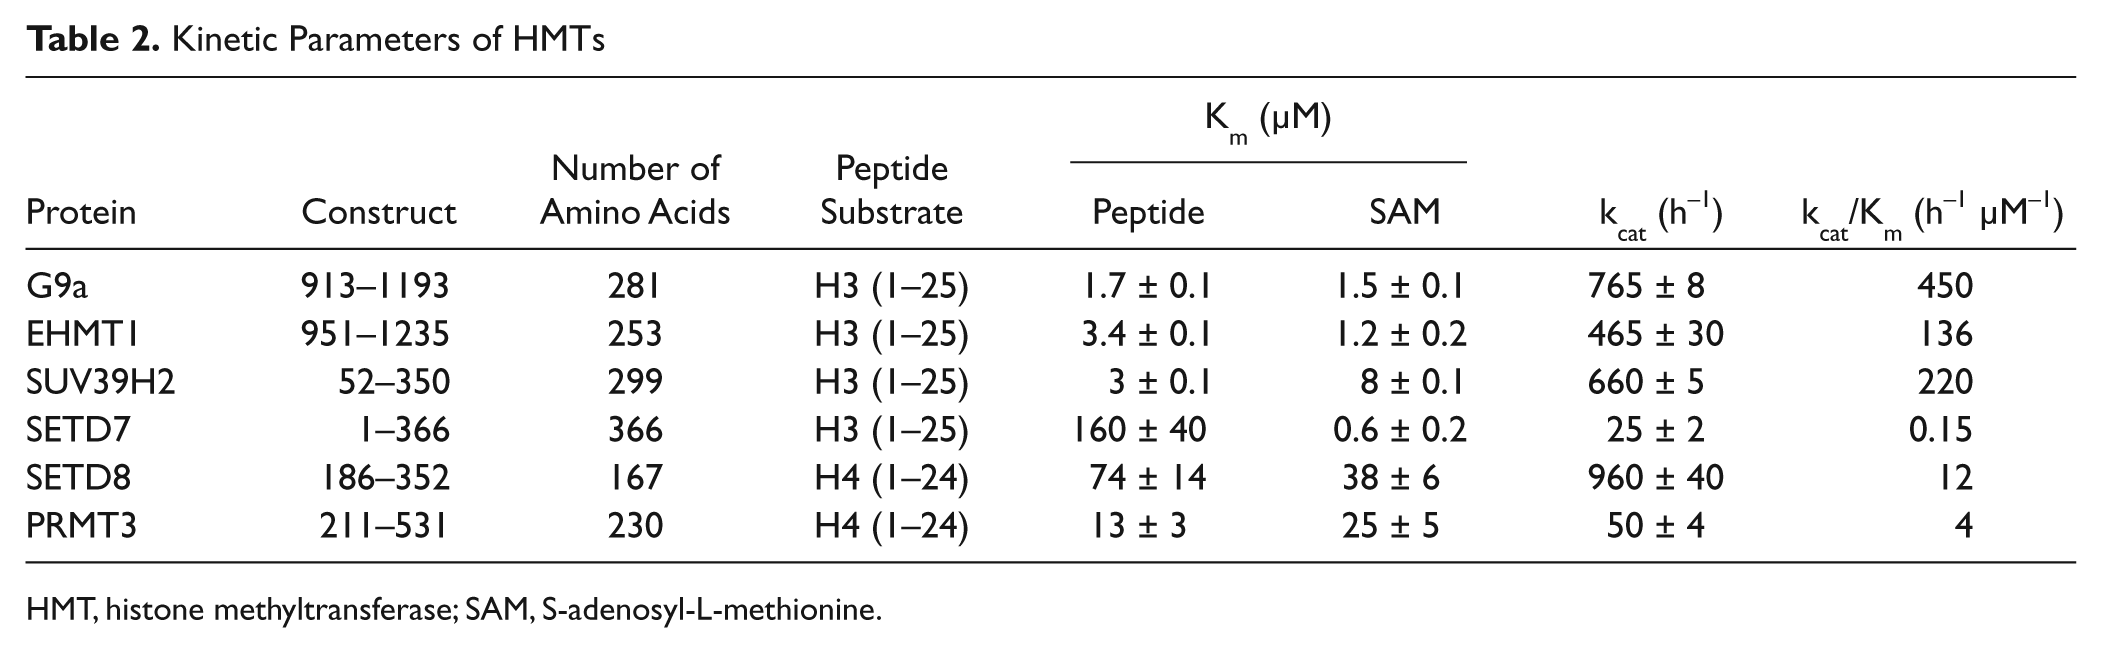
HMT, histone methyltransferase; SAM, S-adenosyl-L-methionine.
Among H3K9 methyltransferases studied here, G9a and EHMT1 mono- and dimethylate lysine 9. SUV39H2, however, also trimethylates H3K9. 62 Our data indicate that the Km of the peptide increases for higher methylation states (un- < mono- < dimethylated H3 [1–25]; Table 3 ). With kcat values slightly increasing for higher methylation states, SUV39H2 shows much higher specific activity with unmethylated peptide.
Substrate Specificity of SUV39H2
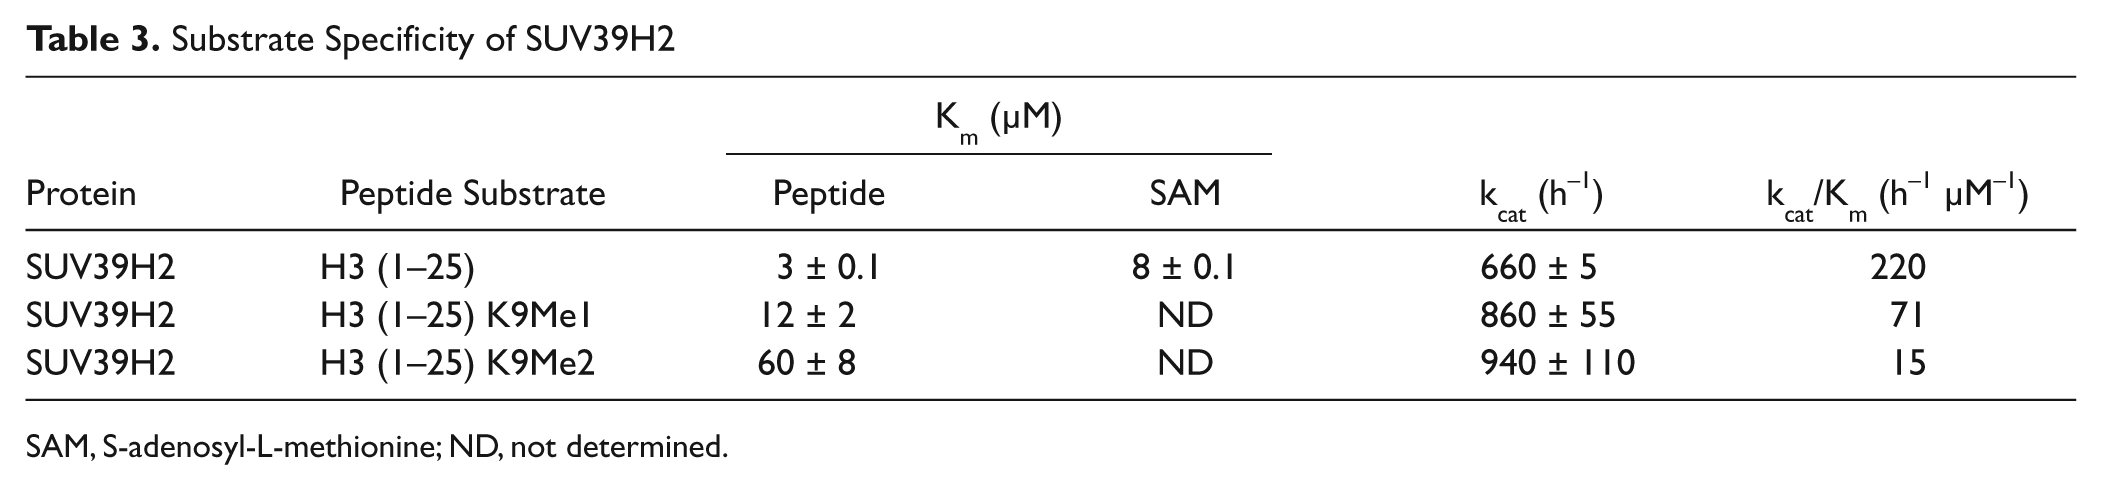
SAM, S-adenosyl-L-methionine; ND, not determined.
HTS Using Continuous Assay
HMTs methylate histones and affect chromatin condensation and gene expression. HMTs have been implicated in many diseases, including various types of cancer.1,34,64 Identifying potent inhibitors of HMTs with in vivo activity could be very useful to further investigate such effects and may provide the basis for drug discovery. Two sets of potential inhibitors can be identified for HMTs: (1) peptide mimetic compounds that bind to the peptide binding site and therefore compete with peptide such as the inhibitors reported for G9a50–52,56 and (2) compounds that may bind to SAM binding site and compete with SAM. To identify peptide competitive inhibitors, one needs to screen HMTs against libraries of compounds at low concentrations of peptide substrates while keeping the concentration of SAM close to saturation. Typically, screening at a peptide concentration close to the Km of peptide and a SAM concentration about five times the Km of SAM should provide an opportunity for compounds to compete with the peptide for binding to the peptide binding site and make hit detection easier. We assessed such screening in a 384-well format for all five HMTs in this study, and Z factors of 0.64, 0.76, 0.77, 0.84, and 0.84 were obtained for SETD7, G9a, EHMT1, SUV39H2, and PRMT3, respectively, indicating that this continuous assay is very suitable for HTS (
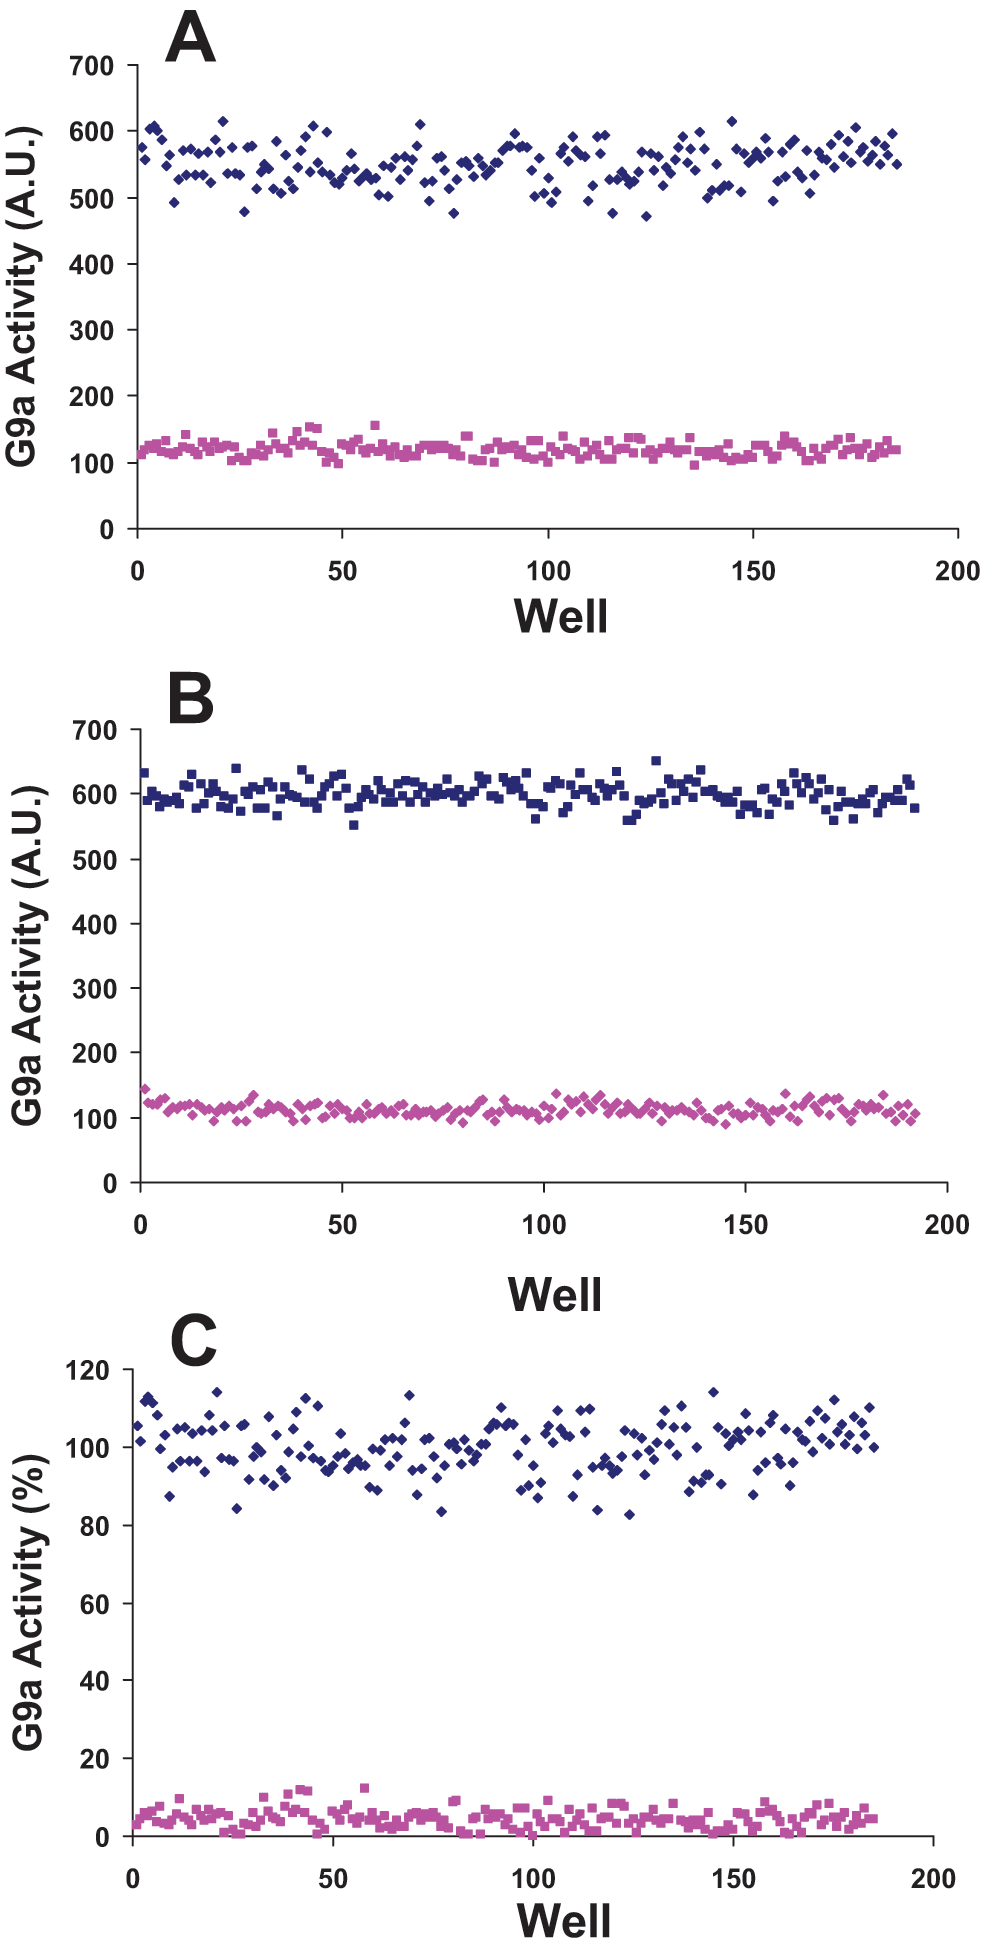
Screening G9a in a 384-well format. G9a was screened at peptide concentration close to the Km for peptide (2 µM) and saturation concentration (10 µM) of S-adenosyl-L-methionine (SAM; A) and SAM concentration close to Km of SAM (2 µM) and saturation concentration (10 µM) of H3 (1–25) peptide (B) to determine Z factors. G9a was also screened in the presence (185 samples) and absence (185 samples) of UNC0638 (a potent G9a inhibitor) at conditions similar to (A), and a Z′ factor of 0.71 was obtained
On the other hand, all these HMTs use SAM as a cofactor, and identifying compounds that can compete with SAM, yet are selective enough among HMTs, may seem more difficult. Through a systematic analysis of SAM binding site across structures of 14 human HMTs or close homologues, it was shown that SAM binding pockets are likely diverse enough to be chemically tractable, and identifying selective SAM competitive inhibitors is possible.
9
To identify SAM competitive inhibitors, we also assessed screening HMTs at the Km of SAM and about five times the Km of peptides. Generally, at this condition, less variation was observed and better Z factors were obtained (
To see how reproducibly a potent inhibitor can be identified through such screening, G9a was screened in the presence and absence of UNC0638. 50 Screening was reproducible in a 384-well format with a Z′ factor of 0.71 ( Fig. 3C ). Our results show that this assay can reliably be used to screen HMTs against libraries of a large number of compounds. However, in such screening, compounds that inhibit SAHH activity or quenching the fluorescence signal may also be identified as HMT inhibitors (screening hits). Therefore, the screening process should include a counterscreen to eliminate false positives. The SAHH activity assay (using SAH as a substrate for SAHH) is a suitable counterscreen that includes all assay components. HMT screening hits that also reduce the signal in this counterscreen are false positives. Although a continuous SAHH-coupled assay is perfectly suitable for characterization of HMTs and HTS, confirmation of a high number of screening hits by other high-throughput orthogonal methods, such as recently developed chemiluminescence, 57 microfluidic capillary electrophoresis, 59 or radioactivity-based assays, may be more convenient before proceeding with further characterization using low-throughput methods (Isothermal titration calorimetry; ITC, etc.) or follow-up chemistry. The SAHH-coupled assay is an easy to optimize assay for screening other HMTs.
Screening Histone Methyl Marks Using Peptide Displacement
Enzymatic activity of some methyltransferases such as MLL and EZH2 depends on their interaction with other proteins. MLL catalyzes histone H3 lysine 4 methylation, and its enzymatic activity depends on interaction with a three-subunit complex composed of WDR5, RbBP5, and Ash2L. 65 PRC2 complex includes EED and SUZ12 components, which interact with EZH2. This complex methylates histone H3K27 and mediates gene silencing. PRC2 components are overexpressed in metastatic prostate cancer. 66 As these components seem to be essential for methyltransferase activity of these complexes, we developed an assay to screen the reader components of these methyltransferase complexes.
WDR5 binds to MLL through recognition of a specific motif (WIN motif) of MLL, which includes an arginine residue (3765), which binds to the same arginine binding pocket on WDR5 that has been shown to bind histone H3. 40 Any compound that interrupts interaction of MLL and WDR5 may potentially inhibit MLL activity. We used a fluorescein-labeled peptide (F-peptide) (GSARAEVHLRKS) corresponding to MLL WIN motif to create a fluorescence-polarized signal ( Fig. 4A ). F-peptide (40 nM) was almost saturated at 5 µM of WDR5, with a Kd value of 1.85 ± 0.35 µM, and created a strong enough signal to assess binding of possible ligands. To test if displacement of the F-peptide can be detected and monitored upon ligand binding, we used unlabeled WIN peptide to displace the labeled WIN peptide ( Fig. 4B ). F-labeled peptide was displaced by unlabeled peptide with a Kdisplacement (Kdis) value of 7 ± 3.4 µM. Because interaction of WDR5 with WIN peptide was strong enough to generate a reliable signal-to-noise ratio at low WDR5 concentration (5 µM), we proceeded with testing the possibility of screening WDR5 in a 384-well format. Fluorescence polarization (FP) signal was measured in the presence of F-peptide only, in 176 wells, and by addition of 25 µM of unlabeled peptide to 176 other sample wells at 5 µM of WDR5 ( Fig. 4C ). Displacement of F-peptide by unlabeled WIN peptide was clear and detectable with a Z′ factor of 0.6. We applied this method to screen WDR5 against the above-mentioned diverse library of compounds and identified hits with Kdis of 1 to 10 µM. Binding of these hits was also confirmed by ITC (e.g., PDB ID: 3SMR).
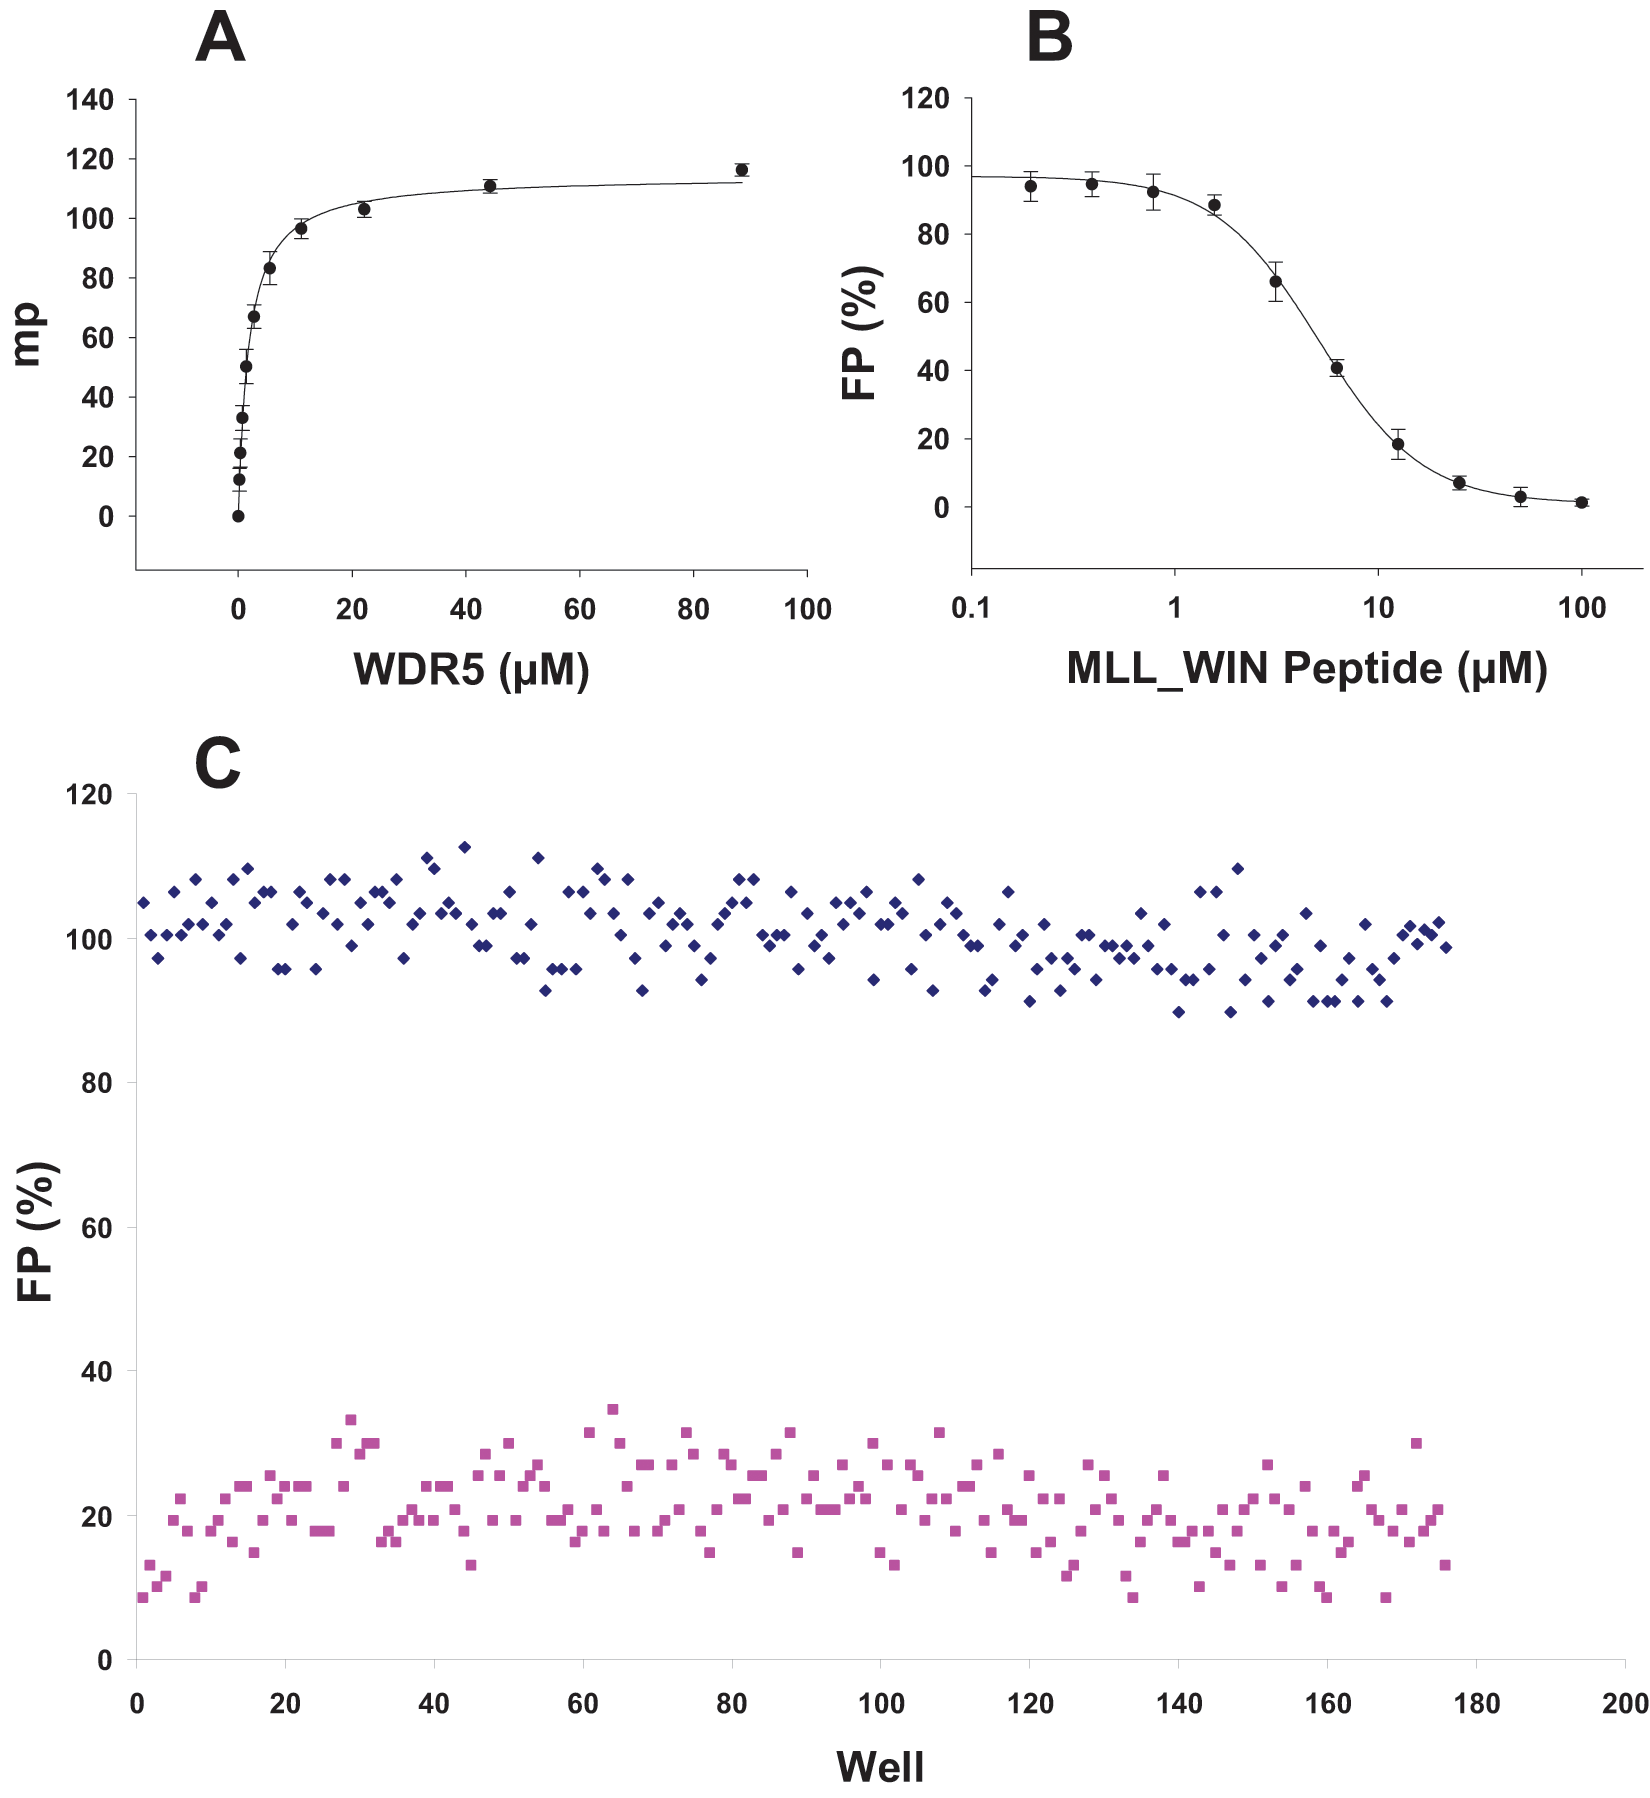
Screening WDR5 for ligand binding by monitoring peptide displacement. Binding of a fluorescein-labeled WIN peptide (GSARAEVHLRKS; 40 nM) to an increasing amount of WDR5 generated a fluorescence-polarized (FP) signal (A). Fluorescein-labeled peptide was displaced by increasing the amount of unlabeled WIN peptide (B), resulting in a decrease in FP signal. FP signal was also measured in the presence (25 µM; 176 samples) and absence (176 samples) of unlabeled peptide in a 384-well format using 5 µM WDR5 (C), and a Z′ factor of 0.6 was determined. Experiments were performed in triplicate
EED is the reader component of the EZH2 complex and binds to H3K27me3 and may be responsible for spreading this mark along chromatin. 67 Here we used a similar approach to assess ligand binding to EED. Binding of a fluorescein-labeled H3K27me3 peptide (QLATKAARKme3SAPATG; 40 nM) to an increasing amount of EED generated an FP signal ( Fig. 5A ). Fluorescein-labeled peptide was then displaced by an increasing amount of unlabeled H3K27me3 peptide ( Fig. 5B ), resulting in an FP signal decrease. Unlabeled H3K27me3 peptide displaced the labeled peptide with Kdis of 150 ± 25 µM. Although saturation was not reached up to 100 µM EED, using a 384-well format, we were able to screen EED using peptide displacement with a Z′ factor of 0.5 ( Fig. 5C ).
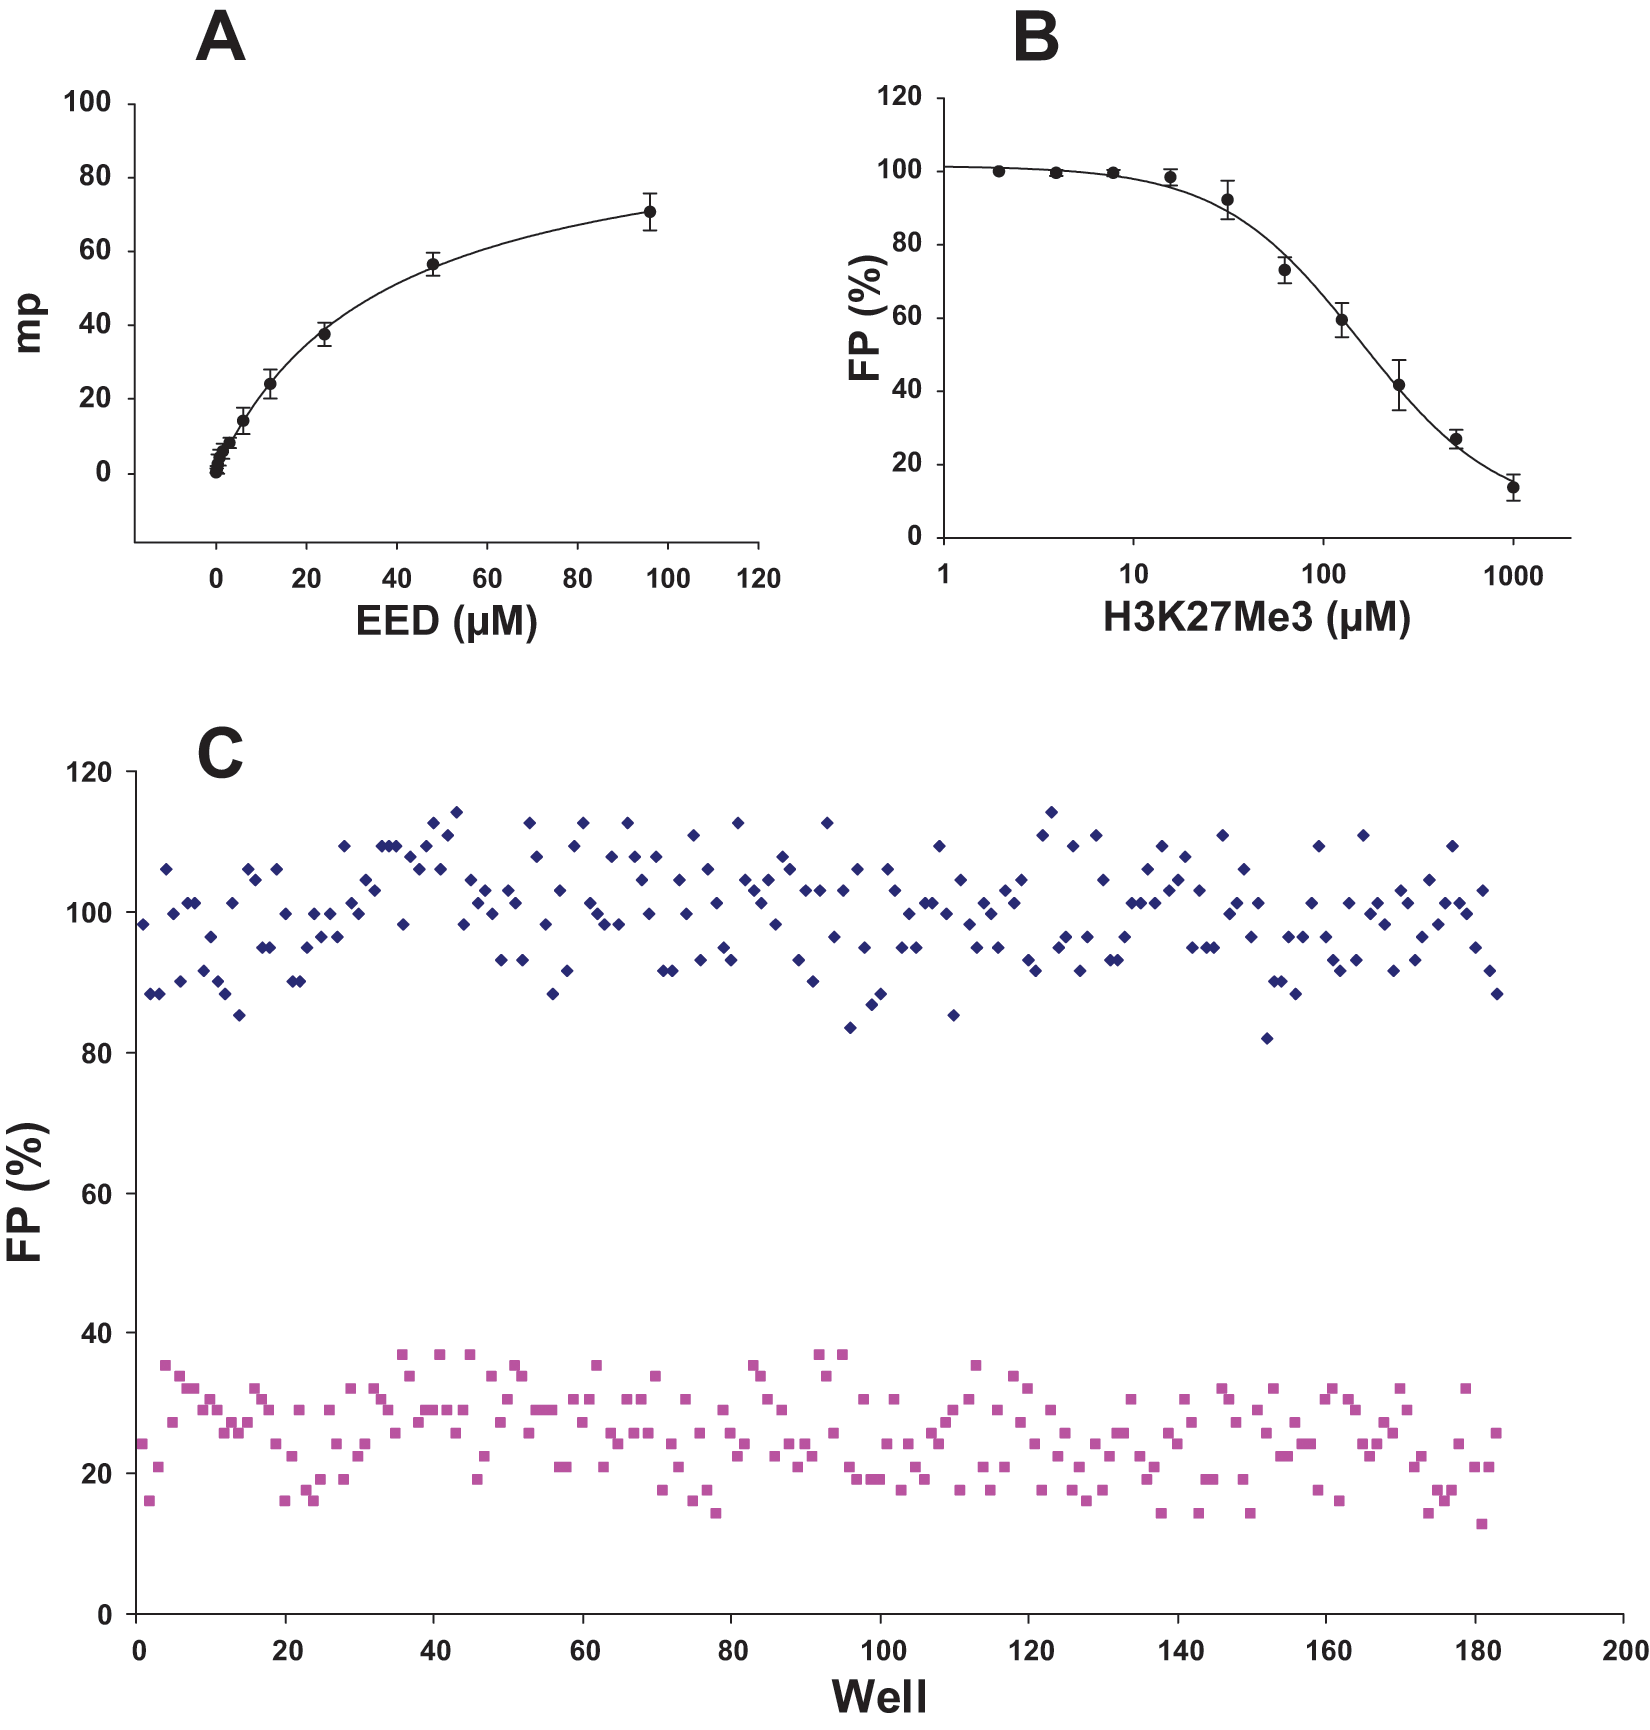
Screening EED for ligand binding by monitoring peptide displacement. Binding of a fluorescein-labeled H3K27me3 peptide (QLATKAARKme3SAPATG; 40 nM) to an increasing amount of EED generated a fluorescence-polarized (FP) signal (A). Fluorescein-labeled peptide was displaced by an increasing amount of unlabeled H3K27me3 peptide (B), resulting in a decrease in FP signal. FP signal was measured in the presence (1 mM; 185 samples) and absence (185 samples) of unlabeled peptide in a 384-well format using 80 µM EED (C), and a Z′ factor of 0.5 was determined. Experiments were performed in triplicate
The kinetic parameters previously reported for the proteins characterized in this study are listed in the
In conclusion, the SAHH-coupled assay in a continuous mode is a reliable method for characterizing and screening G9a, EHMT1, SUV39H2, SETD7, and PRMT3 and probably many other HMTs. However, the amenability of other HMTs to this assay needs to be assessed before using this method for their characterization or screening as proteins such as SETD8 may react with ThioGlo and lose activity. In this report, we provided the kinetic parameters and optimized conditions for screening these HMTs. These kinetic values may vary for peptides with different amino acid sequences, and using nucleosomes as a substrate may produce significantly different values depending on the mechanism of substrate recognition. However, using peptides as substrates for HTS is often more convenient. Optimized screening conditions for WDR5 and EED also present a reliable method to set up screening conditions for other readers of histone methyl marks and peptide binding proteins. Overall, these assays are reliable screening methods and relatively easy to optimize for other writers and readers of histone methyl marks.
Footnotes
Acknowledgements
We thank Dr. Raymond Trievel (University of Michigan) for providing SsSAHH clone and Drs. Alexei Savchenko and Craig Daniels (University of Toronto) for ApSAHH. The Structural Genomics Consortium is a registered charity (number 1097737) that receives funds from the Canadian Institutes for Health Research, the Canadian Foundation for Innovation, Genome Canada through the Ontario Genomics Institute, GlaxoSmithKline, Karolinska Institutet, the Knut and Alice Wallenberg Foundation, the Ontario Innovation Trust, the Ontario Ministry for Research and Innovation, Merck & Co., the Novartis Research Foundation, the Swedish Agency for Innovation Systems, the Swedish Foundation for Strategic Research, and the Wellcome Trust.
References
Supplementary Material
Please find the following supplemental material available below.
For Open Access articles published under a Creative Commons License, all supplemental material carries the same license as the article it is associated with.
For non-Open Access articles published, all supplemental material carries a non-exclusive license, and permission requests for re-use of supplemental material or any part of supplemental material shall be sent directly to the copyright owner as specified in the copyright notice associated with the article.