
Abstract
Developing molecularly targeted therapeutics with minimal off-target effects is facilitated by an understanding of compound selectivity. However, for HDAC inhibitors, a clear understanding of specificity has been challenging. In particular, it has been suggested that use of nonspecific substrates and the presence of multiple HDAC activities in enzyme preparations may complicate interpretation of inhibitor experiments. To overcome these and other potential limitations of activity-based HDAC assays, the authors have developed an assay format based on measurement of the binding affinity of inhibitors rather than measurement of enzyme activity. One advantage of this format is that it does not require use of a substrate and thus ameliorates concerns about lack of specificity of existing substrates. This assay is based on an Alexa Fluor® 647-labeled HDAC inhibitor or “tracer,” which binds with a high affinity to Class I and Class IIb HDACs. Unlike activity assays, which can be affected by the presence of residual untagged endogenous HDACs from the host expression system, the signal in this format is dependent on the presence of an epitope tag on the specific HDAC of interest. The authors demonstrate the utility of this method by determining the potencies of commonly used inhibitors for six human HDACs.
Introduction
Histone deacetylase (HDAC) inhibitors have had some degree of success for treatment of cancer with two approved therapeutics (SAHA and romidepsin) and approximately 10 compounds in clinical trials. Enzyme assays have been used for much of the early-stage preclinical discovery efforts including in vitro screening and optimization of HDAC inhibitors. However, as recently discussed, 1 inhibitor selectivity data have varied substantially among numerous publications, possibly because of different sources of HDAC enzymes and different enzyme assay formats. Thus, interpretation of HDAC enzyme assay data has proven difficult because of overlapping substrate specificities, copurification with other HDAC enzymes, and the large range of specific activities observed in vitro. In one example, activity in HDAC4 preparations was due to copurifying components and not to intrinsic HDAC4 activity. 2 In another example, purification of HDAC3 from mammalian cells resulted in copurification of endogenous HDAC1 and HDAC2, and similarly, purification of recombinant HDAC1 resulted in copurification of endogenous HDAC2 and HDAC3. 3 In addition, it has been demonstrated that the apparent enzyme activity of class IIa HDACs produced in mammalian cells was due to copurification of class I HDACs. 4 For enzyme assays, copurification of even small amounts of related enzymes can contribute substantially to the measured signal in cases in which enzyme activities vary widely, such as with HDACs, and substrates are not specific.
Similar, but distinct, challenges exist in the protein kinase target class with respect to limitations of substrate-based assays. Enzyme assays for protein kinases require a substrate, and only the active form of kinase can phosphorylate a substrate, which precludes the use of a nonactivated kinase as the target. To overcome this limitation, a competitive binding assay was established based on the binding of fluorescently labeled kinase inhibitors, rather than the measurement of catalytic activity. 5 In this format, the signal is dependent on the epitope tag on the exogenously expressed target and is thus not affected by untagged targets present in enzyme preparations and could even be performed in the presence of a cellular lysate. Although it is advantageous compared with activity assays because of the signal’s being more specific to the target, it is important to consider that discrepancies among activity and binding assay formats can also arise due to optical interference and in some cases compound mechanisms (e.g., allosterism). In addition to typical measurements of affinity (i.e., equilibrium binding), this format has provided a relatively facile means of evaluating compound dissociation rates. 6
Competitive binding assays using fluorescent HDAC inhibitors have previously been developed, including a fluorescence resonance energy transfer (FRET)–based competitive displacement assay using internal tryptophan fluorescence and a fluorescent HDAC inhibitor, 7 a fluorescent polarization assay, 8 a combined fluorescence polarization and lifetime assay, 9 and a fluorescence-intensity assay based on a coumarin-labeled HDAC inhibitor. 10 These approaches were limited to use of a bacterial enzyme7,9 or were demonstrated for only one 10 or two 11 human HDACs. Thus, how broadly applicable these competitive binding assays are to the study of human enzymes is unknown. In addition, these existing binding assays use fluorescence intensity or polarization for detection, which may result in higher levels of compound interference than other detection technologies such as time-resolved FRET (TR-FRET) and thus may not be ideal for high-throughput screening. Another recently published approach used chemical probes designed from HDAC inhibitors combined with cellular lysates as the source of the HDAC targets. 12 This method has demonstrated the utility of binding assays to measure HDAC inhibitor potency and has the unique feature of enabling measurements of native enzymes in lysates. However, the method has a practical disadvantage due to the low-throughput nature of the approach and, most importantly, the requirement for mass spectrometry instrumentation.
To alleviate concerns with respect to the use of nonspecific substrates for HDAC enzyme assays, as well as to provide a broadly applicable and high-throughput solution, we have built on TR-FRET competitive binding assays for kinases to develop a solution for HDACs.
Materials and Methods
Materials
Purified HDAC1-3, -6, and -8 were obtained from BPS Bioscience (San Diego, CA) as his- or GST-tagged recombinant proteins. HDAC10 (GST-tagged) was expressed in baculovirus-infected insect cells and purified following standard methods. HDAC tracer 1, HDAC tracer 2, Eu anti-GST tag antibody, biotin anti-his tag antibody, Eu streptavidin (Eu-SA), and assay buffer (50 mM HEPES pH 7.5, 10 mM MgCl2, 1 mM EGTA, 0.01% Brij-35) were from Invitrogen (Carlsbad, CA). White, low-volume 384-well assay plates (#3673) from Corning Inc. (Lowell, MA) were used for all experiments. HDAC inhibitors were from Cayman Chemical (Ann Arbor, MI), Enzo Life Sciences (Plymouth Meeting, PA), LC Laboratories (Woburn, MA), Selleck Chemicals (Houston, TX), and Sigma-Aldrich (St. Louis, MO).
TR-FRET measurements
All TR-FRET measurements were performed using a PHERAstar Plus microplate reader (BMG Labtech, Germany) with excitation at 340 nm followed by detection of emission at 615 nm (donor) and 665 nm (acceptor). Emission intensities were collected over 200 µs following a postexcitation delay of 100 µs. TR-FRET values were calculated as the ratio of acceptor intensity to donor intensity.
HDAC tracer Kd determination
The binding affinity of each HDAC-tracer pair was determined by incubating a dilution series of tracer with 5 nM HDAC and either 2 nM Eu anti-GST tag antibody (HDAC6, 10) or 2 nM biotin anti-his tag antibody (HDAC1-3, -8) with 2 nM Eu-SA (HDAC1-3, -8). At each concentration of tracer tested, wells containing 10 µM trichostatin A were compared with wells containing 1% DMSO to establish nonspecific and total TR-FRET signal, respectively. Reagents were added in the following order: 5 µL of 3% DMSO or 30 µM trichostatin A, 5 µL of an HDAC/antibody mixture, and 5 µL of tracer for a total volume of 15 µL per well. Plates were then incubated for either 20 min (HDAC8) or 60 min (HDAC1-3, -6, -10) at room temperature prior to measuring TR-FRET values. The TR-FRET value of wells containing 10 µM trichostatin A was subtracted from the TR-FRET value of wells without inhibitor (1% DMSO) to generate a corrected TR-FRET ratio. Kd values were determined by plotting the corrected TR-FRET ratio against tracer concentration and fitting the data with an equation for one-site binding using GraphPad Prism software (GraphPad Software Inc., La Jolla, CA).
Inhibitor IC50 determination and Z′ values
IC50 values were generated using a panel of 18 known HDAC inhibitors. Assay conditions, other than the tracers, were as follows: 5 nM HDAC, 2 nM Eu anti-GST tag antibody (HDAC6, 10), 2 nM Eu anti-his tag antibody (HDAC1-3, -8), 2 nM Eu-SA (HDAC1-3, 8). HDAC tracer 1 was used at 30, 100, 10, 3, and 50 nM, for HDAC1-3, -6 and -8, respectively. HDAC tracer 2 was used at 30 nM for HDAC10. A 16-point inhibitor dose-response curve was tested, covering a concentration range of 10 µM to 10 pM. A serial dilution of each inhibitor was prepared in 100% DMSO at 100-fold the final concentration to be tested in the assay. The dilution series was then diluted 33.3-fold in assay buffer and added to the plate, 5 µL per well, in duplicate. Five microliters of an HDAC/antibody mixture followed by 5 µL of tracer was dispensed to each well of the plate to start the assay. Assay plates were incubated for 20 to 30 min (HDAC8) or 60 min (HDAC1-3, -6, -10) at room temperature prior to measuring TR-FRET values. IC50 values were calculated by fitting the data using an equation for sigmoidal dose-response (GraphPad Prism software). Z′ values were determined from 16 points with 10 µM trichostatin A (TSA) and 16 control points with DMSO only.
HDAC3 binding kinetics study
The binding of MS-275 and SAHA to HDAC3 was monitored kinetically by performing the assay as described in the Inhibitor IC50 Determination section, with a modification to the order of reagent addition: 5 µL of inhibitor, 5 µL tracer, and finally 5 µL of an HDAC/antibody mixture was added to the plate. The assay plate was incubated at room temperature, and TR-FRET values were measured at intervals following the last addition to the plate.
Results and Discussion
After structural optimization of various potential tracers, two molecules (HDAC tracers 1 and 2) were selected and found to be suitable for HDAC1-3, -6, -8, and -10. Prior to evaluating inhibitor affinities, it is important to determine the tracer affinity for each target of interest and to ensure that binding of the tracer is displaced with a known inhibitor. Thus, tracer Kd values were determined for each enzyme ( Fig. 1 ) by measuring the TR-FRET emission ratio as a function of tracer concentration and subtracting the signal in the presence of excess of the known inhibitor TSA to correct for nonspecific signals. Such nonspecific signals are typically due to a low level of FRET that occurs even in the absence of binding but could also be due to nonspecific binding of a tracer to a target. The affinities of the tracers were between 1 and 200 nM, which covers the suitable range for such TR-FRET displacement assays. No significant binding was observed for HDACs 4, 5, 7, and 9 (data not shown). HDAC tracers 1 and 2 were able to bind recombinant, purified class I and IIb HDACs and be competed off with excess of a known inhibitor (TSA). This is in contrast to some extent with a mass spectrometry–based method, which observed binding that was not competed off with excess inhibitor for most HDACs tested. 12
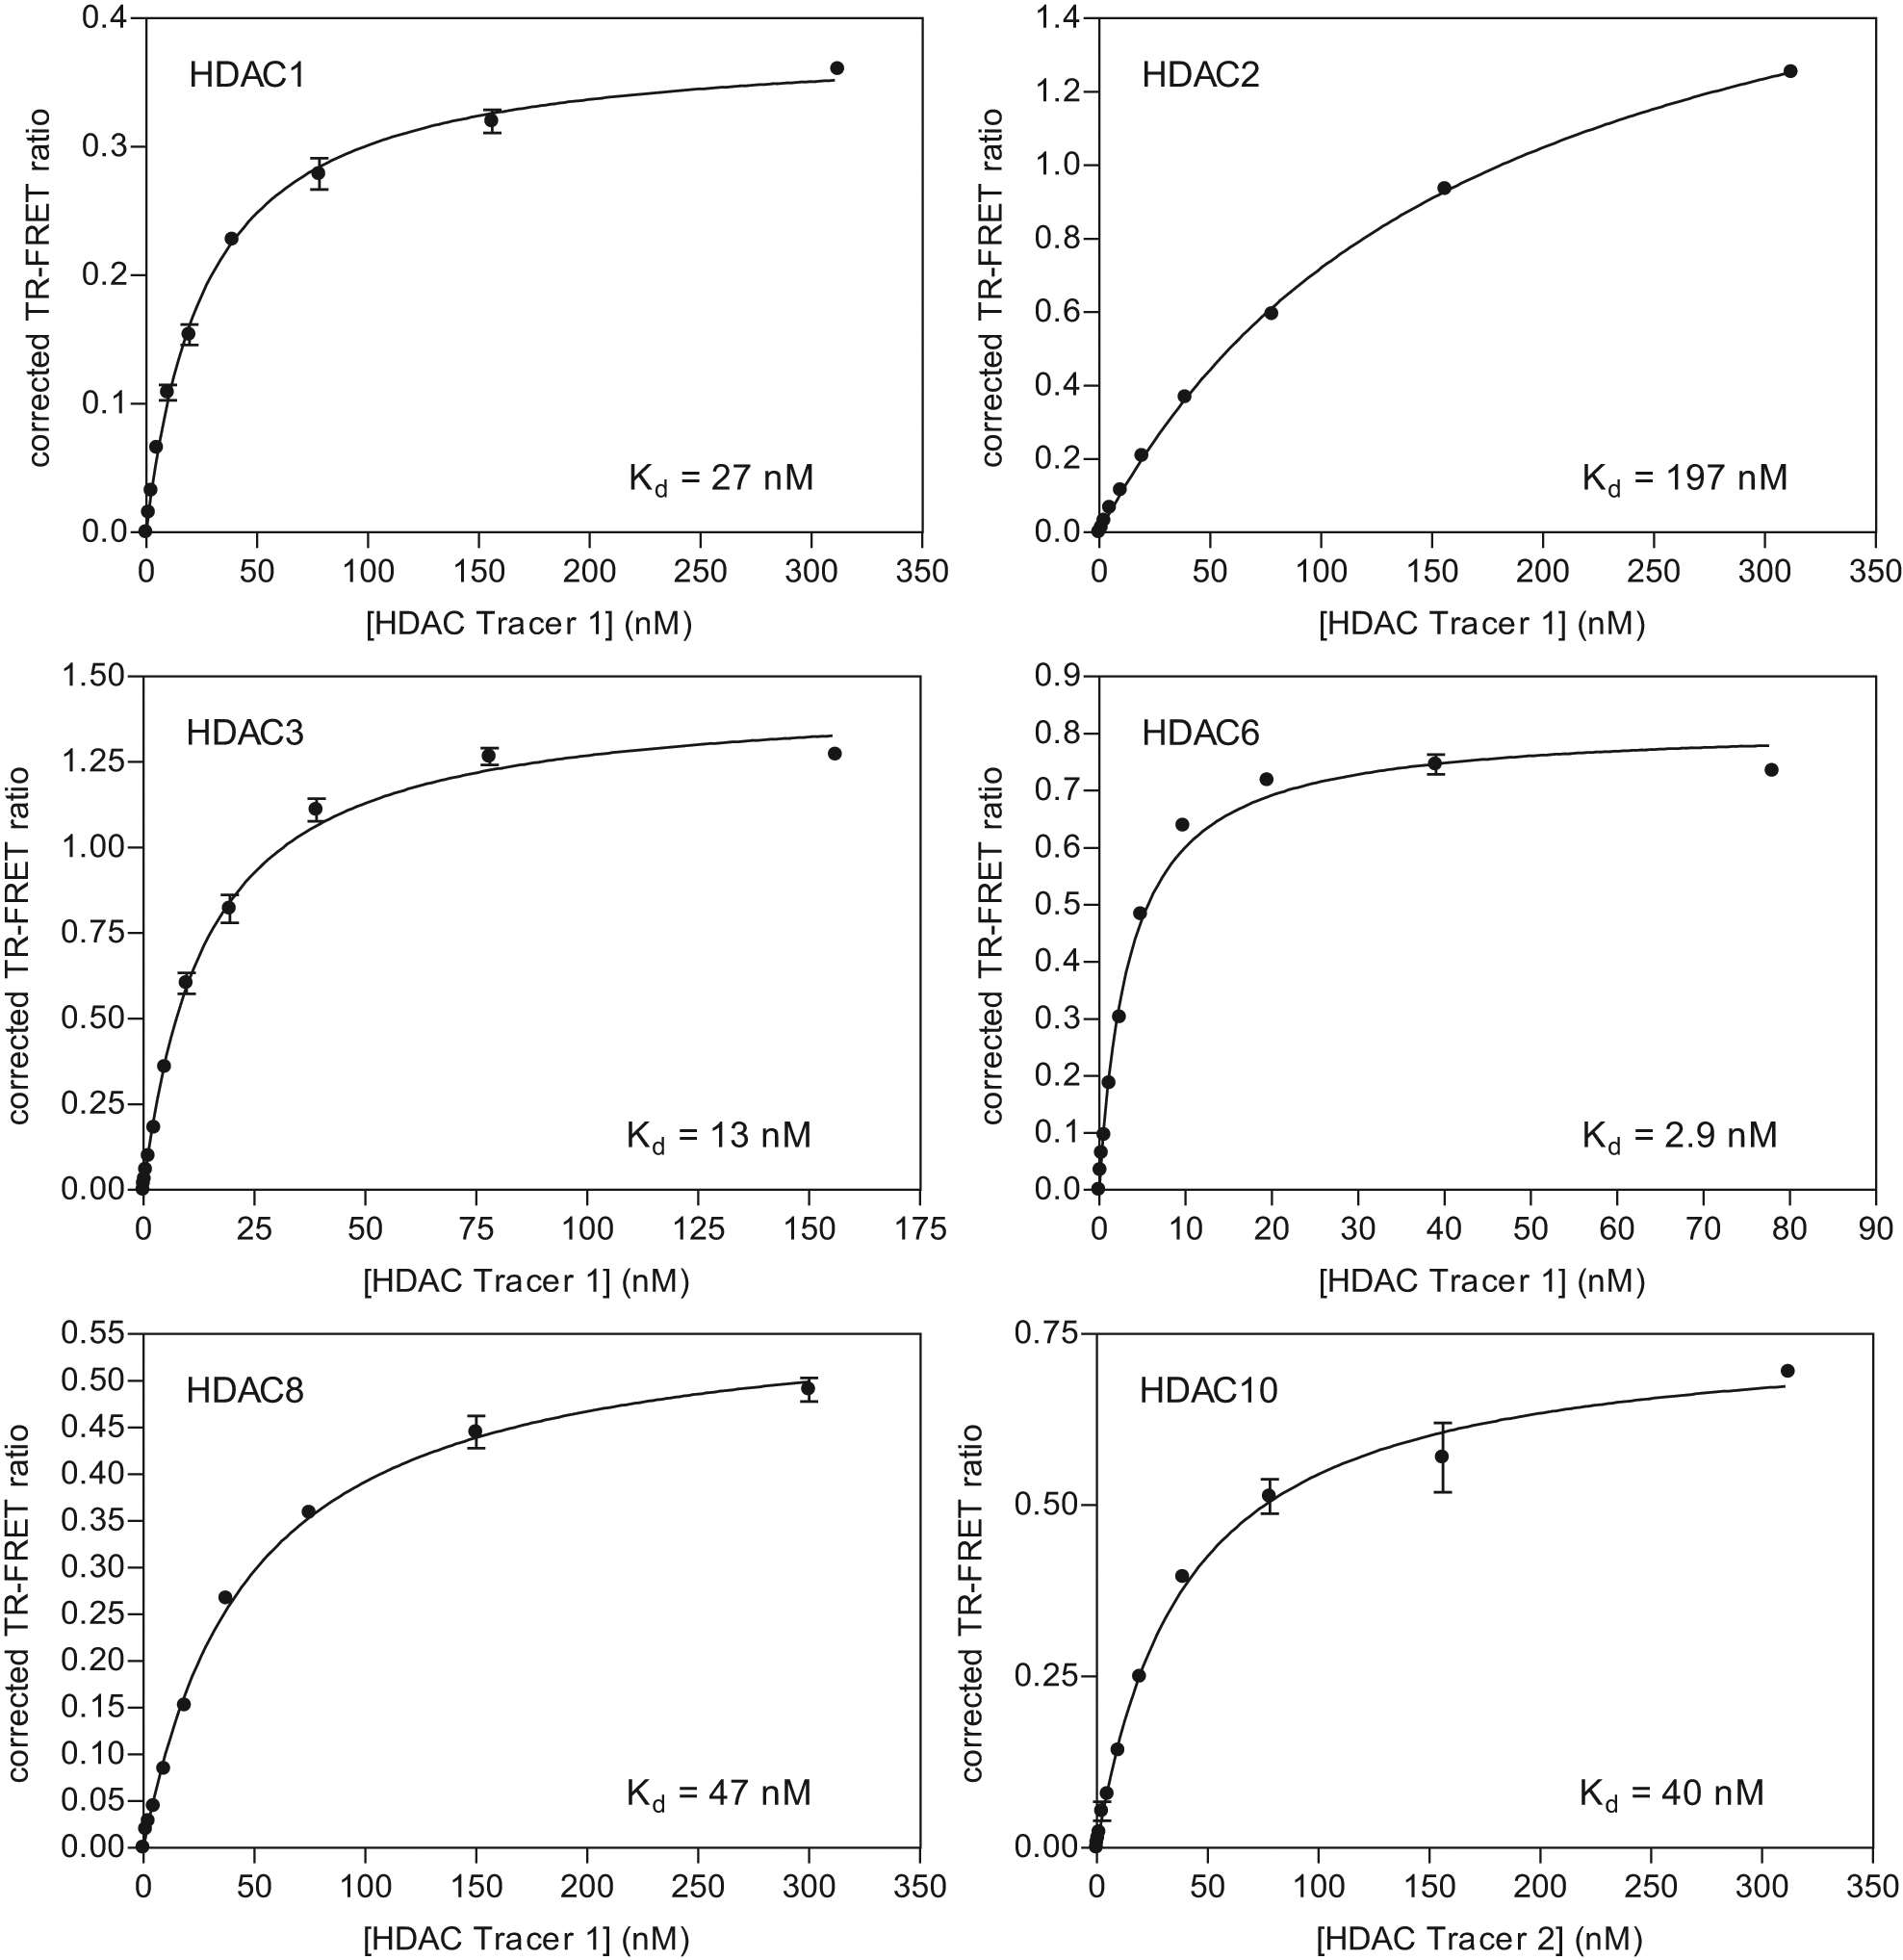
The apparent dissociation constant (Kd) for the histone deacetylase (HDAC):tracer binding interaction was measured by incubating 5 nM HDAC, 2 nM antibody, and a titration of HDAC tracer. One percent DMSO or 10 µM trichostatin A (TSA) was included to represent the total and nonspecific time-resolved fluorescence resonance energy transfer (TR-FRET) signal, respectively. A corrected TR-FRET ratio was obtained by subtracting the +TSA signal from the 1% DMSO control signal.
Assays were then performed with the tracer concentration approximately equal to the Kd values. The assays were found to be robust with Z′ values of 0.82 ± 0.02, 0.90 ± 0.01, 0.84 ± 0.08, 0.71 ± 0.11, 0.79 ± 0.07, and 0.81 ± 0.03 for HDAC1-3, -6, -8, and -10, respectively. A panel of 18 commercially available HDAC inhibitors were profiled across each HDAC binding assay to determine inhibitor affinities and selectivity. Inhibitor dose-response curves for eight selected compounds from the set with different selectivity profiles are presented in Figure 2 , and IC50 values for all inhibitors are listed in Table 1 . The hydroxamate-based inhibitors, including the well-studied molecules SAHA and TSA, were found to be nonselective against both class I and class IIb HDACs, consistent with previous studies.1,13,14 One notable exception was MC 1293, which was selective for HDAC6, with an IC50 value sevenfold lower for HDAC6 than HDAC10 and more than 30-fold lower than other enzymes. The two cyclic peptides tested (Apicidin and HC Toxin) were generally as potent against HDAC1-3 as the hydroxamate class but had much higher IC50 values for HDAC6, HDAC8, and HDAC10. The most selective class of compounds was found to be the benzamides, including MS-275, CI-994, and BML-210. The benzamides did not bind HDAC6, HDAC8, or HDAC10 while retaining potency, albeit with a weaker affinity than the most hydroxymates, against HDAC1-3.
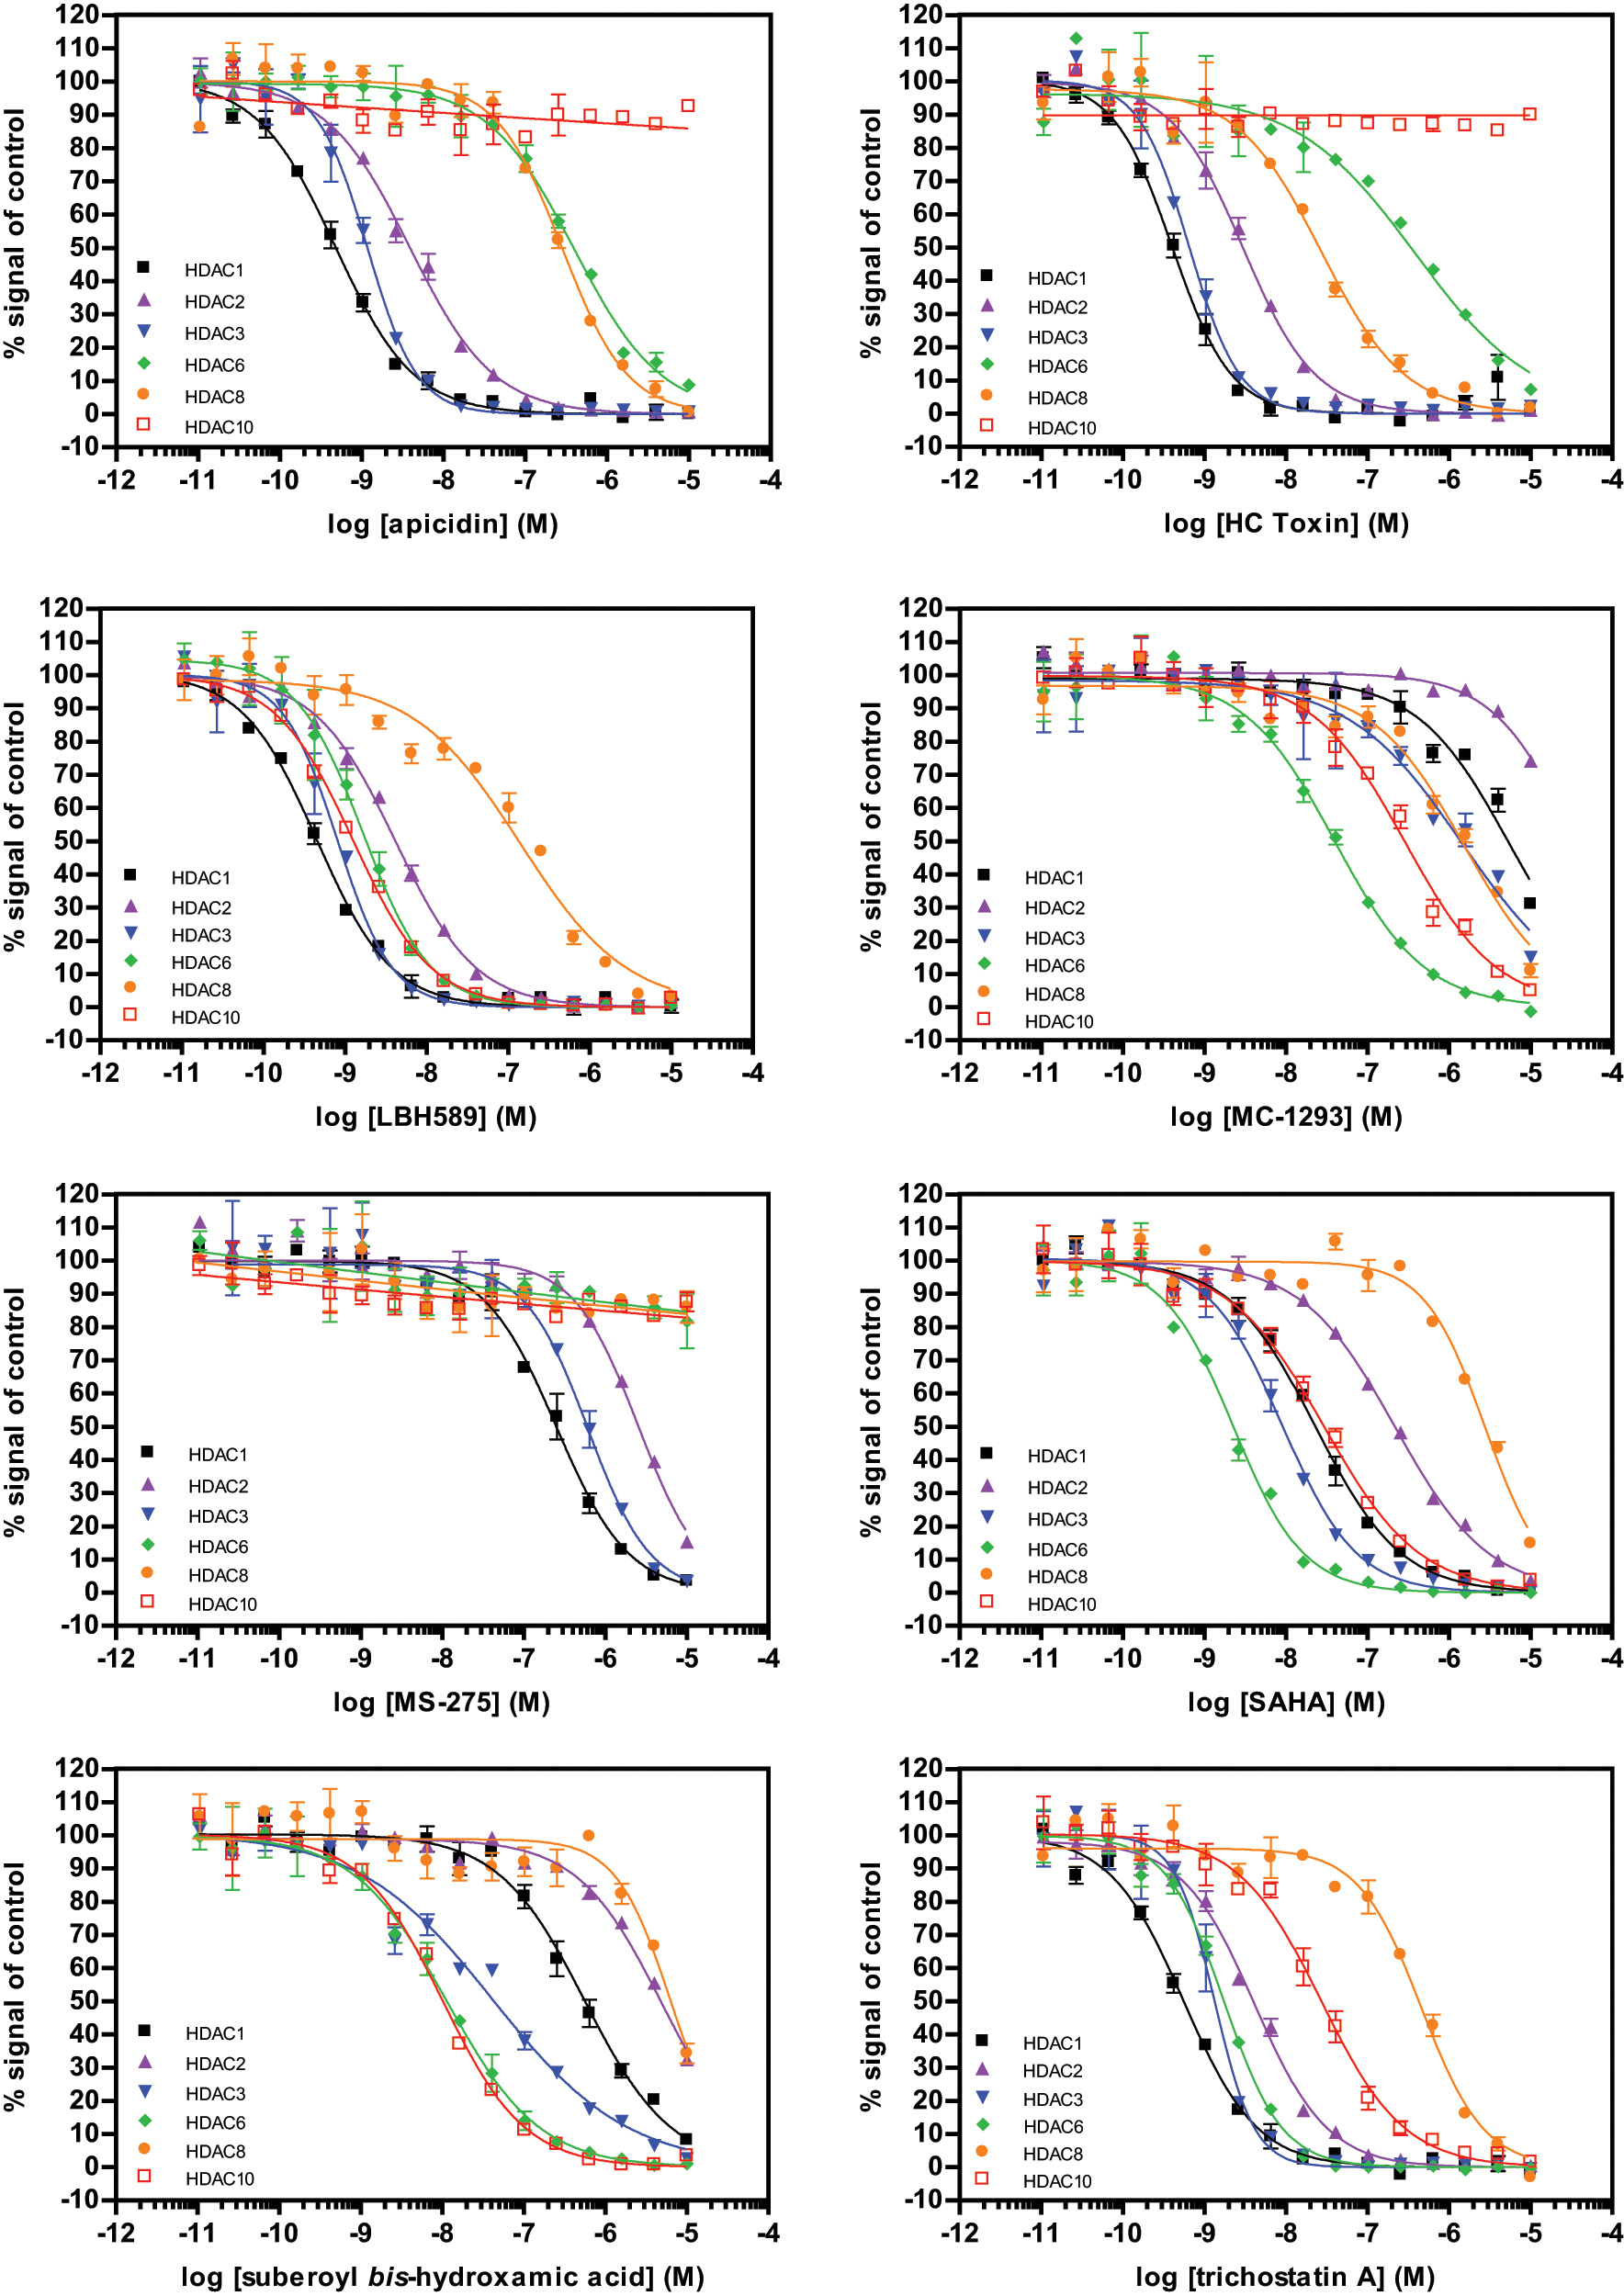
Example inhibitor profiles from an 18-compound screen were plotted to illustrate selectivity patterns of known histone deacetylase (HDAC) inhibitors. Because the magnitude of the time-resolved fluorescence resonance energy transfer signal is target specific, the signals for the comparison were converted to a percentage of control wells, with the 1% DMSO control as 100% and the 10 µM trichostatin A control as 0%.
Values (nM) for 18 Known HDAC Inhibitors Were Determined Using the Panel of HDAC Binding Assays
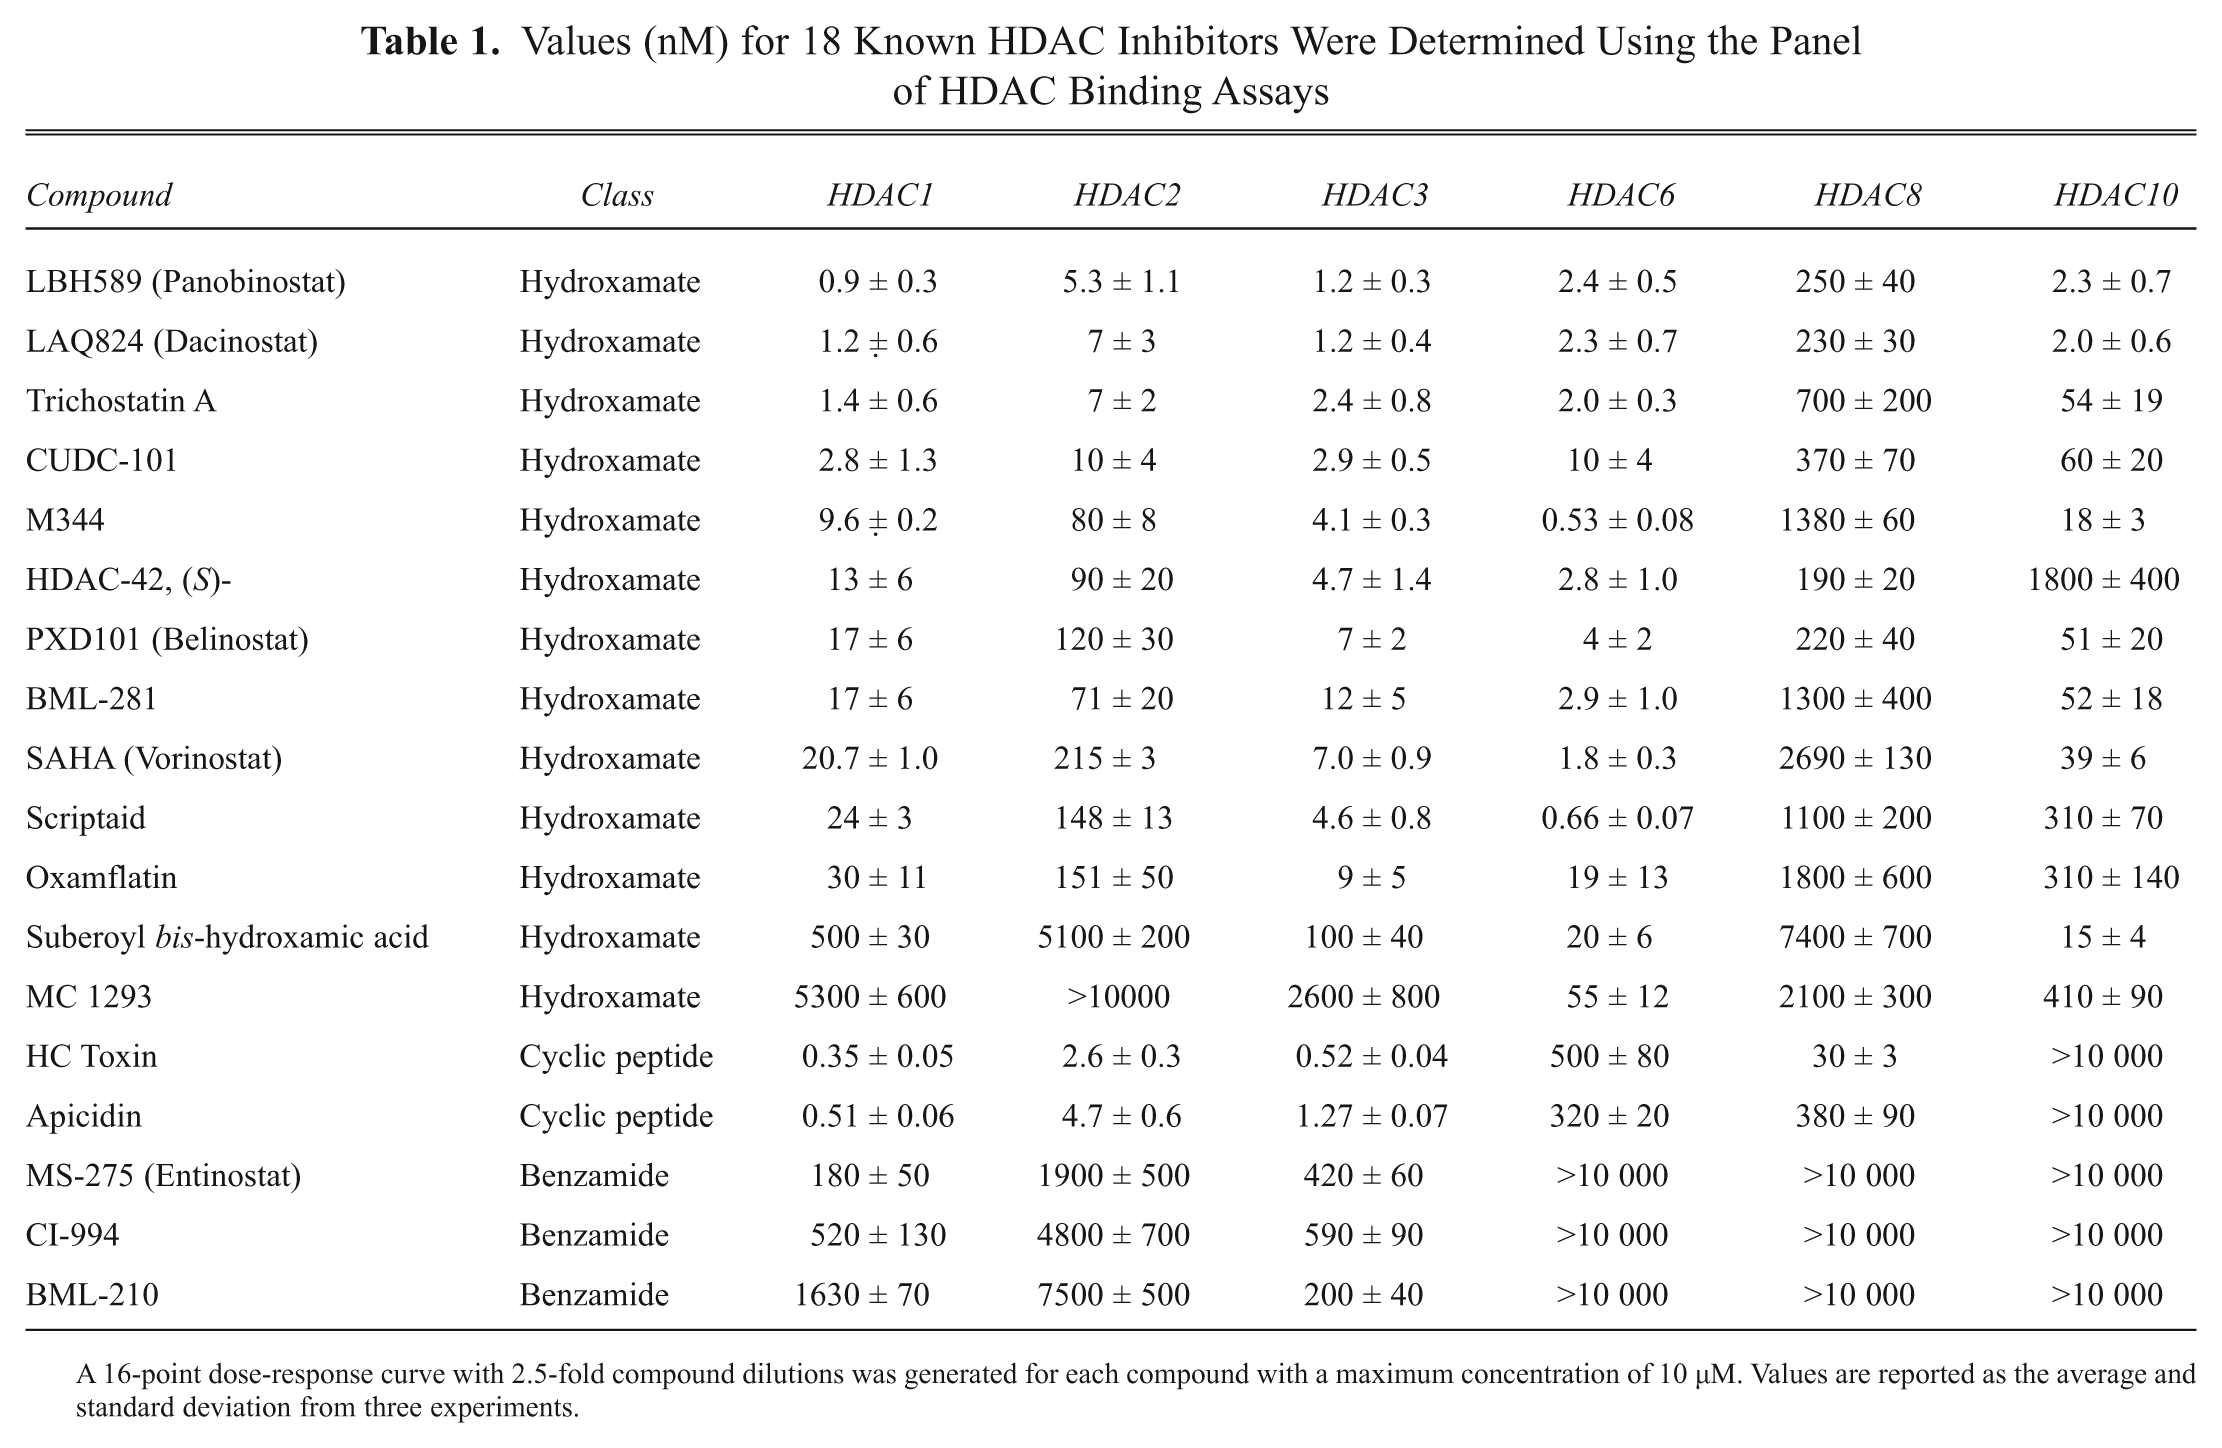
A 16-point dose-response curve with 2.5-fold compound dilutions was generated for each compound with a maximum concentration of 10 µM. Values are reported as the average and standard deviation from three experiments.
Although the benzamide class was not as potent as the hydroxymate class against HDAC1-3 in the 1 h equilibrium binding experiments, initial studies showed a time dependence of binding the benzamides (data not shown). The apparent slow binding of these compounds was further explored for MS-275. Inhibitor titration curves were read at multiple time points for MS-275 and SAHA, as a representative compound of the hydroxamate class ( Fig. 3 ). It was found that the IC50 value for MS-275 decreased 20-fold over a 2 h time course, changing from 8.5 µM at 10 min to 430 nM at 120 min, whereas the IC50 values for SAHA remained relatively unchanged from 13 nM at 10 min to 18 nM at 120 min. Thus, although the benzamides appear less potent relative to the hydroxamates based on the 1 h experiment, when binding kinetics are taken into consideration (both on and off rates), true potency may be expected to change. The ability to read the binding assay reactions at multiple time points highlights an advantage relative to activity assays, which typically require that separate assays be performed for each time point.
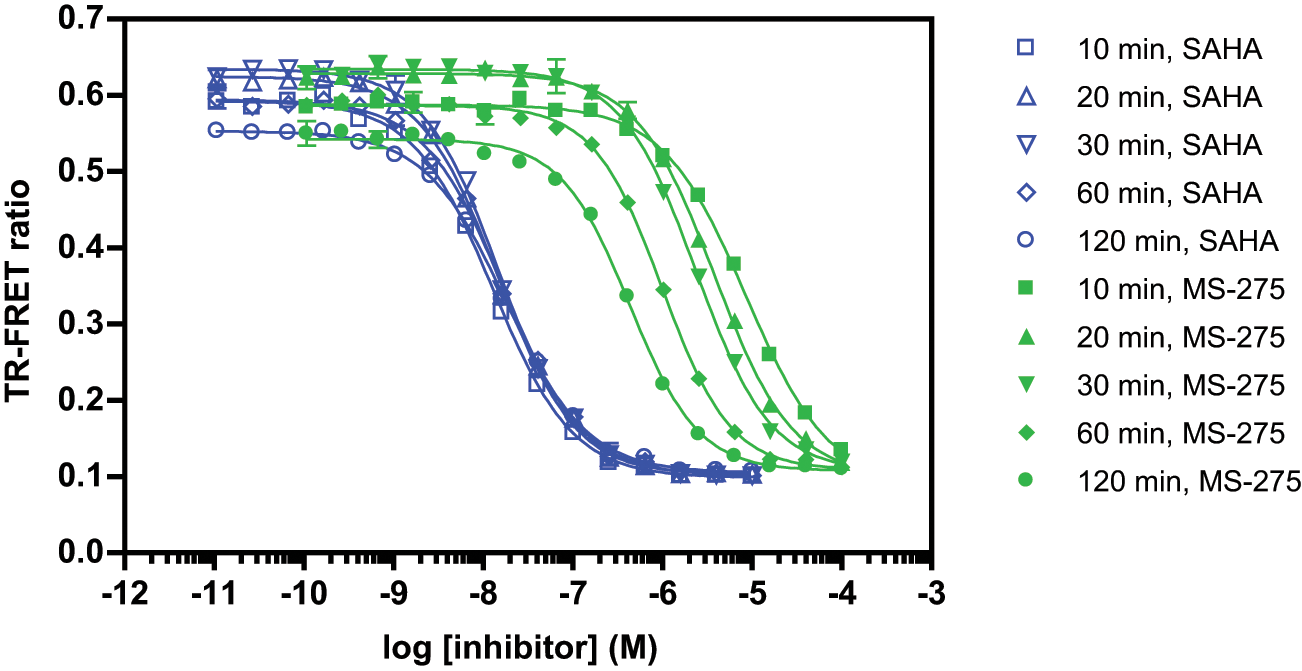
The binding kinetics of SAHA and MS-275 were compared with the histone deacetylase binding assay. Binding assays were performed as described in the Materials and Methods section, and measurements were taken at various time points up to 2 h.
Although this experiment demonstrates the ability to evaluate the slow binding of HDAC inhibitors, it is reasonable to expect that this format can also be applied to evaluate compound dissociation rates, as has been demonstrated for protein kinases. 15 To this end, precincubation of HDAC3 with inhibitors at 10× the IC50 concentration, followed by 100× dilution into a solution of 2 nM antibody and excess tracer (200 nM) with continuous TR-FRET measurement, revealed slow dissociation of MS-275 relative to SAHA (data not shown).
In conclusion, the binding assay method described provides a simple and complementary alternative to HDAC enzyme assays using a TR-FRET readout. The assays developed resulted in high Z′ values, involve only three addition steps, recapitulate previous findings of selectivity, and were successful for six human HDACs. Most important, this method allows assessment of inhibitor potency in the absence of the need for a specific substrate, as well as enables facile evaluation of slow-binding compounds.