
Abstract
The molecular pathology of many protein misfolding, toxic gain-of-function diseases, such as amyotrophic lateral sclerosis (ALS), is not well understood. Although protein misfolding and aggregation are common themes in these diseases, efforts to identify cellular factors that regulate this process in an unbiased fashion and on a global scale have been lacking. Using an adapted version of an extant β-gal-based protein solubility assay, an expression screen for cellular modulators of solubility of an ALS-causing mutant SOD1 was carried out in mammalian cells. Following fluorescence-activated cell sorting enrichment of a mouse spinal cord cDNA library for gene products that increased SOD1 solubility, high-throughput screening of the cDNA pools from this enriched fraction was employed to identify pools containing relevant modulators. Positive pools, containing approximately 10 cDNA clones each, were diluted and rescreened iteratively until individual clones that improved SOD1 folding/solubility were identified. Genes with profound effects in the solubility assay were selected for validation by independent biochemical assays. Six of 10 validated genes had a significant effect on SOD1 solubility and folding in a SOD1 promoter-driven β-gal assay, indicating that global screening of cellular targets using such protein solubility/folding assay is viable and can be adapted for other misfolding diseases.
Keywords
Introduction
P
Several methods have been established to monitor protein solubility and folding in cells. A green fluorescent protein (GFP)–based protein folding assay in Escherichia coli was reported 9 and used for the isolation of soluble variants of aggregation-prone proteins in a molecular evolution approach. Cabantous et al. 10 later reported an improved modified GFP-based assay for the directed evolution of proteins. Wigley et al. 11 and Stidham et al. 12 reported a β-galactosidase-based structural complementation assay to study protein folding in cells. A related complementation approach using β-lactamase was used by Galarneau et al. 13 to study protein–protein interaction in vitro. A GFP-based variation of the complementation assay in HEK 293 cells has been used to study the effect of GSK3β on tau aggregation. 14 All these previous attempts have used the protein solubility assays to improve bacterially expressed protein solubility, to study protein–protein interaction, or to study aggregation of a protein under certain specific conditions. To our knowledge, these methods have not been exploited to identify gene products that regulate misfolding in an unbiased, global manner in mammalian systems. Previously, cell-based assays were used to screen for compounds that either reduced transcription driven by a SOD1 promoter15,16 or increased the degradation of an enhanced GFP (EGFP)–tagged SOD1. 16 Expression profiling efforts attempt to understand the cellular makeup of disease tissues or models.17–19 Although these studies inform by identifying many new proteins that are up- or downregulated in the diseased state, many of these changes may arise from cellular adaptive and compensatory responses to disease rather than play a causative role in the pathogenesis. In addition, the few studies to date investigated the cellular response to the presence of misfolded protein and not the influence of cellular genes on the behavior of the misfolded protein itself. In the current study, gene products that increased soluble levels of a disease-causing mutant protein, in cells that had not been adapted to chronic expression of the disease-causing protein, were identified.
A variant of the β-gal assay described by Wigley et al. 11 was employed in mammalian cells to identify candidate cellular proteins that affect the levels of soluble/folded superoxide dismutase 1 (SOD1), a protein whose misfolding is implicated in the development of ALS, 20 a degenerative neuromuscular disease. SOD1 is a 32-kD homodimeric enzyme involved in the scavenging of superoxide radicals. 21 Mutations in SOD1 found in familial forms of ALS have been shown to destabilize the protein 22 and are associated with aggregated inclusions observed in motor neurons 23 and microglia of patients. The inclusions correlate with loss of motor neurons in the brainstem and spinal cord, leading to loss of voluntary muscular function. 24 Significantly, SOD1 knockout mice do not develop disease, 25 but transgenic mice expressing mutant SOD1 develop disease despite active SOD1 function, 26 demonstrating that the disease is caused by a toxic gain-of-function. However, the identity of proteins or pathways involved in the formation/clearance of aggregated, insoluble SOD1 or the mechanistic details of how aggregates lead to neurodegeneration are not well understood.
Proteins involved in regulating mutant SOD1 folding and solubility were identified in a cDNA expression library derived from mouse spinal cord using the β-gal assay. Validation experiments carried out on the protein hits (modulators) after secondary and tertiary screening established their relevance to SOD1 expressed under the control of an endogenous SOD1 promoter. 27 The results identify a number of proteins involved in the regulation of soluble/folded SOD1. The results indicate that a strategy combining a protein solubility/folding assay with a functional genomic technique such as expression screening is a viable approach to identify modulators in other protein misfolding diseases.
Materials and Methods
Vector constructs
The human Cu/Zn superoxide dismutase (SOD1) gene was amplified from clone #3140145 (I.M.A.G.E. Consortium) by PCR and fused in frame with an HA tag and the α-fragment of β-galactosidase in the expression vector pcDNA3.1+ (Invitrogen, Carlsbad, CA) under the control of a cytomegalovirus (CMV) promoter. Mutations in the SOD1 gene were introduced with the QuikChange kit (Stratagene, La Jolla, CA). Similarly, the ω-fragment of the β-galactosidase gene was cloned into the pcDNA3.1+ vector. The pcDNA3.1+ vector with the SOD1-HA-α fragment and a pcDNA3.1+ with the ω-fragment constitute the reporter system. Additional vectors were also constructed that lacked the β-lactamase (ampicillin resistance) gene. The human SOD1 promoter 27 (2156 bp) was amplified by PCR from buccal swab cells and was cloned in the pcDNA3.1+ SOD1-HA-α vector, replacing the CMV promoter.
SOD1 solubility assay
HEK 293 cells were transfected with reporter plasmids or control vectors (empty) using polyethylene (PEI) transfection reagent and incubated at 37 °C/5% CO2 for 48 h. Cells were lysed using the 1× reporter lysis buffer (Promega, Madison, WI) with one tablet of protease cocktail mini EDTA free (Roche, Basel, Switzerland)/10 mL. β-Galactosidase activity was assayed on the cell lysate or supernatant and pellet fractions (spun at 10,000 g, 20 min at 4 °C) using fluorescein di-β-D-galactopyranoside (FDG), a flourogenic substrate (Sigma, St. Louis, MO). The fluorescence was monitored in a microplate reader (Tecan Polarion [Tecan, Männedorf, Switzerland] or Molecular Devices SpectraMax [Molecular Devices, Sunnyvale, CA]) with excitation at 490 nm and emission at 525 nm. The assay was optimized for high-throughput format by varying the amount and ratios of the α-fusion and ω-plasmids as well as the transfection conditions. The suitability of the assay for high-throughput screening (HTS) was evaluated by calculating the Z′ factor: 1 − ((3*(σp + σn))/|µp – µn|), where σ and µ represent the standard deviation and mean, respectively, and p and n represent positive and negative controls. 28
Mouse cDNA library construction
Spinal cord tissue from C57BL/6 mice was isolated, minced in RNA-STAT-60 (Tel-Test, Gainesville, FL) reagent, and used for total RNA isolation following RNA STAT protocols. The quality of the total RNA was ascertained by a formaldehyde–agarose gel by the appearance and ratio of the 28s and 18s rRNA bands. The mRNA was isolated by two rounds of purification through oligo dT columns of a mRNA purification kit (Amersham Pharmacia, Uppsala, Sweden). The cDNA synthesis (first and second strands), size fractionation, and ligation to pCMVsport6 vector were carried out according to Superscript cDNA synthesis and cloning kit protocols (Invitrogen). After ligation of cDNA product to the pCMVsport6 vector, the DNA was electroporated into ElectroMax DH10B competent cells (Invitrogen). The plasmid library was expanded using the semi-solid agar-based method, and the library DNA was isolated.
Enrichment of the cDNA library (primary screen) by fluorescence-activated cell sorting and recovery of cDNA clones
The cDNA library in pCMVsport6 vector was co-transfected into HEK 293 cells in 10-cm cell culture dishes with the β-gal reporter system in a pcDNA3.1+ ΔAmp vector. Forty-eight hours posttransfection, the cells were trypsinized and pelleted in a conical tube (500 g, 5 min). FDG (0.5 mM) dissolved in water was added to the pelleted cells and gently mixed. After incubating the mixture at 37 °C in a water bath for 3 min, the substrate loading was quenched by adding 10 volumes of ice-cold phosphate-buffered saline (PBS). The cells were pelleted (500 g, 5 min) and washed twice with PBS and maintained on ice in PBS. The cells were passed through a cell strainer to remove cell clumps and were analyzed using fluorescence-activated cell sorting (FACS; FACSAria, BD Biosciences, Franklin Lakes, NJ) in the FITC channel. The enriched population of cells were collected, and plasmid DNA from the cells was recovered using a modified “miniprep” procedure (Nucleospin; Clontech, Mountain View, CA) and dissolved in Milli Q water. The recovered plasmids were electroporated into Electromax DH10B (E. coli) cells and plated on LB-Amp plates after 1 h recovery in an LB medium. The plates were incubated overnight at 37 °C, and the total number of colonies was counted and the transformation efficiency calculated. A few clones were selected randomly and inoculated on LB-Amp medium for DNA miniprep. The DNA thus isolated after the miniprep was sequenced or digested with NotI–SalI to assess insert sizes.
cDNA library pool generation and 96-well DNA miniprep
The enriched cDNA library was divided into 1584 (18 plates × 88 pools/plate) pools of approximately 10 cDNA clones each. Based on the transformation efficiency calculated above, electroporation of an aliquot of the recovered cDNAs, followed by appropriate dilution, was carried out to generate ~10 transformants/well. The cells were grown in 1.25 mL/well TB-Amp medium in 96-well deep-well plates (QIAPrep 96 Turbo Miniprep Kit; QIAGEN, Valencia, CA). Following overnight growth at 37 °C/300 rpm, bacterial cells were pelleted down, and DNA miniprep was carried out per the kit’s instructions. A few of the pools were randomly picked and digested with NotI and SalI restriction enzymes to verify the insert size and complexity. The transformation and miniprep of the total enriched library was carried out in five batches. DNA samples from each batch were randomly picked and estimated for DNA concentration. The DNA concentration was later used in calculating the volume of the pool that would be transfected in the screening process.
Secondary screen with A4V SOD1 reporter
Secondary screening was carried out using a Beckman Coulter (Brea, CA) BioMek FX robot with a 96-well head. A transfection mix consisting of 150 ng each of the reporter plasmids (A4V SOD1-HA-α and ω-fragment of β-gal), 300 ng of the library pools, and 12 µL of PEI (25-kD linear polymer of polyethylenimine, transfection reagent) was added to a deep-well plate containing 150 µL of Dulbecco’s modified Eagle’s medium (DMEM) and incubated at room temperature for 15 min. To the transfection mix, 650 µL of HEK 293 cells in DMEM/10% Bovine calf serum/1% penicillin/streptomycin medium was added and mixed. Then, 250 µL of the cell–transfection mixture was aliquoted into 3 × 96-well assay plates. The control for each plate (8 wells) was prepared similarly, except the equivalent amount of the empty pcDNA3.1+ vector replaced cDNA pools. Transfected cells were incubated in a 37 °C/5% CO2 incubator for ~48 h, after which the media were aspirated, and 50 µL of FDG substrate (25 µM solution in 0.5× reporter lysis buffer (Promega) with protease inhibitor cocktail (EDTA free) was added to each well. The plates were read for fluorescence (ex: 490 nm, em: 525 nm) in a SpectraMax Gemini fluorescence plate reader (Molecular Devices).
Data analysis
The fluorescent intensities collected from the screening were analyzed by two different methods, Z score and median absolute deviation (MAD) score. They were calculated based on equations (1) and (2).


where Xi is fluorescent signal in each well, X is the plate mean, σx is the plate standard deviation, X~ is the plate median, and MAD 29 is median absolute deviation of the plate. The values of the Z score and MAD scores were averaged for the three replicates and tabulated. The MAD-based method is less sensitive to outliers in a plate compared to Z score. The wells were ranked based on the highest Z score, and the corresponding values in MAD score were also verified to ascertain their consistency.
Tertiary screen and clone isolation
Selected secondary pools were transformed into E. coli (DH10B) and plated on LB-Amp plates. Ten tertiary pools of four clones each were prepared for each secondary pool. The DNA isolated from the tertiary pools was co-transfected with the reporter system, and the fluorescence was measured after substrate addition as earlier. The tertiary pools that enhanced the SOD1 levels above 3 standard deviations (SD) over controls were selected, and the DNA was transformed and plated on LB-Amp plates. Eight single colonies were picked from each plate, and the plasmids were isolated. The β-gal assay was carried out on these clones as described previously. The clones that showed increased fluorescence were sequenced.
Biochemical analysis
Cell lysate, supernatant, and pellet fractions were prepared as described above (solubility assay), and the samples were run on sodium dodecyl sulfate polyacrylamide gel electrophoresis (SDS-PAGE) gel and transferred to nitrocellulose membrane. Western blot analysis was carried out with mouse anti-HA antibody (detecting SOD1) and developed with ECL plus detection (GE Healthcare, Piscataway, NJ) reagent. The blots were scanned using a STORM 840 PhosphorImager (Amersham Pharmacia). The band intensities were calculated using the ImageQuant software (GE Healthcare).
Results
Assay development
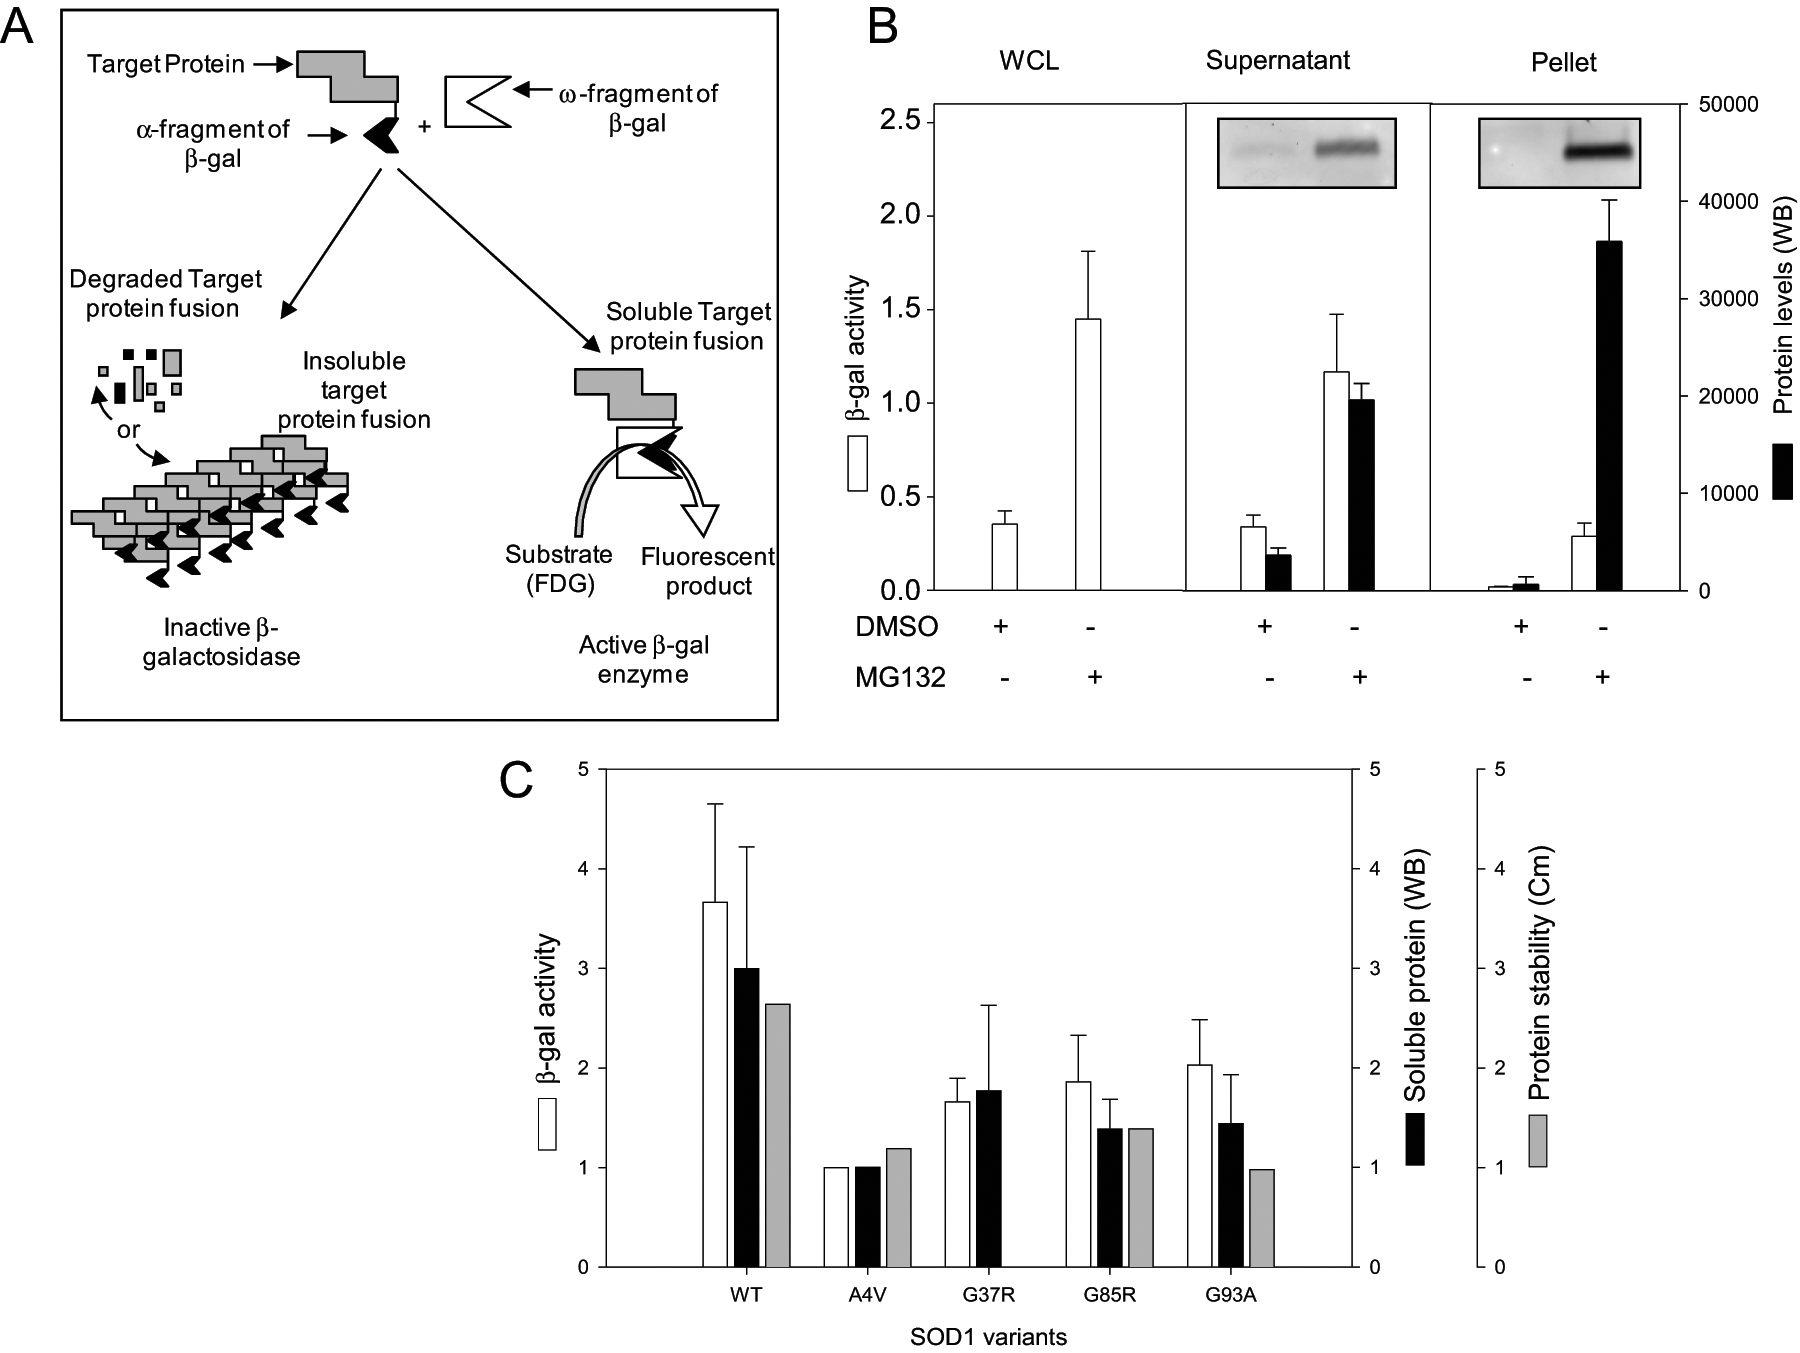
Wigley et al. 11 described a β-galactosidase-based structural complementation assay capable of monitoring protein solubility or folding in bacterial cells. The assay was ported into mammalian cells using appropriate vectors with minor optimization. 30 A schematic of the basis of the assay is shown in Figure 1A . Fluorescent signal generated by the complemented enzyme reflects the amount of soluble or folded SOD1 in cells. Any cellular process, including protein folding/misfolding, aggregation, degradation, and so on, that modulates the levels of soluble SOD1 will affect the fluorescent signal. If SOD1 is either aggregated or degraded, the fused α-fragment will be unavailable for the structural complementation, resulting in decreased or undetectable fluorescent signal.
(
To implement the assay in mammalian cells, two expression vectors were employed: one encoding SOD1 fused to the α-fragment of a β-gal and another encoding the ω-fragment. After transfection into HEK 293 cells, fluorogenic substrate was added, and samples were assessed for fluorescent signal and SOD1 protein levels. As SOD1 is an established proteasome substrate, 31 validation of the assay’s ability to report on SOD1 fusion levels was assessed in the presence of proteasome inhibitors. As predicted, when the cells were treated with MG132, a proteasome inhibitor, the fluorescence signal (white bars) increased several fold in the whole-cell lysate (WCL), supernatant, and pellet fractions ( Fig. 1B ), consistent with the fact that SOD1 is a proteasome substrate. The fluorescent signal also closely correlated with the protein levels (black bars) in the supernatant fractions determined by Western blotting. By contrast, the pellet fraction contains a much higher protein level but only a low fluorescent signal, consistent with the expectation that aggregated SOD1-α can only poorly complement the ω-fragment to form active β-gal and generate a fluorescent signal.
Previous studies of SOD1 have shown that many of the mutations associated with familial ALS destabilize the protein 22 and thus predispose them to misfolding, degradation, and aggregate formation. To test the ability of the solubility reporter assay to distinguish between the stability of ALS-associated mutants of SOD1, we expressed the reporter constructs of the wild-type SOD1 and four common disease-causing mutations—A4V, G37R, G85R, and G93A—in HEK 293 cells and assessed both β-gal activity and soluble protein levels. As shown in Figure 1C , the fluorescence signal and soluble SOD1 level were consistent with the reduced stability values of the SOD1 variants previously reported by Lindberg et al. 22 Wild-type SOD1, exhibiting the highest stability, produced the highest fluorescence signal, and the A4V mutant SOD1, having the lowest reported stability, produced the lowest fluorescent signal. Based on these results, it is clear that the folding behavior of the SOD1 variants can be monitored in cells by this method. Therefore, the assay provides a potential means of identifying cellular proteins and small molecules that affect SOD1 solubility and folding.
To identify cellular proteins that modulate SOD1 solubility/folding, we optimized the assay conditions for use in a 96-well microplate for amount of reporter plasmids, library DNA, and transfection reagent. A representative plot of the optimized pilot assay using wild-type SOD1 as a positive control and A4V mutant as a negative control is shown (
To use this assay for cDNA expression screening, a “pool size” appropriate for screening was determined empirically. Applying a hit selection criterion of 3 SD above the control mean to our pilot experiment (
Screening for cellular modulators of mutant SOD1
cDNA expression screening and identification of proteins that modulate SOD1 protein solubility and folding were carried out as follows. A mouse cDNA expression library containing approximately 350,000 clones was constructed, and the clones that increased the SOD1 solubility/folding were enriched using a FACS-based approach. The cDNA from the fraction enriched for positive clones was recovered, purified, and redistributed into 1584 wells in pools of approximately 10 cDNAs each. These secondary pools were screened using the β-gal assay in 96-well plates to identify pools containing genes that enhanced the assay signal. Such pools were selected, diluted, and repooled to create tertiary samples containing four cDNA clones. Tertiary pools were screened using the β-gal assay, and the pools that displayed enhanced assay signal were diluted to single cDNA clones. After another round of β-gal assays on the individual clones, positive clones were selected and sequenced. Thus, a set of putative cellular modulators of SOD1 was identified. A detailed description of the process is shown in Figure 2 and discussed below.
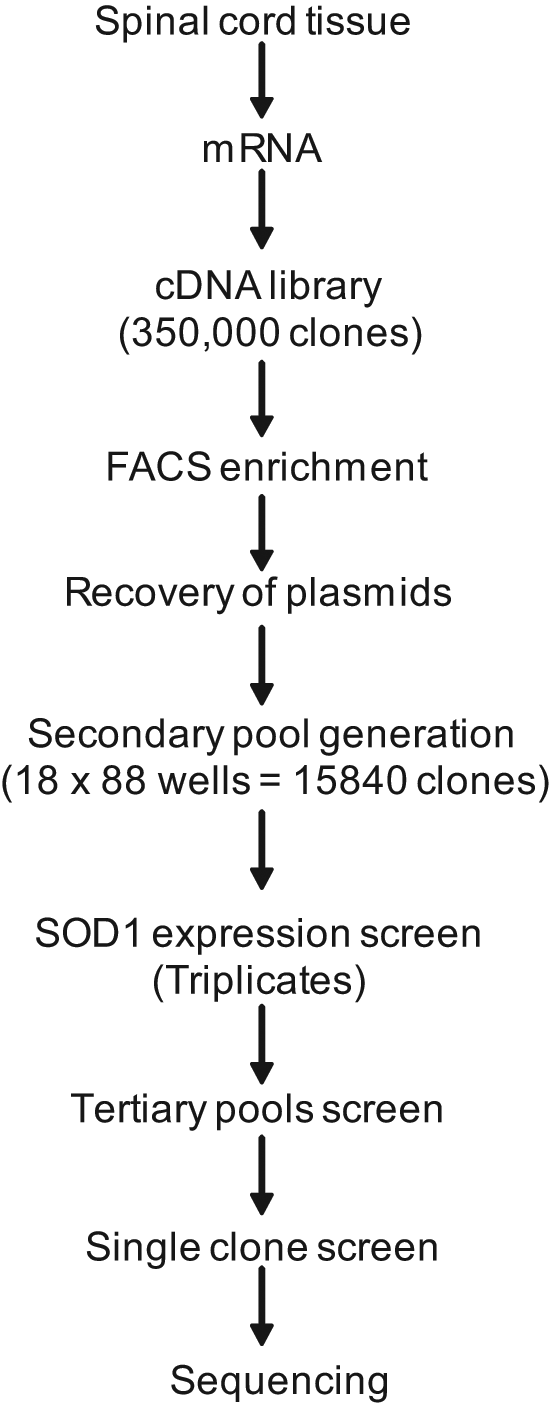
Flowchart of the cDNA expression screening and isolation of clones: The flowchart describes the steps involved in the expression screen for cellular modulators of mutant SOD1 solubility. FACS, fluorescence-activated cell sorting.
cDNA expression library construction and evaluation
ALS is a disease that mainly affects the brainstem and the spinal cord, and thus the spinal cord tissue of a healthy mouse was chosen as the source of mRNA for production of the cDNA library. The mouse cDNA library was constructed as described in Materials and Methods, and an aliquot of the cDNA library transformation reaction was diluted and plated on LB-agar plates to evaluate the library size. The library size was estimated to be approximately 350,000 clones. Based on an estimate of 20,000 to 30,000 genes in the mouse genome,
32
the library size was ~12-fold higher. The cDNA library was evaluated for diversity by digesting random clones of the cDNA library plasmids with restriction endonucleases and running on an agarose gel. The cDNAs (
Library enrichment and pool generation
Cells expressing cDNA clones from the library that improve SOD1 solubility as measured by increased fluorescent signal can be binned using FACS. This enrichment process drastically reduced the number of clones to be screened using the high-throughput microplates, thereby saving cost and time without compromising clone quality. Preliminary feasibility studies to evaluate FACS-based enrichment of the cDNA clones were carried out. The results, shown in
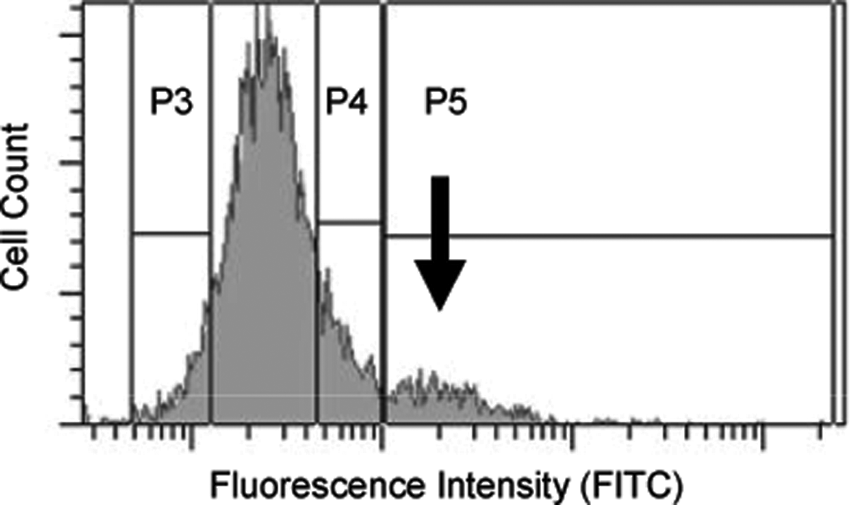
Enrichment of the cDNA library by fluorescence-activated cell sorting (FACS): HEK 293 cells transfected with A4V SOD1 reporter system and the mouse spinal cord cDNA library were harvested after 48 h, and cells were sorted by FACS as mentioned in Materials and Methods. The fluorescence signal observed in the FITC channel is plotted against cell counts. P3, P4, and P5 represent different gates. The small subpopulation of cells in the P5 gate represented by the black arrow is the enriched population, which was collected and used for cDNA recovery and pool generation.
Under the assumption that 5% of the 30,000 mouse genes (i.e., 1500 genes) affect the SOD1 levels and that 10-fold redundancy reasonably ensures a specific clone will be represented, a collection of 15,000 clones would need to be assessed. Because it was deemed unlikely that as many as 5% of the genes would have an impact on SOD1, the use of 15,000 clones should be more than adequate to identify most positive clones. The enriched cDNA library consisting of ~15,000 clones was dispersed across 1584 pools to each containing approximately 10 cDNA clones. The quality of the inserts and the number of clones per random pool were verified by digestion with restriction endonucleases (data not shown). Individual pools tested contained between 4 and 20 independent cDNAs ranging from 0.5 to 4 kb in size. These pools were used for the next step of cDNA expression screening.
Expression screening of the enriched pools
To identify specific cDNA library pools that improved solubility and folding of mutant SOD1, we performed the β-gal assay on the 1584 enriched secondary pools in triplicate. The enriched secondary pools or control plasmids were co-transfected with reporter constructs into HEK 293 cells. After 48 h, lysis buffer containing substrate was added to the wells and fluorescence determined. In Figure 4A , a representative heat map of one of the 18 plates in the screen is shown. On this plate, five pools (C6, F3, A9, B10, and E12) contain cDNAs that increased the amount of soluble/folded mutant SOD1 compared to controls (Column 1). The Z scores of all the pools ranged from +8 to −3.6 and are shown in the Figure 4B . MAD scores calculated for the pools ranged from +25 to −6 (data not shown) and were in agreement with Z scores. Pools having a Z score value greater than 2.2 (cutoff) were selected as “hits” for further investigation. The cutoff value was selected to produce a reasonable number of pools for downstream processing. A schematic representation of the steps involved in the screening is shown in Figure 2 .
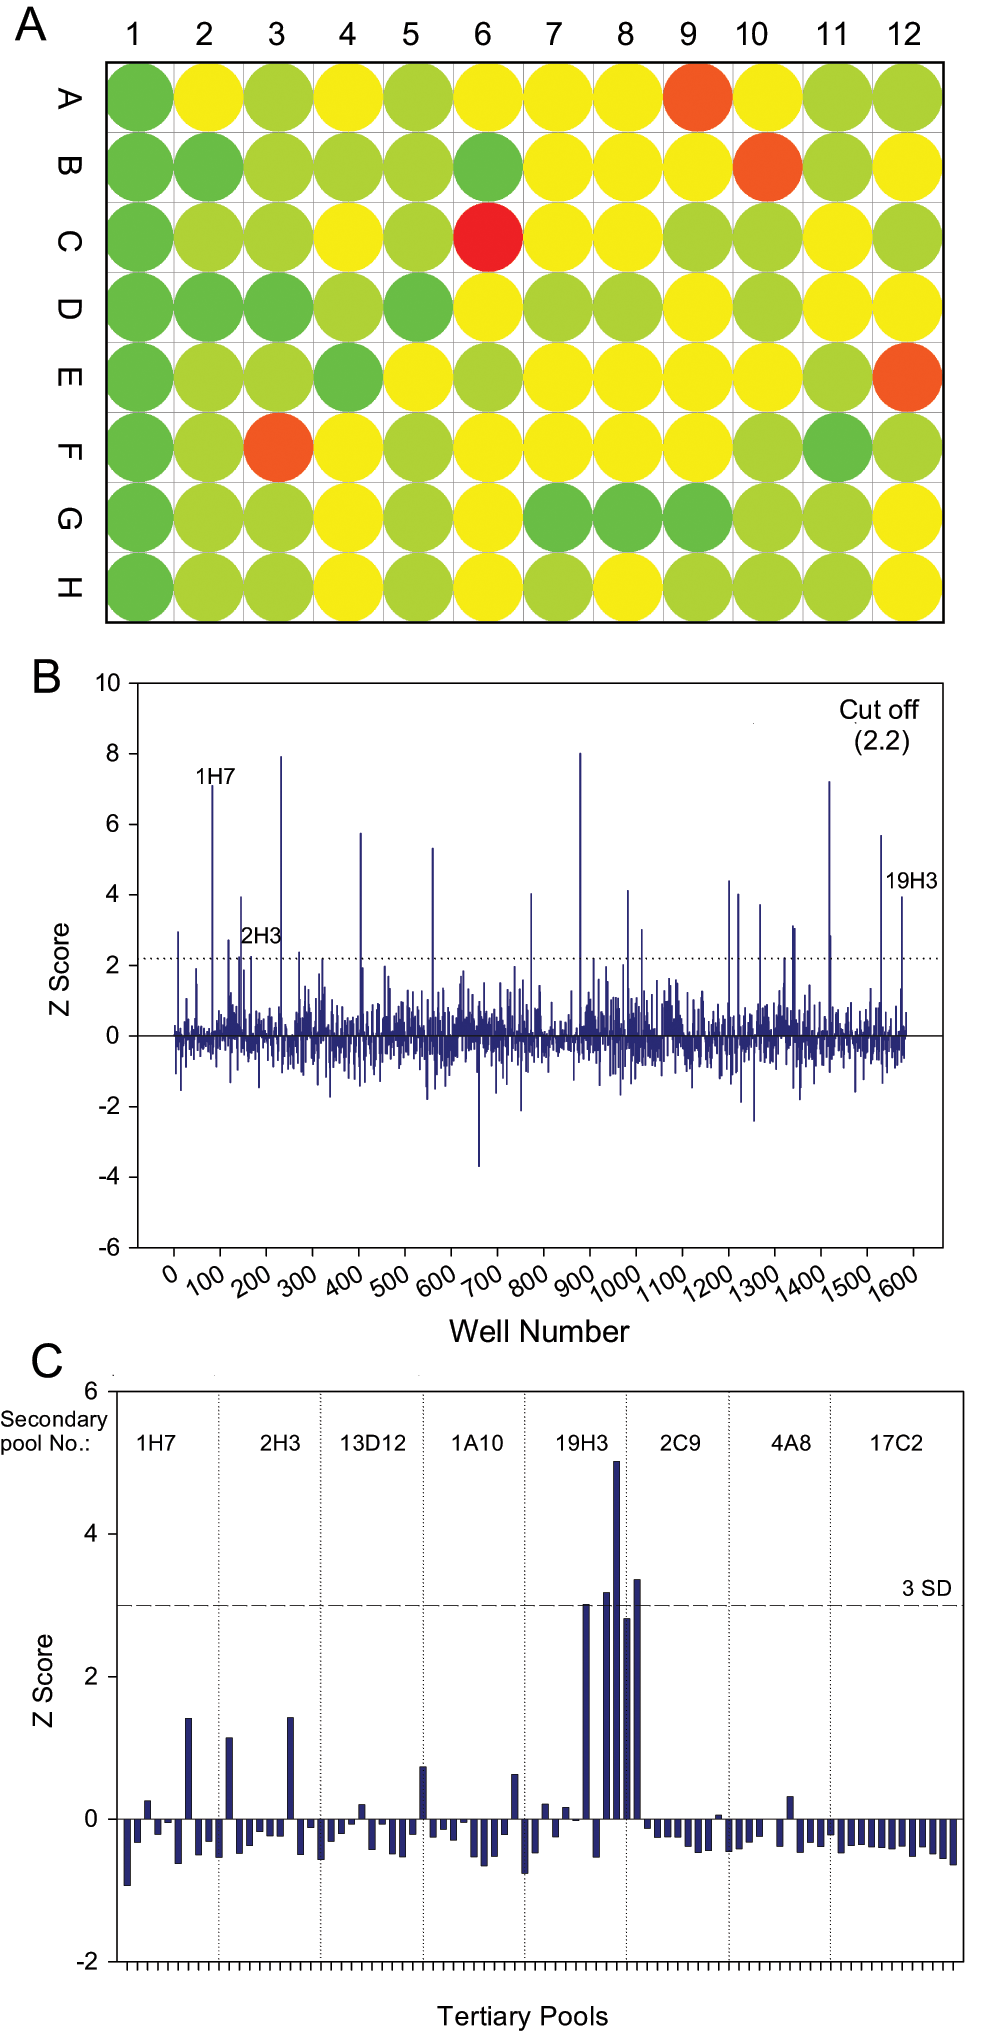
Screening for cellular modulators of A4V SOD1: The enriched pools (1584) or controls were transfected with A4V SOD1 reporter system in 96-well plates. The fluorescence signal was measured 48 h after transfection after the addition of the substrate. (
Tertiary screening and identification of putative SOD1 modulators
The selected hit pools above the cutoff were diluted and subpooled into tertiary pools containing approximately four cDNA clones each, and these pools were assayed. The results from a screen of tertiary pools derived from eight selected secondary pools are shown in Figure 4C . Three pools exhibited fluorescence signal equal to or higher than the cutoff criteria of 3 SD. These selected tertiary pools were further subdivided into single clones and assayed. Finally, the isolated clones that showed increased fluorescence signal over control were picked for sequencing and validation.
The sequences were analyzed using BLAST, 33 and the identity of 15 hit clones was determined. The proteins identified were diverse and performed functions in signaling, cytoskeleton, proteasomal degradation, transcription, and other pathways. Among these, molecules involved in signaling predominated. Many of the proteins identified were complete coding sequences, but some were N or C terminal truncations of their closest matches. One of the genes, “agpat3,” was in an opposite orientation, suggesting that it was a false positive as it could not code for the functional 1-acylglycerol-3-phosphate O-acyltransferase 3 enzyme.
Biochemical validation of putative modulators
Identified putative solubility/folding modulators were assessed biochemically to confirm their effect on SOD1 solubility and folding. HEK 293 cells were co-transfected with vectors driving expression of cellular modulators and A4V SOD1 reporter and incubated for 48 h. Cells lysates were analyzed by the β-gal solubility assay, and the supernatant fractions were analyzed by Western blot analysis for changes in the SOD1 protein levels. The effect of coexpression of the cellular modulators is shown in Figure 5 . It is evident that several of the 15 cellular modulators tested increase the fluorescence signal with a correspondingly matched increase in the soluble SOD1 levels as compared to the A4V SOD1 control. RhoB, RasGRF1, NtrkB, and GPCR61 overexpression resulted in the highest impact on the soluble SOD1 levels, indicating potentially important points in the regulation of SOD1. Based on these biochemical experiments, 10 of the 15 tested genes were validated, supporting the robust nature of the assay and approach.
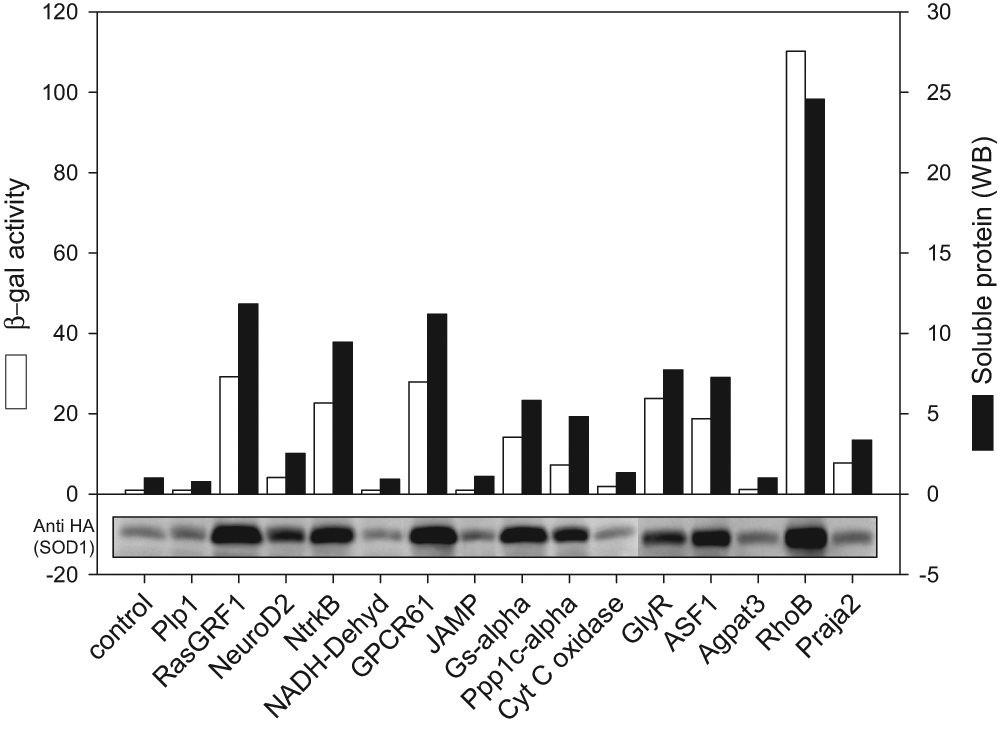
Effect of cellular modulators on soluble A4V SOD1 levels: HEK 293 cells transfected with the A4V SOD1 reporter and with or without cellular modulators were grown for 48 h prior to harvest. Cell lysates were assessed for fluorescence, and SOD1 levels in the supernatant were determined by Western blotting with an anti-HA antibody. In the figure, the relative fluorescence signal (white bars) and soluble protein levels (black bars) are shown for the A4V SOD1 control and with coexpression of cloned cellular modulators. A representative anti-HA blot of the supernatant fraction is shown below the graph.
Promoter and cell-type dependence of cellular modulators
Cellular modulators that act directly on the SOD1 protein would be expected to act independently of the promoter and in multiple cell types. To establish whether this is the case for the identified cellular modulators of soluble SOD1, we tested their effect against a SOD1 construct driven by a minimal endogenous SOD1 promoter. Because the expression of the endogenous promoter-driven SOD1 reporter was very low in HEK293 cells, we conducted the experiment in HeLa cells, which showed better expression of SOD1 driven by this promoter. The cellular modulators were coexpressed with SOD1 promoter-driven reporters and were assayed as described earlier, and the results are shown in Figure 6 . Six of the 10 modulators tested ( Table 1 ) increased the levels of soluble SOD1 above the control in HeLa cells under the SOD1 promoter, suggesting that these modulators act independent of promoter and cell type. The other four either required the CMV promoter for their effect or were functional in HEK 293 cells but not in HeLa cells. One of the modulators that increased SOD1 driven by CMV in HEK 293 cells reduced SOD1 levels driven by the minimal human SOD1 promoter in HeLa cells. The top effectors that increased SOD1 in both systems were RasGRF1, GPCR61, and ASF1, highlighting their potential importance as elements in the regulation of SOD1 regardless of cell type or promoter. It is interesting to note the variability in the responses of SOD1 to certain cellular modulators in HEK 293 or HeLa cells; these results likely reflect the complexity and context dependence of cellular systems. From the above results, we have demonstrated that cellular proteins that regulate SOD1 solubility in cells can be identified using solubility assay-based screening. Further experiments are warranted to elucidate the mechanism of action of these cellular modulators in relevant cell culture or animal models of disease.
Cellular Modulators of Superoxide Dismutase 1
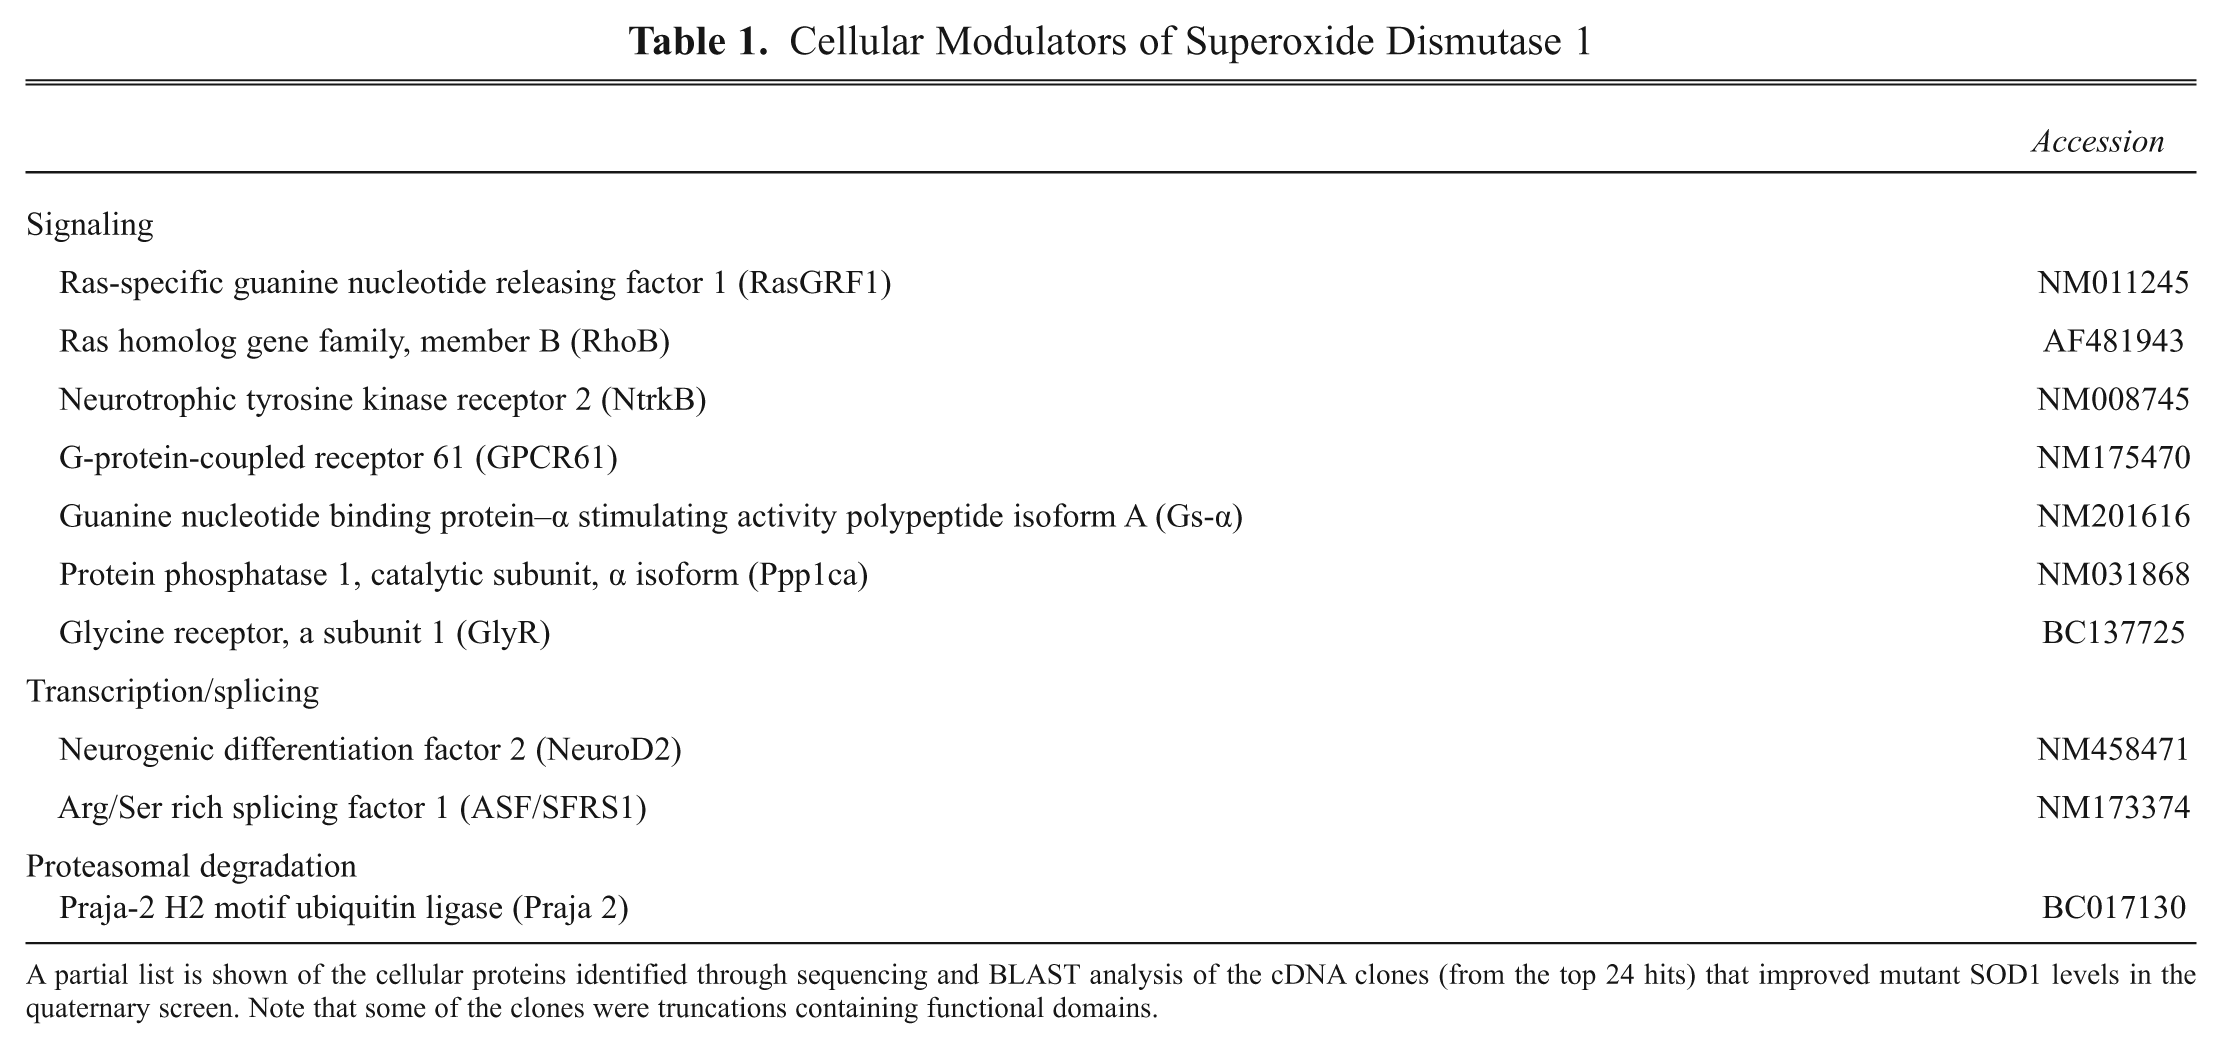
A partial list is shown of the cellular proteins identified through sequencing and BLAST analysis of the cDNA clones (from the top 24 hits) that improved mutant SOD1 levels in the quaternary screen. Note that some of the clones were truncations containing functional domains.
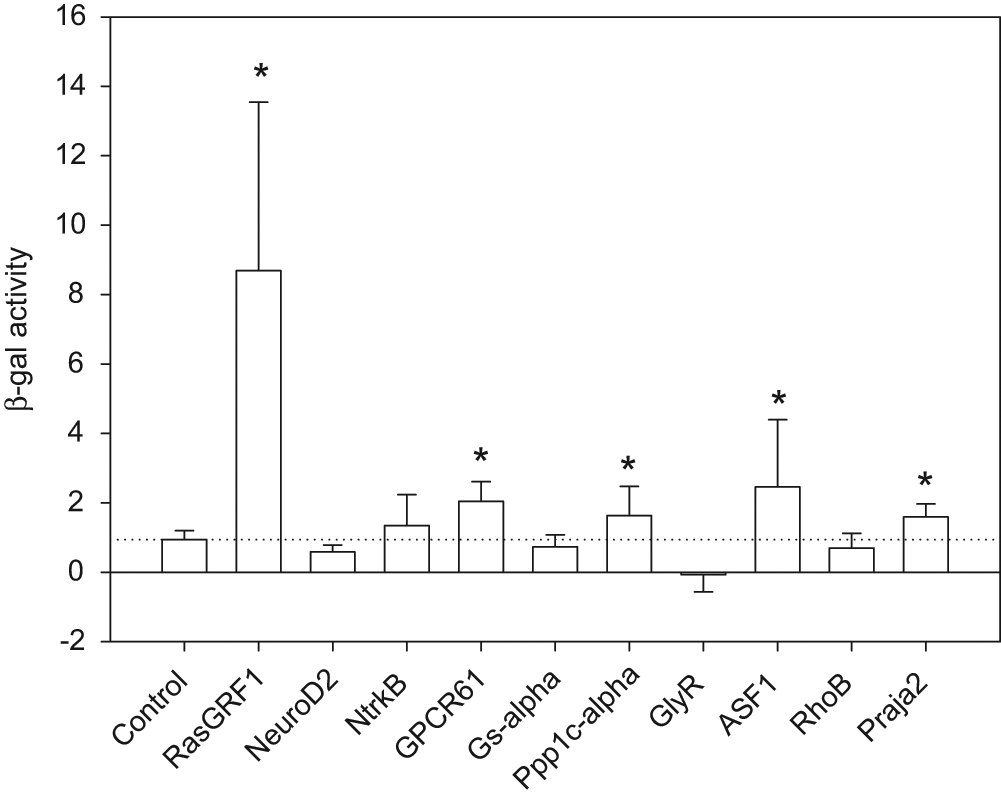
Effect of cellular modulators on mutant SOD1 driven by the SOD1 promoter: HeLa cells co-transfected with the SOD1 promoter–A4V reporter system and cellular modulators were grown for 48 h. Cells were lysed, and the lysate was used for the β-gal assay. In the figure, the relative fold of fluorescence (β-gal activity) is plotted against each modulator. The dotted horizontal line denotes the mean of the control. The results are averages of three to seven independent experiments with SD represented by the error bars. *p < 0.05.
Discussion
Protein misfolding is an important hallmark of many neurodegenerative diseases, but there is a dearth of knowledge about how misfolding leads to pathology. By combining a solubility/folding assay with a genetic approach, we have attempted to address these questions. As a model, SOD1, a protein associated with ALS, has been used. However, due to the fundamental nature of the approach, it is amenable to other targets and diseases as well. Unpublished results from our lab and earlier reports on β-galactosidase demonstrate that the structural complementation system is robust and tunable, 30 which is particularly important for it to be useful in studying multiple disorders.
The results comparing the β-gal assay signal and soluble SOD1 protein levels demonstrate that the fluorescent signal reflects the levels of soluble, folded SOD1 ( Fig. 1B ). The minimal fluorescence signal observed in the pellet fractions, even with high levels of aggregated SOD1, further supports this conclusion. The low fluorescent signal observed in the pellet fractions could result from inefficient structural complementation of the SOD1 fusions present in the periphery of the aggregates and/or the presence of trace amounts of supernatant contaminating the pellet fractions. The A4VSOD1 reporter expression was in the same order of magnitude as endogenous SOD1. The relative change in the SOD1 levels between disease-causing mutations when evaluated by the β-gal assay correlates well with the protein stability estimates of the respective untagged proteins ( Fig. 1C ).
The relevance of the assay to the disease is evident in the assessment of β-gal activity of the SOD1 variants associated with familial ALS (
Fig. 1C
). The results demonstrate a correlation between assay signal, soluble protein levels, and stability
22
and highlight the assay’s ability to measure a critical parameter that predisposes SOD1 to misfolding and disease. Prior work
22
has drawn a correlation between protein stability (Cm values) and the mean survival time of ALS patients post the onset of first symptoms. Caution must be exercised when making such connections between assay signal, mutant stability, and disease severity because of the small size of the data sets used in the prior study.
22
Assay optimization in a 96-well format (
Evidence of the versatility of the assay comes from its ease and adaptability to FACS (
Fig. 3
and
The clones identified by the screen are diverse, with functional relevance to signaling, cytoskeleton, proteasomal degradation, transcription, and so on. These results are consistent with other findings from microarray studies.17–19 The identification of many signaling molecules is not surprising considering that small changes in the levels of an upstream signaling molecule in a pathway can elicit large changes in levels of their targets downstream. This property also makes these proteins attractive drug targets. The role of proteasomal degradation in SOD1 regulation was expected as the blockage of the proteasome by MG132 enhanced the SOD1 levels several fold ( Fig. 1B ). Validation of the modulators by biochemical assays ( Fig. 5 ) established the role of modulators in regulating soluble levels of SOD1. As previously noted, a few of the putative modulators (Plp1, JAMP, Cyt C oxidase, and Agpat3) had more modest effects on the SOD1 levels in biochemical experiments, suggesting either false positives selected during the assay procedure or that some of the modulators exhibited their action in synergy with other genes in the same pool.
One of the common caveats of screening methods is the possibility of finding nonspecific promoter-based effects. This was addressed by carrying out secondary assays using a minimal endogenous SOD1 promoter 27 ( Fig. 6 ). A similar-sized promoter has been used in an earlier study that screened for chemical compounds that decreased transcription. 16 Due to low expression of the SOD1 reporter in HEK 293 cells, the experiments were carried out in HeLa cells ( Fig. 6 ). Although it is possible that changing the cell line may alter the outcome of certain targets due to cell type–specific differences, a consistent response of a target across two types of cell lines and two types of promoters would signify common, exploitable pathways. The results show that some of the identified proteins consistently improve the SOD1 solubility, whereas some do not. It is possible that the modulators that were not active in the secondary assays were either acting on the CMV promoter and are thus of less interest or are cell type specific. Three of the six proteins identified that improve levels of soluble SOD1 in both versions of the assay have been associated with ALS.35–38 For example, RasGRF1, a Ras guanine nucleotide exchange factor, interacts with microtubules, 35 which are modified in ALS patients. 36 A RasGRF1-related protein with similar domain architecture, p190RhoGEF, has been implicated in the aggregation of the neurofilament protein NF-L and promotion of aggregate formation in ALS. 37 In addition, Alsin2, a protein associated with juvenile ALS, is also a Ras guanine nucleotide exchange factor. 38 ASF1 is an arginine/serine-specific splicing factor, similar in function 39 to TDP43, a protein found in the ubiquinated proteinaceous inclusions in ALS.40,41 Praja 2, an E3-ubiquitin ligase identified from our screen, is similar to the praja-1 found to be increased in the presence of G93A mutant SOD1 in an expression profiling study. 19 Two of proteins identified from the screen, RasGRF1 and NtrkB, are involved in the same signaling pathways, suggesting a potential role of this pathway in SOD1 regulation. Furthermore, RasGRF1 is involved in the nucleotide exchange and activation of Ras, a key protein in the MAP kinase pathway that is a validated drug target.42,43 Further work is under way to investigate which component, if any, of the RasGRF1–SOD1 pathway could be a target for future therapies. On the basis of these results, a simple model for the mechanism of action of these cellular modulators (see Fig. 7 ) can be proposed. Some may act by direct interaction with and stabilization of SOD1, whereas others might participate indirectly by affecting upstream or downstream signaling pathways, synthesis (transcription, translation), or protein degradation (proteasome). Mechanistic details of the cellular modulators’ mode of action and their relevance to disease require further investigation.
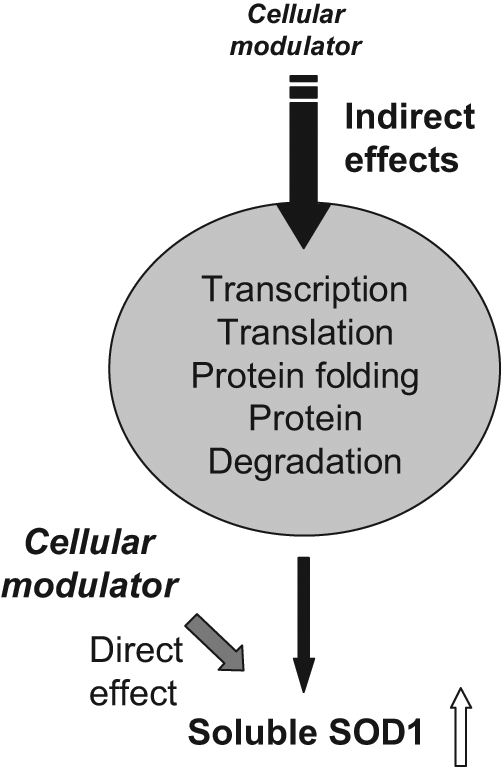
Model for cellular modulator action on SOD1: Cellular modulators could improve the SOD1 levels by either direct effects on SOD1 or indirect effects via central pathways such as protein folding, degradation, transcription, and translation.
Footnotes
Acknowledgements
We thank Dr. David Russell, Dr. Stefan Andersson, and Daphne Head for initial discussions regarding cDNA library construction and screening. The research work was funded through grants from the ALS Association and a Sponsored Research Agreement from Reata Pharmaceuticals.
W.C.W. and G.A.M. are employees of Reata Pharmaceuticals. P.J.T. is a founding scientist at Reata Pharmaceuticals.
References
Supplementary Material
Please find the following supplemental material available below.
For Open Access articles published under a Creative Commons License, all supplemental material carries the same license as the article it is associated with.
For non-Open Access articles published, all supplemental material carries a non-exclusive license, and permission requests for re-use of supplemental material or any part of supplemental material shall be sent directly to the copyright owner as specified in the copyright notice associated with the article.