
Abstract
Familial amyotrophic lateral sclerosis (fALS) accounts for 10% of ALS cases, and about 25% of fALS cases are due to mutations in superoxide dismutase 1 (SOD1). Mutant SOD1-mediated ALS is caused by a gain of toxic function of the mutant protein, and the SOD1 level in nonneuronal neighbors, including astrocytes, determines the progression of ALS (non-cell-autonomous toxicity). Therefore, the authors hypothesized that small molecules that reduce SOD1 protein levels in astrocytes might slow the progression of mutant SOD1-mediated ALS. They developed and optimized a cell-based, high-throughput assay to identify low molecular weight compounds that decrease SOD1 expression transcriptionally in human astrocyte-derived cells. Screening of a chemical library of 9600 compounds with the assay identified two hit compounds that selectively and partially downregulate SOD1 expression in a dose-dependent manner, without any detectable cellular toxicity. Western blot analysis showed that one hit compound significantly decreased the level of endogenous SOD1 protein in H4 cells, with no reduction in expression of β-actin. The assay developed here provides a powerful strategy for discovering novel lead molecules for treating familial SOD1-mediated ALS.
Keywords
Introduction
A
Some evidence suggests that mutant SOD1 protein has neurotoxic properties and leads to ALS via a gain of toxic function. Mice carrying a high copy number of the mutant SOD1 gene suffer more severe muscle weakness and death than mice carrying a low copy number. 2 SOD1 knockout mice do not develop the motor neuron disease phenotype at all. 3 In rats, only strains with the highest level of mutant SOD1 expression develop an ALS phenotype. 4
Previous studies reported that the SOD1 level in neurons and in nonneuronal neighbors, including astrocytes and microglia, determines the onset and progression of motor neuron disease.5,6 Therefore, we hypothesized that reduction of SOD1 expression in astrocytes might ameliorate mutant SOD1-mediated ALS. This hypothesis is supported by prolonged survival of ALS model mice, following application of RNA interference or antisense oligonucleotide, which reduced SOD1 protein levels.7,8 Furthermore, inactivation of a mutant allele reversed the phenotypes in other neurodegenerative disease models, such as Huntington disease and Alzheimer disease, even after onset.9,10 The present study developed and optimized a high-throughput screening (HTS) system to identify compounds that downregulate the transcription of SOD1.
Materials and Methods
Generation of a SOD1 promotor-luciferase reporter cell line
We used the SOD1 genomic promoter, including 5′ and 3′ untranslated regions (UTR), in our construct to generate SOD1 transgenic mice. The cassette was identical to that carried by SOD1G93A transgenic mice (gPrSOD1-Luc), to reflect physiological activity of the SOD1 promoter ( Fig. 1A ). A total of 1.2 Kb of human SOD1 (hSOD1) 5′-fragment, with 5′-EcoR1 and 3′-Afe1-BamH1 sites, was amplified using PfuUltra 2 Fusion HS DNA Polymerase (Stratagene, Cedar Creek, TX). The following PCR primers were used to amplify the region: forward primer, 5′-AAAGAATTCTGCCAACCAAATAAG-3′; reverse primer, 5′-TTTGGATCCAGCGCTGAAGCCGGAAAGCGGAG-3′. The fragment was cloned into pKF18k-2 plasmid (Takara, Otsu, Japan). To add the Cla1 site and delete the start codon of SOD1 exon 1, the cassette was amplified by PfuUltra 2 Fusion HS DNA Polymerase using the following PCR primers: forward primer, 5′-GTTATCGATGCGACGAAGGCCGTGT-3′; reverse primer, 5′-TCGCTAGGCCACGCCGAGG-3′. The fragment was cut with EcoR1 and Afe1 and cloned into pKF18k-2-hSOD1G93A. The SV40-Neo-Poly(A) was incorporated downstream from the SOD1 gene, between the BamH1 and Sa11 sites. Finally, secreted luciferase gene (MetLuc) from the marine copepod, Metridia longa (Clontech, Mountain View, CA), with ATG was added at the Cla1 site.
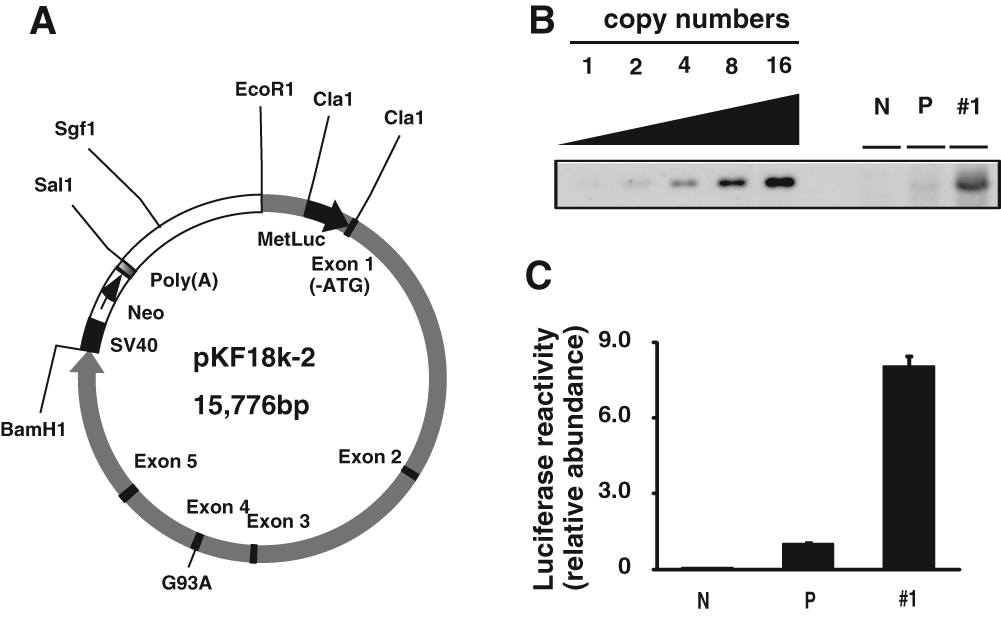
The stable gPrSOD1-Luc cell line used for the high-throughput screening (HTS) assay of compounds that downregulate SOD1 transcription. (
Human astrocytoma-derived H4 cells, 11 which are frequently used for research on neurodegenerative diseases, 12 were used for transfection to mimic the transcription of SOD1 in astrocytes. The cell lines were cultured at 37 °C in Dulbecco’s modified Eagle’s medium (DMEM; Sigma, St. Louis, MO), containing 10% (v/v) fetal bovine serum (FBS), 50 U mL−1 penicillin, 50 µg mL−1 streptomycin, and 200 µg mL−1 G418 (Nacalai, Kyoto, Japan). The cells were stably transfected with the SOD1 genomic construct cut by Sgf1, using FuGENE 6 Transfection Reagent (Roche, Basel, Switzerland). Clonal cell lines were selected based on high levels of secreted luciferase genes, and reactivity was confirmed by Southern blotting and luciferase reporter assay ( Fig. 1B , C ). For the Southern blotting, 15 µg DNA, cut at EcoR1 and BamH1, was loaded, and the probe was made from the following primers: forward primer, 5′-ATCTGGGAGACCATGGAAGT-3′; reverse primer, 5′-TTCTTTGAAGCCGCTGATCTC-3′.
The compound library
High-throughput screening (HTS) assays using the gPrSOD1-luciferase cell line were performed to screen a library of 9600 compounds provided by the Institute for Chemical Research, Kyoto University. The library was delivered in 96-well racks, with each compound dissolved in DMSO at 5 mM. The extreme right and left wells contained DMSO without any compound, leaving the corresponding well on assay plates available for controls. All compounds were stored at −20 °C.
HTS assay
Luciferase expression by the gPrSOD1-luciferase cells after exposure to various small compounds was assayed in white, flat-bottomed, 96-well plates (Costar, Bethesda, MD). The cells were precultured overnight at 3.0 × 10⁴ cells well−1 and 37 °C. The compound to be tested was preplated, diluted with culture medium to 50 µM, and used to replace 80 µL of 100 µL per well of cell culture to give a final concentration of 40 µM. The cells were then cultured for another 16 h at 37 °C.
SOD1 gene expression by cells exposed to each compound was determined by measuring activity of luciferase proteins secreted by the cells. The cell culture in each well was transferred to the corresponding well on a 96-well assay plate, using a Multifunction Tabletop Dispenser EDR-384S2 (Biotec, Tokyo, Japan). Ready-To-Glow Secreted Luciferase Reporter System (Clontech) was added, and luciferase activity was measured as emission at 450 nm, using a 1420 VICTOR 3 Multilabel Plate Reader with optional dispenser (PerkinElmer Life and Analytical Sciences, Waltham, MA). The ratios of the vehicle-treated samples were used to correct for spontaneous decay of the signal.
Assay performance was determined by calculating the Z factor (Z′), using the following equation:
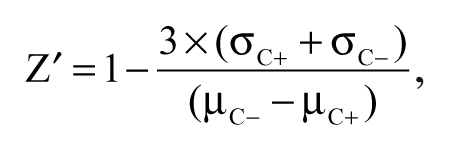
where µC+ and σC+ are the mean and standard deviation (SD), respectively, of the positive control; µC– and σC– are the mean and SD of the negative control. The positive control assays treated cells with 10 µg mL−1 mitomycin-C (Wako, Osaka, Japan). 13 The negative control assays treated cells with vehicle (DMSO). The Z′ value indicates the quality of an assay by describing the magnitude of the signal window (µC – µC+) and the precision of the assay (σC+ + σC–). A compound was selected as a hit when it decreased luciferase activity less than mean minus 3 SD of negative controls. In each run, four or five library plates were applied to the screening assay with an individual control plate for calculating Z′ value as well as an average and SD of luciferase activity for negative control. Hits were not selected from runs with a Z′ value less than zero. The effect of hit compounds on the SOD1 expression was confirmed when it also decreased luciferase activity less than mean minus 3 SD of negative controls in duplicate by another assay.
Dose response and cytotoxicity
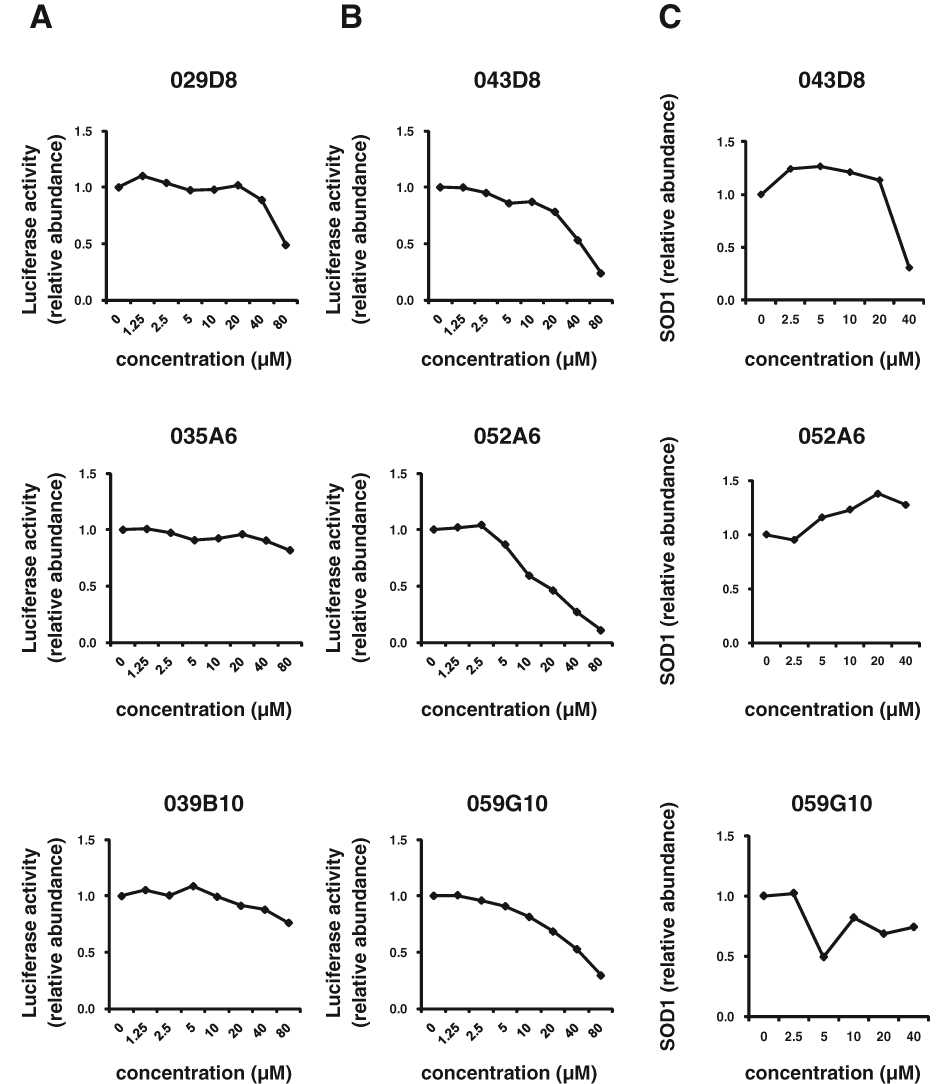
Dose–response analysis was carried out using the gPrSOD1-luciferase cell line to confirm that the hit compounds reduced SOD1 expression in a dose-dependent manner. As in the primary assays, the cells were precultured overnight, and then the media were exchanged to give a 0- to 80-µM range of compound concentrations. The cells were incubated for another 16 h, and luciferase activity was measured. Only compounds that resulted in greater than −3 SD inhibition of SOD1 expression at 40 µM were included in further analyses because the concentration was also adapted for HTS assay selection.
Toxicity assays identified compounds that produced a nonspecific decrease in luciferase activity due to cellular toxicity. Toxicity analysis was performed on untransfected H4 cells, using the tetrazolium salt, WST-1 (Roche). In this assay, cleavage of WST-1 to formazan by mitochondrial dehydrogenases causes a color change from red to yellow. As in the primary assays, untransfected H4 cells were precultured overnight in a 96-well plate, and then the media were exchanged to give a 0- to 40-µM range of compound concentrations. The cells were incubated for 16 h, then WST-1 was added at 10 µL well−1, and the cells were incubated for 1 h at 37 °C. Absorbance at 450 nm was compared to that of cells that were not treated with the compound. Compounds were considered to have significant cellular toxicity if cells treated with 40 µM showed greater than a −2 SD decrease in fluorescence compared to untreated cells.
Secondary assay
Enzyme-linked immunosorbent assays (ELISAs) and Western blots were used to determine whether effects observed in the reporter cell line could be reproduced at the level of endogenous SOD1 protein. As in the primary assays, untransfected H4 cells were precultured overnight, and the media were exchanged with hit compounds to give final concentrations of 0 to 40 µM. The cells were cultured for 48 h, and then each well was washed once with 200 µL of phosphate-buffered saline (PBS) and lysed with 100 µL of 1% Triton-X containing protease inhibitors (Roche).
ELISAs were performed to quantify differences in SOD1 protein levels, and EC50 values were calculated using a two-antibody sandwich ELISA for human SOD1. Polystyrene, enzyme-linked, immunosorbent, 96-well assay plates (Greiner Bio-one, Frickenhausen, Germany) were coated with 0.02 µg 0.1 mL−1 well−1 of rabbit anti-SOD1 antibody (1:5000; cat. #SOD100; Stressgen, Ann Arbor, MI) in 50 mM sodium carbonate buffer at pH 9.4. The plates were incubated overnight at 4 °C. The wells were washed with PBS and blocked for 2 h with 3% bovine serum albumin (BSA) in wash buffer (PBS containing 0.05% Tween-20). The blocking solution was discarded; 50 µL of cell lysate diluted 1:100 in 3% BSA in wash buffer was added to each well, along with recombinant SOD1 protein 14 (standard curve); and the plates were incubated overnight at 4 °C. The wells were washed with PBS, 100 µL of mouse anti-SOD1 antibody (1:1000; cat. #S2147; Sigma) was added, and the plates were incubated for 1 h at room temperature (RT). The wells were washed with PBS, and the bound mouse antibody was detected with 100 µL per well of horseradish peroxidase (HRP)−conjugated goat anti-mouse IgG antibody (1:5000; cat. #NA9310V; GE Healthcare, Buckinghamshire, UK). The plate was incubated for 1 h at RT and then reacted for 30 min with OptEIA TMB Substrate Reagent Set (BD Biosciences, San Jose, CA). The reaction was stopped by adding 100 µL of 1 M sodium phosphate. The rate of change in absorbance at 450 nm was measured with a ThermoFischer Scientific Multiskan JX (Thermo Electron Corporation, Waltham, MA). The concentration of SOD1 in the cell lysates was derived from a standard curve with a linear concentration range of 1.0 to 125 ng mL−1.
The cell lysates were subjected to sodium dodecyl sulfate polyacrylamide gel electrophoresis (SDS-PAGE) and transferred to polyvinylidene difluoride membranes. Membranes were blocked in 3% BSA in TBS, probed with anti-SOD1 antibody (1:1000; Stressgen), and then reprobed with an anti-β-actin antibody (1:5000; cat. #A1978; Sigma) as an internal control.
Western blot analysis for phosphorylation of transcription factors
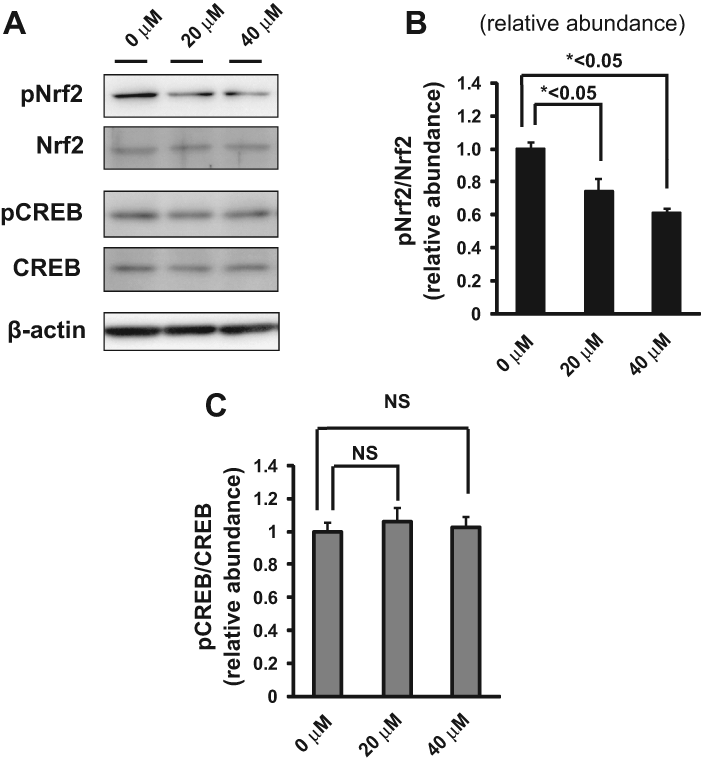
Untransfected H4 cells were precultured overnight on 12-well plates at 5.0 × 10⁴ cells. The hit compound was diluted with culture medium to 25 µM and 50 µM and used to replace 0.8 mL of 1 mL per well of cell culture to give a final concentration of 20 µM and 40 µM, respectively. The cells were then cultured for another 16 h, and then each well was washed once with 2 mL PBS and lysed with 100 µL of 1% Triton-X containing protease inhibitors (Roche) and phosphatase inhibitor cocktail (Nacalai Tesque, Kyoto, Japan). Western blotting was performed with antibody specific to Ser40-phosphorylated Nrf2 (2500:1; #EP1809Y; Abcam, Cambridge, MA), Nrf2 (500:1; H-300; #sc13032; Santa Cruz Biotechnology, Santa Cruz, CA), Ser133-phosphorylated cAMP response element binding protein (CREB; 500:1; #06-519; Millipore, Billerica, MA), CREB (1000:1; #9197; Cell Signaling, Salem, MA), and β-actin (1:5000; Sigma).
Synthesis of 052C9
6-Chloro-3-formylchromone (0.20 g, 0.96 mmol) and o-phenylene diamine (0.10 g, 0.96 mmol) were dissolved in acetic acid (5 mL). The reaction mixture was stirred at 60 ºC for 16 h and then diluted with an aqueous solution of NaHCO3 (20 mL). The resulting precipitate was filtered and washed with water. The residue was dissolved in trifluoroacetic acid (1 mL) and then concentrated in vacuum. To the residue was added EtOAc (3 mL), and the resulting suspension was filtered to give 052C9 (72 mg, 18%) as a trifluoroacetic acid salt.
Results
HTS assays using the gPrSOD1-Luc cell line
As evidenced by the reduction in luciferase activity (
Fig. 1B
,
C
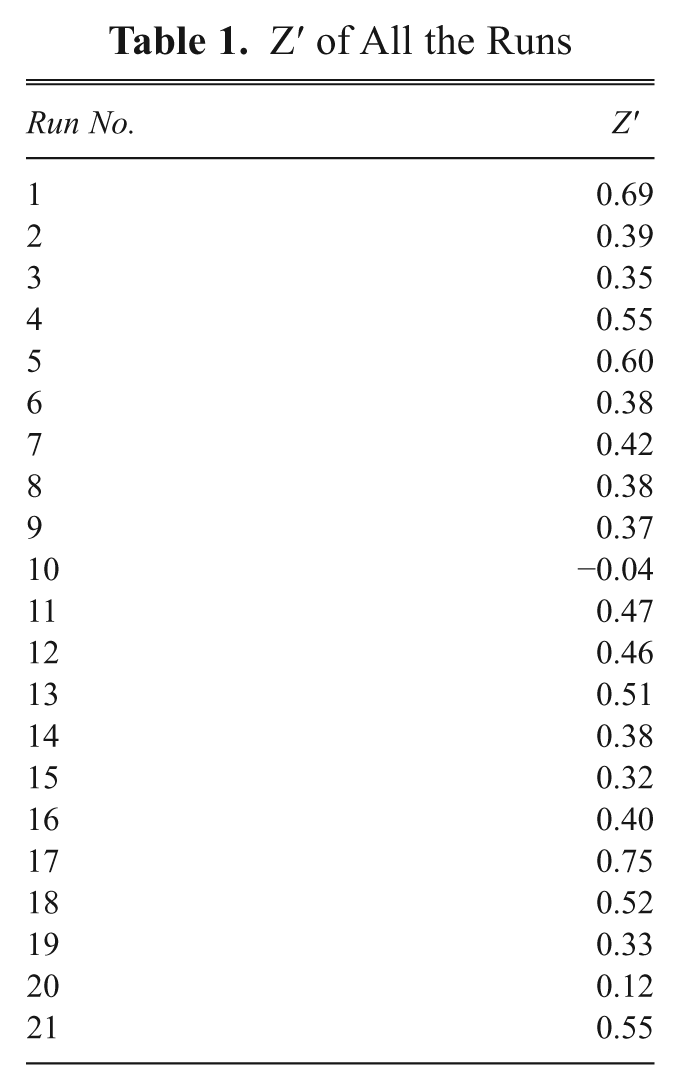
), the stable gPrSOD1-Luc cell line expresses secreted luciferase under the control of a genomic SOD1 promoter and, therefore, is useful for identifying compounds that decrease SOD1 expression transcriptionally. The HTS assays using the gPrSOD1-Luc cell line exhibited good reproducibility, with an average Z′ value of 0.39 (range, −0.23 to 0.75). Only two runs had Z′ values below zero (
Table 1
). We did not select hit compounds from these two runs. The effect of each compound was represented as the degree of inhibition of luciferase activity compared to vehicle-treated cells (
Z′ of All the Runs
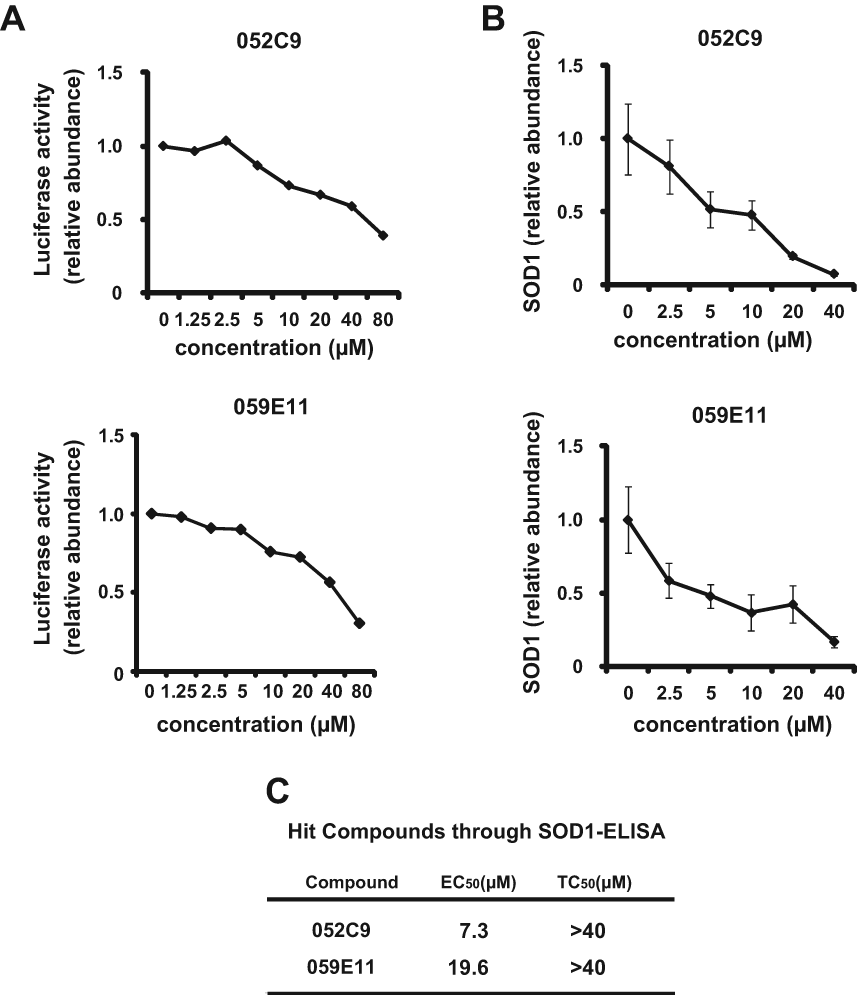
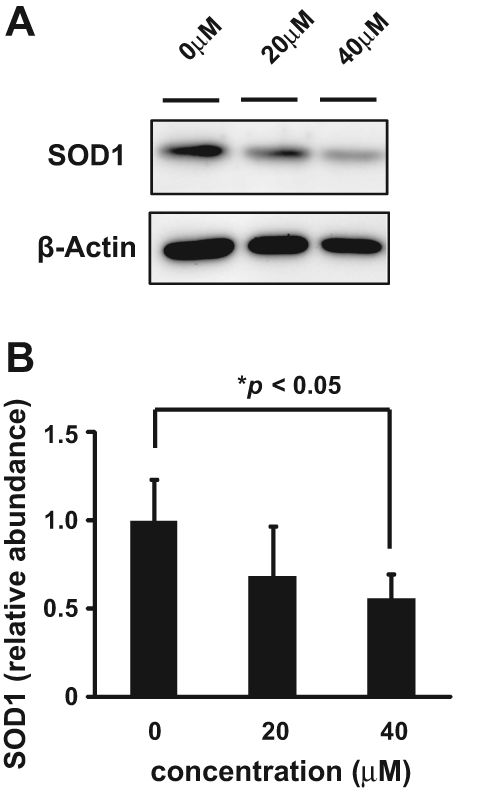
Using the HTS assay, duplicate assay, and dose-dependent testing, we identified 120 hit compounds that significantly inhibited SOD1 transcription ( Table 2 ). We excluded the compounds with poor dose-dependent responses ( Fig. 2A ). WST-1 assays indicated that five of these hit compounds had nonspecific cell toxicity (data not shown). ELISA results showed that 2 of the remaining 115 compounds reduced the level of endogenous SOD1 protein in a dose-dependent manner. We did not employ the compounds with no significant decline of SOD1 protein by ELISA ( Fig. 2B , C ). One of the compounds, 052C9, was selected for Western blot analysis, based on its downregulation of SOD1 expression, determined by the reporter assay ( Fig. 3A ) and by ELISA ( Fig. 3B ) with the lower 50% effective concentration (EC50) compared to the other compound ( Fig. 3C ). The selected compound significantly decreased the level of endogenous SOD1 protein in H4 cells, with no reduction in expression of β-actin ( Fig. 4 ). The structure of this hit compound ( Fig. 5 ) was confirmed by resynthesis and spectroscopic characterization: The molecule is composed of a benzoimidazole ring and a chroman unit and is not analogous to any of the drugs used in ALS treatment trials to date. Two major transcription factors have been reported to activate the expression of SOD1: NF-E2 (Nrf2) and CREB. We examined the effects of 052C9 on the phosphorylation status of these two transcription factors by Western blot analysis. The results showed that 052C9 blocked the phosphorylation of NF-E2 (Nrf2) with no reduction of total Nrf2 protein level, whereas 052C9 had no detectable effects on the phosphorylation status of CREB ( Fig. 6 ).
Hit Compounds Identified Using the High-Throughput Screening Assay
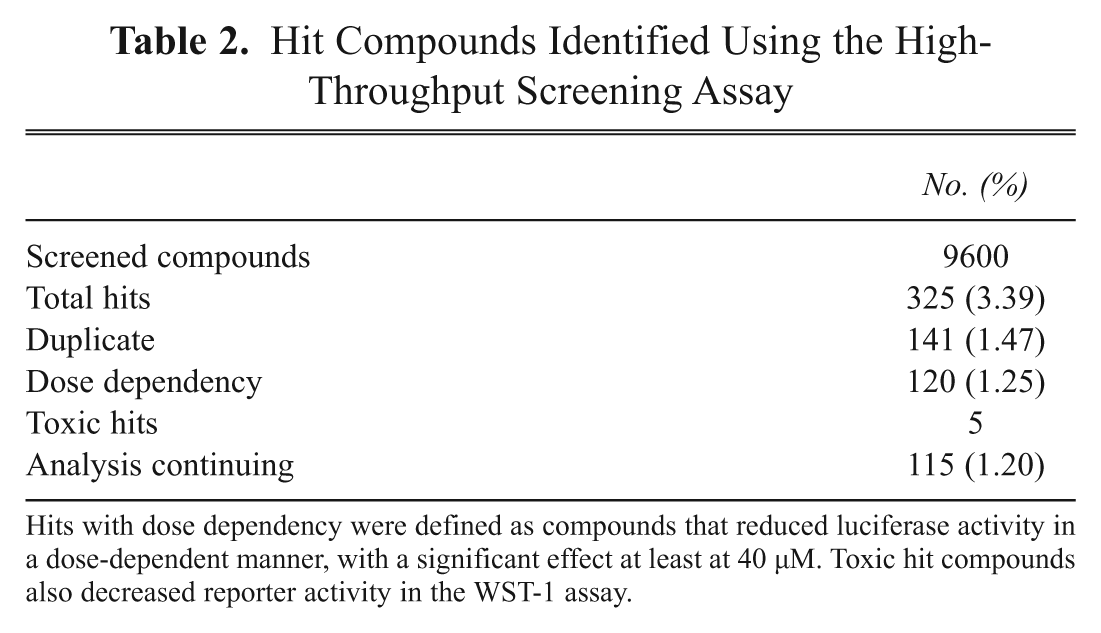
Hits with dose dependency were defined as compounds that reduced luciferase activity in a dose-dependent manner, with a significant effect at least at 40 µM. Toxic hit compounds also decreased reporter activity in the WST-1 assay.
(
(
(
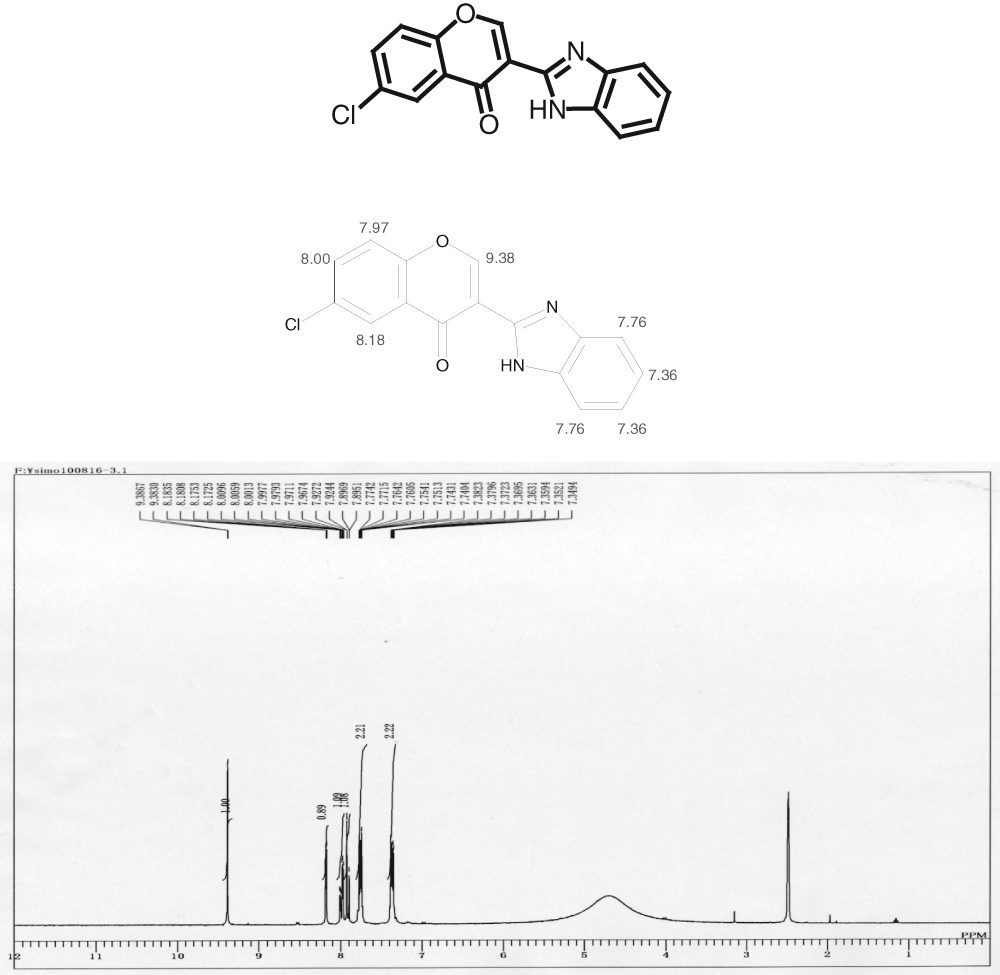
The chemical structure of the selected hit compound.
(
Discussion
In a recent article, Broom et al. 15 developed HTS assays to identify compounds that downregulate SOD1 expression. On the basis of this previous study, we executed the present study targeting the transcription of SOD1 with a different compound library and a modified reporter construct of SOD1 promoter. The HTS system using astrocytoma-derived H4 cells successfully identified a number of hit compounds that decrease the expression of SOD1 protein. The HTS assays exhibited good reproducibility, with an average Z′ value of 0.39 (range, −0.23 to 0.75). This variability might be due to the manual preplating of the cells for screening or the instability of the secreted luciferase. Although the assay results had a high coefficient of variation, this could be attributed to the relatively high abundance of hit compounds (3.39%; Table 2 ). Because this hit percentage may partially reflect Gaussian statistics, we confirmed the significant efficacy of the hit compounds on SOD1 expression through another duplicate assay and dose-dependent analysis. This process would allow us to rule out the effect of Gaussian statistics on the hit selection. Although most of the hit compounds failed to decrease endogenous SOD1 protein level by ELISA in a dose-dependent manner, we suppose that this may be due to direct inhibition of luciferase reaction or to the difference between temporal patterns of the transcription and translation of SOD1. At least one of the hit compounds, 052C9, significantly downregulated SOD1 protein levels in a dose-dependent manner. It is unlikely that the effect reflects nonspecific cellular toxicity because the WST-1 assay showed no significant effects at the concentrations at which the compound exerted the downregulation of SOD1. It is also unlikely that the hit compound represses transcription generally, as there was no corresponding reduction in expression of β-actin.
The mode of action of 052C9 remains unclear at the moment. Nevertheless, our analysis suggests that 052C9 directly or indirectly blocks the phosphorylation of Nrf2. Transcription factor Nrf2 binds to the antioxidant response element (ARE) in the promoter region of detoxifying genes. 16 Phosphorylation of Nrf2 promotes its translocation into the nucleus where it activates the transcription of antioxidant genes. 17 Because the SOD1 gene also contains ARE, 18 the hit compound, 052C9, may downregulate the transcription of SOD1 by inhibiting phosphorylation of Ser40 of Nrf2. 052C9 had no detectable effects on the Ser133 phosphorylation of CREB in the present study. Because protein kinase C (PKC) phosphorylates both of the two transcription factors,17,19 it is likely that 052C9 inhibits the activity of an unidentified Nrf2-selective kinase or its activation. 052C9 or its analogs may serve as a powerful tool for exploring the molecular mechanism of SOD1 expression.
The hit compounds identified in the present study cause a partial reduction in SOD1 expression. Although the effects on ALS-model mice have not yet been examined, partial downregulation of SOD1 expression may be desirable. SOD1-knockout mice do not develop the motor neuron disease phenotype 3 but do show modest vulnerability to axotomy 3 and pathological degeneration of neuromuscular junctions and axons. 20
Decreasing wild-type SOD1 by a small molecule may prove to alleviate the disease phenotype in ALS-model mice and even in sporadic ALS patients. A previous study showed that wild-type (WT) SOD1 transgenic mice have pathological changes similar to those in mutant SOD1 mice and that WT SOD1 aggravates the ALS phenotype in double-transgenic mice with both WT-SOD1 and mutant SOD1. 21 Moreover, the mutation in the SOD1 promoter reduces SOD1 gene expression and may correlate with a delay in the onset of sporadic ALS. 22 Indeed, Zhong et al. 23 reported that administration of activated protein C (APC) to mutant SOD1 mice, which decreases the expression of SOD1 protein in vivo, ameliorates the ALS phenotype. Based on these findings, the toxicity of mutant SOD1 may not be explained by a gain of toxic function but by an increased toxicity of wild-type SOD1. Direct reduction of the transcription of pathogenic SOD1 protein may provide a new therapeutic strategy for SOD1-mediated ALS, and similar strategies may be used to treat other neurodegenerative diseases mediated by aberrant proteins.
Footnotes
Acknowledgements
This work was supported by research grants from the Ministry of Health and Labour (R.T., H.I.), the New Energy and Industrial Technology Development Organization (NEDO) (N.N.), JSPS (21591079) (H.I.), and JST (M.U.). We thank Ryoichi Nakano for providing the pHGSOD-Svneo plasmid and Kazumi Murai for editing the manuscript.
References
Supplementary Material
Please find the following supplemental material available below.
For Open Access articles published under a Creative Commons License, all supplemental material carries the same license as the article it is associated with.
For non-Open Access articles published, all supplemental material carries a non-exclusive license, and permission requests for re-use of supplemental material or any part of supplemental material shall be sent directly to the copyright owner as specified in the copyright notice associated with the article.