
Abstract
Aberrant protein-protein interactions are attractive drug targets in a variety of neurodegenerative diseases due to the common pathology of accumulation of protein aggregates. In amyotrophic lateral sclerosis, mutations in SOD1 cause the formation of aggregates and inclusions that may sequester other proteins and disrupt cellular processes. It has been demonstrated that mutant SOD1, but not wild-type SOD1, interacts with the axonal transport motor dynein and that this interaction contributes to motor neuron cell death, suggesting that disrupting this interaction may be a potential therapeutic target. However, it can be challenging to configure a high-throughput screening (HTS)–compatible assay to detect inhibitors of a protein-protein interaction. Here we describe the development and challenges of an HTS for small-molecule inhibitors of the mutant SOD1-dynein interaction. We demonstrate that the interaction can be formed by coexpressing the A4V mutant SOD1 and dynein intermediate complex in cells and that this interaction can be disrupted by compounds added to the cell lysates. Finally, we show that some of the compounds identified from a pilot screen to inhibit the protein-protein interaction with this method specifically disrupt the interaction between the dynein complex and mtSOD1 but not the dynein complex itself when applied to live cells.
Introduction
Amyotrophic lateral sclerosis (ALS) is a progressive, fatal, neurodegenerative disease characterized by the progressive death of motor neurons.1,2 Mutations in the gene encoding copper–zinc superoxide dismutase 1 (SOD1) account for ~20% of familial ALS cases.3,4 The most common SOD1 mutation in North America is A4V, characterized by an exceptionally rapid progression from onset to death. 5 Motor neurons in SOD1 knockout mice have no obvious phenotype, 6 whereas mice overexpressing mutant SOD1 (mtSOD1) develop clinical and pathological changes that are, in their late stages, strikingly similar to those in human disease. 7 This suggests that SOD1 mutants acquire toxic “gain of function,” but the nature of the toxicity and how it preferentially affects motor neurons are unclear. Cytoplasmic inclusions containing mtSOD1 as well as other proteins such as ubiquitin are a pathological hallmark of mtSOD1-mediated familial ALS.8–10 Several mechanisms by which SOD1 aggregation/inclusions could be toxic have been proposed, such as loss of other essential proteins via coaggregation with mtSOD1, proteasomal dysfunction due to an overwhelming quantity of aggregated proteins, or disruption of organelles such as mitochondria by aggregates on or within such organelles.11–13
Intracellular transport systems are particularly important in motor neurons because they have extremely long axons. Disruption of axonal transport has been implicated in mtSOD1-mediated familial ALS.14–18 Dynein is a molecular motor involved in retrograde axonal transport along microtubules. 19 In the motor neuron, newly synthesized proteins and subcellular compartments, such as mitochondria, are transported toward the extended axon terminals via kinesin-mediated anterograde axonal transport. On the other hand, dynein-mediated retrograde transport is responsible for returning old and damaged axonal components to the cell body for degradation. If the capacity of the degradation systems is overwhelmed, damaged proteins transported by dynein will accumulate at the microtubule organization center (MTOC) and form inclusions known as aggresomes. 20 Dynein-mediated retrograde transport is also required for the transport of neurotrophic growth factor survival signals from the axon to the cell body.21,22 In mice, both mutations in the retrograde transport motor complex dynein or blockage of dynein function by overexpression of the dynein interacting protein dynamitin resulted in motor neuron death.23,24 Studies in motor neurons from ALS patients have revealed decreased speed of retrograde transport of organelles such as mitochondria.25,26 Reduced transport of dynein-dependent cargos as well as slow transport of structural components such as tubulin has also been observed well before onset of symptoms in several ALS transgenic animal models.15,27,28 Moreover, point mutations in the p150Glued subunit of dynactin, a dynein binding protein involved in dynein-mediated retrograde transport, have been reported in familial ALS patients.29,30 Although critically important, the mechanism(s) causing the retrograde axonal transport defects in ALS is largely unknown.
Our previous report showed that the ALS causing SOD1 mutants, but not wild-type (WT) SOD1, interacted and co-localized with dynein in multiple ALS transgenic animal models prior to the disease onset. 17 Moreover, the aberrant interaction between dynein and mtSOD1 can be abrogated by overexpression of the p50 subunit of dynactin. The p50 overexpression also prevented mtSOD1 inclusion formation and improved the survival of cells with A4V mtSOD1 expression. 31 These indicate that the aberrant mtSOD1-dynein interaction is an important motor neuron death mechanism, which might reduce axonal transport and impair sufficient transport of other cargos such as neurotrophic factors and eventually lead to motor neuron degeneration. Blockage of the interaction of mtSOD1 and dynein might potentially rescue motor neurons by restoring the observed axonal transport defects.
Identifying compounds that selectively prevent or disrupt the mtSOD1 and dynein interaction could be a viable approach to the treatment of ALS associated with mtSOD1. Here, we describe the first assay designed for high-throughput screening (HTS) to identify inhibitors of the aberrant interaction between mtSOD1 and dynein. We evaluated a traditional enzyme-linked immunosorbent assay (ELISA) and the “no-wash” homogeneous AlphaLISA assay from PerkinElmer 32 in the in vitro and cell-based assay formats for HTS and elected to screen the AlphaLISA assay using lysates from cells coexpressing mtSOD1 and dynein intermediate complex (DIC). Several novel small molecules were identified as inhibitors of the mtSOD1-DIC interaction in lysates and also demonstrated to disrupt the interaction in cells.
Materials and Methods
Plasmid Preparation
Human SOD1 WT, G93A, and A4V constructs tagged with FLAG in the EcoRI and BamHI sites of the mammalian expression vector pCMV-3xFLAG (Sigma-Aldrich, St. Louis, MO) were reported previously. 17 Glutathione S-transferase (GST)–tagged dynein intermediate chain (GST-DIC) was also described previously. 17 The plasmids were purified with the HiSpeed Plasmid Midi Kit (Qiagen, Valencia, CA).
Cell Culture and Transfections
HEK293T cells were maintained in phenol red–free Dulbecco’s modified Eagle’s medium (DMEM) with 10% fetal bovine serum (FBS) and 100 µg/mL penicillin/streptomycin at 37 °C, 95% relative humidity, and 5% CO2 chamber. Cell culture reagents were obtained from Invitrogen (Carlsbad, CA). For transient transfection, 6 × 10⁶ cells were seeded on 10-cm Petri plates for 24 h. During transfection, culturing media were removed and replaced with 4 mL OptiMEM containing 7.5 µg GST-DIC plasmid and either 7.5 µg FLAG-SOD1-A4V or FLAG-SOD1-WT plasmid with Lipofectamine 2000 (1:2 ratio of plasmid/lipofectamine; Invitrogen) and incubated for 4.5 to 5 h. The transfection mixture was then removed and replaced with culturing media, and the cells were grown for an additional 48 h. This procedure generated two sets of HEK293T cells: cells coexpressing GST-DIC and mutant FLAG-SOD1-A4V or cells coexpressing GST-DIC and FLAG-SOD1-WT. Cells were collected by trypsin and pelleted by centrifugation at 1000 rpm for 5 min. Cells were lysed by triturating the cell pellet in 1 mL ice-cold lysis buffer per plate (50 mM Tris-HCl [pH 8.0], 150 mM NaCl, 5 mM EDTA, 1% NP40) with a 1:200 dilution of protease inhibitor cocktail (Sigma-Aldrich) and incubating on ice for 20 min. Cellular debris was removed by centrifuging at 14 000 rpm for 2 min at 4 °C. The supernatant was collected and protein concentration was determined by bicinchoninic acid protein assay (Pierce, Thermo Scientific, Rockford, IL). We found that the cell lysates were stable and could be stored for a month at −80 °C for later usage.
ELISA Assay
Initial ELISA experiments focused on reconstituting the dynein-mtSOD1 interaction in vitro. HEK293T or NSC34 cell lysates expressing GST-DIC (in total 100 µL 1× lysis buffer) were immobilized on glutathione-S-transferase antibody (anti-GST)–coated plates (Thermo Scientific), then washed with 200 µL 1× Tris-buffered saline (TBS) buffer three times to remove unbound protein. Next, HEK293T or NSC34 lysates expressing FLAG-SOD1-A4V or FLAG-SOD1-WT (in total 100 µL 1× lysis buffer) were added and incubated 1 h. Plates were washed with 200 µL 1× TBS buffer three times and incubated with 100 µL 1:20 000 of horseradish peroxidase (HRP)–conjugated anti-FLAG antibody (Sigma-Aldrich) for 1 h.
Later ELISA experiments involved detecting the dynein-SOD1 interaction in cells coexpressing GST-DIC and either FLAG-SOD1-A4V or FLAG-SOD1-WT. Similarly, cell lysates were immobilized on anti-GST-coated plates at room temperature for 1 h, washed with 1× TBS buffer three times to remove unbound protein, and probed with 1:20 000 of HRP-conjugated anti-FLAG antibody for 1 h.
In both instances, either an absorbance readout using a tetramethylbenzidine (TMB) substrate or luminescence readout using a chemiluminescent HRP substrate (Thermo Scientific) was used to quantify the relative amounts of FLAG-tagged SOD1 bound to the plates via interaction with GST-DIC. The absorbance was read by a SpectraMax microplate reader (Molecular Devices, Sunnyvale, CA), and the luminescence was detected by an LJL AnalystHTS reader (Molecular Devices).
AlphaLISA Assay
The AlphaLISA assay (PerkinElmer, Waltham, MA) was performed with streptavidin-coated donor beads, biotinylated anti-GST-antibody (GenScript, Piscataway, NJ), and anti-FLAG acceptor beads. According to the principle of the AlphaLISA assay, excitation at 680 nm results in the release of singlet oxygen from the donor beads, which, when in proximity to the acceptor beads that contain a thioxene derivative, react with the singlet oxygen molecule to generate a chemiluminescence at 370 nm. This energy is immediately transferred to fluorophores within the same bead, shifting the emission wavelength to fluorescence. All procedures for the assay were performed at room temperature. Cell lysates from cells coexpressing GST-DIC with either FLAG-SOD1-A4V or FLAG-SOD1-WT were prepared as described above. First, 5 µL cell lysate with an indicated amount of protein was added to a white, tissue culture–treated 384-well assay plate (PerkinElmer). Then 5 µL of a solution of AlphaLISA acceptor beads (60 µg/mL) and biotinylated anti-GST antibody (9 nM) in 1× lysis buffer was added to each well and incubated for a half hour with gentle shaking. Next, 5 µL per well of streptavidin donor beads (60 µg/mL) in 1× lysis buffer was added to the assay plate and incubated 1 h while shaking in the dark. The signals were read by the EnVision plate reader (excitation 680, emission 570 nm; PerkinElmer).
Cell-Based AlphaLISA Assay
HEK293T cells were transiently transfected with GST-DIC and either FLAG-SOD1-A4V or FLAG-SOD1-WT as described above. After 24 h, the cells were collected and replated in a white, tissue culture–treated 384-well assay plate (PerkinElmer). Cells were grown in a 384-well format for an additional 24 h, and then the media were partially removed by aspiration with a plate washer. Cells were lysed in the wells by the addition of 5 µL 2× ice-cold lysis buffer for 20 min with shaking. Then, 5 µL cell lysate was transferred to a 384-well assay plate for the AlphaLISA assay. The AlphaLISA assay protocol was performed as described above.
HTS Assay
The 384-well v-bottom polypropylene compound source plates (PerkinElmer) containing 0.4 µL 1.67 mM compound in DMSO in columns 1 to 22 or neat DMSO alone in columns 23 and 24 were diluted by the addition of 32.5 µL 1× lysis buffer (without protease inhibitors) with a Multidrop Combi liquid dispenser (Thermo Scientific), resulting in an intermediate concentration of 20 µM compound and 1.2% DMSO. Lysates prepared previously as described above were normalized to 0.8 µg/µL protein and 5 µL/well transferred to a 384-well polypropylene v-bottom plate (PerkinElmer) with a Multidrop Combi liquid dispenser (Thermo Scientific). Lysates from cells coexpressing GST-DIC and FLAG-SOD1-A4V were added to columns 1 to 23, and lysates from cells coexpressing GST-DIC and FLAG-SOD1-WT were added to column 24 as a control. Then, 5 µL compound solution was transferred from the compound source plate to the lysate plate using the Biomek NX automated liquid handling system with a 384-channel pipetting head (Beckman-Coulter, Brea, CA) and incubated for 1 h at room temperature. The final compound concentration in the lysate was 10 µM. Next, 5 µL lysate and compound mixtures were transferred to a white, tissue culture–treated 384-well assay plate (PerkinElmer) for the AlphaLISA assay using a Biomek NX automated liquid handling system. The AlphaLISA assay was performed as described above, using a Multidrop Combi liquid dispenser (Thermo Scientific) to add the detection reagents.
Compound Library
The compound library screened consisted of approximately 18 000 small molecules, including compounds approved by the Food and Drug Administration (FDA), a purified natural products library, and compounds purchased from Maybridge Plc. (Cornwall, UK), Bionet Research Ltd. (Cornwall, UK), Prestwick (Illkirch, France), and ChemBridge (San Diego, CA). Compounds were selected from the different vendors by applying a series of filters, including for clogP and predicted solubility. All of the small molecules generally adhere to Lipinski’s rules (i.e., molecular weight <500, H-bond donors ≥5, H-bond acceptors ≥10, and logP <5) and contain a low proportion of known toxicophores (i.e., Michael acceptors and alkylating agents) and unwanted functionalities (i.e., imines, thiol, and quaternary amines) and have been optimized to maximize molecular diversity. Compounds for HTS are stored as DMSO stocks. For 5-point dose-response studies, original DMSO stocks from our library were used. For the secondary assay validation, compounds were reordered from the original vendor as powder stocks for further confirmation that activity of stored DMSO stocks matched the activity when fresh compound stocks were tested.
Dose-Response Evaluation
Compounds identified as hits in the primary screen were confirmed in a 5-point dose-response experiment using the primary assay. Then, 6 µL of a 10-mM compound stock in DMSO was sampled and serially diluted in DMSO by a factor of 3 to generate stocks of 10, 3, 1, 0.3, and 0.1 mM. Next, 1 µL of each stock concentration of each compound was then diluted to 50 µL in lysis buffer (without protease inhibitors) for working stocks of 200, 66.7, 22.2, 7.4, and 2.4 µM with a consistent % DMSO of 2%. Then, 5 µL of each working stock of each compound or a vehicle control was transferred to a 384-well v-bottom polypropylene plate containing lysates prepared previously as described above. The final compound concentrations were 33.3, 11.1, 3.7, 1.2, and 0.4 µM with 0.67% DMSO. Each concentration of each compound was tested in quadruplicate. Columns 1 to 20 of the assay plate contained compounds, and columns 21 to 24 contained vehicle controls. Lysates from cells coexpressing GST-DIC and FLAG-SOD1-A4V were added to columns 1 to 22, and lysates from cells coexpressing GST-DIC and FLAG-SOD1-WT were added to columns 23 and 24 as a control.
Cellular Validation of the Lead Compounds
HEK293 cells were cotransfected with GST-DIC and FLAG-SOD1 (either WT or A4V) for 24 h and then treated with the indicated compound (20 µM) or DMSO vehicle for an additional 24 h. Cells were harvested and lysed in 1× RIPA buffer (Upstate), and the cell lysates were subjected to GST pull-downs and Western blotting analysis as previously described. 31 Briefly, cell lysates were cleared by centrifugation at 1000 g for 10 min, and the supernatant was collected. The protein concentration was determined by Bradford assay (Bio-Rad, Hercules, CA). Cell lysates (500 µg) were incubated with 30/50 µL of a 50% slurry of glutathione–Sepharose 4B (Amersham Biosciences, Piscataway, NJ) in a total volume of 1 mL for 3 h at 4 °C with rotation. Then glutathione beads were collected by microcentrifuge at 500 g for 5 min at 4 °C. The pelleted glutathione beads were further washed three times with ice-cold RIPA buffer. The bound proteins were then released by boiling in 2× sodium dodecyl sulfate (SDS) sample loading buffer for 5 min and subjected to 12% SDS–polyacrylamide gel electrophoresis (PAGE) followed by Western blotting. Membranes were probed with anti-FLAG (A8592; Sigma-Aldrich), anti-GST (sc-459; Santa Cruz Biotechnology, Santa Cruz, CA), or anti-p150Glued (610473; BD Pharmingen, San Diego, CA), and the protein of interest was visualized using the SuperSignal West Pico Enhanced Chemiluminescent Substrate kit (Pierce).
Results
Evaluation of ELISA Assay for mtSOD1-DIC Interaction
Previous reports indicated an interaction between dynein and ALS-causing mutations in SOD1 that impairs axonal transport and is a potential mechanism for motor neuron degeneration in ALS patients.17,18,31 We developed an assay to screen for compounds that block this aberrant interaction (described in Fig. 1 ). Our initial approach focused on reconstituting the interaction in vitro and using an ELISA assay to measure the protein-protein interaction. First, the lysate containing the GST-tagged dynein intermediate chain (GST-DIC) would be immobilized on anti-GST antibody-coated plates and preincubated with compound for 1 h. Then FLAG-tagged SOD1 (either WT or mutant) cell lysates would be incubated with the immobilized dynein complex and the small molecule. Anti-FLAG would be used to detect the protein-protein interaction.
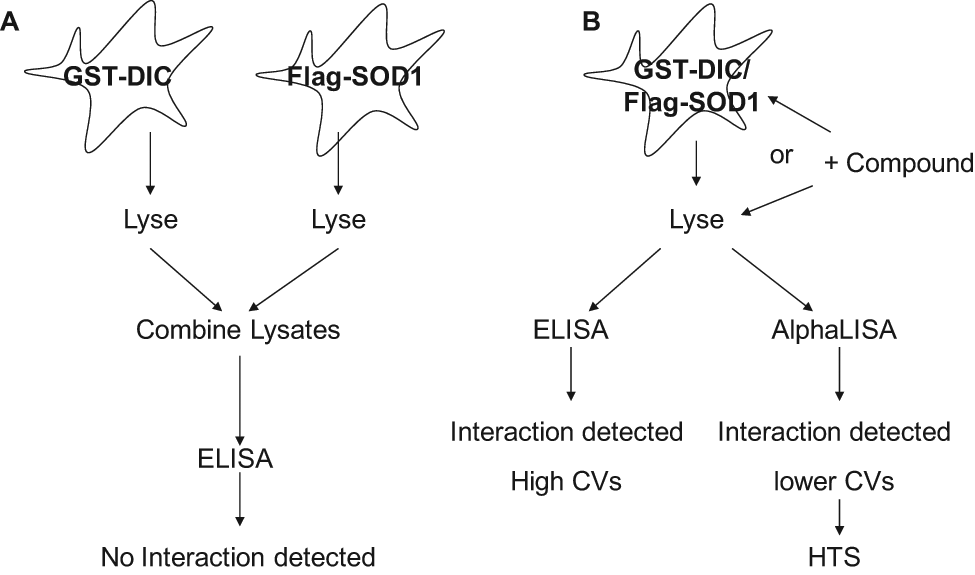
Schematic of assay paradigms tested for development of a high-throughput screening (HTS)–compatible assay. (A) Cells were transiently transfected with either glutathione S-transferase (GST)–dynein intermediate chain (DIC) or FLAG–superoxide dismutase (SOD1), lysed, and the lysates combined. No protein-protein interaction was measured by enzyme-linked immunosorbent assay (ELISA) detection. (B) Cells were cotransfected with both GST-DIC and FLAG-SOD1, lysed, and the protein-protein interaction detected by either ELISA or AlphaLISA. Two compound addition protocols were tested using this assay paradigm: treatment of the live cells with compound or incubation of the compound with the cell lysate. These experiments resulted in selection of the AlphaLISA detection method and a protocol in which the compound is incubated with the lysate for the HTS assay. CV, coefficient of variation.
We first tested the specificity of the anti-GST antibody-coated plates using the cell lysates expressing FLAG-tagged SOD1 (WT, G93A, and A4V). When the plates were incubated with the cell lysates containing only FLAG-SOD1, minimal signal was detected by anti-FLAG antibody in the absence of the GST-DIC. When these plates were incubated with the cell lysates containing GST-DIC, a significant signal was observed when probed with anti-GST antibody ( Fig. 2A ). These results suggest that there was no nonspecific binding of the FLAG-SOD1 to these anti-GST antibody-coated plates and that GST-DIC proteins were captured on the plates.
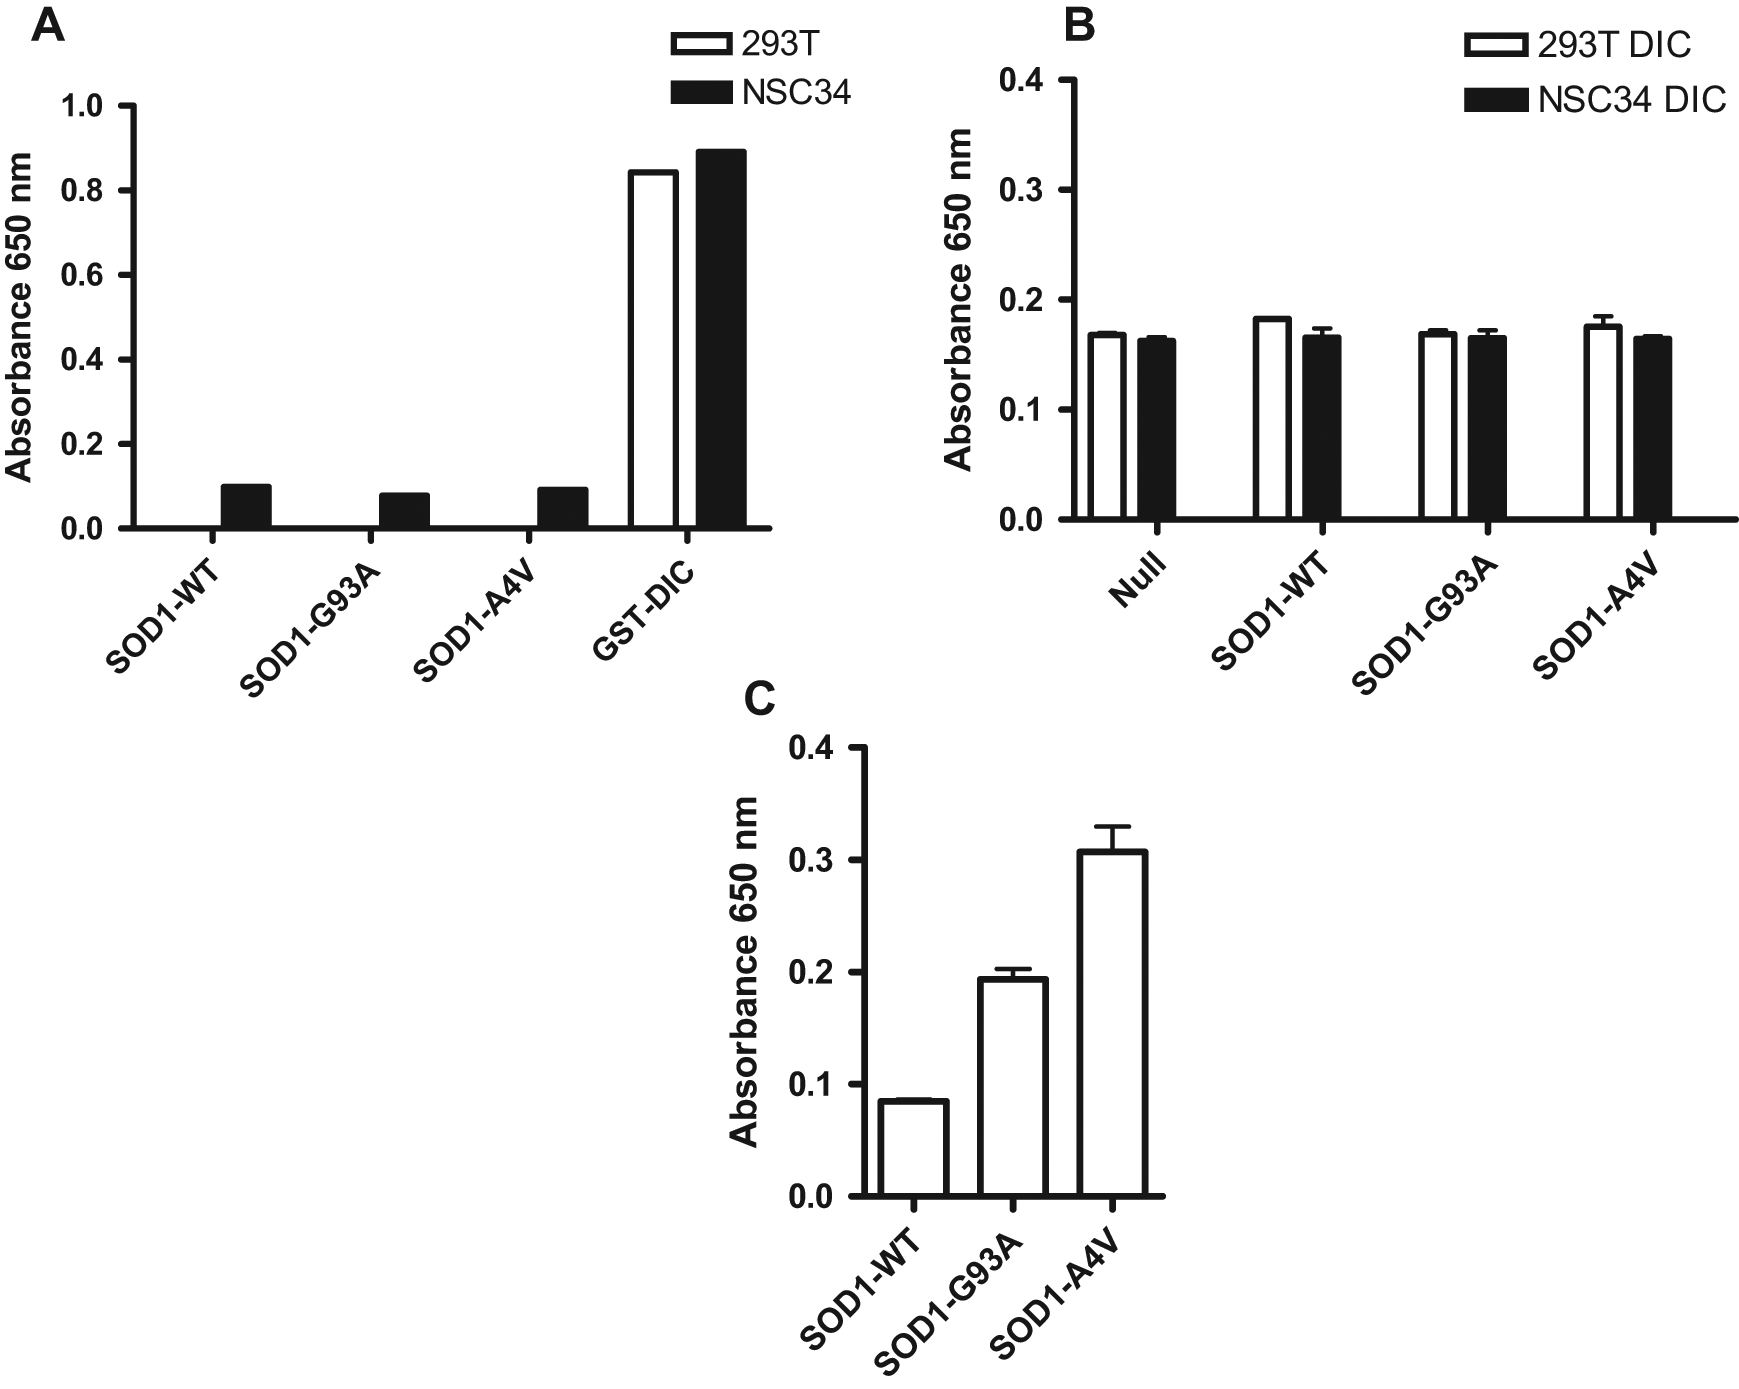
Evaluation of the specificity and assembly of mtSOD1 and dynein intermediate chain (DIC) interaction with the enzyme-linked immunosorbent assay (ELISA). (A) Glutathione S-transferase (GST)–DIC, but not wild-type (WT) or mutant FLAG–superoxide dismutase 1 (SOD1), was specifically immobilized on anti-GST antibody-coated plates. Lysates from HEK293T cells (white bars) or NSC34 cells (black bars) expressing GST-DIC, WT, or mutant (G93A or A4V) FLAG-tagged SOD1 were incubated on anti-GST-coated plates probed with anti-GST antibody. (B) GST-DIC and FLAG-mtSOD1 expressed in different cells do not assemble in vitro cell lysates. Lysates from HEK293T cells (white bars) or NSC34 cells (black bars) expressing GST-DIC were incubated on anti-GST-coated plates followed by addition of NSC34 lysates expressing either WT or mutant (G93A or A4V) FLAG-tagged SOD1 and probed with anti-FLAG antibody. (C) GST-DIC and FLAG-mtSOD1 do assemble when coexpressed in the same cells. Lysates from NSC34 cells coexpressing GST-DIC and WT, G93A, or A4V mutant FLAG-SOD1 were incubated on anti-GST-coated plates, washed, and probed with an anti-FLAG antibody. An absorbance readout using a tetramethylbenzidine substrate was used to quantify the relative amounts of FLAG-tagged SOD1 bound to the plates via interaction with GST-DIC.
Next, we tested whether the interaction between the dynein complex and mtSOD1 could be assembled in vitro. We expressed GST-DIC and FLAG-SOD1 (WT or mutant) proteins in separate cells. The GST-DIC lysates were immobilized on the anti-GST antibody-coated plates. After 1 1-h incubation, the plate was washed to remove unbound protein and the FLAG-tagged mutant (G93A and A4V) or WT SOD1 lysates were added to the wells respectively and incubated with the captured GST-DIC complex. There was very little signal detected with the anti-FLAG antibody and no detectable difference in signals between WT and mutant SOD1 ( Fig. 2B ). These results show that the interaction between the dynein complex and mtSOD1 is unable to be reconstituted in this assay condition.
On the basis of these results, we altered our strategy to measure the interaction in cells rather than trying to reconstitute the interaction from cell lysates in vitro. With this new assay format, cells expressing both GST-DIC and FLAG-SOD1 would be treated with compounds, and the effects on the interaction between dynein and the mtSOD1 were monitored. This method would also allow identification of compounds that may not directly disrupt the protein-protein interaction but would work through other cellular pathways to reduce the interaction. To that end, cells were cotransfected with GST-DIC and FLAG-tagged SOD1 (WT, G93A, or A4V) and then lysed, and the lysates were incubated on anti-GST-coated plates. The dynein-SOD1 interaction was measured by probing with anti-FLAG antibody. This approach resulted in an increase in signal in cells expressing the mutant but not WT SOD1, with the greatest difference in cells expressing the A4V mutation ( Fig. 2C ). This is consistent with previously reported results using the GST pull-down assay. 17 Because the mutant A4V-SOD1 gave a stronger binding signal with the dynein complex, we further optimized the assay by evaluating the interaction between A4V-SOD1 and the dynein complex. At this point, we switched from the absorbance-based TMB substrate to a more sensitive chemiluminescent substrate for detection in the ELISA assay.
We then titrated the total amount of lysate protein to determine if the signal was dependent on protein concentration and to establish the linear range of total proteins for this assay. The results confirmed that only the mutant A4V-SOD1 bound to GST-DIC and indicated that the signal was proportional to the total amount of proteins added, whereas WT SOD1 did not bind with GST-DIC. However, the coefficient of variation (CV) values ranged from 1% to 40%, and the Z′ factors ranged from 0.8 to 0.66 due to variability in the signal from the A4V-SOD1 bound to the GST-DIC. A representative experiment is shown in Figure 3A . Despite many manipulations to try to reduce the variability in this assay, we were unable to improve the assay to the standards required for HTS. This is not unexpected for assays such as ELISAs that include several series of wash steps, each of which can introduce variability. Perhaps more important, a homogeneous assay is preferred in HTS because of the fewer steps required.
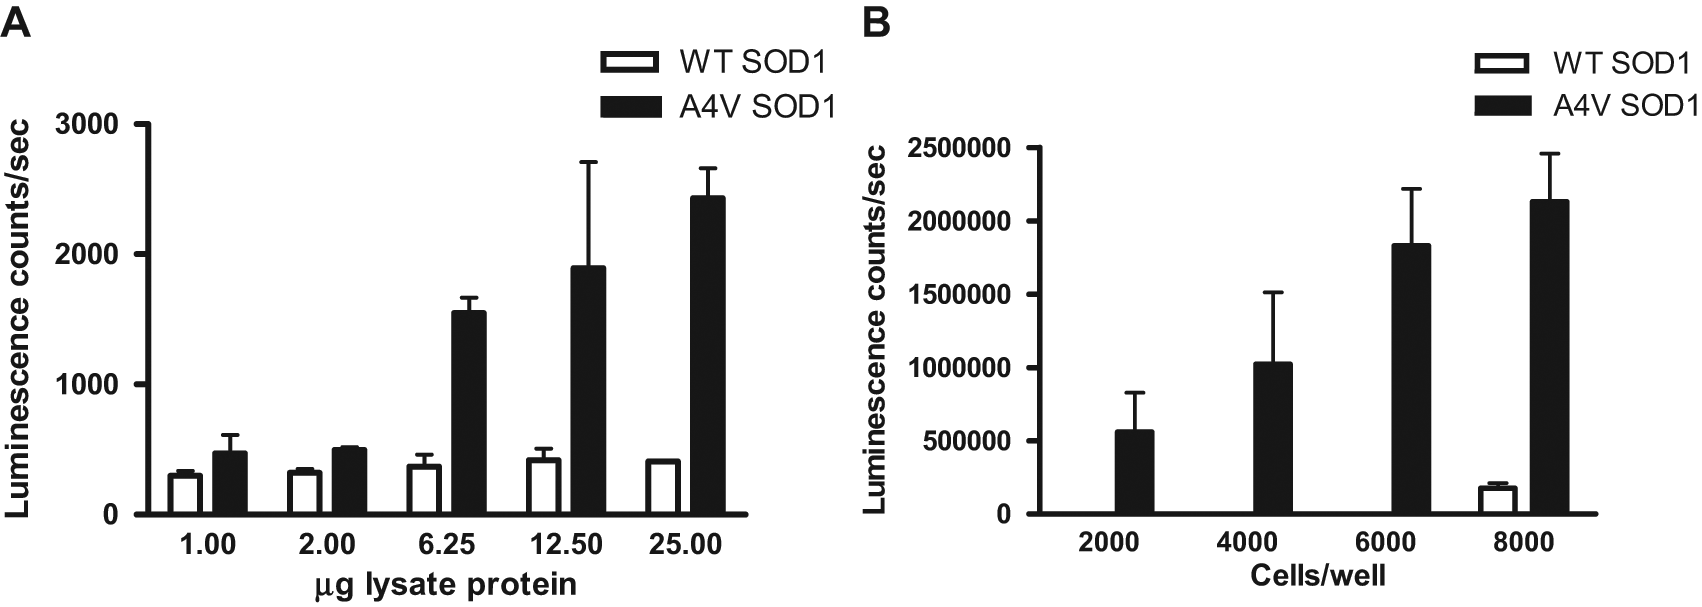
Optimization of the enzyme-linked immunosorbent assay (ELISA). (A) Titration of total lysate protein. Lysates from cells coexpressing glutathione S-transferase (GST)–dynein intermediate chain (DIC) and either wild-type (WT) or A4V mutant FLAG–superoxide dismutase 1 (SOD1) were prepared and the amount of protein quantified. Indicated amounts of lysate protein were incubated with anti-GST-coated plates, washed, and probed with anti-FLAG antibody. Error bars represent standard deviation from the mean. (B) Cell titration in a 384-well plate format. Indicated densities of cells coexpressing GST-DIC and either WT or A4V mutant FLAG-SOD1 were plated in 384-well plates, then lysed in the wells, and transferred to 384-well anti-GST-coated plates. Plates were washed and probed with anti-FLAG antibody. A more sensitive luminescence readout using a chemiluminescent horseradish peroxidase substrate was performed to quantify the relative amounts of FLAG-tagged SOD1 bound to the plates via interaction with GST-DIC. Error bars represent standard deviation from the mean.
A more complex version of this assay would involve cotransfecting cells with GST-DIC and FLAG-SOD1 (WT or A4V mutant), plating the cells in a 384-well format for exposure to compound, lysing the cells directly in the wells, and transferring the lysate protein to the anti-GST-coated plate for the ELISA assay. To evaluate this approach, we performed a cell titration to determine what cell density would be required to generate a sufficient signal window ( Fig. 3B ). The results showed a dependence of signal on the number of cells per well, but the signal variability was still high for HTS.
Homogeneous AlphaLISA Assay for mtSOD1-DIC Interaction
A homogeneous assay format generally is preferred when developing an HTS assay. One method for homogeneous detection of protein-protein interactions is the AlphaLISA assay technology from PerkinElmer. 32 We thus chose to adopt the AlphaLISA technology for our studies. This technology is a bead-based homogeneous luminescent proximity assay format in which binding of donor beads and acceptor beads to a molecule or complex results in energy transfer from the donor to the acceptor bead and fluorescence emission from the acceptor bead. To adapt this assay for detection of the interaction between dynein and SOD1, we used the tags on the proteins (GST and FLAG) to select antibody-bead conjugates. We chose to use biotinylated anti-GST and streptavidin-coated donor beads to capture the GST-tagged dynein complex. The acceptor beads conjugated with anti-FLAG antibody capture FLAG-tagged SOD1 proteins. If an interaction between the GST-DIC and the FLAG-SOD1 occurs, the donor beads will be in proximity to the acceptor beads. Consequently, excitation of the donor at 680 nm will cause energy transfer (in the form of singlet oxygen) to the acceptor beads and emission of fluorescence at 570 nm. Figure 4 shows the results of optimization of the AlphaLISA assay. The interaction between SOD1 and GST-DIC was only detected with the A4V mutation, not with WT SOD1. As shown in Figure 4A , the signals between GST-DIC and FLAG-A4V SOD1 were strong when the amount of biotinylated anti-GST was below 3 nM. Once the amount of biotinylated anti-GST increased higher than 3 nM, the signal began to decrease due to the limiting concentration of labeled FLAG-SOD1 in the assay (hook effect). Because there was no difference between 1 and 3 nM, we proceeded to use 3 nM biotinylated anti-GST in subsequent experiments. The concentrations of acceptor and donor beads were constant at 20 µg/mL each in all samples, as per the manufacturer’s instructions (PerkinElmer).
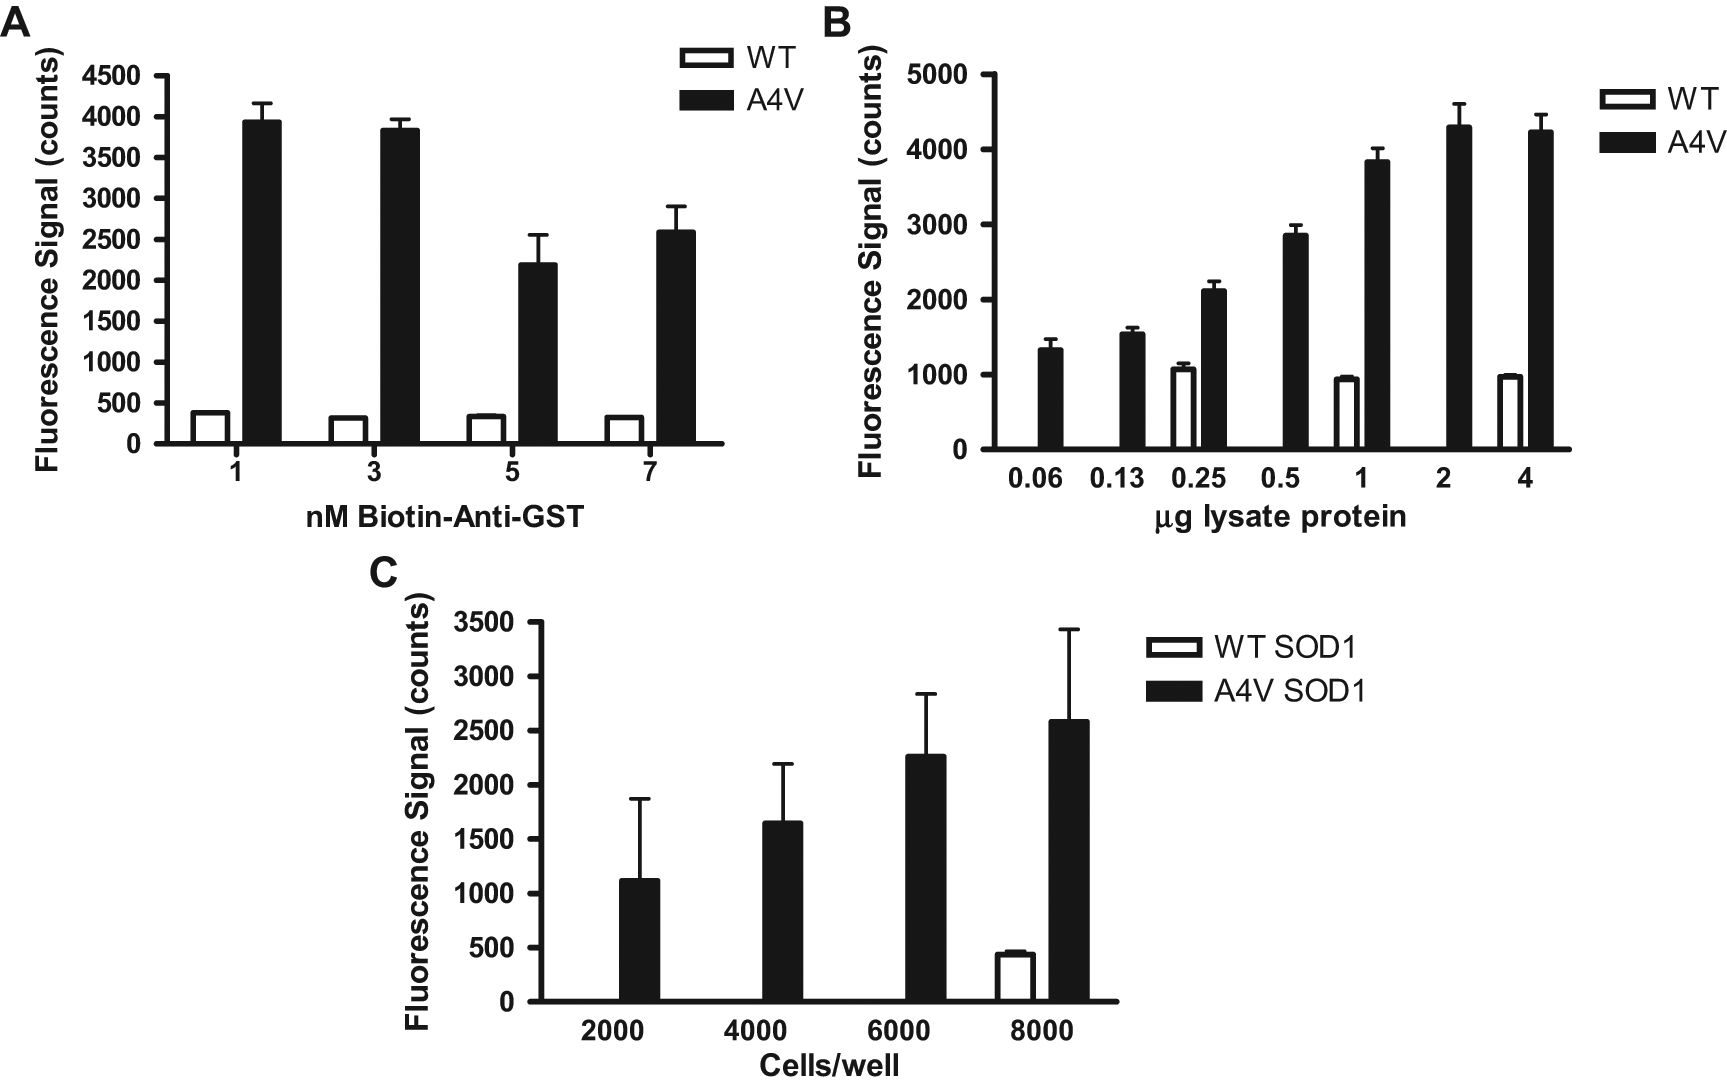
Optimization of the AlphaLISA assay format for detection of the interaction between mutant superoxide dismutase 1 (mtSOD1) and dynein. Cells coexpressing glutathione S-transferase (GST)–dynein intermediate chain (DIC) and either wild-type (WT) or A4V mutant FLAG-SOD1 were lysed and protein measured, and then the lysates with specified protein were plated into anti-GST-coated 384-well plates. (A) Titration of biotinylated anti-GST antibody with 2 µg cell lysate. (B) Determination of the linear dependence of the signal with different amounts of lysate protein in the assay. Error bars represent standard deviation from the mean. (C) Titration of the cell number plated per well. Cells coexpressing GST-DIC and either WT or A4V mutant FLAG-SOD1 were plated in 384-well plates at indicated densities, then lysed in the wells and the lysates transferred to a 384-well assay plate. Error bars represent standard deviation from the mean.
Next, we titrated the amount of total lysate protein to determine what concentration of protein resulted in a good signal window but was still within the linear range ( Fig. 4B ). These results demonstrated a linear dependence of signal on the amount of total proteins within the range of 0.125 to 2 µg lysate protein using cells cotransfected with GST-DIC and A4V mutant FLAG-SOD1. In addition, signals were unchanged in cells cotransfected with GST-DIC and wild-type FLAG-SOD1 from 0.25 to 4 µg lysate protein. On the basis of these results, we selected to use 2 µg lysate protein in subsequent HTS experiments because this amount was near the maximum but within the linear range and would generate a high signal convenient for identifying potential inhibitors.
We also tried to use live cells instead of cell lysates in the AlphaLISA screening assay. With this approach, we would plate the cells in the 384-well format as described so that compound could be applied to the whole cell. Cells were lysed in the wells and then subjected to the AlphaLISA assay directly. As shown in Figure 4C , cell titration experiments showed the dependence of signal on cell number, but the variability using this approach was far too high for HTS. This variability was not due to variability in cell plating, as assessed by the MTS [3-(4,5-dimethylthiazol-2-yl)- 5-(3-carboxymethoxyphenyl)-2-(4-sulfophenyl)-2H- tetrazolium, inner salt] cell viability assay (data not shown). It was rather likely due to variations in the transient transfection rate. The variability potentially could have been reduced with the use of stable cell lines.
These experiments demonstrate that the association between mtSOD1 and the dynein intermediate complex can be measured using the homogeneous AlphaLISA assay format. No association was detected between WT SOD1 and dynein, consistent with the results of the ELISA assay and our previous report. 17 Because of the high signal window and the low variability when measuring the interaction in the cell lysates, this approach is appropriate for HTS.
HTS for Inhibitors of the mtSOD1-DIC Interaction
Using the AlphaLISA assay described above, we conducted a pilot screen of approximately 18 000 small molecules. The calculated percent inhibition for the entire compound set is shown in Figure 5A . The Z′ factors for the plates screened ranged from 0.47 to 0.83 ( Fig. 5B ). Two of the assay plates had a significant gradient in the signal across the plate, which is evident by the spikes of highly negative calculated percent inhibition in Figure 5A . The data from these plates were not used to establish a threshold for hits, nor were they considered when identifying hits from the screen. In general, however, the pilot screen yielded sufficiently high Z′ factors and signal to background to identify molecules that inhibited the assay signal. For identification of hits, we used a generous threshold of 45% inhibition, which is just outside the scatter for the assay and is only 1 standard deviation from the mean of the assay. Typically, thresholds ≥3-fold the standard deviations are used for hit selection, but in this assay, there was a very low hit rate, so we chose to use a less stringent threshold to identify potentially weaker inhibitors, recognizing that the reconfirmation rate was likely to be lower than usual. This resulted in 35 compounds being identified as hits from this set of 18 000 compounds, a 0.19% hit rate. One important potential artifact to consider for this assay is the presence of a biotin moiety on a compound. Compounds with a biotin moiety will compete with the biotinylated antibody to GST for binding with the streptavidin-coated donor beads and therefore may artificially suppress the signal. After a first-pass evaluation, 8 compounds were eliminated due to the presence of a biotin moiety or other unfavorable structural features, leaving 27 compounds for confirmation in a 5-point dose-response assay.
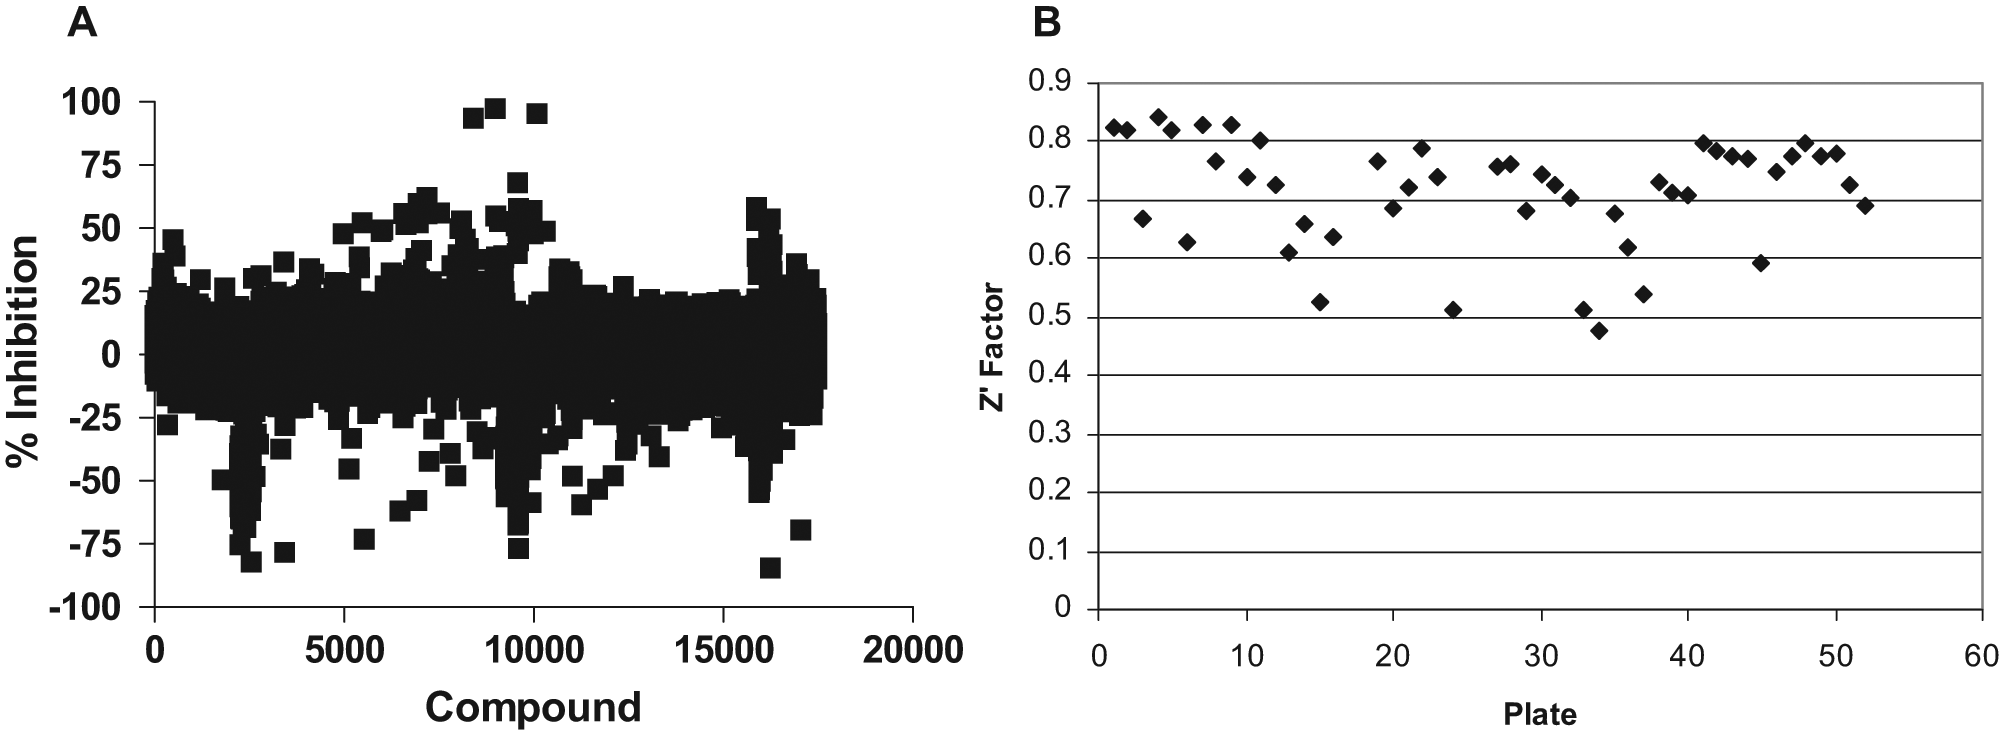
High-throughput screening (HTS) pilot screen of 18 000 small molecules using the AlphaELISA format. Cells coexpressing glutathione S-transferase (GST)–dynein intermediate chain (DIC) and A4V mutant FLAG–superoxide dismutase (SOD1) were lysed and protein measured, and then 2 µg protein lysate per well was plated into 384-well plates. (A) Calculated % inhibition of mtSOD-dynein protein-protein interaction for the 18 000 molecules screened in the primary screening assay. (B) Z′ factors for all compound plates screened.
Compounds selected for confirmation were sampled from the compound library stocks and serially diluted in DMSO, generating stock concentrations that would result in concentrations ranging from 0.4 to 30 µM in the assay. Each concentration of each compound was tested in quadruplicate. Of the 27 compounds tested, 11 showed some activity in the 5-point dose-response experiments (a 40% confirmation rate). The confirmation rate was low, as expected, due to the lower threshold used to identify hits in this assay. Dose-response curves for 2 representative compounds are shown in Figure 6 . Figure 6A shows the 5-point dose curve for LDN-0007065, which demonstrated complete dose-dependent inhibition, whereas Figure 6B shows LDN-0007588, which only partially inhibited the signal and did not demonstrate a dose dependency at the concentrations tested. This type of profile could suggest that the compound is a fairly potent but partial inhibitor of the protein-protein interaction or that the inhibition seen is the result of an artifact specific to the primary screening assay. Therefore, it is necessary to confirm the activity of the compounds in an alternate assay.
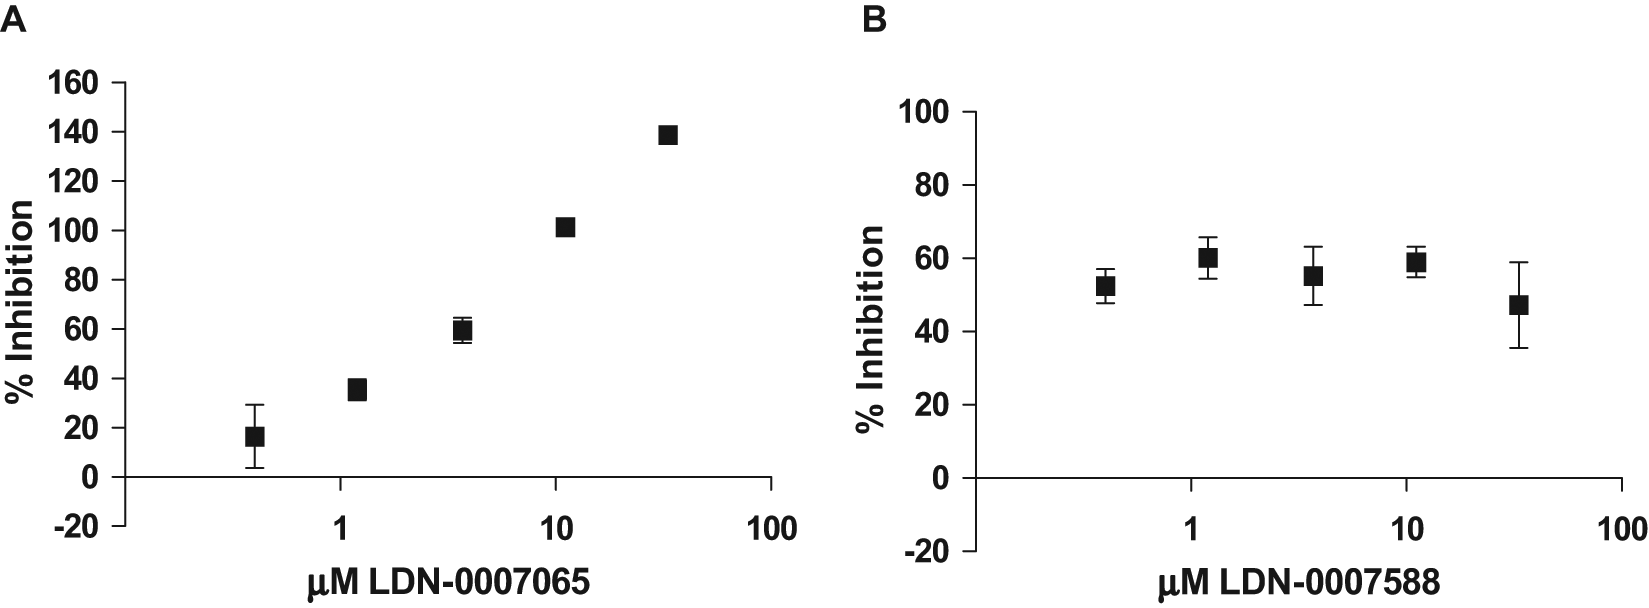
Confirmation of selected hits in a 5-point dose-response assay. Cells coexpressing glutathione S-transferase (GST)–dynein intermediate chain (DIC) and A4V mutant FLAG–superoxide dismutase 1 (SOD1) were lysed and protein measured, and then 2 µg protein lysate was plated into 384-well plates for the AlphaLISA assay. Results for two of the compounds selected for confirmation, LDN-0007065 (A) and LDN-0007588 (B), are shown tested in the primary screening assay at five concentrations in quadruplicate.
Cellular Validation for Inhibitors of the mtSOD1-DIC Complex Interaction
Nine of the confirmed hits were available for resupply as fresh powders from a commercial vendor and could be easily validated in additional lower throughput assays. Although the primary screening assay was a good format for HTS in that the assay was homogeneous and performed in cell lysates, the ideal test is whether the mtSOD1-DIC interaction is disrupted in live cells. This was evaluated by the GST-DIC coprecipitation assay. HEK293 cells coexpressing the GST-DIC and the A4V mtSOD1 were treated for 24 h with 20 µM compound and then lysed, and the amount of SOD1 that coprecipitated with GST-DIC was evaluated by Western blot ( Fig. 7 ). As in previous experiments, there was no association between wild-type SOD1 and GST-DIC ( Fig. 7A , lane 1). Additional negative controls showed that A4V SOD1 was not coprecipitated when the mutant SOD1 was coexpressed with GST or empty vector (data not shown). Treatment with DMSO did not change the mutant SOD1-dynein interaction ( Fig. 7A , lane 2). However, the amount of mtSOD1 that was pulled down with GST-DIC is reduced following treatment of the cells with LDN-0006568 and LDN-0007588 ( Fig. 7A , lanes 6 and 10). Moreover, compounds LDN-0007065 and LDN-0014068 nearly abolished the A4V SOD1 coprecipitated with GST-DIC ( Fig. 7A , lanes 7 and 11). The amount of the coprecipitated mutant SOD1 was analyzed by ImageJ software (National Institutes of Health, Bethesda, MD) and is shown in Figure 7B . There was no difference in the amount of GST-DIC pulled down in the different treatment conditions ( Fig. 7A , second panel). The expression levels of GST-DIC and FLAG-SOD1 in raw total cell extracts under different compound treatments were consistent ( Fig. 7A , two bottom panels), suggesting that differences in the amount of SOD1 pulled down with GST-DIC were not due to effects on protein expression. Compounds were tested in three independent experiments.
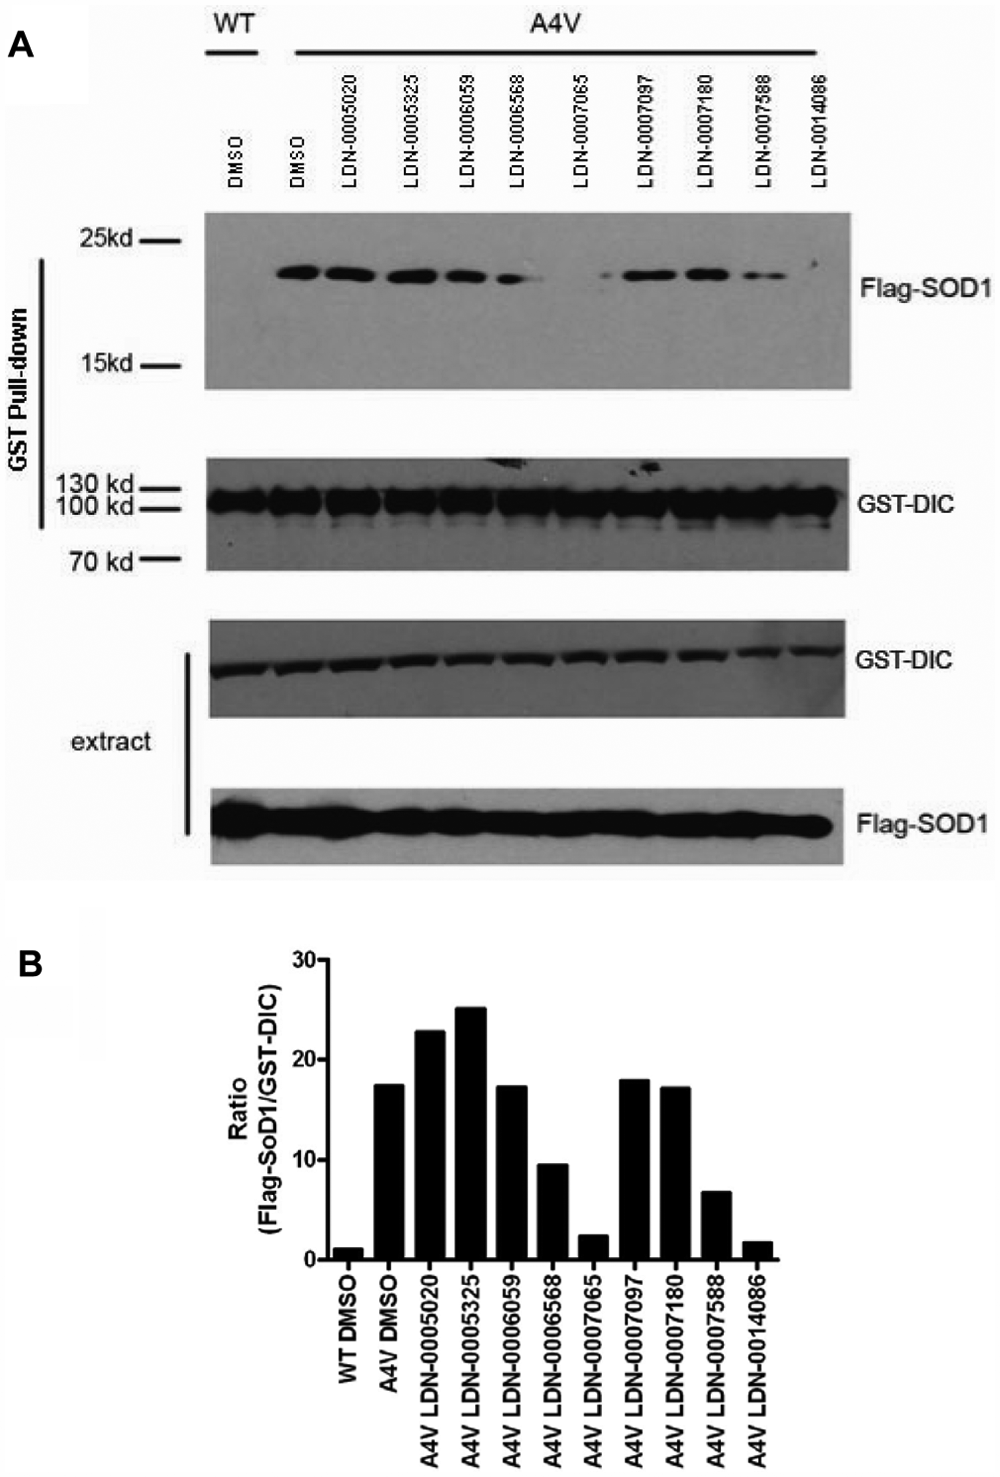
Evaluation of compounds by coprecipitation of wild-type (WT) or A4V mutant superoxide dismutase 1 (SOD1) with glutathione S-transferase (GST)–dynein intermediate chain (DIC). (A) Cells coexpressing FLAG-SOD1 and GST-DIC were treated with the lead compounds at 20 µM for 24 h. Cells were harvested and the cell lysates were subjected to GST pull-down and anti-FLAG antibody for Western blotting to detect whether A4V SOD1 was coprecipitated with GST-DIC upon the treatment of the compounds (top panel). Second panel reflects consistent expression level in the amount of GST-DIC immunoprecipitated, and the third and fourth panels reflect the consistent expression levels of GST-DIC and FLAG-SOD1 in total cell extracts. Experiments were performed three independent times with similar results. (B) Quantitation of the precipitated FLAG-SOD1 signal by ImageJ software. The precipitated GST-DIC serves as a normalization control.
One concern when screening for inhibitors of protein-protein interactions can be the specificity of disruption by the molecule. A molecule that generally disrupts protein interactions is of little interest. To evaluate the specificity of the disruption by our lead molecules for the interaction between mtSOD1 and the dynein complex, we performed a parallel experiment to determine if the molecules disrupted the dynein complex itself by assessing the interaction between GST-DIC and the dynactin subunit p150Glued. If a molecule disrupts protein-protein interactions through a generic mechanism or by an effect on GST-DIC that is unrelated to the mtSOD interaction, it is expected that this would be evident by a reduction in p150Glued pulled down by GST-DIC. The results in Figure 8 demonstrate that compounds LDN-0014086, LDN-007588, and LDN-007065 reduce the amount of A4V SOD that is pulled down by GST-DIC without any impact on p150Glued. The compound LDN-0006059 did not reduce A4V pull-down by GST-DIC as in previous experiments and was included as a negative control.
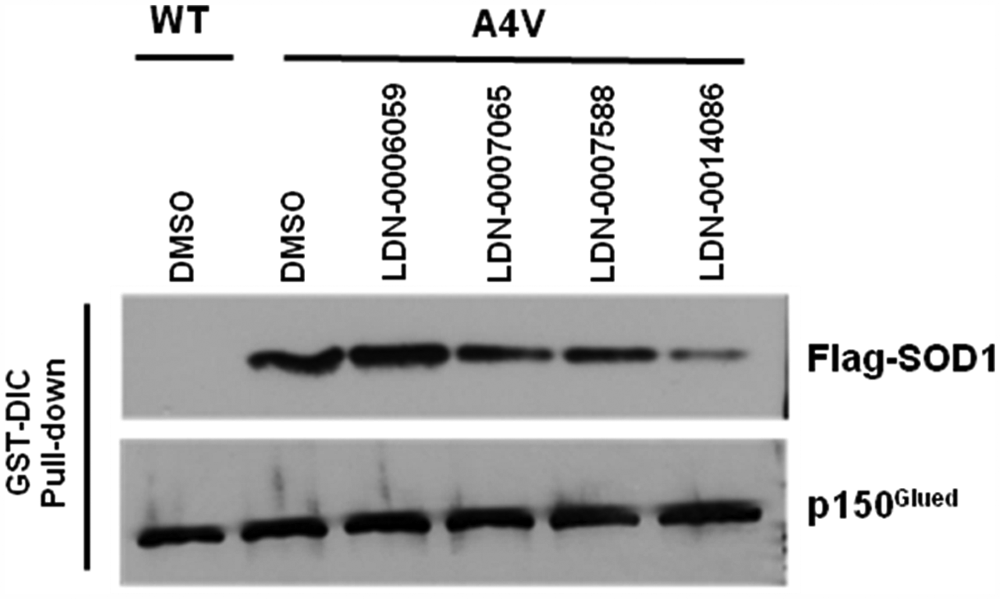
Effect of compounds on coprecipitation of FLAG–superoxide dismutase 1 (SOD1) or p150Glued by glutathione S-transferase (GST)–dynein intermediate chain (DIC). Cells coexpressing FLAG-WT-SOD1 (lane 1) or FLAG-A4V-SOD1 (lanes 2–6) and GST-DIC were treated with DMSO (lanes 1–2) or the lead compounds at 20 µM (lanes 3–6) for 24 h. Cells were harvested and the cell lysates were subjected to GST pull-down. Anti-FLAG antibody or anti-p150Glued antibody was used to detect whether FLAG-A4V SOD1 or p150Glued coprecipitated with GST-DIC.
These results confirm that these compounds identified from the primary pilot screen are effectively disrupting the interaction between mtSOD1 and the dynein complex in the cells either directly or indirectly but do not disrupt the interaction of GST-DIC and p150Glued. In addition, these experiments add another level of complexity that was not present in the primary screening assay in that the live cells were exposed to the compounds rather than treating cell lysates. For those compounds having inhibitory effects in the cell lysate assay format but not in the cellular validation assay, cell impermeability may be one reason for the lack of efficacy in the whole cells. In all, we validated four compounds from HTS to satisfy the initial aim to inhibit the interaction between mtSOD1 and dynein complex in the cells and provide starting points for future chemical optimization for tools for further characterizing the biology and for potential future therapeutics.
Discussion
Eleven compounds were identified as hits in the pilot screen and confirmed in dose-response evaluations. Nine of them were further tested in the confirmatory coprecipitation assay for disruption of the mtSOD1-DIC interaction in live cells. Four of the compounds also disrupted the protein-protein interaction in this assay format, confirming the results of the primary screen and demonstrating cellular efficacy.
Our initial approach to identify small-molecule inhibitors of the aberrant interaction between mtSOD1 and the dynein complex was to express the proteins in separate cells and reconstitute the interaction by mixing the lysates together. However, experiments testing this approach demonstrated that the interaction was not present under these conditions. This suggests either that the interaction only occurs within the live cell and may not be a direct protein-protein interaction or that other cellular components are critical to the interaction. On the basis of these results, we revised our assay to coexpress either the FLAG-tagged mutant or WT SOD1 and the GST-tagged DIC in the same cells and measure the interaction within a single lysate. In addition, we evaluated two mutations in SOD1 for interaction with dynein: G93A and A4V. Although both mutations produced an interaction with dynein as measured in an ELISA assay, the signal window using the A4V mutation was greater, and therefore we proceeded to develop the HTS assay using cells expressing the A4V mtSOD1. For HTS, we adapted the assay to the PerkinElmer AlphaLISA format to detect inhibitors of the mtSOD1-DIC interaction in a homogeneous assay. We tested two compound addition protocols, the first in which the cells were plated in a 384-well format and treated with compounds overnight prior to lysis and the second in which the cells were lysed in bulk, the lysate distributed to the 384-well assay plates, and the compounds incubated with lysate. Treating the whole cell with compound would allow for detection of molecules that affected targets upstream of the protein-protein interaction, but the variability in the results with this procedure was too high to be used in HTS. Therefore, we prepared bulk lysates and screened for small molecules that disrupted the interaction between mtSOD1 and GST-DIC. By treating lysates with compound, we directed our efforts toward identifying molecules that disrupt the already formed mtSOD1-DIC interaction rather than preventing the protein-protein interaction or enhancing degradation of the protein complex.
Three of the molecules that disrupt the interaction between dynein and A4V SOD1 do so without affecting the GST-DIC/p150Glued interaction in the cellular pull-down experiments ( Fig. 8 ). This suggests that these molecules do not generally disrupt protein-protein interactions by denaturing proteins or some other nonspecific mechanism. These molecules also do not exhibit broad promiscuity in the 60+ cellular/enzyme targets they have been tested against in other screening programs in our group (data not shown), supporting the conclusion that their effect is not due to general disruption of protein-protein interactions but is specific to the interaction between the dynein complex and mutant SOD1. However, the molecular target of the compounds remains unknown. The compounds may be binding directly to mutant SOD1 or to GST-DIC in a manner that disrupts the interaction or to an as yet unidentified member of the complex by which this interaction occurs. Identifying the molecular target of the compounds will be a critical component of future studies to characterize the compounds and may provide unique insight into the nature of the aberrant interaction and related pathology. In addition, these newly identified molecules will be evaluated for rescue of the detrimental effects of the mtSOD1-DIC interaction on axonal transport as a potential novel therapeutic mechanism for ALS.
In total, these results demonstrate that HTS for molecules that disrupt a protein-protein interaction in cell lysates can identify inhibitors that are efficacious in the live cell. This approach will be useful when targeting protein-protein interactions in a complex if only a few of the components of the complex are known.
Footnotes
Acknowledgements
We thank Dr. Greg Cuny for his help in evaluating the structures of the hits from the screen.
The authors declared no potential conflicts of interest with respect to the research, authorship, and/or publication of this article.
The authors disclosed receipt of the following financial support for the research and/or authorship of this article: This work was supported by NIH NINDS grants U24NS049339 (to M.G.) and support from the Harvard NeuroDiscovery Center (to M.G.) and R01NS049126 (to H.Z.) and NIA grant R21AG032567 (to H.Z.).