
Abstract
Class O forkhead box (FOXO) transcription factors are downstream targets of the PI3K/AKT signaling pathway, which is upregulated in many tumors. AKT phosphorylates and inactivates FOXO1 by relocating it to the cytoplasm. Because FOXO1 functions as a tumor suppressor by negatively regulating cell cycle progression and cell survival, compounds that promote FOXO1 localization to the nucleus might have therapeutic value in oncology. Here the authors describe the identification of such compounds by using an image-based, high-content screen. Compounds that were active in retaining FOXO1 in the nucleus were tested to determine their pathway specificity and isoform specificity by using high-content assays for Rev and FOXO3, respectively.
Introduction
C
By inhibiting cell cycle progression and/or initiating apoptosis, FOXOs are able to regulate cell proliferation. FOXOs regulate cell cycle progression by inducing cell cycle arrest at the G1/S transition of the cell cycle, either through their target genes p27KIP1 and the Rb family member p1305,6 or by repressing the expression of cyclins D1 and 2.7,8 To trigger apoptosis, active FOXO transcription factors must localize to the nucleus, where they can transactivate the Bcl-2 family member Bim, Fas ligand, and BCL-6.9,10 The roles of FOXOs in controlling the cell cycle and triggering apoptosis are especially relevant to cancer and suggest that FOXOs may be suitable anticancer therapeutic targets.
FOXO transcription factors are subject to extensive regulation through posttranslational modification. Most notably, the PI3K-AKT pathway negatively regulates FOXOs via phosphorylation at three highly conserved AKT sites, corresponding to Thr24, Ser256, and Ser319 in human FOXO1. 11 Once FOXOs are phosphorylated by AKT, they associate with 14-3-3 proteins, resulting in decreased DNA binding and translocation from the nucleus to cytoplasm via CRM1. 11 Individual FOXOs are also substrates for CK1, DYRK, SGK, CDK2, IKKB, JNK, cGK1, and MST1. 12 Interestingly, phosphorylation of FOXO by MST1 results in lowered affinity for 14-3-3 proteins and promotes retention of FOXO in the nucleus. 13
FOXO members are also subject to methylation, acetylation, and ubiquitination. FOXO1 is methylated by PRMT1, which appears to antagonize mouse FOXO1 phosphorylation by AKT at Ser253 (corresponding to Ser256 of human FOXO1). 14 FOXO turnover is due to ubiquitination by SCF via interaction of FOXO and Skp2. The ubiquitinated FOXO is then degraded by the proteasome. Acetylation of FOXO by CBP and/or PCAF is counterbalanced by the deacetylase Sirt1. Acetylation is generally believed to downregulate FOXO, but this question is still under investigation and discussion. 12
One of the most obvious ways to regulate transcription factors such as FOXO1 is by transporting them from the cytoplasm across the nuclear membrane and thus bringing them closer to their target genes in the nucleus. Therefore, we used an image-based assay to identify small molecules that increased the number of FOXO1 molecules in the nucleus. Of approximately 17,000 compounds tested in the primary screen, 96 were selected for further validation and specificity testing by testing them against FOXO3, another member of the FOXO family of transcription factors, and the unrelated Rev protein. Selected compounds showing specificity for FOXO1, FOXO3, or both, with respect to Rev, were ordered as fresh powder and their activities retested. Maintenance of FOXO activity by its accumulation in the nucleus leads to tumor suppression. 13 Elucidating the proteins and pathways targeted by these compounds will provide new insight into FOXO regulation and potentially reveal new anticancer therapeutic targets.
Materials and Methods
Cell lines and cell culture
U2OS cells stably expressing FOXO1-GFP, FOXO3-GFP, or Rev-GFP (hereafter referred to as U2OS/FOXO1-GFP, U2OS/FOXO3-GFP, and U2OS/Rev-GFP, respectively) were obtained from Thermo Fisher Scientific (Lafayette, CO) and cultured according to the manufacturer’s instructions. Cells were grown in Dulbecco’s minimum essential medium + Glutamax (Invitrogen, Grand Island, NY) supplemented with 10% fetal bovine serum (Hyclone, Logan, UT), 0.5 mg/mL Geneticin (Invitrogen), 100 IU/mL penicillin (Invitrogen), and 100 µg/mL streptomycin (Invitrogen) and incubated at 37 °C in 5% CO2. For passage or cell seeding onto assay plates, cells were detached from T75 flasks (Corning, Corning, NY) by using 0.05% trypsin/EDTA (Invitrogen).
Nuclear translocation assay
The assay protocol is outlined in Table 1 . Compounds were screened by using an integrated screening system constructed by HighRes Biosolutions (Woburn, MA) that had an integrated Matrix Wellmate microplate dispenser (Thermo Fisher Scientific, Matrix products, Hudson, NH) to dispense reagents, and a Pin Tool (HighRes Biosolutions) with surface-coated pins (V & P Scientific, San Diego, CA) to transfer compounds. The integrated system also included a microplate orbital shaker (Big Bear Automation, Santa Clara, CA), a V-Spin plate centrifuge (Agilent Automation Solutions, Santa Clara, CA), Liconic STR plate incubators (LiCONiC Instruments, Boston, MA), a plate washer (BioTek, Winooski, VT), an EnVision plate reader (PerkinElmer, Waltham, MA) to measure luminescent signals, a CellWoRx automated fluorescence imager (Applied Precision, Issaquah, WA) to acquire images, and robot arms (Staübli, Duncan, SC) to transfer plates from instrument to instrument. Cells were seeded into black, clear-bottom, tissue culture–treated, 384-well plates (Corning) at a density of 2000 cells per well in 50 µL growth medium. Plates were then briefly vortexed and centrifuged to aid with both the release of trapped air bubbles and facilitate the even dispersion of cells within each well. The cells were allowed to attach and grow overnight in a Liconic STR240 incubator at 37 °C, 5% CO2, 95% relative humidity.
Nuclear Translocation Assay Protocol
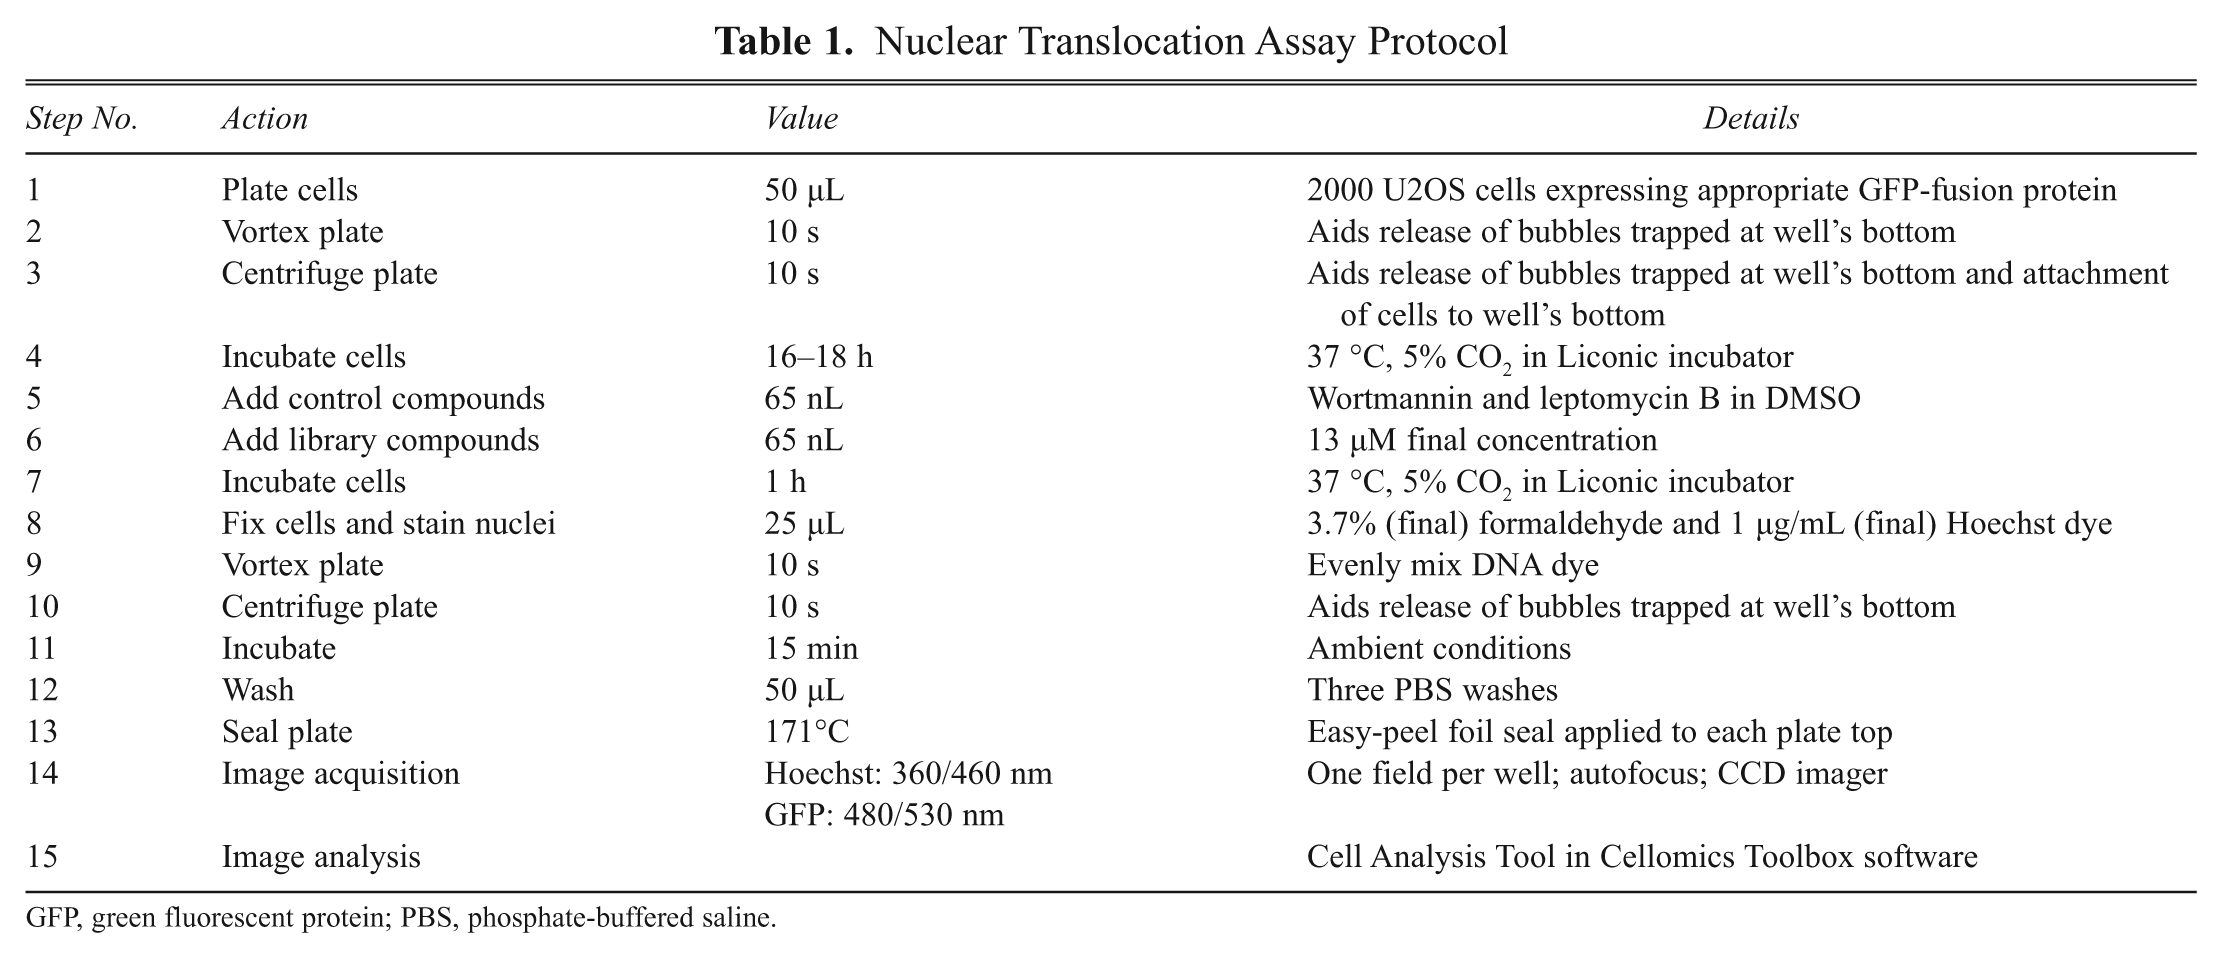
GFP, green fluorescent protein; PBS, phosphate-buffered saline.
The next day, control compounds and test compounds were added by pin transfer. Each transfer of compound (65 nL) from the stock plates to the assay plate resulted in a final concentration of 13 µM (0.13% final DMSO concentration). Plates were incubated for 1 h before 25 µL of fix + stain solution was added to each well. Fix + stain solution contained 11.1% formaldehyde and 3 µg/mL Hoechst 33342 (Sigma-Aldrich, St. Louis, MO) in phosphate-buffered saline (PBS) adjusted to pH 7.2, giving a final concentration of 3.7% formaldehyde and 1 µg/mL Hoechst dye in the assay plate. Cells were incubated in fix + stain solution at room temperature for 30 min. Plates were then washed three times with PBS and sealed with easy-peel foil using a plate sealer (Agilent Automation Solutions).
Images were acquired by using a CellWoRx automated fluorescence imager using a 10× objective lens. Image acquisition began immediately and continued for up to 20 h per screening run (each plate was imaged for approximately 30 min, and the largest screening run contained 40 plates). Green fluorescent protein (GFP) and Hoechst signals were stable during the entire image acquisition period (see Results section). One field in the center of each well was selected and imaged through both blue and green channels, yielding 768 images per plate. Because resolution was of secondary concern, 2 × 2 pixel binning was used to reduce file size, increase signal intensity, and slightly shorten image acquisition time.
Image and data analysis
All image analysis was performed using the Cell Analysis Tool within the Thermo Fisher Cellomics vHCS Toolbox (Pittsburgh, PA). For each field, the Hoechst staining of DNA was used to define the nucleus, and a ring concentric to the nucleus was used to define a cytoplasmic region of the cell. The inner diameter of the ring was created by dilating the nuclear circle by 1 pixel on each side, and the thickness of the ring was 3 pixels. For each cell, the GFP’s fluorescence intensity in the nuclear circle and cytoplasmic ring was measured and divided by the respective area of the cell to yield the average fluorescence intensity for each region. We evaluated nuclear GFP intensity alone, the ratio of nuclear-to-cytoplasmic GFP fluorescence intensity, and the difference between cytoplasmic and nuclear GFP fluorescence intensity (i.e., Nuc-Cyto) and found that the (Nuc-Cyto) method yielded the most consistent results (data not shown). Therefore, (Nuc-Cyto) was used to quantitate nuclear localization. Most fields contained 500 to 1000 cells; fields containing fewer than 50 cells were not considered for analysis.
Data output from Cellomics was reformatted and analyzed using RISE software as previously described. 15 All data were normalized to intraplate controls to determine the percent of activity. Interplate and intraplate variation and patterning were monitored for quality control purposes during each screening run.
For analysis of individual cell responses as a function of their location in the well, four adjacent images were acquired, covering the entire well surface area. The nuclear localization (Nuc-Cyto) and position were recorded for each cell in the image. These data were analyzed in Spotfire (Somerville, MA) to create a visualization illustrating both the position and FOXO-GFP localization on a cell-by-cell basis. Data from three identically treated wells were aggregated for Figure 3d .
Oxidative stress assay
Cells were plated and treated with compounds as described for the nuclear translocation assay. After 30 min of incubation with the test compound, dihydroethidium (DHE; Sigma-Aldrich) was added to each well, and cells were incubated for an additional 30 min. Fix + stain solution was then added to each well (as described above), and the plate was washed with PBS and sealed before imaging to detect Hoechst staining and ethidium intensity in the nucleus. Image analysis was performed by measuring the average nuclear ethidium signal per cell in each field.
Dose–response analysis
Compounds were arrayed into 384-well plates in either 1:2 or 1:3 series dilution steps, as specified. The highest concentration tested was 100 µM (final concentration in assay well). Compounds were tested in triplicate to generate variable-slope, sigmoidal dose–response curves by using GraphPad’s Prism 4 software (La Jolla, CA).
Luciferase reporter assay
We used Fugene 6 transfection reagent (Roche Diagnostics, Basel, Switzerland) according to the supplier’s recommendations to transfect 50% confluent T75 flasks of U2OS/FOXO1-GFP cells with a reporter plasmid (6 µg) containing three tandem repeats of the insulin response sequence (3 × IRS) upstream of the firefly luciferase gene (3 × IRS-luc). 16 After overnight incubation, cells were trypsinized, counted, and plated to 384-well, white, clear-bottom, tissue culture–treated microplates (Corning; 8000 cells in 25 µL media per well). Compounds were added by pin tool, as described before, and incubated for 4 h, unless otherwise noted. After incubation, plates were cooled to room temperature before 25 µL of HTS Steady-lite (PerkinElmer) was added to each well, and the plates were incubated for an additional 15 min. Luminescence was then measured by using an EnVision plate reader (PerkinElmer), and data were normalized to in-plate controls.
Compound libraries tested
Two sublibraries of the St. Jude compound collection were included in the primary screen. The first collection (i.e., bioactive compound library) consisted of 5600 compounds (approximately 3200 unique) purchased from Sigma-Aldrich, Microsource (Gaylordsville, CT), and Prestwick (Illkirch, France) chemical companies. This library contained chemicals, including some U.S. Food and Drug Administration–approved drugs, with previously described biological activity. The second collection consisted of 13,000 predicted kinase inhibitors purchased from ChemBridge (San Diego, CA). Random sampling of compounds for quality control purposes showed that they were, on average, more than 95% pure (data not shown). Additional information about the compounds screened is available upon request. Hit compounds were reordered in powder form and dissolved in DMSO for secondary screening.
All compounds were dissolved in DMSO at 10 mM and stored at −20 °C before screening. Compounds were arrayed in 384-well polypropylene plates; columns 1, 2, 13, and 14 were left empty for controls.
Results
FOXO1 nuclear translocation assay
To identify chemical regulators of FOXO1, we developed an image-based, high-content assay to measure the nuclear translocation of FOXO1-GFP in U2OS cells. The functionality of FOXO1-GFP was tested by comparing the activation of a FOXO1-responsive luciferase reporter (3 × IRS-luc) in U2OS cells with or without FOXO1-GFP. Cells expressing FOXO1-GFP showed higher luciferase activity (data not shown), suggesting that FOXO1-GFP is functional.
Under normal growth conditions, FOXO1-GFP was primarily located in the cytoplasm ( Fig. 1a ). During assay development and screening, two positive-control compounds were used to enrich FOXO1-GFP in the nucleus ( Fig. 1a ). First, wortmannin, a potent inhibitor of phosphoinositide 3–kinase (PI3K), was used to determine the level of nuclear localization in response to small molecules acting upstream of FOXO1. Second, leptomycin B, an inhibitor of Exportin1 (CRM1)–dependent nuclear export, was used to determine the level of FOXO1 that might accumulate in the nucleus in response to compounds nonspecific for the FOXO1 pathway. For FOXO1, the results from both control compounds were similar ( Fig. 1b ).
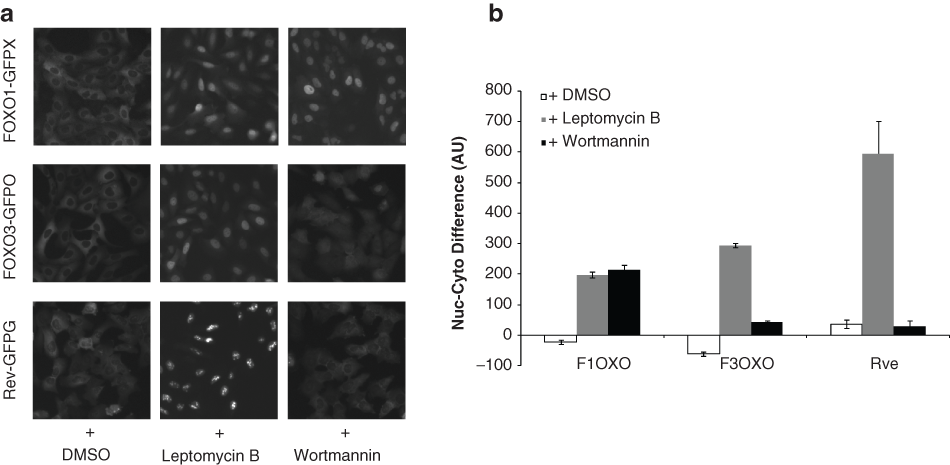
Nuclear translocation of FOXO1, FOXO3, and Rev. (
To address the specificity of compounds affecting FOXO1 nuclear translocation, we used U2OS cell lines stably expressing GFP fusions either to another FOXO family member, FOXO3, or to the unrelated Rev protein, an RNA-binding HIV-1 regulatory protein. FOXO3 is regulated by many of the same upstream regulatory pathways that regulate FOXO1, but comparison of response in these two cell lines allowed us to determine if any compounds preferentially increased FOXO1 levels in the nucleus. Similar to FOXO1 and FOXO3, Rev contains nuclear localization signal and nuclear export signal sequences and shuttles between the nucleus and the cytoplasm, but Rev nuclear import/export is not regulated by the PI3K/Akt pathway like FOXO1 and FOXO3. Therefore, small molecules affecting FOXO1, FOXO3, and Rev localization are likely acting through a nonspecific mechanism (e.g., inhibiting the CRM1 nuclear export machinery), and compounds affecting only FOXO1 and FOXO3 are more likely acting on a target upstream of those proteins. All three cell lines were tested using wortmannin and leptomycin B to measure their response to small-molecule treatment ( Fig. 1a ). As expected, FOXO1-GFP and FOXO3-GFP nuclear localization was increased by treatment with either positive-control compound, and Rev-GFP nuclear localization was increased only by treatment with leptomycin B ( Fig. 1b ).
Primary screening
Screening took place during two independent screening runs for the two sublibraries tested. Average throughput for each assay was approximately 10 plates per hour and approximately 2 plates per hour for image acquisition. Because imaging throughput was so much lower than that of the rest of the assay, GFP signal stability was tested directly to ensure that there was no significant fluorescence degradation as plates were queued for imaging. Images of positive and negative control-treated wells were acquired immediately and after 1 or 7 days of storage at room temperature. The difference between nuclear and cytoplasmic signal changed slightly over time, but the Z prime (Z′) was consistently high ( Fig. 2a , b ). During high-throughput screening (HTS), Z′ based on DMSO as the negative control (low signal) and wortmannin as the positive control (high signal) was consistently high throughout the runs ( Fig. 2c ). The percent activity was calculated relative to the controls by using the following formula: Activity (%) = 100% × [compound signal – low signal]/[high signal – low signal]), and 124 compounds with greater than 30% activity were identified for further examination ( Fig. 2d ). The images corresponding to these wells were manually inspected to remove obvious false positives from this tentative hit list, reducing the number of compounds to 96. Because the assay plates had been stored at 4 °C, the wells in question were able to be manually inspected to determine the extent of FOXO1 nuclear translocation.
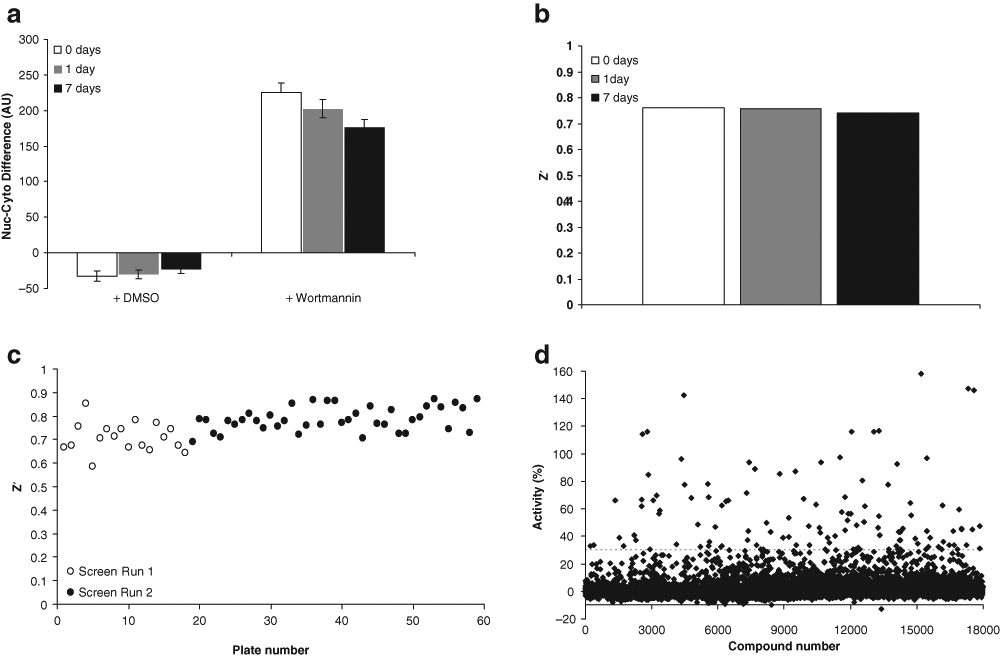
Screen performance. Green fluorescent protein (GFP) signal (
During manual inspection of tentative hits, four categories of cells were observed. First, in some cases, the images were slightly out of focus, causing the image analysis software to give an inaccurate estimate of nuclear versus cytoplasmic localization of FOXO1-GFP. Second, treatment with some compounds affected cell shape, causing them to round up. In contrast to the normally very flat U2OS cell shape, this rounded cell phenotype caused false positives because the cytoplasm and nucleus were not as spatially distinct in these cases. These two categories were considered false positives and were not further tested.
The third category contained wells with mixed populations of what appeared to be responding cells and nonresponding cells. This mixture could be caused by biological or technical reasons (see below), and in most cases, these compounds were allowed to pass as hits from the primary screen. The fourth category contained wells with nuclear translocation of FOXO1 to the nucleus in nearly all cells, without any evidence of poor focus or cell rounding. There were 96 compounds in the third and fourth categories; these were considered hits worth testing further. Among these compounds were wortmannin and LY294002, two members of our bioactive compound library, previously known to inhibit PI3K upstream of FOXO1. Identification of wortmannin and LY294002 as hits validated the ability of this assay to identify chemical regulators of FOXO1 nuclear translocation among a library of variable compounds.
Heterogeneity of response
In most high-throughput assays, detailed information about the response of individual cells is not possible, and only an average response for a population of cells is measured. High-content assays, whether image based or flow cytometry based, allow for the investigation of cellular response of each individual cell within the population. This feature is particularly valuable when subpopulations of interest exist (such as cells in a certain stage of the cell cycle or cells exhibiting some other biomarker of interest). In addition, image-based high-content screening gives spatial information (position) of each cell, allowing for the analysis of differential response based on location within the well.
Wells containing cells of varying response levels might be the result of an interesting biological phenomenon or simply the result of a technical artifact. In the first case, the localization of FOXO1 to the nucleus might be varied in some cases because the tested compound is effective only in cells in a particular biological state. For example, a given compound might cause FOXO1 translocation in cells at a certain cell cycle stage, or the translocation might be dependent on the extracellular environment (the cell’s proximity to other cells and/or to the edge of the well).
Alternatively, the varied response within a well might stem from technical reasons. In this assay, compounds dissolved in DMSO were delivered by pin tool to cells in an aqueous growth medium. This delivery method might result in an increased concentration at the point of delivery (i.e., where the pin gently touches the well bottom; Fig. 3a ). This elevated local concentration of compound might yield an increased response in cells near the point of delivery as compared to cells in other regions of the well.
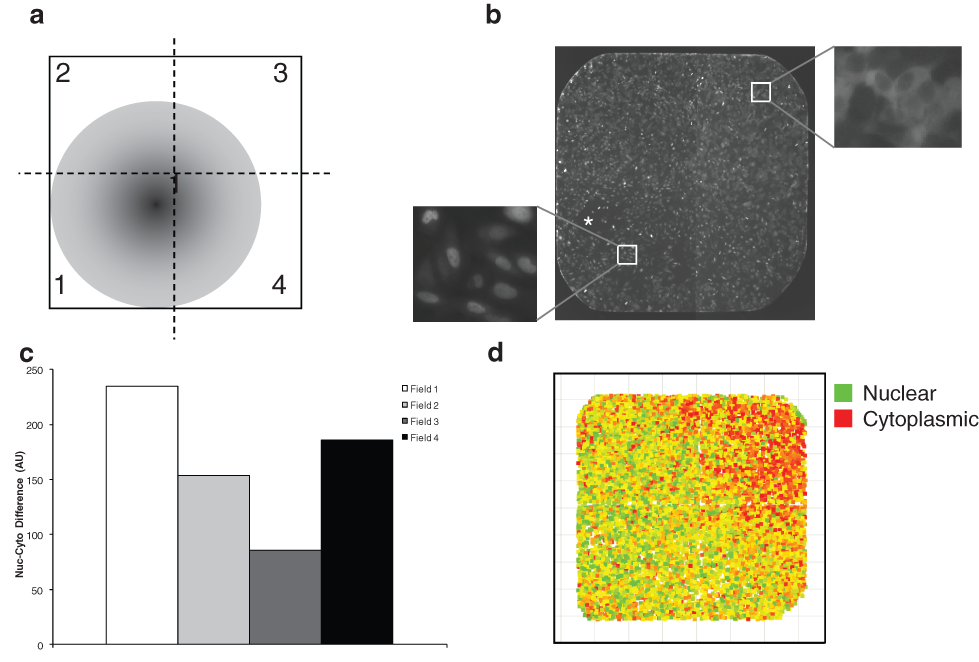
Compound gradient causes variable response within each well. (
To test the possibility that using the pin tool for compound delivery might create a concentration gradient within the well and thus a gradient of response across the cells within the well, we measured the response of each quadrant of the well. After treatment with an approximate EC50 concentration (0.5 nM) of the control compound wortmannin, four images were acquired; together, these images cover the entire well surface ( Fig. 3b ). Nuclear translocation was calculated for the cells in each of the four images, correlating to the four quadrants of the well ( Fig. 3c ).
Cells near the point of compound delivery increased nuclear FOXO1 compared to cells in distal regions of the well ( Fig. 3b , d ). Breaking the well up into the four fields taken during image acquisition quantitatively showed the variance across the well ( Fig. 3c ). This effect was not observed in wells in which the wortmannin concentration was at least 10-fold higher or lower than its EC50 (data not shown). This suggests that, although there is a gradient effect within each well, it is only likely to generate a heterogeneous response if the compound is being used in amounts approximating its EC50. In the primary screen, compounds were screened at 13 µM.
Specificity testing of FOXO1 hits
Hits from the primary screen might be caused by chemical regulation of targets specific to FOXO1, such as those in the PI3K/AKT pathway, or nonspecific targets, such as proteins involved in general nuclear export. To distinguish between these possibilities, the 96 compounds that increased FOXO1 nuclear localization were cherry-picked from the screening collection, diluted into 384-well compound plates (i.e., dose–response plates), and screened in triplicate for their ability to translocate another GFP-labeled FOXO family member, FOXO3-GFP, as well as the unrelated Rev-GFP. Thirty compounds showing specificity for FOXO1, FOXO3, or both, with respect to Rev, were ordered as fresh powder from the appropriate chemical supplier. These compounds were then dissolved and checked for purity by mass spectrometry. The fresh compounds were retested for activity in the FOXO1, FOXO3, and Rev translocation assays ( Table 2 ). To our surprise, one of the compounds, SJ000128583, showed virtually no activity during confirmatory screening using fresh powder compound.
Specificity Testing of Compounds Affecting FOXO1-GFP’s Nuclear Translocation
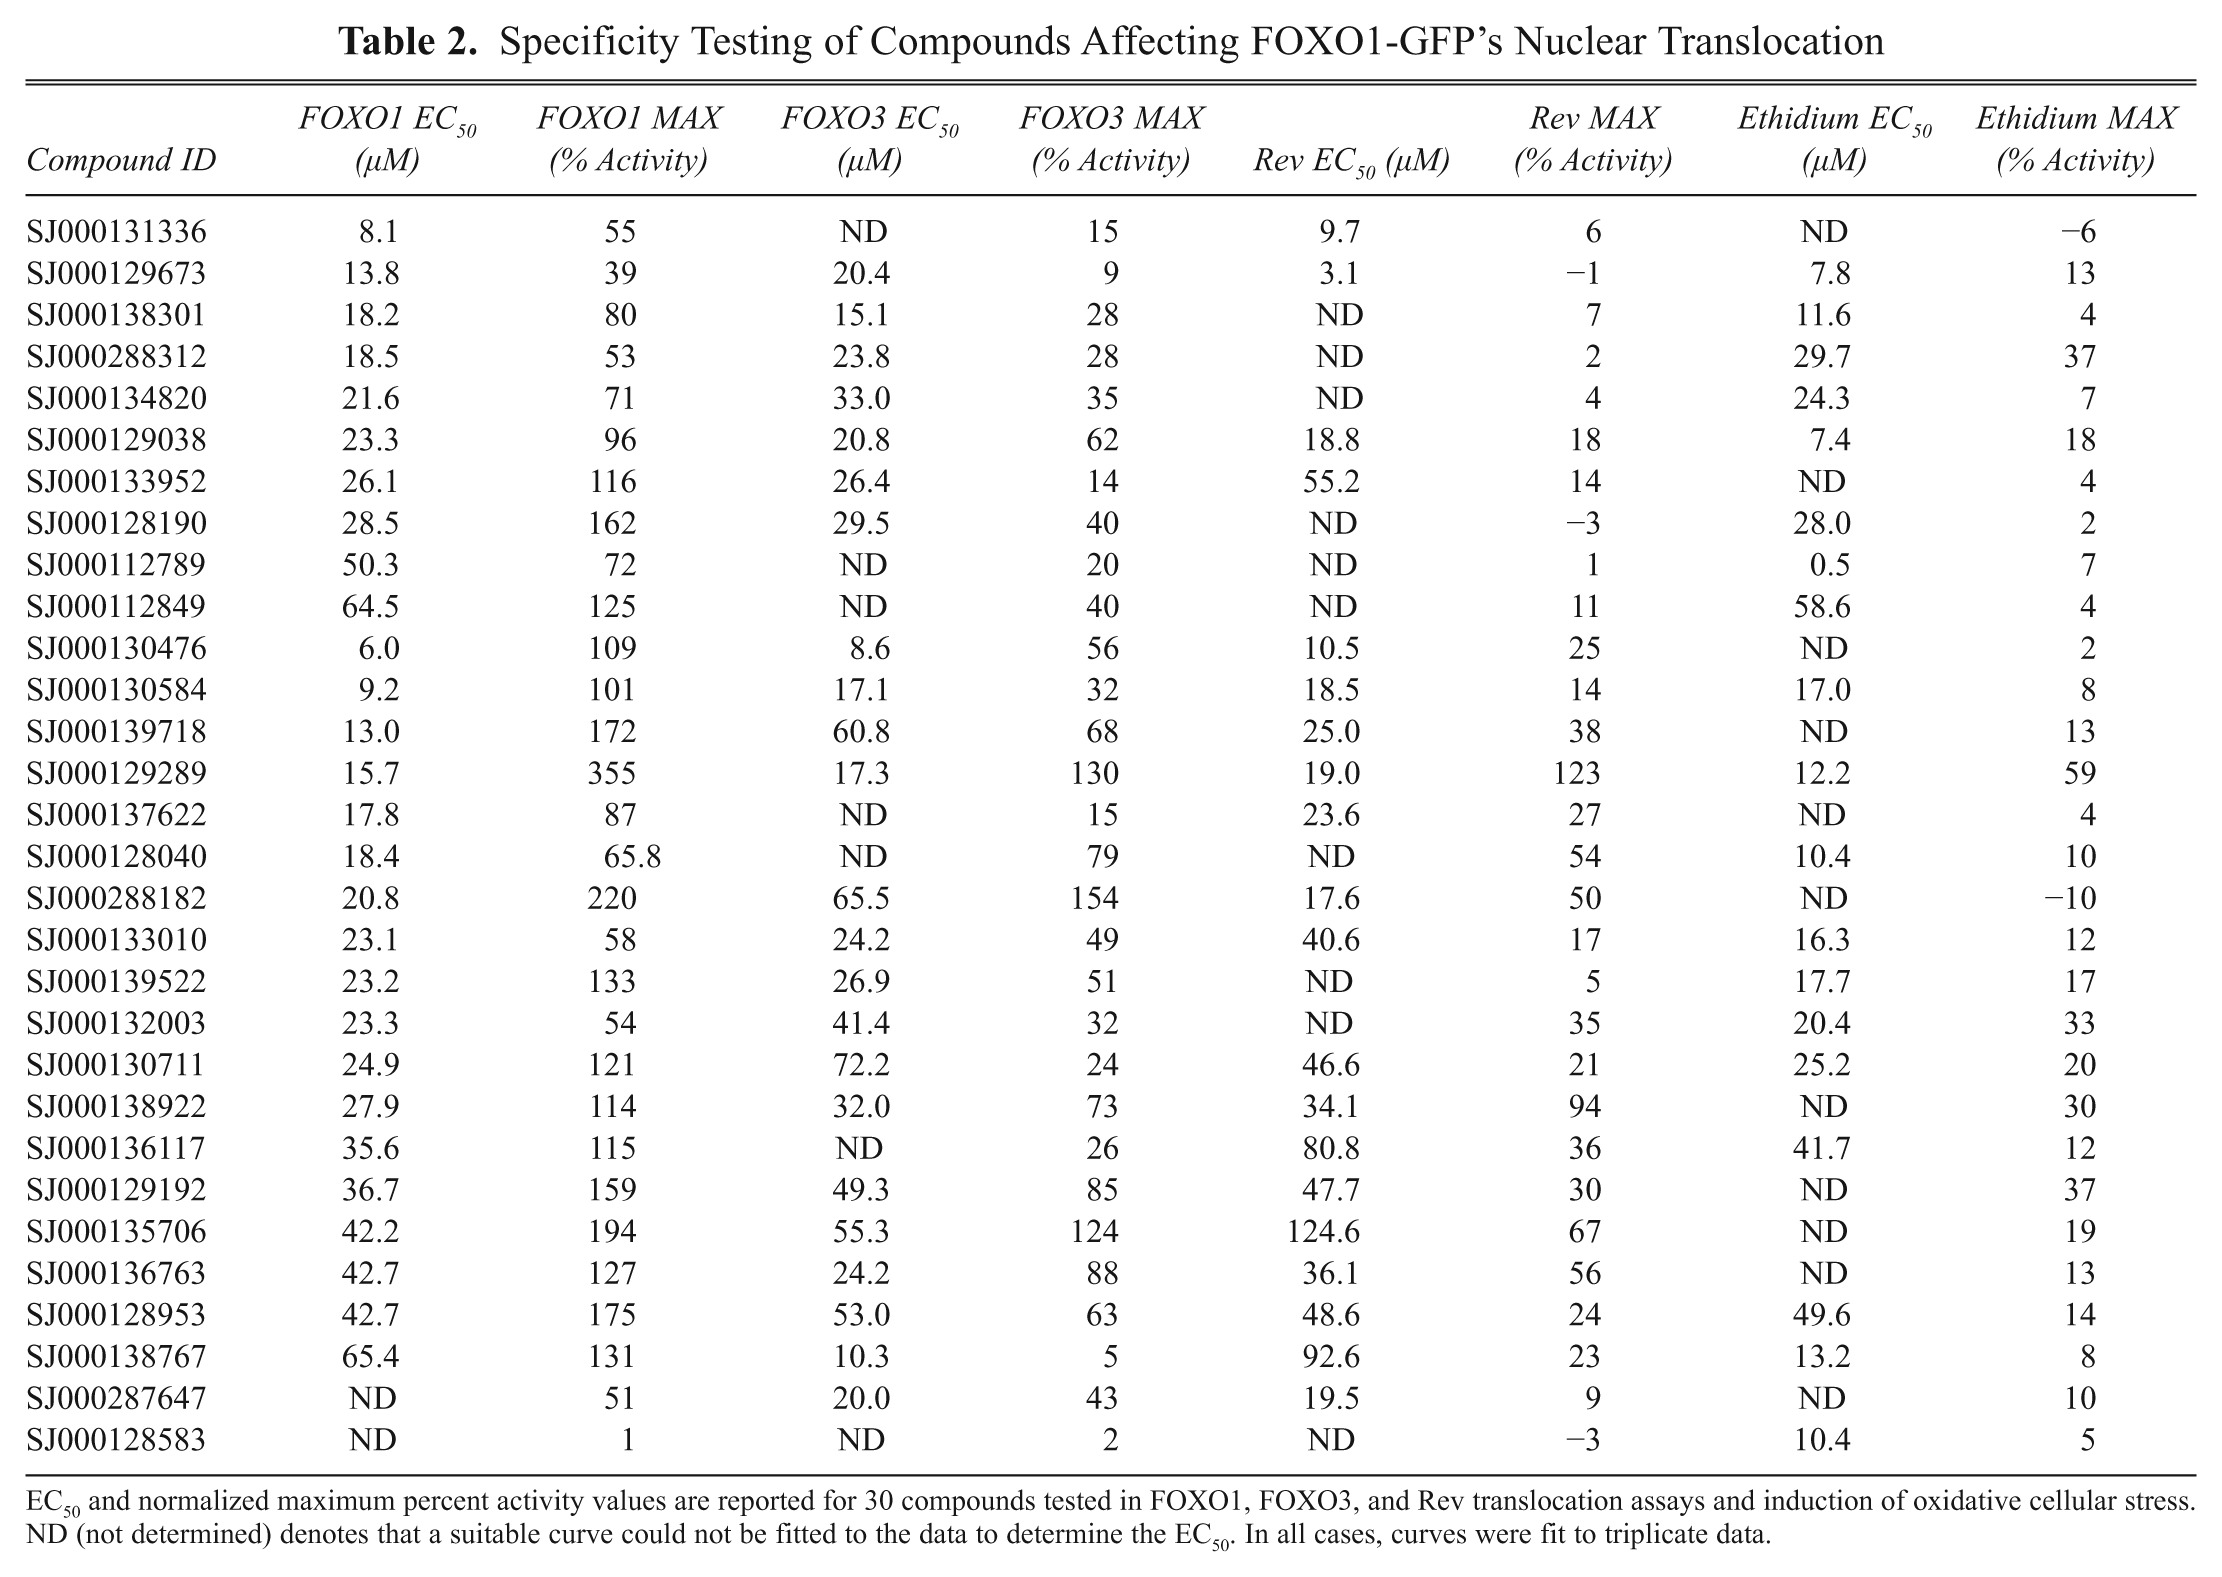
EC50 and normalized maximum percent activity values are reported for 30 compounds tested in FOXO1, FOXO3, and Rev translocation assays and induction of oxidative cellular stress. ND (not determined) denotes that a suitable curve could not be fitted to the data to determine the EC50. In all cases, curves were fit to triplicate data.
When comparing these three cell lines, we faced the challenge of comparing data from different cell lines that were normalized to different control compounds (wortmannin for FOXO1 and FOXO3 and leptomycin B for Rev). We previously observed that FOXO3 showed a drastic difference between wortmannin treatment (a compound known to act upstream of FOXO proteins) and leptomycin B (a compound that enriches FOXO3 in a nonspecific manner) ( Fig. 1b ). To overcome the challenge of comparing data from different cell lines that were normalized to different control compounds, all data were normalized to DMSO (low signal) and leptomycin B (high signal) prior to comparing the responses of the different proteins.
Because FOXO1 nuclear translocation can be triggered by the induction of oxidative stress, hits from the primary screen were also tested for their ability to induce cellular oxidative stress within the 1-h window used in the primary screen using DHE. In oxidatively stressed cells, DHE is rapidly converted to ethidium, a common fluorescent DNA dye ( Fig. 4 ). 17 Compared to treatment with 0.5% hydrogen peroxide, the tested compounds showed very little indication of inducing cellular oxidative stress after compound treatment. Of the 30 compounds tested, 24 had less than a 20% response as measured by ethidium staining ( Table 2 ), suggesting that, although low levels of oxidative stress were induced in some cells, this stress was not a driving factor for FOXO1 nuclear translocation. Table 2 lists the EC50 and maximal activity (% activity) levels of these compounds for FOXO1, FOXO3, and Rev nuclear translocation as well as the results of DHE nuclear staining.
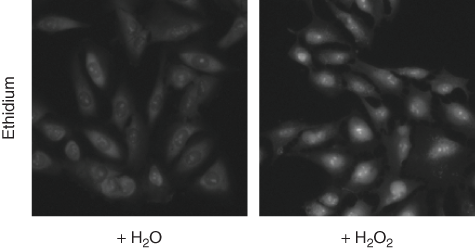
Cellular oxidative stress. Conversion of dihydroethidium (DHE) to ethidium was used to measure cellular oxidative stress. U2OS/FOXO1-GFP cells were treated with 0.1% H2O2 or an equivalent volume of water (negative control) 30 min prior to staining, fixation, and image acquisition.
Functional testing of FOXO1 hits
Members of the FOXO family of transcription factors are critical in regulating genes in a number of essential pathways, including cell cycle progression, metabolism, apoptosis, and stress resistance. To determine whether translocation of FOXO1 to the nucleus after compound treatment resulted in increased transactivation activity, we used the 3 × IRS-luc reporter in a luciferase assay. Because FOXO1 activation can also trigger apoptosis, which would result in decreased reporter activity due to dying cells, we identified the earliest time point when FOXO1 activity could be reliably detected ( Fig. 5a ). We found that treating the cells for at least 3.5 h was sufficient to produce a significant response (p < 0.001).
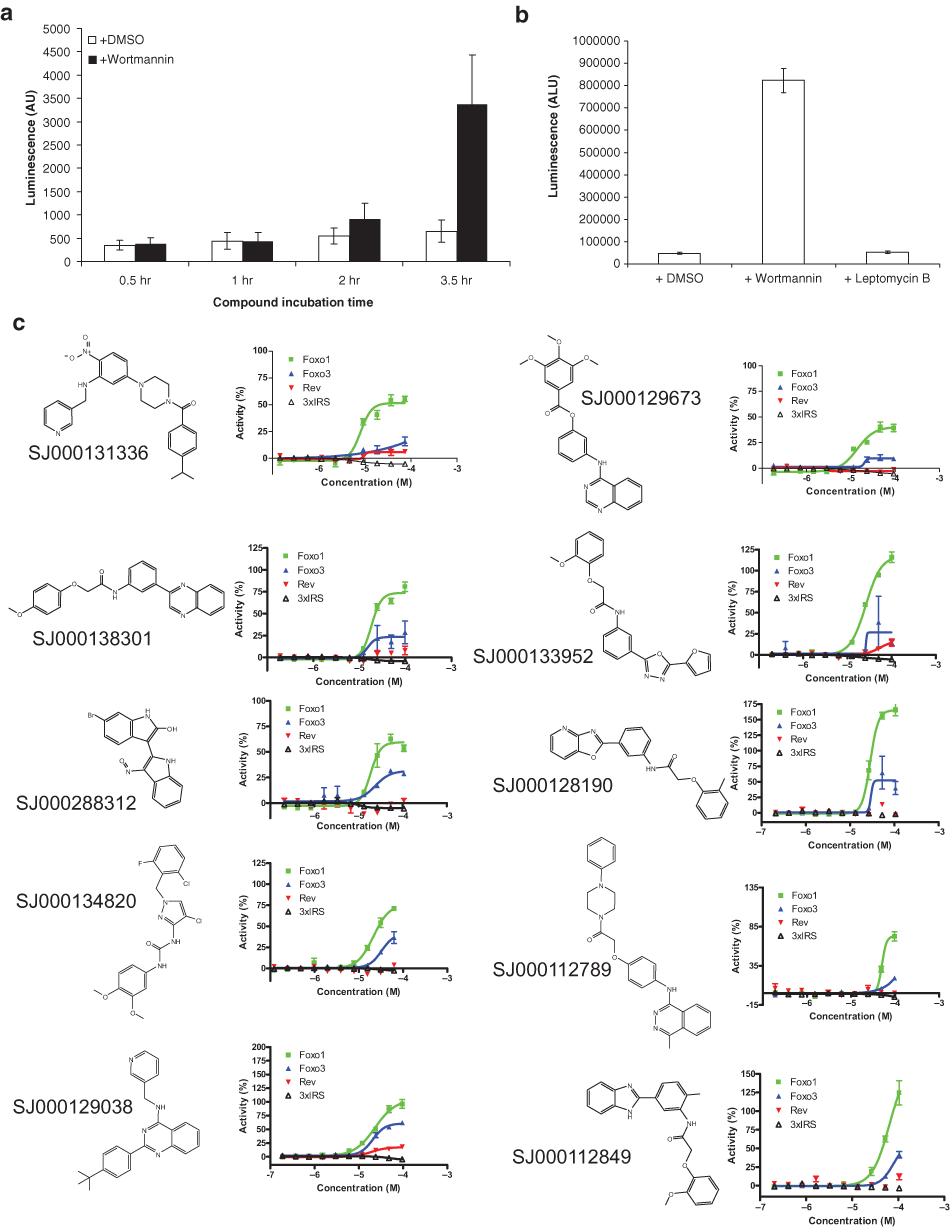
Transcriptional activation of a FOXO1-responsive promoter reporter gene (3 × IRS-luc). (
We next tested 10 representative compounds (the first 10 compounds in Table 2 ) that exhibited specificity for FOXO1 or FOXO1 and FOXO3 nuclear translocation for transactivation activity. After 4 h of incubation with wortmannin, there was a strong response, demonstrating that the assay was functioning ( Fig. 5b ). None of the 10 representative compounds tested were able to activate FOXO1 transactivation activity even when nuclear FOXO1 levels were elevated ( Fig. 5c ). In fact, a slight decrease in signal was observed when many of the compounds were used at higher concentrations, suggesting that cell death may have been decreasing luciferase signal even at the 4-h time point. In addition, prior to the addition of the reporter assay reagent (see Materials and Methods), nuclear translocation of FOXO1 was verified by fluorescence microscopy (data not shown). These results suggest that nuclear translocation is only one mechanism by which FOXO1 activity is regulated. This result is consistent with previous work showing the poor correlation between FOXO1 localization and transactivation activity. 18
Discussion
FOXO1 is an attractive and challenging target for small-molecule screens because of its many roles in regulating cell signaling. This study describes the development of an image-based high-content screen to identify small molecules that enrich FOXO1 in the nucleus. Using wortmannin and leptomycin B as controls, we optimized cell plating and compound treatment conditions, fixation, DNA staining, image acquisition, and image analysis to develop a robust assay suitable for HTS. During the screening of the bioactive compound library, we identified two previously characterized compounds acting upstream of FOXO1 (wortmannin and LY294002), validating the ability of this assay to identify active compounds.
During screening, the primary confounding factors were focal problems during image acquisition (leading to inaccurate image analysis), compounds that affected cell shape, and compounds that gave a heterogeneous response among the cells in a single well. Achieving accurate focus is a challenge for all automated, image-based assays. The CellWoRx system uses image-based autofocus, which is slow but offers the advantage of actually focusing on the objects of interest independent from other variables (e.g., plate thickness). Fluorescent debris on the plate or within the well occasionally misguides the system to focus on objects other than cells; however, careful handling of the plates decreases the chance of contamination by debris and reduces this effect. Compounds that affect the cytoskeleton and cell shape also lead to false positives in this assay. Although we did not address this problem directly, staining either the entire cell (i.e., using a whole-cell stain) or only the membrane should provide a simple way to measure average cell size, diameter, and other parameters to determine gross changes in cell shape that might lead to false positives. Multiplexing cell morphology measurements with Nuc-Cyto difference of the protein of interest would allow compounds affecting cell shape to be removed from the hit list, lowering the false-positive rate.
The last confounding effect was the heterogeneity of response observed within a single well. This variance in response might be rooted in the subtle differences between neighboring cells within a single well. Through multiparametric analysis of several biomarkers, one might eventually gain clues into the biological underpinnings of this phenomenon. Another possible cause of variance within a well is the uneven distribution of compound within the well as delivered by pin transfer from a DMSO stock. We tested this hypothesis directly and observed a clear gradient of response for the positive control compound, wortmannin. This suggests that assays measuring a relatively rapid response to compound treatment (i.e., short incubation time with tested compounds) might be particularly susceptible to such a chemical gradient found immediately after compound addition. Other cell-based assays tested with 1- to 3-day compound treatment did not show a detectable gradient of response (data not shown).
The phenomenon of unequal compound distribution is particularly relevant to high-content screens in which typically only a small subarea of the well is sampled (i.e., imaged) as the assay end point. The distance between the point of compound delivery and the area of image acquisition could lead to false negatives or false positives in a primary screen, as well as slightly shifted dose–response curves during follow-up testing. During the primary and secondary assays, we acquired a single image in the center of the well. Because the pin delivered compound to the left of and a little below center (see Fig. 3b , asterisk), the image we acquired was neither right on top of nor extremely far away from the point of compound delivery. In the center of the well where we acquired the image, the gradient is at its least extreme (see Fig. 3d ), and the effect of compound gradient on our results is therefore minimal. The compound gradient caused by the pintool might have an effect on the results, but this potential effect can be minimized technically by appropriately selecting the location for image acquisition. It is expected that compound delivery by pipetting or acoustic nanodrop dispensing could drastically reduce the impact of this effect.
This screen successfully identified compounds affecting FOXO1’s nuclear translocation. Interestingly, no functional activity (i.e., transcriptional activation of FOXO1-responsive promoter) was observed for these compounds. Of the previous studies examining chemical regulators of FOXO1 or FOXO3 translocation, only one has compared localization of these proteins to their transcriptional activation. 18 Unterreiner et al. 18 showed a poor correlation between hits from image-based screening of FOXO3 activators and those from reporter-based screening. Kau et al. 19 identified inhibitors of FOXO1 nuclear export, but whether these inhibitors affect the transcriptional activity of FOXO1 was not reported. Our data are consistent with the interpretation that nuclear translocation is only one mechanism of FOXO1 regulation. In fact, even when localized to the nucleus, FOXO1 is not necessarily active, suggesting that it is subject to multiple layers of regulation and that spatial regulation (i.e., shuttling into/out of the nucleus) is only one of these.
Footnotes
Acknowledgements
We thank Dr. Kun-Liang Guan for providing 3 × IRS-luc, Dr. Kip Guy for reviewing the manuscript and valuable discussions, Dr. Cherise Guess for editing the manuscript, Cindy Nelson for assistance with compound management, Dr. Andrew Lemoff for analytical chemistry support, and other members of the Chen group for reagents and their valuable discussions. This work was supported by the American Lebanese Syrian Associated Charities, St. Jude Children’s Research Hospital, and National Cancer Institute grant P30CA027165.
References
Supplementary Material
Please find the following supplemental material available below.
For Open Access articles published under a Creative Commons License, all supplemental material carries the same license as the article it is associated with.
For non-Open Access articles published, all supplemental material carries a non-exclusive license, and permission requests for re-use of supplemental material or any part of supplemental material shall be sent directly to the copyright owner as specified in the copyright notice associated with the article.