
Abstract
Anaplastic lymphoma kinase (ALK) when expressed as a fusion protein with nucleophosmin (NPM) has been implicated as a driving oncogene in a subset of lymphomas. Recent reports of ALK expression in a number of other cancers have raised the possibility that an ALK inhibitor may benefit patients with these diseases as well. In a campaign to identify and develop a selective ALK inhibitor, 2 assays were devised to measure the phosphorylation of tyrosine residue 1604 of ALK (pY1604 ALK). Amplified Luminescent Proximity Homogeneous Assay (AlphaScreen®) and phosflow platforms were used to detect modulation of pY1604 ALK to determine the relative potency of a set of small-molecule inhibitors. Prior to making use of these assays in diverse settings, the authors attempted to ensure their equivalence with a direct comparison of their performance. The pY1604 ALK assays correlated well both with each other and with assays of ALK enzyme activity or ALK-dependent cell proliferation. The AlphaScreen® assay was amenable to automation and enabled rapid, high-throughput compound assessment in an NPM-ALK-driven cell line, whereas the phosflow assay enabled the authors to characterize the activity of compounds with respect to their impact on targeted enzymes and pathways. Results show that both AlphaScreen® and phosflow ALK assays exhibited diverse characteristics that made them desirable for different applications but were determined to be equally sensitive and robust in the detection of inhibition of pY1604 ALK.
Keywords
Introduction
T
Recently, multiple technologies have been developed that exploit the sensitivity and specificity of phospho-specific antibodies to establish assays that can quantify changes in phospho-analytes. One such technology is the phosflow platform, which combines phospho-specific antibodies with flow cytometry to facilitate the investigation of signaling pathways in ways not amenable to other platforms, including the analysis of single cells within heterogeneous samples and the detection of multiple analytes within a single cell and/or sample. 7
Other platforms employ 2 antibodies in a sandwich-based approach to provide assay specificity and sensitivity. The enzyme-linked immunosorbent assays (ELISA), Meso Scale Discovery (MSD®), and AlphaScreen® technologies detect and quantify a phospho-signal to monitor the dynamic modulation of a phosphoprotein with sufficient sensitivity and reliability to support high-throughput assay development. 8-10 The AlphaScreen® assay has the additional advantage of being a homogeneous assay in which reagents are added sequentially without any wash steps. It has been used in high-throughput screening (HTS) campaigns to assess the activity of small molecules targeted against kinases and cell surface receptors implicated in disease states. 10,11
One such drug target is anaplastic lymphoma kinase (ALK). The ALK protein is aberrantly expressed in approximately 60% of anaplastic large cell lymphomas (ALCLs) as a fusion protein resulting from its translocation to the 3′ end of the nucleophosmin (NPM) gene. 12 The resulting fusion protein is a constitutively active kinase with transforming properties. 13,14 Inhibition of ALK may therefore be of therapeutic value for this subset of ALCL and may offer benefit for a number of additional tumor types described as containing an aberrantly regulated form of ALK. 15-17
The current study compared the ability of the AlphaScreen® and phosflow assay platforms to determine the relative cellular potency of a number of structurally diverse small-molecule ALK inhibitors by monitoring the autophosphorylation of ALK at pY1604. 18-20 Although both the AlphaScreen® and phosflow assays measured the same cellular response, each had distinct properties that suited them to different applications within the drug development process. Prior to making use of these assays in diverse settings, we wanted to ensure their equivalence with a direct comparison of their performance. This comparison was conducted using a set of compounds that were identified in a high-throughput screen using recombinant ALK enzyme and a peptide substrate. The compounds were then run through a workflow comprising a suite of assays designed to understand different aspects of a compound’s properties, including potency, selectivity, and cellular penetration. For this purpose, a cell line derived from an ALCL tumor was employed. Karpas-299 cells express the NPM-ALK fusion protein and are dependent on the constitutive kinase activity of ALK for growth and proliferation. 13,21,22 Our results demonstrated that the performance of the AlphaScreen® and phosflow assays was comparable in both accuracy and reliability when compared to each other and also to supplementary assays in the compound assessment workflow.
Materials and Methods
ALK inhibition in enzyme assay
The cytoplasmic domain (amino acids 1058-1620) of wild-type human ALK (NP_004295.2) was expressed in SF9 cells as an N-terminal glutathione S-transferase (GST) fusion protein. Kinase activity of the purified protein was assessed using a Lance® time-resolved fluorescence resonance energy transfer (TR-FRET) assay. The kinase reaction was performed in a 384-well microplate using 2 nM enzyme in 20 mM HEPES (pH 7.5), 0.05% bovine serum albumin (BSA), 2 mM dithiothreitol (DTT), 10 mM MgCl2, 1 µM peptide substrate (Biotin-Ahx-EQEDEPEGIYGVLF-OH), 23 and adenosine triphosphate (ATP) at 40 µM (the apparent Km). The reaction was allowed to proceed for 90 min at room temperature and was then terminated with 20 mM EDTA in 50 mM Tris (pH 7.5), 100 mM NaCl, 0.05% BSA, and 0.1% Tween-20. Phosphorylation of the peptide substrate was detected using the Lance® detection reagents streptavidin-allophycocyanin (SA-APC) and Eu-W1024 antiphosphotyrosine antibody (PT66) from PerkinElmer Life Sciences (Waltham, MA). The plates were read on a RUBYstar plate reader (BMG LABTECH, Cary, NC) with an excitation wavelength of 320 nm. Emission was monitored at 615 nm and 665 nm, with increased emission at 665 nm indicating peptide phosphorylation. IC50 values for compounds were calculated from the magnitude of signal in the 665-nm emission channel.
Cell culture
ALK-positive Karpas-299 and Sup-M2 cells (DSMZ, Braunschweig, Germany) and ALK-negative HT cells (ATCC, Manassas, VA) were maintained at a cell density below 2 × 10⁶ cells/mL in RPMI-1640 medium supplemented with 1× penicillin-streptomycin-glutamine (Invitrogen, Carlsbad, CA) and 10% fetal bovine serum from Sigma-Aldrich (St. Louis, MO) for the AlphaScreen® assay or Thermo Fisher Scientific (Waltham, MA) for phosflow. 24-26 Assays were performed on cells in log-phase growth (density between 0.8 × 10⁶ and 1.2 × 10⁶ cells/mL).
AlphaScreen® Surefire® cell-based pY1604 ALK assay
Cells (10,000 per well) were dispensed in 3 µL of assay buffer (Hank’s balanced salt solution [HBSS], 0.1% BSA, 5 mM HEPES, pH 7) into a 384-well low-volume white-walled polystyrene Proxiplate (PerkinElmer Life Sciences) containing 1 µL of compound in 2% DMSO (98% assay buffer) per well for a final reaction concentration of 0.5% DMSO. Cells were incubated with compound at room temperature for 1 h prior to analysis of pY1604 ALK.
Measurement of pY1604 ALK was performed with an AlphaScreen® SureFire® assay kit (PerkinElmer Life Sciences). Cells were lysed with 1 µL of 5× lysis buffer and incubated at room temperature for 10 min. Next, 4.3 µL of a mix containing antibodies, reaction buffer, activation buffer, and protein A acceptor beads (PerkinElmer Life Sciences) was added as per the manufacturer’s protocol. Plates were incubated overnight in the dark at room temperature before the addition of 1.8 µL of streptavidin donor bead mix and an additional hour of incubation at room temperature. Automated addition of cells, lysis buffer, and detection reagents was performed with a FlexDrop bulk liquid dispenser (PerkinElmer Life Sciences). Plates were read on an EnVision Reader (PerkinElmer Life Sciences) using the AlphaScreen® assay setting. IC50 values for compounds were calculated from the magnitude of signal in the 570-nm emission channel and were expressed as the mean of 2 or 3 replicates.
Phosflow cell-based pY1604 ALK assay
Cells (250,000 per well) were plated in 100 µL of culture medium in 96-well plates. Each well contained 1 µL of test compound at 100× concentration in 100% DMSO, for a final reaction concentration of 1% DMSO. Cells and compound were incubated at 37°C for 1 h, fixed with 4% paraformaldehyde for 30 min at room temperature, and then permeabilized overnight with ice-cold 90% MeOH at −20°C. Primary antibodies pY1604 ALK rabbit polyclonal antibody, pY473 AKT (D9E) rabbit monoclonal, and pY705 STAT3 (3E2) mouse monoclonal antibody from Cell Signaling Technologies (Danvers, MA) and total ALK (5A4) mouse monoclonal antibody from Abcam (Cambridge, MA) were added for 1 h at room temperature. Fluorescein isothiocyanate- or phycoerythrin-conjugated secondary antibodies (Invitrogen) were added for 30 min at room temperature. Washes with BSA-containing stain buffer (Becton-Dickinson, San Jose, CA) were performed between all steps. Data from 10,000 cells per well were acquired on an LSRII flow cytometer using the FACSDiva software (Becton-Dickinson). IC50 values for compounds were calculated from the median fluorescence intensity and expressed as the mean of 2 or 3 replicates.
Analysis of cell proliferation
Cell proliferation was assessed using a quantitative cell viability assay. Cells (10,000 per well) were plated in 100 µL of culture medium in 96-well plates. Each well contained 1 µL of test compound at 100× concentration in 100% DMSO, for a final incubation concentration of 1% DMSO. Cells and compound were incubated at 37°C. After 48 h, 100 µL of CellTiter Glo™ (Promega, Madison, WI) reagent was added to each well according to the manufacturer’s instructions. Plates were read on an EnVision instrument using the ultra-sensitive luminescence setting. IC50 values for compounds were calculated from the magnitude of luminescence signal and were expressed as the mean of 3 replicates.
Small-molecule inhibitors
The ALK inhibitor PF-2341066 was synthesized internally. This compound had activity of 0.004, 0.078 to 0.228, and 0.227 µM in the enzyme, cell-based, and proliferation assays, respectively, comparable to that published by Christensen and colleagues. 19 The assay low control used in all studies was an Amgen proprietary compound with low nM potency in the ALK enzyme assay. Its potency in the enzyme, cell-based, and proliferation assays for ALK was 0.005, 0.048, and 0.304 µM, respectively.
Data analysis
The signal generated in the presence of compounds versus that in the presence of DMSO vehicle alone (high control) was calculated using the following formula: % of control (POC) = (signal with compound – average low)/(average high – average low) × 100, where the low control was defined by the response observed with 1 µM (proliferation and phosflow assays) or 50 µM (enzyme and AlphaScreen® assays) of a tool ALK inhibitor proprietary to Amgen. For all assays, the concentration of the low control was above the IC90 concentration. For IC50 value determination, POC values were fitted to a 4-parameter equation using the mFit nonlinear regression algorithm. 27 The potency of most compounds was assessed once in each assay, with 2 or 3 replicates per point in each experiment. In instances in which a compound was run more than once in an assay, its mean IC50 value was used for further analyses.
Recombinant ALK enzyme and AlphaScreen® assay results were analyzed using Screener® version 7.0 from Genedata AG (Basel, Switzerland). Phosflow and cellular proliferation data were analyzed using ActivityBase XE from IDBS (Guildford, UK). The same curve-fitting parameters and data quality control criteria were applied in both analysis platforms.
Results
Correlation between ALK enzyme assay and cell-based pY1604 ALK assays
To establish a structure-activity relationship (SAR), compounds were analyzed using a workflow comprising enzyme, cell-based, and functional assays. A set of 230 compounds were screened in an HTS campaign using the ALK enzyme assay. Of these, 151 compounds had an IC50 value of less than 1 µM. These compounds were then run concurrently through the 2 cell-based platforms being compared, the phosflow and AlphaScreen® assays. The raw data from a representative compound (enzyme IC50 = 0.005 µM, cell-based IC50 = 0.021-0.032 µM) are shown in Figure 1 to illustrate the signal window and compound concentration range tested. Enzyme IC50 values were compared to the compounds active in each cell-based assay (117 and 128 for the phosflow and AlphaScreen® assay, respectively). The Pearson product-moment correlation was used to understand the relationship between these assays. As shown in Figure 2A , compound potencies generated in either the AlphaScreen® (Pearson’s r = 0.77, p < 0.0001) or phosflow assays (Pearson’s r = 0.89, p < 0.0001) were highly correlated to potency in the enzyme assay.
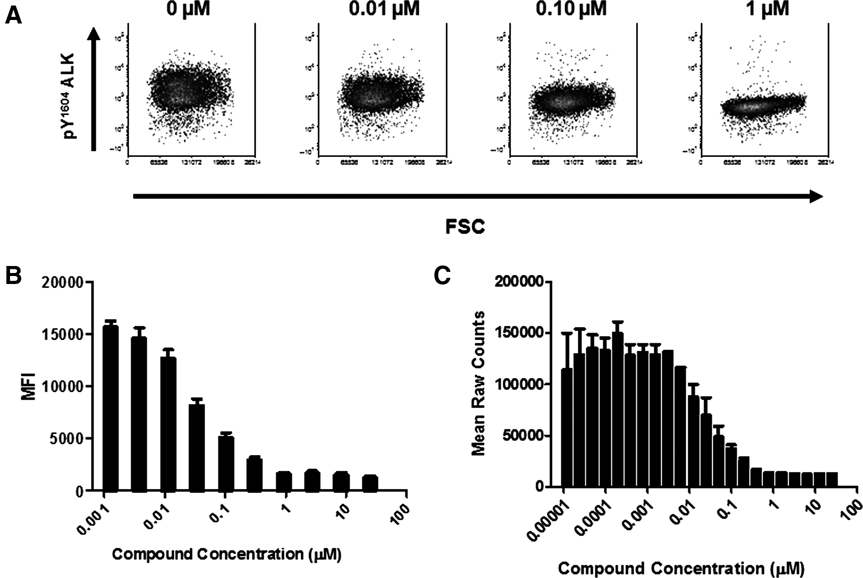
Inhibition of the pY1604 ALK signal as detected in the phosflow and AlphaScreen® assays. (
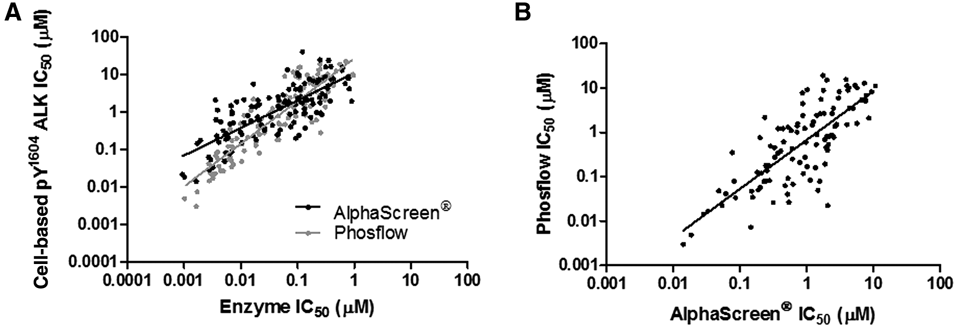
Correlation of IC50 values in the ALK enzyme assay and the cell-based pY1604 ALK assays. (
Correlation between phosflow and AlphaScreen® pY1604 ALK assays
A comparison of the performance of individual compounds between cell-based platforms was conducted on the 106 compounds that yielded IC50 values in both the AlphaScreen® and phosflow pY1604 ALK assays. The assays performed comparably, with similar signal-to-background ratios (9 and 10 for AlphaScreen® and phosflow, respectively) and robust Z′ scores (0.66 and 0.68 for AlphaScreen® and phosflow, respectively). Figure 2B shows that IC50 values correlated very well between the 2 pY1604 ALK assays, with a calculated Pearson’s r value of 0.78, p < 0.0001. In addition, the magnitude of the difference in IC50 values between assays was also assessed. The majority of compounds (85 of 106) had less than a 5-fold difference between assays. These data support the high degree of correlation illustrated by the Pearson’s calculation.
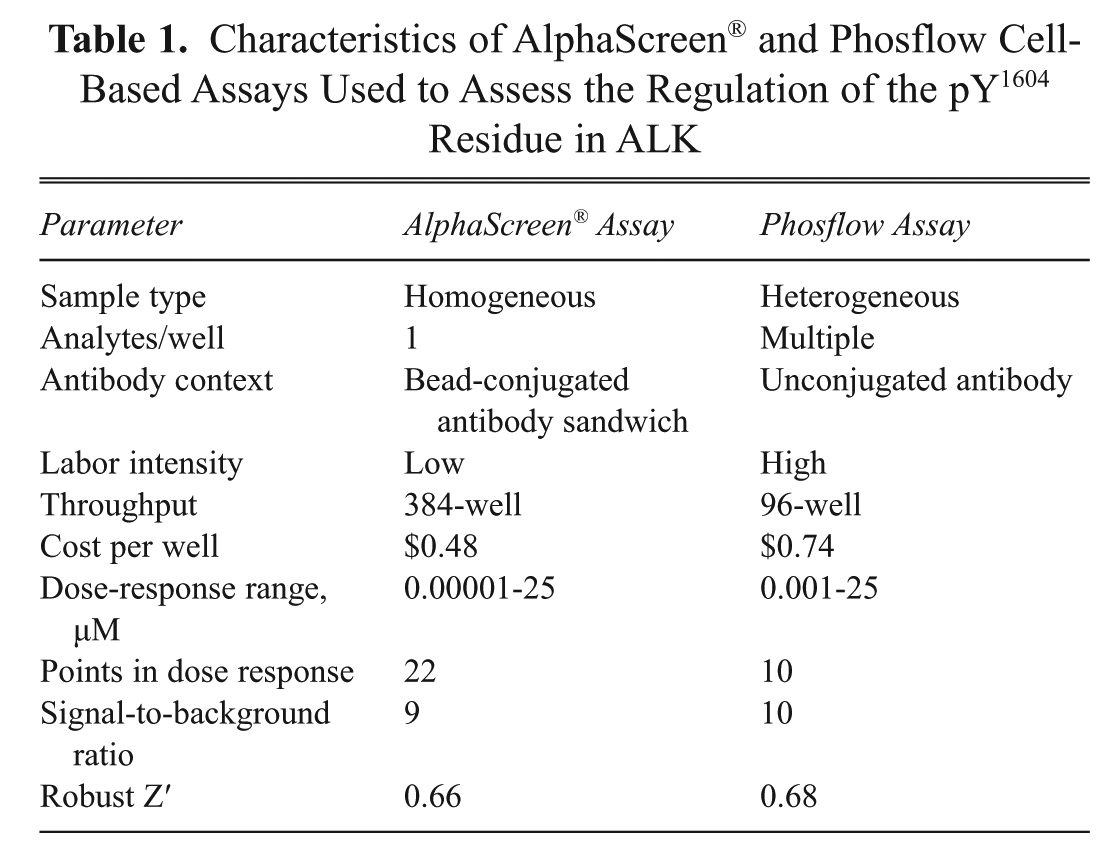
Although most tested compounds generated an IC50 value in both the AlphaScreen® and phosflow assays, some compounds generated dose-response curves that resulted in a calculable IC50 value in only 1 of these assays. As outlined in Table 1 , the AlphaScreen® and phosflow assays were performed in different formats (96 vs. 384 well), and as such, the concentration range tested and the number of data points collected to calculate an IC50 value were different. Compounds with potency near either end of the tested concentration range may have been more accurately assessed in an assay with more data points as depicted for 2 representative compounds in Figure 3 . Supporting this finding is the observation that the majority of compounds that generated an IC50 value in the 22-point AlphaScreen® but not in the 10-point phosflow concentration range were weakly potent with IC50 values greater than 5 µM. Similarly, interassay differences in the lower limit of detection may explain why a compound with a very potent IC50 value as measured in the AlphaScreen® assay did not return an IC50 value when run in the phosflow assay’s more limited concentration range. Furthermore, we noted that several compounds exhibited structural features that resembled biotin. These compounds demonstrated enzyme-independent activity in the AlphaScreen® assay (data not shown). After exclusion of these biotin mimetics, compound potencies were generally well correlated between the 2 cell-based pY1604 ALK assays.
Characteristics of AlphaScreen® and Phosflow Cell-Based Assays Used to Assess the Regulation of the pY1604 Residue in ALK
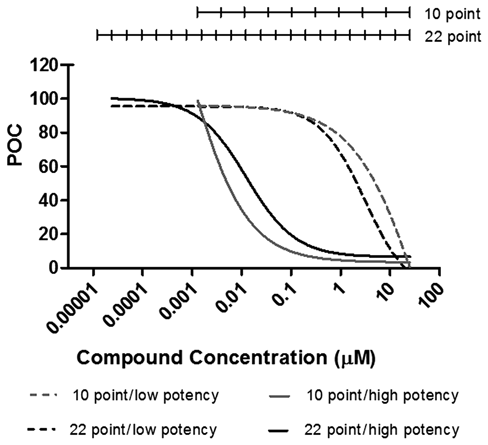
Compound concentration ranges differed for the AlphaScreen® and phosflow assays. Dose-response curves from 2 representative small-molecule inhibitors that demonstrate low (22-point IC50 = 0.013 µM) or high potency (22-point IC50 = 3.09 µM) in either the 10-point (gray) or 22-point (black) dose-response curves. The range and distribution of the data points are represented by the hashed lines above the graph. POC, % of control.
Correlation between cell-based pY1604 ALK and proliferation assays
Compounds that inhibited pY1604 ALK phosphorylation in both the AlphaScreen® and phosflow assays with IC50 < 1 µM (n = 34) were then further analyzed for inhibitory effects on the proliferation of an NPM-ALK-driven cell line (Karpas-299). Correlations between compound potency as measured in the cell-based pY1604 ALK assays and the proliferation assay were analyzed using a similar strategy as was conducted above, except that nonparametric Spearman’s correlation analysis was used because of the nonnormal distribution of this smaller data set. As shown in Figure 4 , the potency of a compound in either cell-based pY1604 ALK assay was highly predictive of its potency in the proliferation assay (AlphaScreen® assay Spearman’s r = 0.62, p < 0.0001; phosflow assay Spearman’s r = 0.47, p = 0.005).
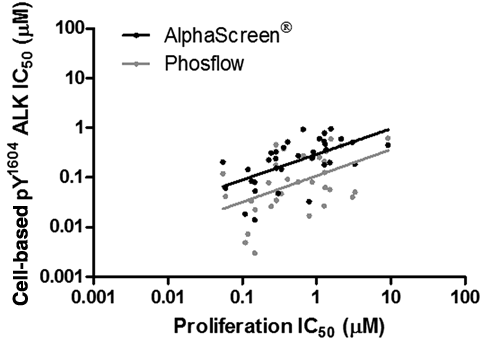
Correlation of IC50 values in the cell-based pY1604 ALK assays and the functional assay. For a subset of 34 compounds, the sigmoidal dose-response curves obtained from either the AlphaScreen® or phosflow assays were assessed for their ability to predict sensitivity in a Karpas-299 cell proliferation assay. Spearman’s correlation coefficient for the comparison between AlphaScreen® and proliferation assays was 0.62 (p < 0.0001). Spearman’s correlation coefficient for the comparison between phosflow and proliferation assays was 0.47 (p = 0.005).
Additional capabilities of the phosflow platform
The phosflow assay is significantly more labor intensive than the AlphaScreen® assay with multiple incubations and wash steps. However, an advantage of this assay is that it can be used to assess multiple analytes within a single cell and/or sample and can be easily adapted to broaden the scope of studies through inclusion of different ALK-dependent cell models. To illustrate these capabilities, we assessed the impact of the ALK inhibitor PF-2341066 on multiple signaling analytes in 3 different lymphoma cell line models. We monitored pY1604 ALK and total ALK, as well as the pS473 AKT and pY705 STAT3 analytes, which are reported to be activated in ALK-positive ALCLs. 12,22,28 Analysis of the untreated cell lines suggests that the 2 NPM-ALK-positive lymphoma models, Karpas-299 and Sup-M2, are positive for pY1604 ALK, pY705 STAT3, and pS473 AKT, in concordance with the literature ( Fig. 5A ). In contrast, the NPM-ALK-negative diffuse large B cell lymphoma cell line HT did not show activation of ALK or STAT3 but did show activation of AKT.
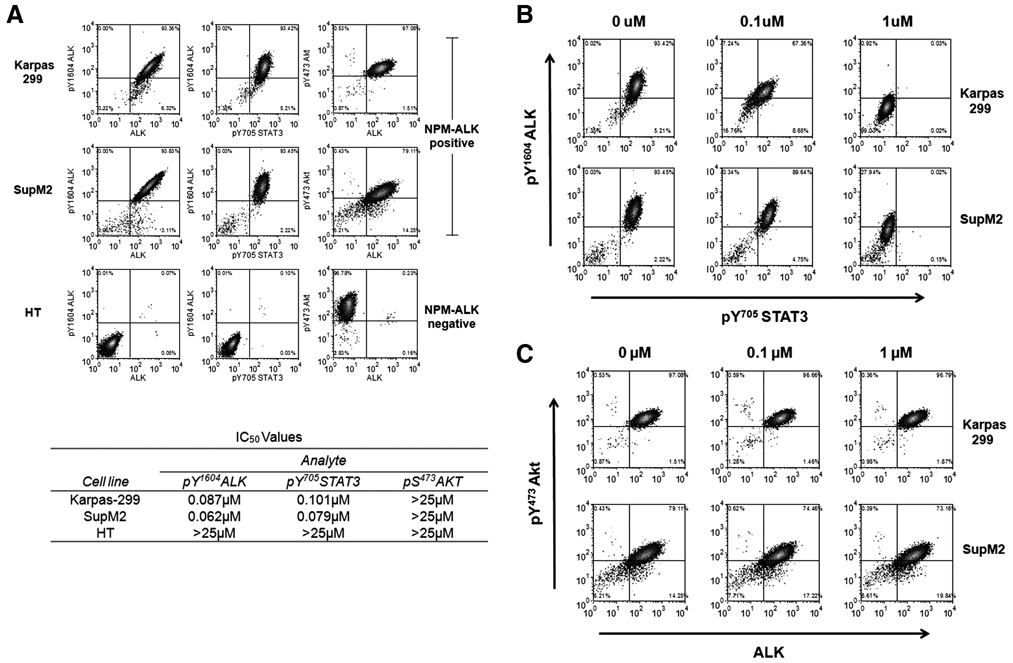
Dual-parameter flow cytometric analysis of the response to an ALK inhibitor. ALK-positive Karpas-299 and SupM2 cells and ALK-negative HT cells were stained concurrently with 2 analytes and treated with DMSO or 0.1 µM, or 1 µM of PF-2341066. IC50 values were calculated from change in median fluorescence intensity (MFI) for each analyte. (
Treatment of the 2 ALK-positive ALCL cell lines with PF-2341066 led to regulation of both pY1604 ALK and pY705 STAT3. These data, presented in Figure 5B , demonstrate the related inhibition of both analytes simultaneously. Compound IC50 values for pY1604 ALK and pY705 STAT3 were comparable in the ALK-dependent cell models. The pS473 AKT analyte was not modulated upon treatment with PF-2341066 ( Fig. 5C ). Not surprisingly, the ALK-negative HT cell line model failed to respond to treatment with PF-2341066 in any of the analytes assessed (data not shown).
The phosflow platform also enables analysis of heterogeneous samples, such as those obtained from patients. This raises the possibility that the phosflow pY1604 ALK assay could also be used as a biomarker for patient stratification or response to treatment. To model this scenario, mixed populations of NPM-ALK-positive (Karpas-299) and ALK-negative (HT) cells were treated with an ALK inhibitor, and the phosflow assay was used to detect responsive cells. Karpas-299 cells could be distinguished from ALK-negative HT cells based on total ALK or pY1604 ALK staining ( Fig. 6 ). IC50 values were calculated from the change in median fluorescence intensity of pY1604 ALK within the gated ALK-positive population. The IC50 values for each of the mixed cell populations (composed of 100%, 30%, or 15% ALK-positive cells) were comparable (IC50 range = 0.037-0.068 µM).
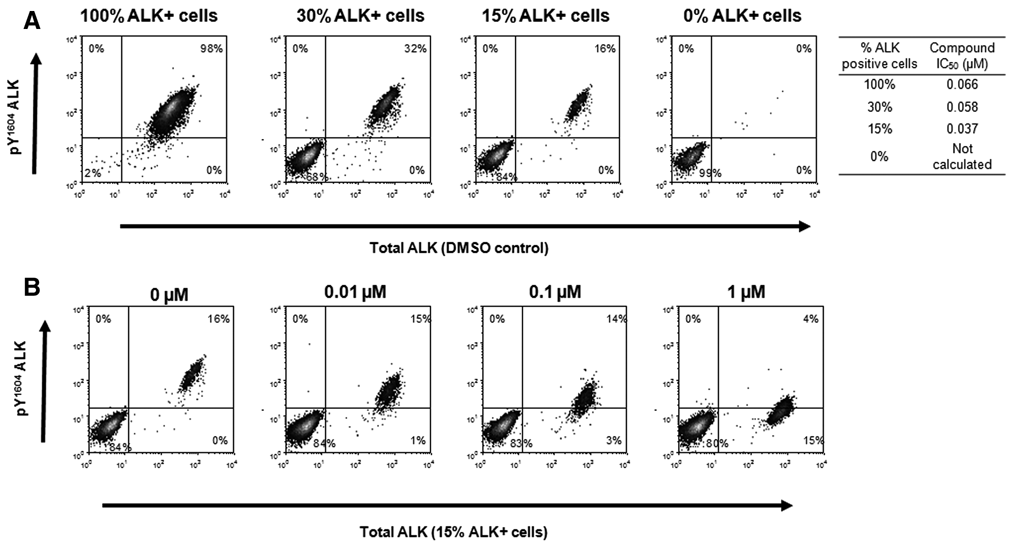
Detection of pY1604 ALK inhibition in heterogeneous cell populations. (
Discussion
Here we describe a suite of assays established to support the identification and development of a small-molecule ALK inhibitor. Our aim was to develop 2 cell-based pY1604 ALK assays that delivered comparable results yet were able to be deployed in different settings, including determining the cellular potency of a lead compound, understanding its selectivity, and interrogating its effects on inhibiting downstream effector proteins. To do so, we used the generated data set to compare and contrast the ability of the phosflow and AlphaScreen® assays to detect inhibition of phosphorylation of ALK at tyrosine 1604. We ran 151 compounds potent in the ALK enzyme assay (IC50 < 1 µM) in parallel through the 2 cell-based pY1604 ALK assays. The number of active compounds was similar in the AlphaScreen (128 active compounds) and phosflow assays (117 active compounds). We found that the compound IC50 values determined using either cell-based pY1604 ALK assay were highly correlated with IC50 values measured using a cell-free ALK enzyme assay, with Pearson’s correlation coefficients of 0.77 for the AlphaScreen® assay and 0.89 for the phosflow assay. As compounds with poor cell penetration may appear less potent in a cell-based assay than in an enzyme assay, some degree of nonconcordance between the intracellular pY1604 ALK assays and the enzyme assay was expected. Indeed, given this consideration, the strength of the correlation between these assays was particularly striking. Perhaps not surprisingly, compounds were on average more potent in the enzyme assay with the median potency shift between the enzyme and cell-based pY1604 ALK assays between 15- and 25-fold.
We also compared the potency of 106 compounds in the pY1604 ALK AlphaScreen® and phosflow assays. As shown in Table 1 , both assays had similar signal-to-background ratios and robust Z′ values. IC50 value comparisons indicated that compound potencies in the 2 assays were highly correlated with a Pearson’s correlation coefficient of 0.78. For 85 of 106 compounds (80%), IC50 values were within 5-fold of one another and were classified as concordant between assays. To further characterize the features of compounds whose IC50 values differed in the cell-based assays, compounds with a potency difference of greater than 5-fold between the AlphaScreen® and phosflow assays were assessed for their structural relatedness. This analysis failed to identify any common features unique to these compounds that might account for the difference in activity. Furthermore, this analysis also illustrated that the magnitude of the fold change between the cell-based assays had no relationship with compound potency (data not shown). This suggests the absence of any source of systematic bias in either assay.
A subset of compounds generated discrepant results between the AlphaScreen® and phosflow assays. This included compounds with IC50 values that differed by more than 5-fold between the assays as well as those that were active in only 1 assay. Twenty-nine compounds generated IC50 values in only 1 of the 2 pY1604 ALK cell-based assays because of an unknown mechanism (i.e., nonbiotin mimetic). Within this group of compounds, only 5 were identified as having a potency of less than 5 µM. As such, the frequency with which either assay failed to identify a potent compound was less than 3% of the total number of compounds assessed.
Compounds with potencies near either end of the concentration range tested may have generated nonconcordant data because of differences in plate format between the 2 assays. In this study, the phosflow assay was performed using a 10-point dose-response curve (0.001-25 µM), whereas the AlphaScreen® assay was performed using a 22-point dose response curve (0.00001-25 µM). This basic difference enabled a lower limit of detection for the AlphaScreen® assay relative to the phosflow assay. The AlphaScreen® assay not only spanned a larger dose range but also included more closely spaced points. As a result, the AlphaScreen® assay more readily generated a sigmoidal dose-response curve for compounds with particularly low or high potencies. This increased resolution at the extreme ends of the dose-response range in the AlphaScreen® assay may explain why several weakly and highly potent compounds generated IC50 values in this assay but not in the phosflow assay.
We also identified a number of compounds that interacted nonspecifically with assay components, influencing the correlation between the assays. Some compounds were flagged because of structural resemblance to biotin. It is suspected that these biotin-mimetic structures could have presented as false positives because they interfered with the AlphaScreen® detection fluorophores that use a biotin-streptavidin interaction to link the antibody to the donor beads. It has been shown that such compounds can yield false-positive results in the AlphaScreen® assay. 29 We therefore ran all compounds in a parallel lysate-free version of the assay. This iteration of the assay revealed that the suspect compounds were capable of producing an anomalous signal in the absence of the ALK enzyme (data not shown). As expected, these biotin-mimetic compounds were not active in the phosflow. This ability to identify false positives illustrates a key benefit of having an orthogonal assay.
As constitutive ALK activation is known to result in deregulated cell growth, we chose a proliferation assay to evaluate the functional effect of ALK inhibition in NPM-ALK-driven Karpas-299 cells. 30 The Spearman’s correlation coefficient comparing a compound’s IC50 value in the cell-based pY1604 ALK assay and the proliferation assay was 0.62 for the AlphaScreen® assay and 0.47 for the phosflow assay. Differences in compound potency between these assays could result from a number of factors, including off-target activities that read out in the proliferation assay while going undetected in the pY1604 ALK assays. Alternatively, compounds with different binding modes or mechanisms of action might inhibit pY1604 ALK phosphorylation to a similar degree in the pY1604 ALK assay but elicit different functional effects in proliferating cells. The significant correlation in compound activity across these assays, despite many sources of theoretical variation, provided us with confidence that the data generated from the 2 cell-based pY1604 ALK assays could reliably predict the functional response to ALK inhibition in a cellular context and that they could thus support a drug discovery campaign.
Although both cell-based pY1604 ALK assays were equivalently able to assess the potency of small-molecule ALK inhibitors, the AlphaScreen® assay had several features that made it more suitable for supporting the SAR campaign described here. The AlphaScreen® assay can often be run in a homogeneous manner in a 384-well plate format. As a result, it is amenable to HTS and can readily accommodate the level of assay support to needed to drive a medicinal chemistry effort. Phosflow assays are more labor intensive and have longer read times, which result in a reduced capacity compared to AlphaScreen® assays. However, the phosflow assay has additional capabilities that might make it preferable in certain circumstances. Flow cytometry not only is sensitive and quantitative but also enables the differential evaluation of multiple intracellular signaling events directly in complex primary samples. 31 This is particularly useful to study intracellular signaling pathways in their most biologically relevant context. In this study, the responses of pY1604 ALK as well as pY705 STAT3 and pS473 AKT, 2 downstream signaling analytes, were measured concurrently in 1 ALK-negative and 2 ALK-positive cell models, enabling a more complete understanding of the influence of ALK activity on signaling pathways in these cells. Treatment of the 2 ALK-positive ALCL cell lines with PF-2341066 led to inhibition of both pY1604 ALK and pY705 STAT3 simultaneously, supporting the biological association of these 2 readouts ( Fig. 5B ). Comparable compound IC50 values in these models for inhibition of both pY1604 ALK and pY705 STAT3 provide further evidence of the on-mechanism activity of PF-2341066. Interestingly, despite the basal activation of pS473 AKT, this analyte failed to show dose-dependent inhibition upon treatment with PF-2341066 ( Fig. 5C ), although we observed minor changes in the pS473 AKT–positive population. This suggests that the AKT activation observed in these models may not be ALK dependent or, alternatively, may not occur within the kinetics as assessed in the current investigation. These contrasting results illustrate how target biology can be investigated using the phosflow platform. More broadly, these studies serve to reinforce the importance of ALK in ALCL lymphoma models and its associated regulation of STAT3 phosphorylation. Thus, although we assessed the use of phosflow to support a screening campaign, the greater utility of this assay may be in facilitating the further development of an ALK therapeutic by characterizing the on-mechanism activity of lead molecules.
Levels of ALK expression and activation are very high in ALCL cell lines such as Karpas-299 because of the constitutive activation of the fusion protein. 13,18 However, levels of ALK expression and phosphorylation are extremely varied across the wide range of tumor types and cell lines in which ALK has been reported. 32-35 Even within ALK-positive samples, high levels of heterogeneity have been reported in both primary samples and cell lines. 16 In these scenarios, when changes in ALK activation status need to be detected against a background of predominantly ALK-negative cells, flow cytometry offers a powerful platform for analysis. In our study, the phosflow platform was able to detect modulation of the pY1604 ALK signal with precision in populations containing as few as 15% ALK-positive tumor cells. The phosflow analyses described here suggest the feasibility of using either the pY1604 ALK or pY705 STAT3 analyte in primary samples as a biomarker for patient stratification or response to treatment.
In summary, both the AlphaScreen® and phosflow assays are robust and highly sensitive, enabling the assessment of pharmacologic modulation of pY1604 ALK. These 2 platforms were highly comparable in their abilities to detect pY1604 ALK, yet with different utilities. The AlphaScreen® assay was preferred for HTS applications, whereas the phosflow assay has the potential to serve as a bridging assay that could support both initial assay optimization as well as the detailed assessment of a therapeutic lead.
Footnotes
Acknowledgements
We gratefully acknowledge the expert technical assistance and guidance of Dr. Linda Epstein, Mr. Chris Ilch, Dr. James Mann, and Mr. Steve Schneider.