
Abstract
The cellular response to DNA damage is emerging as a promising target for cancer therapy. In the present study, the authors exploited the relationship between the level of the phosphorylated form of histone H2AX (γH2AX) and the extent of DNA damage and developed a quantitative, cell-based, high-content screening system for measuring the DNA damage response (DDR). In this system, the authors quantified the level of γH2AX by measuring DNA damage–induced γH2AX nuclear foci using an automated cell imager. They found that the total area of γH2AX foci per cell exhibited a good correlation with the concentration of DNA damage–inducing agents, including etoposide. The effects of 2 well-known inhibitors of DNA damage could be quantified using this system, suggesting the suitability of the γH2AX-foci quantification method for large-scale screening applications. This was confirmed by using this method to screen a chemical library; the resulting “hits” included compounds that inhibited early signaling events in DDR, as well those that inhibited subsequent DNA damage repair processes. Overall, this γH2AX foci-measuring system may be an effective screening method for identifying DNA damage response inhibitors that could eventually be used to develop novel anticancer drugs.
Keywords
Introduction
I
DDR, however, also has a special meaning in the context of cancer therapy. Radiotherapy and conventional chemotherapy rely primarily on DNA damage–induced cell death. Thus, efficient activation of protective aspects of DDR, such as cell cycle checkpoints and DNA damage repair, may protect tumor cells from the DNA damage caused by anticancer agents and thereby reduce the efficacy of cancer therapies. 1,2 Many agents that abrogate DDR in combination with DNA-damaging anticancer agents have been undertaken to improve the efficacy of cancer therapy. 3,4 In addition to these sensitization strategies, novel approaches targeting the DDR of cancer cells have been proposed. 5,6 These approaches take advantage of intrinsic defects in DDR pathways in cancer cells. Tumor cells are often deficient in 1 or more DNA repair pathways and tend to be highly dependent on the remaining intact DNA repair pathways for survival. Thus, specific inhibition of intact DNA repair pathways may selectively kill tumor cells. In contrast, normal cells with a full repertoire of intact DNA damage repair pathways can survive the inhibition of 1 pathway. Thus, DDR is considered a promising target for cancer therapy. Anticancer strategies using small molecules that inhibit cellular DDR, including DNA repair and cell cycle checkpoint activation, have been proposed. 2,7
DNA double-strand breaks (DSBs) are the most severe form of DNA damage. One of the earliest events during cellular responses to DNA DSBs is phosphorylation of the S139 residue of the histone H2 variant H2AX by ataxia telangiectasia mutated (ATM) kinase at the sites of DSBs. 8 γH2AX, the phosphorylated form of H2AX, can be easily visualized as discrete nuclear foci after immunofluorescence staining. Because γH2AX is dephosphorylated on completion of DNA DSB repair, γH2AX foci can be used as markers for DNA DSBs and DDR. 9,10 Although it is possible to count γH2AX foci under a fluorescence microscope, this manual quantification method is difficult to apply to large-scale screening. Flow cytometric analysis has been considered an alternative method for quantifying γH2AX but was found to be less sensitive than immunofluorescence microscopy. 11
Using γH2AX foci as a marker in large-scale screens for DDR-inhibiting chemicals thus requires the development of a quantitative, automated method for analyzing immunofluorescence microscopic images. A high-content cell image analysis system might be suitable for this purpose. Such a system should be able to quantitatively and automatically analyze high-resolution images acquired by an automated fluorescence microscope platform. 12 In the present study, we validated a high-content cell image analysis method that uses automated quantification of DNA damage–induced γH2AX foci as a marker to monitor DDR in cancer cells. In addition, we applied this method to the screening of a large-scale chemical library and verified its potential usefulness as a high-content screening method.
Materials and Methods
Cell lines and cell culture
U20S osteosarcoma cells were cultured in Dulbecco’s modified Eagle’s medium (DMEM) supplemented with 10% fetal bovine serum (FBS; HyClone, Logan, UT), 100 U/mL penicillin, 100 µg/mL streptomycin, and 2 mM glutamine at 37 °C in a 5% CO2 atmosphere.
Materials
Doxorubicin (DOX), cisplatin, KU55933, and NU7026 were purchased from Calbiochem (San Diego, CA). Other chemicals, including etoposide (ETO), camptothecin (CPT), and bleomycin, were purchased from Sigma-Aldrich (St. Louis, MO).
Immunofluorescence
One day before treatment, cells were seeded at 1 × 10⁴/well in black 96-well plates with clear flat bottoms (Costar; Corning, New York, NY). After treatment, the cells were rinsed with phosphate-buffered saline (PBS), fixed with 3.7% formaldehyde in PBS for 20 min at room temperature, and permeabilized. Nonspecific binding was blocked by incubating the cells with 1% bovine serum albumin (BSA) and 0.02% Triton X-100 in PBS for 30 min at room temperature. The cells were sequentially incubated with anti-γH2AX antibody (1:500; Bethyl, Montgomery, TX) for 3 h at room temperature, Alexa Fluor 488–conjugated antirabbit IgG antibody (1:500; Molecular Probes, Carlsbad, CA) for 1 h, and Hoechst 33342 (10 µg/mL; Molecular Probes) for 10 min. The cells were washed 3 times with 0.02% Triton X-100 in PBS for 10 min each time and were visualized using an IN Cell Analyzer 1000 (GE Healthcare, Piscataway, NJ).
Acquisition and analysis of images
The number and the total area of γH2AX foci were measured using an IN Cell Analyzer 1000. Images of stained cells were acquired from the automated fluorescence microscope platform of the IN Cell Analyzer using a 20× objective lens. Images from more than 5 fields per well were collected to obtain data on 200 to 400 cells. The filter sets, D360/40 excitation-HQ535/50 emission and D475/20 excitation-HQ 535/20 emission, were used for detection of Hoechst 33342 and Alexa Fluor 488 signals, respectively. The acquired images were analyzed using the Multi Target Analysis (MTA) module of the IN Cell Analyzer 1000 Workstation software (v3.4) according to the manufacturer’s instructions.
Western blotting
Whole-cell lysates were prepared by suspending 2 × 10⁶ cells in 100 µL of lysis buffer (50 mM Tris [pH 8.0], 150 mM NaCl, 1% Triton X-100, 0.5% deoxycholate, 0.1% sodium dodecyl sulfate [SDS], 2 mM phenylmethylsulfonyl fluoride [PMSF], 1 mM Na3VO4, and 1× protease inhibitor; Roche, Basel, Switzerland). The cell lysates were kept on ice for 10 min, sonicated briefly, and cleared by centrifugation at 15,000 g for 10 min at 4 °C. Equal amounts of lysate protein were separated on 15% SDS–polyacrylamide gel electrophoresis (PAGE) and transferred to enhanced chemiluminescence (ECL) nitrocellulose membranes (GE Healthcare). After blocking with 5% skim milk in TBST (20 mM Tris [pH 7.5], 135 mM NaCl, and 0.05% Tween 20), the membranes were incubated with anti-γH2AX (1:500; Bethyl) or antiactin (1:2000; Sigma) antibodies. The membranes were washed, incubated with horseradish peroxidase–conjugated antirabbit IgG (1:5000; Vector, Burlingame, CA), and again washed, followed by ECL detection (GE Healthcare).
Chemical library screening
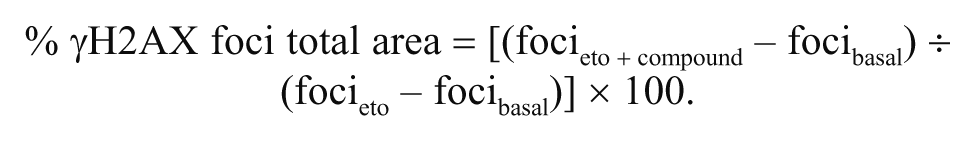
A chemical library of 6800 small molecules, including natural compounds, derivatives, and newly synthesized chemicals, was kindly provided by Korea Chemical Bank (Daejeon, Korea). Each chemical was dissolved in DMSO at the concentration of 5 mM. Each compound was added to cells grown on 96-well plates at the final concentration of 1 µM. Following the pretreatment for 1 h, etoposide was added into growth medium at the final concentration of 10 µM. After 1-h exposure, the cells were incubated in etoposide-free but chemical-containing medium for 3 h. After measuring the γH2AX levels using IN Cell Analyzer 1000, % γH2AX foci total area was calculated as follows:
Results and Discussion
Total area of γH2AX foci is a useful metric for quantifying the extent of DNA damage
γH2AX focus formation has been reported to be dependent on DNA DSBs. 9,10 We thus first sought to determine whether the extent of γH2AX foci formation induced by DNA-damaging agents was correlated with the DDR and could be detected using an automated cell imager. Accordingly, we treated U20S cells with the DNA-damaging drugs etoposide, camptothecin, bleomycin, doxorubicin, cisplatin, or 5-fluorouracil (5-FU) for 1 h and, after fixing and staining with anti-γH2AX and Alexa Fluor 488–conjugated secondary antibodies, collected images of the cells automatically using an IN Cell Analyzer 1000 (GE Healthcare) automated cell imager. Images were analyzed using the MTA module. Nuclei stained with Hoechst 33342 dye were considered to represent single cells, and punctate green fluorescence signals >0.3 and <3 µm2 in size were considered foci. We measured the number and total area of γH2AX foci in each treated cell and plotted the values versus the concentration of DNA-damaging compounds. As shown in Figure 1 , both the number ( Fig. 1A ) and total area ( Fig. 1B ) of foci per cell correlated with drug concentration. Cisplatin and 5-FU do not directly induce DNA DSBs; thus, neither compound induced γH2AX phosphorylation, in agreement with previous reports. 13,14 Interestingly, up to 5 foci were present in some untreated cells under basal conditions, as reported previously. 10,15 Upon treatment with 50 µM etoposide, the focus area per cell increased 63.7-fold compared with untreated controls (from 1.08 ± 0.12 to 69.14 ± 1.77), whereas the number of foci per cell increased only 19.8-fold (from 0.78 ± 0.04 to 15.49 ± 2.44). Thus, plotting the total area of foci versus the concentration of DNA-damaging compounds significantly improved the signal-to-noise ratio. Moreover, in the case of etoposide, which is a representative DNA-damaging drug, the total area of γH2AX foci showed a clearer dose dependency pattern than did the number of foci. We therefore used the total area of foci per cell as a parameter for measuring DNA damage–induced nuclear focus formation in subsequent experiments.
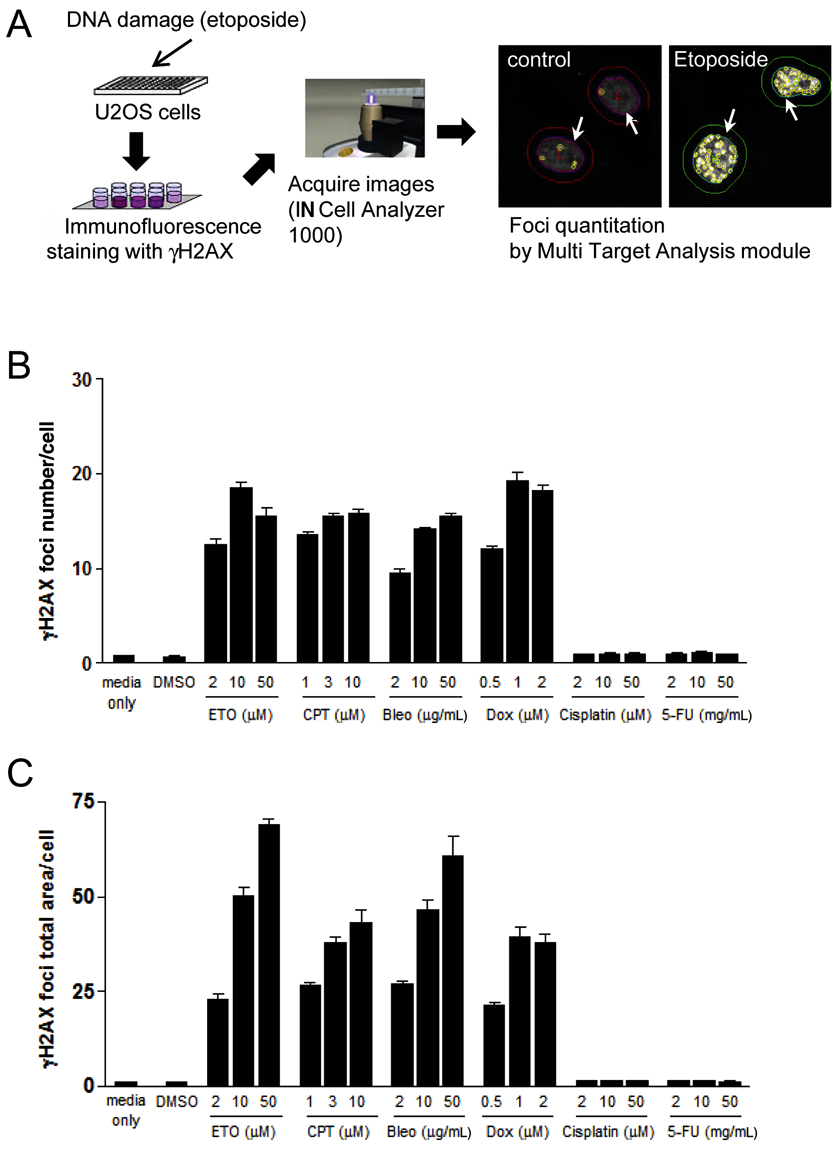
Measurement of γH2AX foci formation using high-content screening. (
The effects of inhibitors of early signaling events in DDR can be quantified by analyzing the total area of γH2AX foci
We next assessed whether this automated quantitative method was capable of evaluating the efficacy of known inhibitors of DDR. We used wortmannin and KU55933 as representative DDR inhibitors; both of these agents inhibit ATM kinase, an enzyme that phosphorylates several protein regulators, including H2AX, and plays a key role in signal transduction pathways activated in response to DNA DSBs. 4,8 We treated cells with wortmannin or KU55933 for 1 h and then added 10 µM etoposide or 3 µM camptothecin. After incubating for an additional 1 h, we fixed cells and analyzed the total area of γH2AX foci. As expected, pretreatment of cells with wortmannin or KU55933 decreased γH2AX focus formation in a concentration-dependent manner ( Fig. 2 ). These results demonstrate that a γH2AX-foci analysis using a high-content image analysis instrument can be used to identify inhibitors of signal transduction pathways activated early after DNA damage.
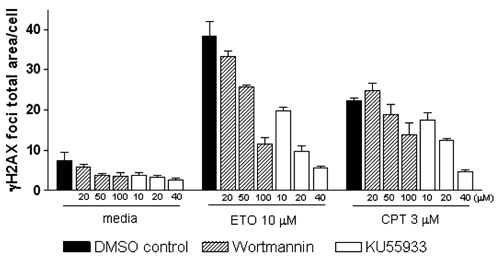
Effects of chemical inhibitors on γH2AX focus formation. U20S cells were treated with 10 µM etoposide (ETO) or 3 µM camptothecin (CPT) in medium containing DMSO, wortmannin (PI3K inhibitor), or KU55933 (ATM inhibitor) at the indicated concentrations for 1 h, followed by immunostaining and analysis. Both wortmannin and KU55933 inhibited γH2AX foci induced by etoposide and CPT in a concentration-dependent manner. DMSO (vehicle) had no effect on γH2AX focus formation. Error bars represent the SEM from 3 wells (~200-400 cells per well).
The effects of inhibitors of later DNA repair events in DDR can also be measured by analyzing the total area of γH2AX foci
Next, we investigated whether measuring γH2AX foci using a high-content analysis instrument is suitable for identifying chemicals that inhibit DNA damage repair machinery ( Fig. 3A ). γH2AX functions as DNA damage signal, recruiting DNA damage repair proteins to the sites of DNA DSBs. Two mechanisms are primarily responsible for repairing DNA DSBs: homologous recombination repair and nonhomologous end-joining. It is well established that γH2AX levels decrease after completion of DNA damage repair through these mechanisms. 9,10 Therefore, we reasoned that γH2AX could be useful as a marker of the extent of DNA damage repair; thus, by monitoring and quantifying the residual γH2AX foci at a later phase after DNA damage, we might be able to identify chemicals that inhibit the DNA damage repair process. NU7026 is a specific inhibitor of DNA-dependent protein kinase (DNA-PK), which is a key component of the nonhomologous end-joining mechanism that repairs DNA DSBs. We monitored the kinetics of γH2AX focus resolution after cotreatment with NU7026. In the absence of NU7026 cotreatment, the extent of γH2AX focus formation was maximal 1 h after treatment with 10 µM etoposide and gradually declined thereafter ( Fig. 3B ). However, the decline was reduced in the presence of NU7026. Cotreatment of cells with KU55933 and etoposide resulted in the abrogation of γH2AX focus formation, as expected. The level of γH2AX protein, determined by Western blotting ( Fig. 3C ), was well correlated with the total area of γH2AX foci, verifying the reliability of γH2AX focus analysis using the IN Cell Analyzer. These results confirm the potential utility of high-content image analysis of DNA damage–induced γH2AX foci for identifying chemicals that act at later phases of the DDR to prevent the proper functioning of DNA damage repair machinery. Because the inhibitory effects of NU7026 and KU55933 were maximal 4 h after etoposide treatment, we used this time point for large-scale chemical screening.
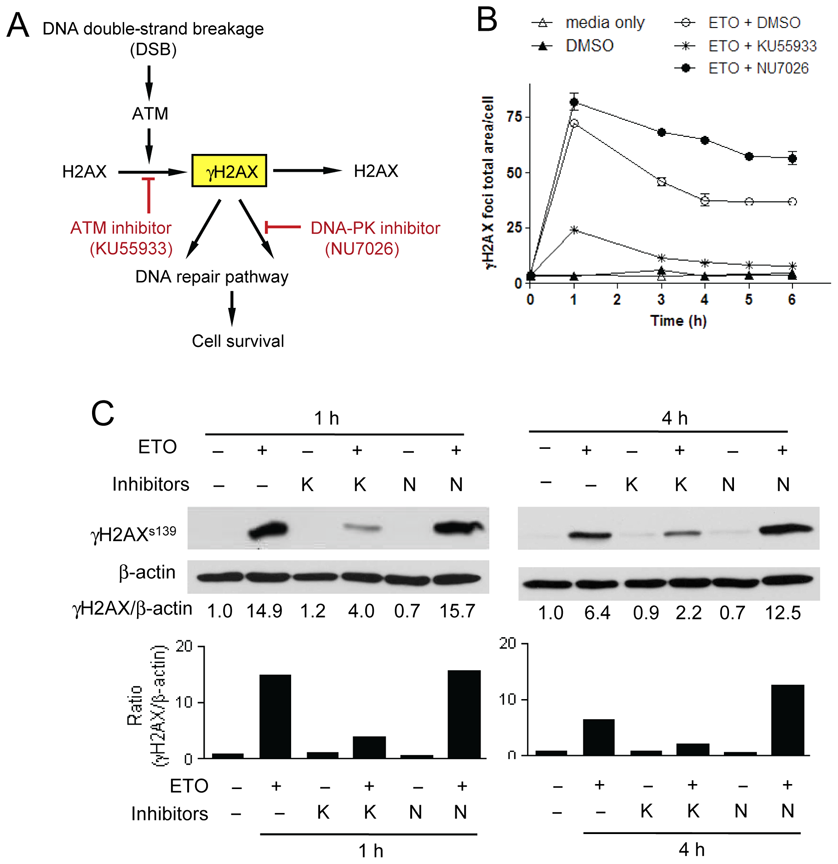
Validation of the assay system using DNA damage response (DDR) inhibitors. (
Analysis of the total area of γH2AX foci is applicable to the large-scale screening of chemical libraries for inhibitors of DDR
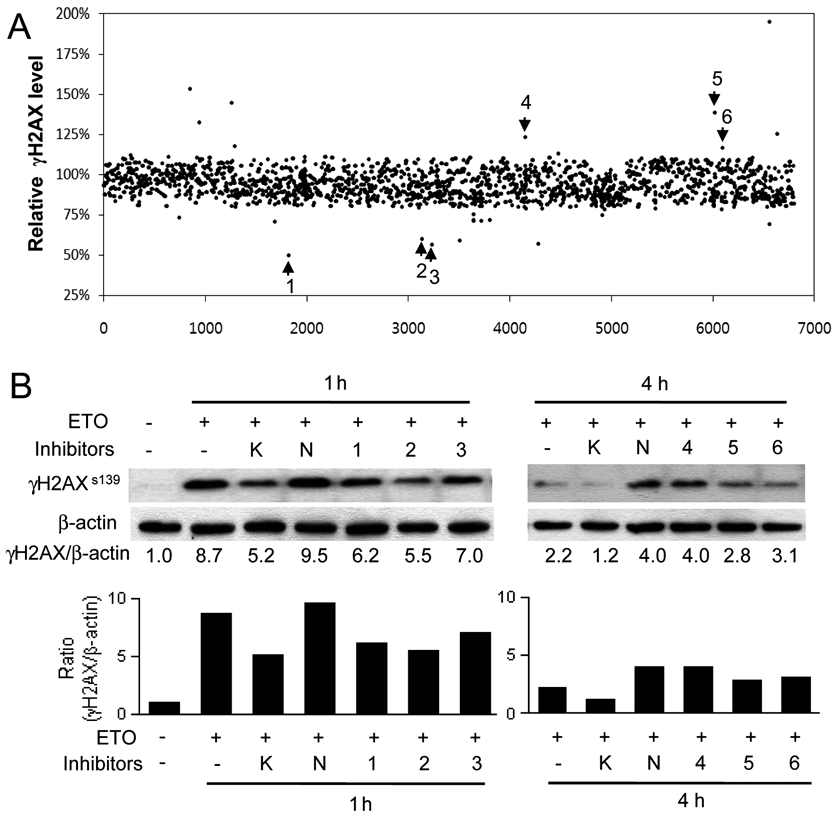
A chemical library consisting of 6800 representative chemicals was used to test this high-content image analysis system as a large-scale screening tool. After pretreating cells for 1 h with 1 µM of each test chemical, etoposide was added (final concentration, 10 µM), and cells were incubated for an additional 1 h. The media were then replaced with etoposide-free media containing test compounds, and cells were incubated for an additional 3 h. Each screening plate included media-only negative controls, etoposide-only positive controls, and chemical controls for inhibition of early signal transduction events (KU55933) and later DNA damage repair processes (NU7026). To access the significance of the screen, we calculated the Z′ factor for the assay, defined as 1 – (3[SD of positive controls + SD of negative controls]/[mean of positive controls – mean of negative controls]). The Z′ factor of the assay was 0.692, where a Z′ factor of 1 is ideal and a Z′ factor greater than 0.5 denotes excellent screening quality. 16 Each compound was screened in quadruplicate on separate plates, and the percentage of the total γH2AX-foci area compared with samples treated with etoposide only was calculated for each compound. As shown in Figure 4A , this screening procedure generated several “hits,” identifying compounds that reduced the percentage of the total γH2AX-foci area. These compounds may have inhibitory effects on early phases of the DNA damage signaling pathway. This hypothesis was confirmed by Western blotting results, which clearly showed that pretreatment of cells with selected compounds (denoted 1, 2, and 3) decreased γH2AX levels induced by 1-h treatment with etoposide ( Fig. 4B , left panels). The extent of inhibition was similar to that seen with the ATM inhibitor KU55933.
Chemical library screening. (
The screen also identified several chemicals that increased total γH2AX-foci area compared with etoposide-only controls, an effect that was confirmed by Western blotting for γH2AX ( Fig. 4B , right panels). Samples pretreated with representative chemicals 4, 5, and 6 showed greater γH2AX protein levels than those treated only with etoposide for 4 h, indicating that these chemicals may have inhibitory activity toward the DNA damage repair pathway. Overall, using an automated approach to quantitatively analyze DNA damage–induced γH2AX focus formation, we were able to identify several chemical compounds that might affect DDR, including those that inhibit early signal transduction events and those that act on subsequent DNA damage repair processes.
In the present study, we have described an assay system that can be used to quantitatively analyze DDR. This system combines immunofluorescence and high-content image analysis of DNA damage–induced γH2AX foci. An analysis of 2 parameters—the number and total area of γH2AX foci—showed that total foci area per cell was a more sensitive parameter for representing the degree of focus formation than was total number of foci per cell. Using KU55933 and NU7026, known inhibitors of DNA damage, we validated the utility of this assay system for identifying chemicals that inhibit early signal transduction pathways and later DNA damage repair processes that are activated in response to DNA damage. We screened a chemical library using this method and identified candidate chemicals that inhibit DDR. Although each of these compounds will require additional mechanistic study, our results demonstrate that this assay system can be a good starting point for the development of new anticancer drugs that target the DDR of cancer cells.
Footnotes
Acknowledgements
We thank Ms. Mi-ae Kim for technical support and the Korea Chemical Bank for providing the chemical library. This work was supported by the National Cancer Center grants 0710251 and 0710252.